
Abstract
Human fetal mesenchymal stem cells can be isolated from the amniotic membrane (AM-hMSCs) by enzymatic digestion. The biological properties of this cell population have been characterized; however, few studies have focused on the presence of stem cell subpopulations and their differentiation potential. The aim of the present study was to isolate homogeneous AM-hMSC subpopulations based on the coexpression of surface markers. In addition, we aimed to characterize stem cell subpopulations through the detection of typical stem cell markers and its differentiation potential. In this study, fluorescence-activated cell sorting (FACS) was used to positively select for the surface markers CD44, CD73, and CD105. Two subpopulations were isolated: CD44+/CD73+/CD105+ (CD105+), and CD44+/CD73+/CD105− (CD105−). To characterize the cell subpopulations, the expression of pluripotency-associated markers was analyzed by reverse transcriptase–polymerase chain reaction and immunofluorescence. Our results showed positive expression of SOX2, SOX3, PAX6, OCT3/4, and NANOG in the CD105+ and CD105− cell subpopulations. In contrast, we did not detect expression of SSEA4 or FOXD3 in either subpopulation. Immunophenotypes, such as mesenchymal and hematopoietic markers, were studied by FACS analyses. Our data revealed the expression of the CD49a, CD49d, CD29, integrin α9β1, CD44, CD73, and CD105 antigens in both subpopulations. In contrast, CD90, CD45, CD34, CD14, and HLA-DR expression was not detected. The ability of both subpopulations to differentiate into osteoblasts, adipocytes, and chondrocytes was evidenced using Alizarin red, Oil-Red, and Alcian blue staining, respectively. Furthermore, neuronal differentiation was demonstrated by the expression of GFAP and NEURO-D. Interestingly, we observed a dissimilar osteoblastic differentiation potential between the subpopulations. CD105− cells showed stronger expression of secreted protein acidic and rich in cysteine (SPARC) and osteonectin, which was associated with more effective calcium deposition, than CD105+ cells. In conclusion, we described a systematic method for the isolation of hMSCs that was highly reproducible and generated homogeneous cultures for osteoblast differentiation with an efficient capacity for mineralization.
Introduction
Human placenta plays a fundamental and essential role in fetal development, nutrition, and immunological tolerance, and represents a stem cell reserve [17 –19]. Four regions in the placental tissue can be distinguished: amniotic epithelia, amniotic mesenchyma, chorionic mesenchyma, and chorionic trophoblast [17 –20]. Remarkably, each region of this tissue contains stem cells that display different differentiation capabilities [21 –23]. Although precursor cells are not scarce in these regions, the recovery and purification of these cells require complicated methods. In addition, cell cultures that are obtained by nonselective methods are highly heterogeneous. Currently, research and the resulting comparisons have been hampered by the above-mentioned problems [24 –28]. Moreover, several methods have been described for the isolation of MSCs, and these methods include those based on their ability to adhere to plastic surfaces, frequent medium changes, and enzyme treatment, or more complex methods that are based on the use of flow cytometry and cell sorting by negative or positive selection [29 –34]. Nonetheless, Schugar demonstrated that the method of isolation and processing influences the type of stem cell population that is recovered. These authors described different isolation methods from the entire umbilical cord and showed that MSCs with different phenotypes can be recovered from this tissue [35].
To overcome these circumstances, efforts based on the use of surface antigen markers [30,31,36] had been made that attempted to guarantee a homogenous population of MSCs.
The aim of the present study was to isolate highly homogeneous subpopulations of amniotic membrane human mesenchymal stem cells (AM-hMSCs) with efficient osteoblastic potential using fluorescence-activated cell sorting (FACS) to positively select for surface markers.
Materials and Methods
Isolation of stem cells from the human amniotic membrane
Caesarean-delivered term placentas (n=30) were collected from healthy donor mothers. This research was approved by the Ethics Committee of the Dr. Manuel Gea González General Hospital, and each donor gave her consent. The amniotic membrane from each patient was mechanically separated from the underlying chorion by blunt dissection. For cell isolation, the section near the umbilical cord was selected, and a 10×10-cm membrane section was chopped and rinsed with phosphate-buffered saline (PBS) that was supplemented with penicillin and streptomycin (100 U/mL penicillin, 100 μg/mL streptomycin, and 0.25 μg/mL amphotericin B; Sigma) to remove traces of blood. The fragments were submitted to enzymatic digestion in 2 stages: (1) incubation with 0.125% trypsin/0.5 mM EDTA solution (ICN Biomedicals) at 37°C for 30 min; and (2) treatment with 100 U/mL collagenase type II and 3 mM calcium chloride in the Dulbecco's Modified Eagle's Medium (DMEM) for 2 h at 37°C, which was followed by washing with PBS. Then, the cell suspension was filtered, and the cells were seeded in 25-cm2 flasks in the DMEM (GIBCO) containing 10% fetal bovine serum (FBS; GIBCO) and 100 U/mL penicillin, 100 μg/mL streptomycin, and 0.25 μg/mL amphotericin B. Cell cultures were incubated at 37°C in a 5% CO2 atmosphere, and nonadherent cells were eliminated after 5–7 days by removing the medium every 3 days. When the culture reached 90% confluence, the cells were recovered using 0.125% trypsin/EDTA and further seeded at 5×10⁴ cells/cm2 to expand them.
Flow cytometry and cell sorting
After detachment using 0.125% trypsin/EDTA, AM-hMSCs were washed once with 0.2% BSA and 0.1% NaN3-PBS. This cell suspension was stained with the following antibodies: phycoerythrin (PE)-conjugated CD73 (BioLegend), biotin-conjugated CD44 (Serotec), followed by PercP-Cy5.5-conjugated streptavidin, FITC-conjugated CD90 (Santa Cruz Biotechnology), PE-conjugated CD34 (BD, Biosciences), RPE-conjugated CD45 (BD, Biosciences), RPE-conjugated CD14 (Serotec), FITC-conjugated anti-α9β1 (Santa Cruz Biotechnology), FITC-conjugated CD49a (Santa Cruz Biotechnology), FITC-conjugated CD49d (Santa Cruz Biotechnology), FITC-conjugated CD29 (Santa Cruz Biotechnology), PerCP/Cy5.5-conjugated HLA-DR (BioLegend), PE-conjugated HLA-ABC (BioLegend), and APC-conjugated CD105 (BioLegend). The proper isotype controls for each antibody were used to remove any nonspecific binding. Cells were incubated for 20 min at room temperature in the dark and then fixed and analyzed using a BD FACSAria Flow Cytometer and FlowJo Software (Tree Star, Inc.). For sorting, single AM-hMSC suspensions (6–8×10⁶) were prepared by staining with human PE-conjugated CD73 (BioLegend), biotin-conjugated CD44 (Serotec), followed by PercP-Cy5.5-conjugated streptavidin and APC-conjugated CD105 (BioLegend). Dead cells, cell debris, doublets, and aggregates were excluded by forward and side scattering and pulse-width gating, and isotype-matched controls were applied in parallel as controls. Sorted cells were expanded to obtain adequate cells for subsequent assays.
RNA extraction and reverse transcription–polymerase chain reaction
Total RNA was extracted from 0.5×10⁶ cells using TRIzol reagent (Invitrogen), and the RNA samples were then treated with deoxyribonuclease I (Amplification Grade Invitrogen). Single-stranded cDNA was synthesized using the ImProm Reverse Transcription System kit (Promega) according to the manufacturer's instructions, and the cDNA was stored at −20°C for later polymerase chain reaction (PCR) amplification reactions. For PCR amplification, the template (250 ng) was mixed with 10 mM of each dNTP, 1.5 mM MgCl2, 10 picomoles of each primer, and 0.5 U/μL Taq DNA polymerase (Promega). The reaction volume was then brought up to 25 μL with DEPC-treated water. The reaction was performed in a Maxy-Gene thermocycler with Iso-temp cover (Stuart Scientific), and PCR programs were performed according to primer specifications, as described in Table 1, and using the standard amplification scheme of initial denaturalization at 95°C for 5 min, followed by 30–35 cycles of 95°C for 30 s, a specific melting temperature for 30 s, 72°C for 30 s, and a final elongation at 72°C for 5 min. Amplification products were examined by electrophoresis in a 2% agarose gel that was stained with ethidium bromide and documented using an UV transilluminator. The TUBA1A gene was amplified as an internal control. The pixel density of each fragment and their ratios were determined using LabWorks 4.0 Image Acquisition and Analysis Software (UVP BioImaging Systems, UVP). The ratios represented the relative expression of each mRNA and were used for semiquantitative analysis.
Western blotting
For immunoblotting, the cells were rinsed with cooled PBS and then lysed at room temperature for 10 min in 1 mL of RIPA buffer (20 mM Tris–HCl, pH 7.5, 150 mM NaCl, 1 mM EGTA, 1% NP-40, 1% sodium deoxycholate, 2.5 mM sodium pyrophosphate, 1 mM β-glycerophosphate, 1 mM Na3VO4, and 1 μg/mL leupeptin) containing the Complete Protease Inhibitor™ (0.5 mM phenylmethylsulfonyl fluoride, 10 μg/mL leupeptin, 10 μg/mL aprotinin, 5 μg/mL pepstatin, 10 μg/mL soybean trypsin inhibitor, and 0.5 mM dithiothreitol; ROCHE, Molecular Biochemicals). After centrifugation for 20 min at 1,300 g at 4°C, the supernatant was stored at −20°C. Equal amounts of protein (20 μg) were run on 10% polyacrylamide SDS gels and transferred to a PVDF membrane (Millipore Corporation) in a transfer buffer (25 mM Tris, 192 mM glycine, and 10% methanol). The membranes were dried and blocked for 60 min at room temperature with TBST-1×[137 mM NaCl, 20 mM Tris, and 0.1% Tween-20 (pH 7.6)] containing 5% BSA (Sigma-Aldrich) and then incubated overnight at 4°C with rabbit anti-human GFAP (DAKO; 1:2,000), rabbit anti-human NEURO-D (DAKO; 1:1,000), or mouse anti-human actin (which was kindly donated by Dr. Manuel Hernandez; 1:2,000). After incubation, the membrane was washed 3 times in TBST-1×and incubated with horseradish peroxidase-conjugated goat anti-rabbit IgG or goat anti-mouse IgG antibody at a 1:8,500 dilution (Zymed), depending on the primary antibody that was used. The bound antibody was detected using ChemiLucent (Chemicon), which is based on the reaction of luminol–horse rabbit peroxidase. The light emission was detected using hyperfilm-enhanced chemiluminescence (GE Healthcare).
Indirect immunofluorescence
Cells were seeded on coverslips at 2×10³ cells/cm2 and induced with an osteogenic medium, which contained the DMEM (GIBCO) that was supplemented with 10% FBS, 10 mM β-glycerophosphate, 0.25 mM ascorbic acid, and 10−8 M dexamethasone (Sigma-Aldrich). Indirect immunofluorescence was performed after induction. To maintain the integrity of their cytoskeletons, the cells were rinsed at 37°C with a cytoskeleton buffer (CB; 10 mM MES pH 6.1, 138 mM KCl, 3 mM MgCl2, 2 mM EGTA, and 0.32 M Sucrose) and then fixed with 3% formaldehyde-CB for 15 min at 37°C. The cells were then washed with CB and permeabilized with 0.1% Triton X-100 CB (Sigma-Aldrich) for 5 min. Next, the coverslips were blocked with 0.5% fish skin gelatin in PBS for 20 min at room temperature and incubated overnight at 4°C with a specific antibody: rabbit anti-human SSEA4 (Santa Cruz Biotechnology; 1:100), rabbit anti-human OCT3/4 (Santa Cruz Biotechnology; 1:100), rabbit anti-human NANOG (Santa Cruz Biotechnology; 1:100), rabbit anti-human GFAP (DAKO; 1:300), or rabbit anti-human NEURO-D (DAKO; 1:400). Then, the samples were rinsed with PBS and incubated for 1 h at room temperature with FITC-conjugated F(ab')2 goat anti-rabbit IgG (H+L; Zymed; 1:100) and phalloidin–rhodamine (Sigma-Aldrich) at 0.1 μg/μL. The slides were assembled with VECTASHIELD® Mounting Media (Vector Laboratories, Inc.) that contains DAPI, and the images were analyzed using an Olympus FluoView FV1000 Confocal Microscope with an attached MRC1024 LSCM system (Bio-Rad). The cells were imaged from top to bottom in the Z-plane, and images from the midplane of the cells were captured and stored as digital images.
Cell differentiation assays
To induce osteogenic differentiation, cells were plated at 2×10³ cells/cm2 in an osteogenic medium that contained the DMEM (GIBCO) supplemented with 10% FBS, 10 mM β-glycerophosphate, 0.25 mM ascorbic acid, and 10−8 M dexamethasone (Sigma-Aldrich). Cultures were maintained for 3 weeks, with medium changes every 2–3 days, and the phenotype was confirmed using the alkaline phosphatase (ALP) activity assay. To induce chondrogenic differentiation, micromass cultures were prepared by seeding 5-, 10-, or 20-μL droplets of a 1×10⁷-cells/mL solution in the centre of well of a 48-well plate. After incubating the micromass cultures for 2 h at 37°C in a 5% CO2, humidified atmosphere, a chondrogenic differentiation medium (Invitrogen Corporation) was added and replaced every 2–3 days for 3 weeks. Cell pellets were fixed with 3% paraformaldehyde and stained with 1% Alcian blue 8GX (Aldrich Chemical Company, Inc.) in 0.1 N HCl for 30 min. Blue staining indicates the synthesis of proteoglycans by chondrocytes. For adipogenic differentiation, cells were grown to 50%–70% confluence in a 4-well chamber (Thermo Fischer Scientific, Nunc) in the DMEM supplemented with 10% FBS. Adipogenesis was induced with supplemented medium that contained 1 mM dexamethasone, 1 mg/mL insulin, 0.5 mM 3-isobutyl-1-methylxanthine, and 100 mM indomethacin. Control cultures without adipogenic supplements were also maintained. After 3 weeks, the cultures were examined for evidence of adipogenesis by fixing in 10% paraformaldehyde and staining with a freshly prepared Oil-red-O solution to detect lipid droplets. Photographs to document condrogenesis and adipocytic differentiation were taken using an Olympus Stereomicroscope SZ61 that was equipped with an Evolution VF Color Cooled camera.
Neuronal differentiation was induced with the DMEM (GIBCO) supplemented with 20% FBS and 0.05 μg/mL NGF over 21 days, and the cultures were maintained in this medium for 15 days. The neuronal phenotype was analyzed by confocal fluorescence microscopy and western blotting to detect the GFAP and NEURO-D proteins.
Bone ALP activity assay
Cells (1×10⁶ cells/mL) were cultured in 6-well plates and harvested at 0, 3, 5, 7, 9, and 14 days postinduction. The cells were the washed with PBS twice and lysed with 1% (w/v) Triton X-100 in 0.9% (w/v) NaCl at 4°C. After centrifugation, the supernatant was assayed for ALP activity with the MicroVue kit (Quidel Corporation) in accordance with the manufacturer's instructions. Subsequently, quantitative kinetic determination of cell-associated ALP activity (U/mg protein) was determined at 405 nm and 20°C using an EPOCH™ spectrophotometer (Biotek Instruments, Inc.), and total the protein concentration, which was determined using the Lowry protein assay, was used for normalization.
Calcium deposition quantification
Cells (1×10⁴ cells/mL) were cultured in 6-well plates and harvested at 0, 9, 14 and 21 days postinduction. The cells were washed twice with PBS and decalcified with 0.6 M HCl at 37°C for 24 h to extract the intracellular calcium content. The supernatant from the acid-extraction was analyzed by staining with Alizarin Red using the Osteogenesis quantitation kit (Millipore Corporation) according to the manufacturer's instructions. The developed color was determined at 405 nm using an EPOCH™ spectrophotometer (Biotek Instruments, Inc.), and the results were normalized to the protein concentration, which was assessed using the Lowry protein assay.
Statistical analysis
All data were analyzed using SPSS 13.0 software (
Results
Isolation of CD44+/CD73+/CD105+ and CD44+/CD73+/CD105− stem cell subpopulations from human amniotic membrane
An adherent cell population was obtained by trypsin and collagenase II digestions of the amniotic membrane, and adherence to the culture dish was observed during the first 24 h (Fig. 1A). After 7 days, 40% to 60% of the cells remained attached and formed colony-forming units with the typical morphology of fibroblast-like cells (Fig. 1B). At day 10–14, the cells reached 80% confluence (Fig. 1C). Using FACS analysis with side-scattered (SSC) and forward-scattered (FSC) light parameters on a linear scale, we observed a high cell dispersion, which suggested high heterogeneity in size and internal complexity (Fig. 1D). To identify cell populations, we applied a logarithmic-scale analysis for SSC/FSC, and 2 subpopulations were clearly identified: smaller cells (average diameter of 9.5±1.1 μm) with low granularity and larger cells (diameter of 15.0±1.1 μm) with high granularity (Fig. 1E).
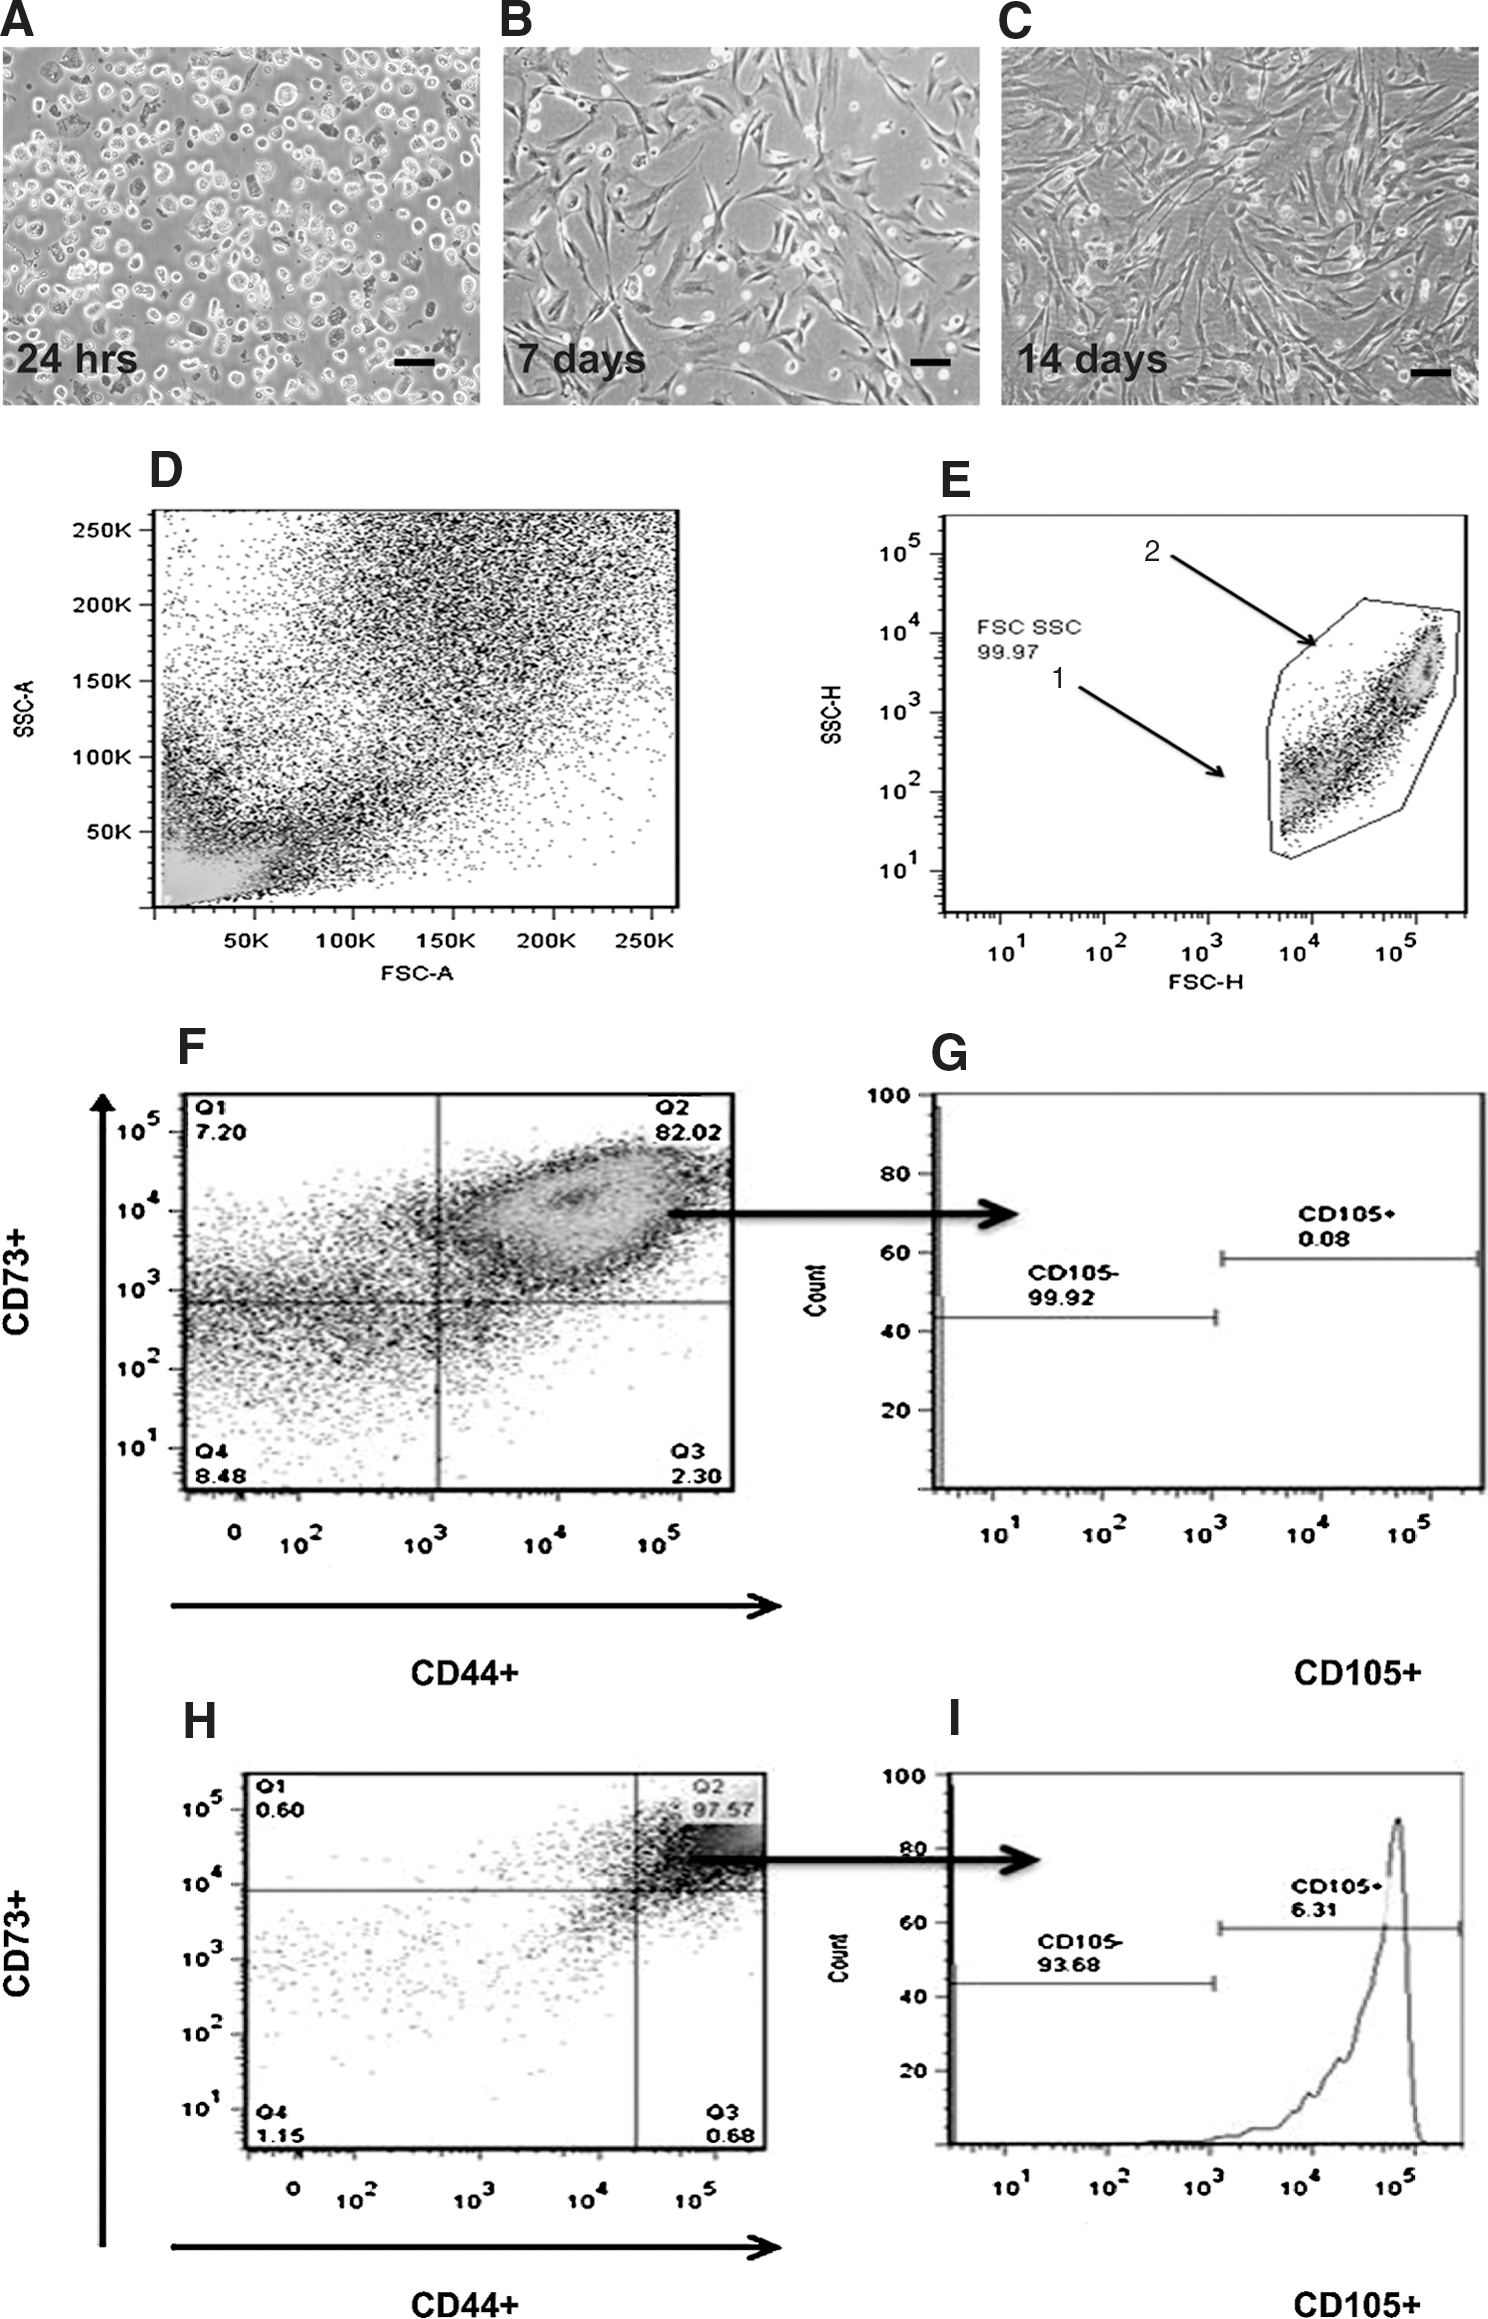
Morphology of isolated cells from the human amniotic membrane.
To establish the cell surface features of the subpopulations, we analyzed the presence of MSC markers on the cells. Based on the criteria established by the ISCT, the expression of the surface markers CD73, CD44, and CD105 was studied for subsequent cellular selection. We observed that 82% of the small-sized cell population shared CD73 and CD44 antigens, but only 0.08% expressed CD105 on their surface (CD105− represented 99.92%) (Fig. 1F). Regarding the larger population, it was determined that 97.57% had a CD73+/CD44+ phenotype, and 6.3% expressed the CD105 marker (Fig. 1G). These findings are highly promising, because in most of the tissues, the population of MSCs represents a rare population that ranges between 0.01% (human bone marrow) and 0.0003% (human umbilical cord blood) [11,36].
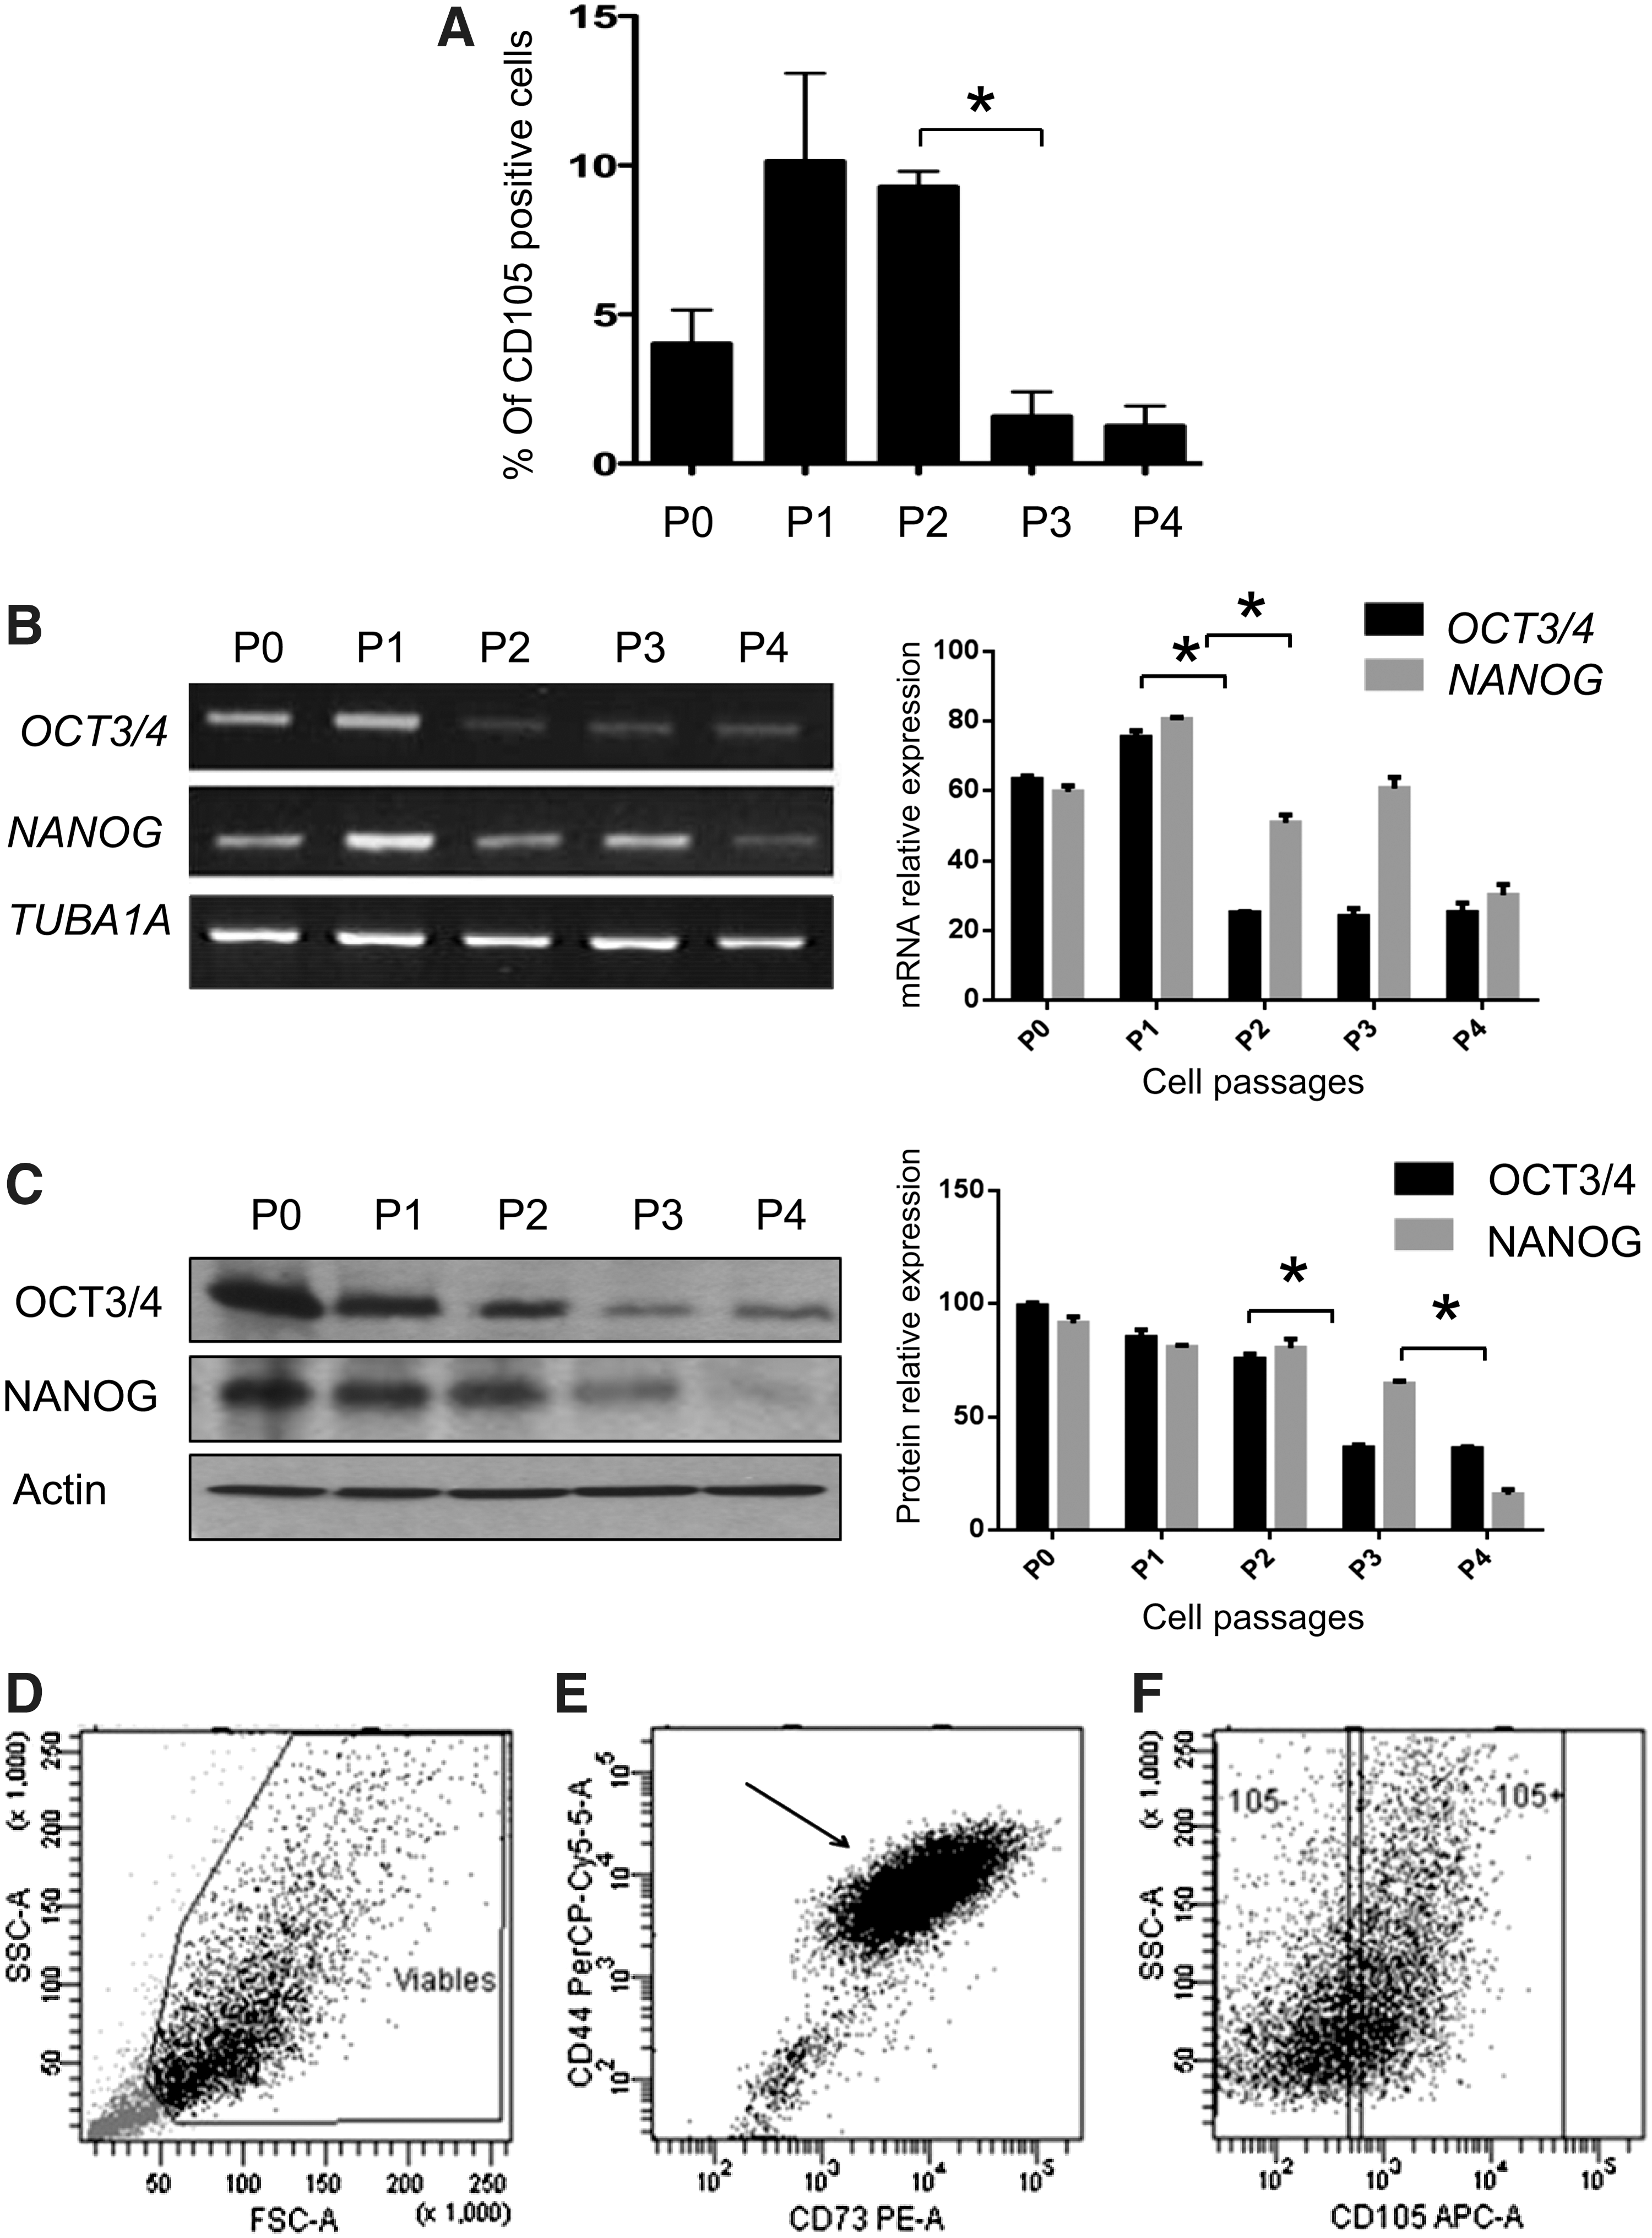
Because a cell passage can significantly influence MSC marker expression, we assessed the presence of the CD105 surface marker over 4 cell passages, because its expression was shown to be limiting. We observed that CD105 expression reached its maximum (10%) after the first and second passages, but after the third and fourth passages, the expression fell down to 2% (Fig. 2A).
Selection and sorting of the CD105+ and CD105− cell subpopulations.
The transcription factors POU class 5 homeobox 1-/octamer-binding transcription factor 4 (POU5F1/OCT3/4) and homeoprotein Nanog (NANOG) play a critical role in pluripotency maintenance; therefore, we monitored their expression levels through the first to fourth cell passages by reverse transcriptase–polymerase chain reaction (RT-PCR) assays and western blot analysis. Our results demonstrated that NANOG mRNA expression remained constant; however, OCT3/4 expression displayed a decreasing tendency after the first cell passage (Fig. 2B). To establish if the detected mRNA expression levels of the OCT3/4 and NANOG genes correlated with their protein levels, we performed western blot analysis of total protein extracts. As shown in Fig. 2C, both proteins exhibited decreased expression by the third cell passage. OCT3/4 continued to be expressed, but, at lower levels, and NANOG was no longer detectable after the fifth passage (Fig. 2C).
Therefore, we decided to perform cell-sorter experiments on cell cultures between the second and third passages. It is important to mention that before sorting, cell viability was analyzed by measuring the incorporation of propidium iodide and annexin V into the cell membrane, and cultures with 91.9% cell viability were used (Fig. 2D). Cell subpopulations of the initial adherent cell culture were sorted into the CD44+/CD73+/CD105+ and CD44+/CD73+/CD105− phenotypes, which are referred to as CD105+ and CD105− cell subpopulations, respectively (Fig. 2F). CD105+ and CD105− cells were plated at the same cell density and produced homogeneous cell monolayers that were a characteristic of MSCs.
Surface immunophenotype of CD105+ and CD105− cell subpopulations
We evaluated the expression of MSC and HSC surface markers in the selected CD105+ and CD105− cell subpopulations by flow cytometry analysis. Our data revealed that large numbers of cells coexpressed CD73/CD44: 80.7% in CD105+ cultures and 84.5% in CD105− cultures. These percentages indicated the purity of the obtained cell subpopulations.
Flow cytometry analysis established that the CD105+ and CD105− subpopulations were both positive for CD29 (25% and 18%, respectively), while the surface markers CD34, CD45, and CD14 showed no expression in these populations. The MSC and HSC profiles that were observed in both subpopulations were in agreement with an MSC [1 –4].
Intriguingly, the CD90 surface marker, which is a typical mesenchymal marker, was not present in the CD105+ and CD105− cell subpopulations (Table 2).
Data represent the average of 3 independent experiments. Values are the mean percentage±standard deviation.
P<0.05, CD105+ versus CD105− subpopulation.
HSCs, hematopoietic stem cells; MSCs, mesenchymal stem cells.
The CD105+ subpopulation contained a higher percentage of cells that were positive for CD49a when compared to the CD105− cells (57% vs. 38%). Similarly, the CD49d marker was mainly expressed by the CD105+ subpopulation (33% vs. 16%), and the heterodimer α9β1 was expressed in the CD105+ subpopulation (5.6%). Unexpectedly, this heterodimer was expressed in a high percentage of the CD105– subpopulation (16.6%). Additionally, outstanding figures were obtained for 2 critical MHC molecules. We found that 61.65% of the CD105− cell subpopulation was completely negative for HLA-ABC and HLA-DR, which suggested very low immunogenicity of these cells (Table 2).
Expression of the transcription factors OCT3/4, NANOG, PAX6, and SOX in CD105+ and CD105− cell subpopulations
To better characterize the selected CD105+ and CD105− cell subpopulations, we analyzed the expression of several transcription factors by RT-PCR and immunofluorescence assays. We performed semiquantitative RT-PCR to quantify the expression levels of the POU class 5 homeobox 1-/octamer-binding transcription factor 4 (POU5F1/OCT3/4), homeoprotein Nanog (NANOG), SRY (sex-determining region Y)-box 2 (SOX2), paired box 6 (PAX6), and forkhead box D3 (FOXD3) genes. Our analysis showed that the core transcription factors, which maintain the undifferentiated state of stem cells (OCT3/4, NANOG, and SOX), were expressed in the population before sorting (AM-hMSCs) and in the CD105+ and CD105− cell subpopulations. Furthermore, PAX6 expression was evident in both cell subpopulations and at a higher expression level than that of the AM-hMSC population. In contrast, the expression of FOXD3 was only conserved in the starting population, and this expression was lost after cell sorting (Fig. 3A).
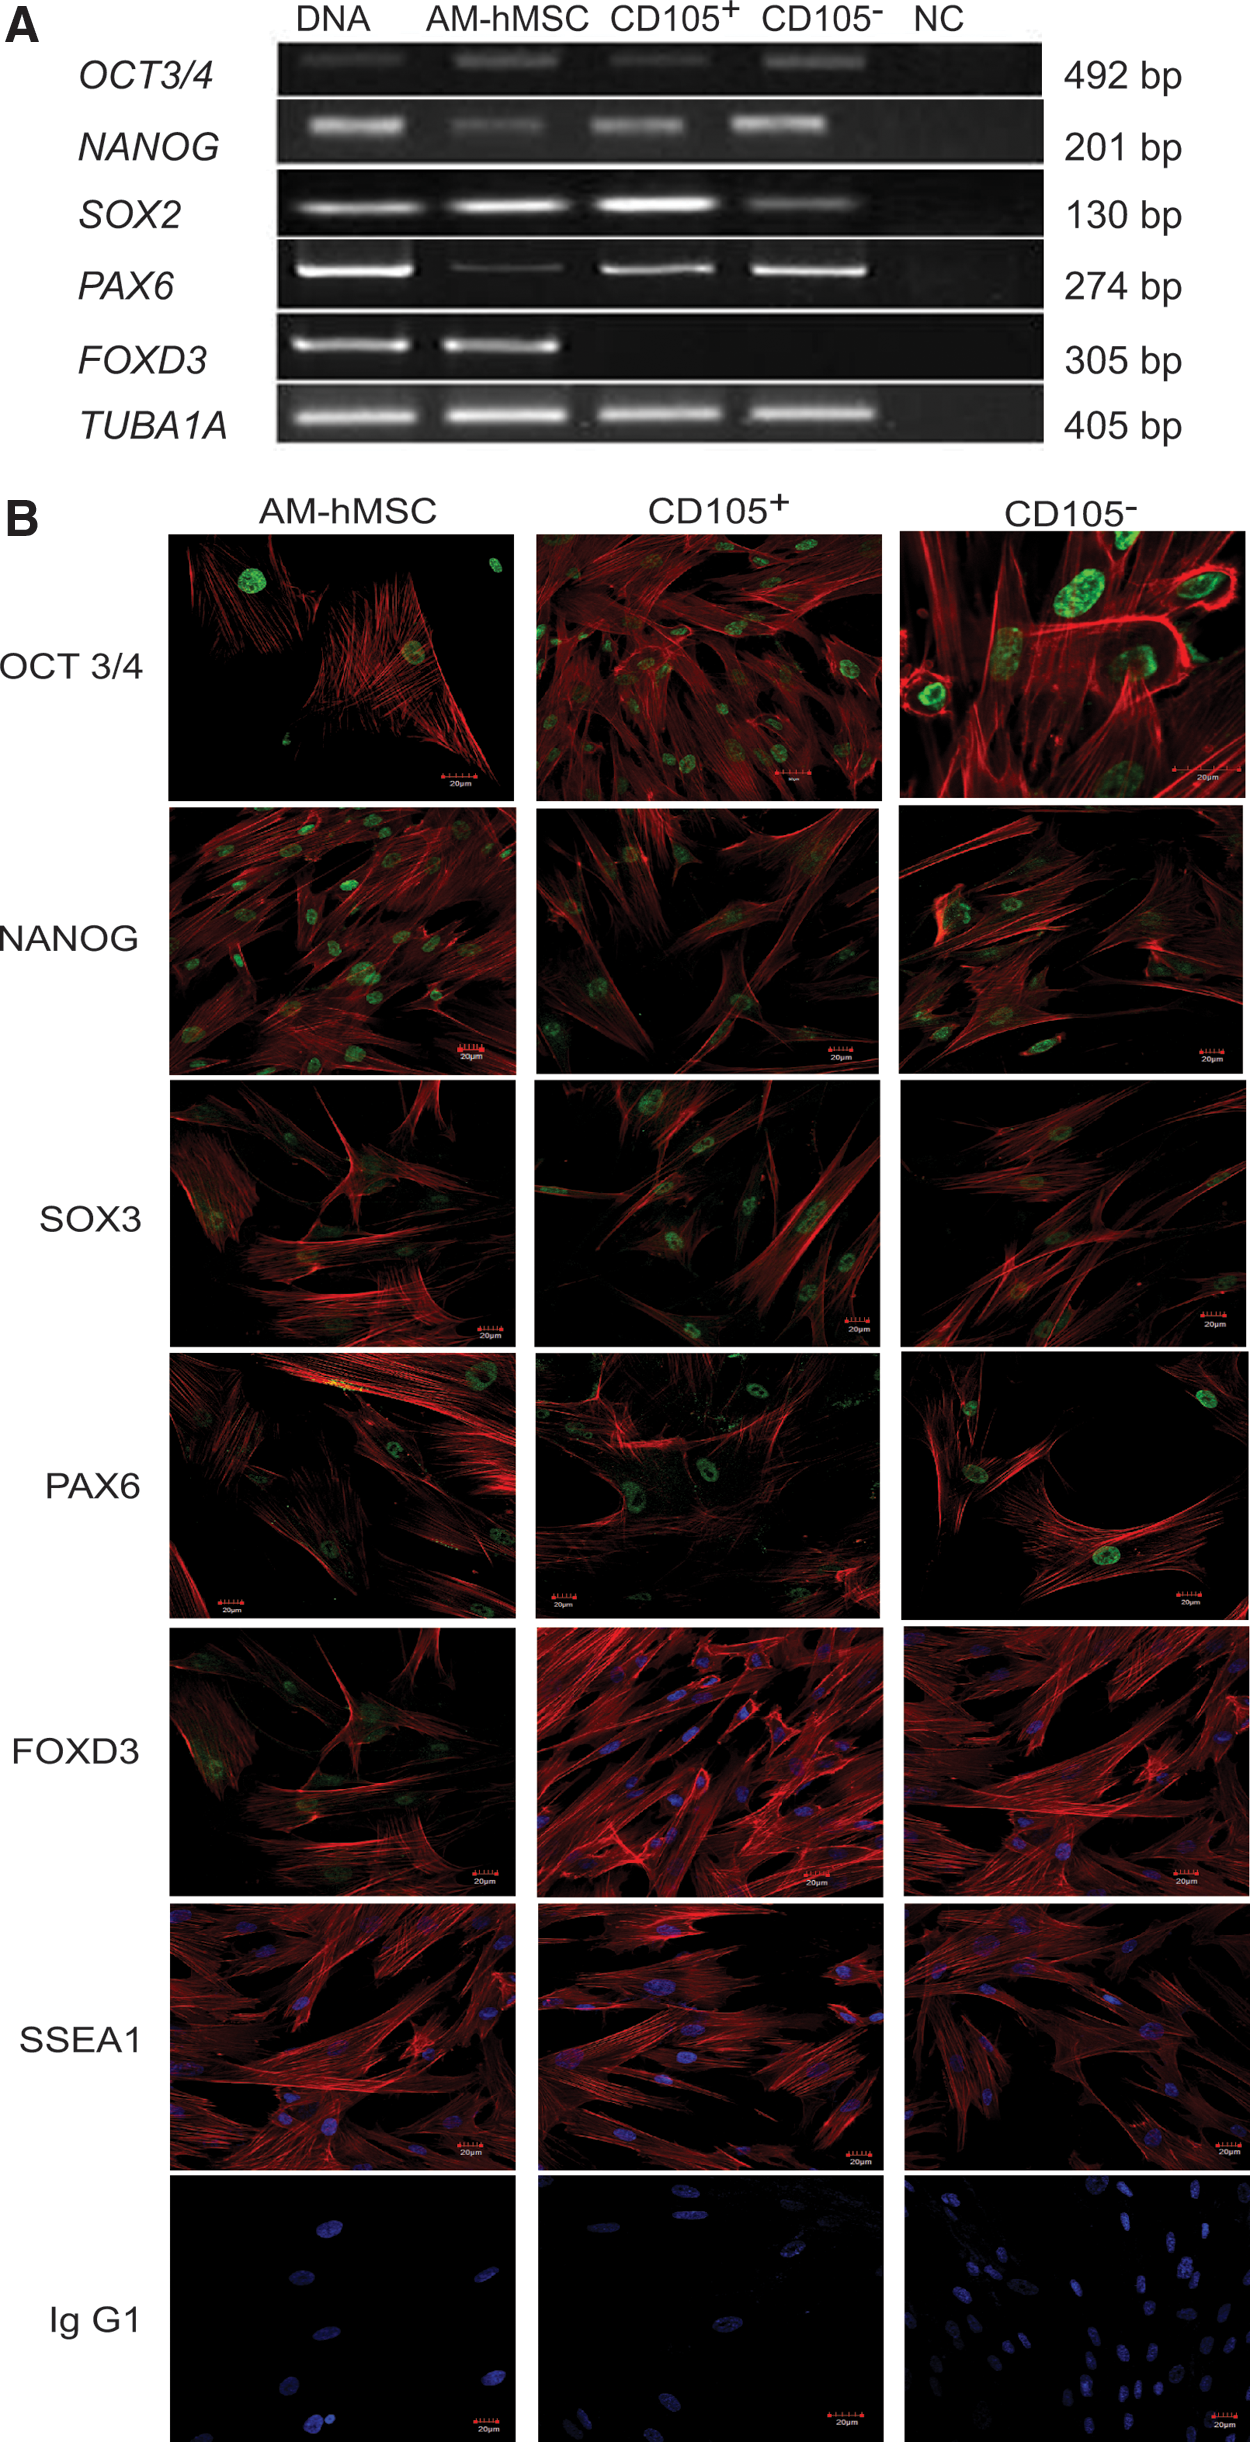
Expression of pluripotency-associated genes.
To determine if the detected expression of the FOXD3, PAX6, SOX2, NANOG, and POU5F1/OCT3/4 genes correlated with the presence of the protein, we performed immunofluorescence analyses. Our results showed a strong, positive signal for PAX6, OCT3/4, SOX3, SOX2, and NANOG in nearly 95% of the cultures of the CD105+ and CD105− cell subpopulations. In contrast, the expression of FOXD3 was absent in both subpopulations. Additionally, we analyzed the presence of the stem cell marker SSEA4, which is present in highly primitive cells; however, we did not observe this marker in any of the populations that were analyzed (Fig. 3B).
Assessment of pluripotency in the CD105+ and CD105− cell subpopulations
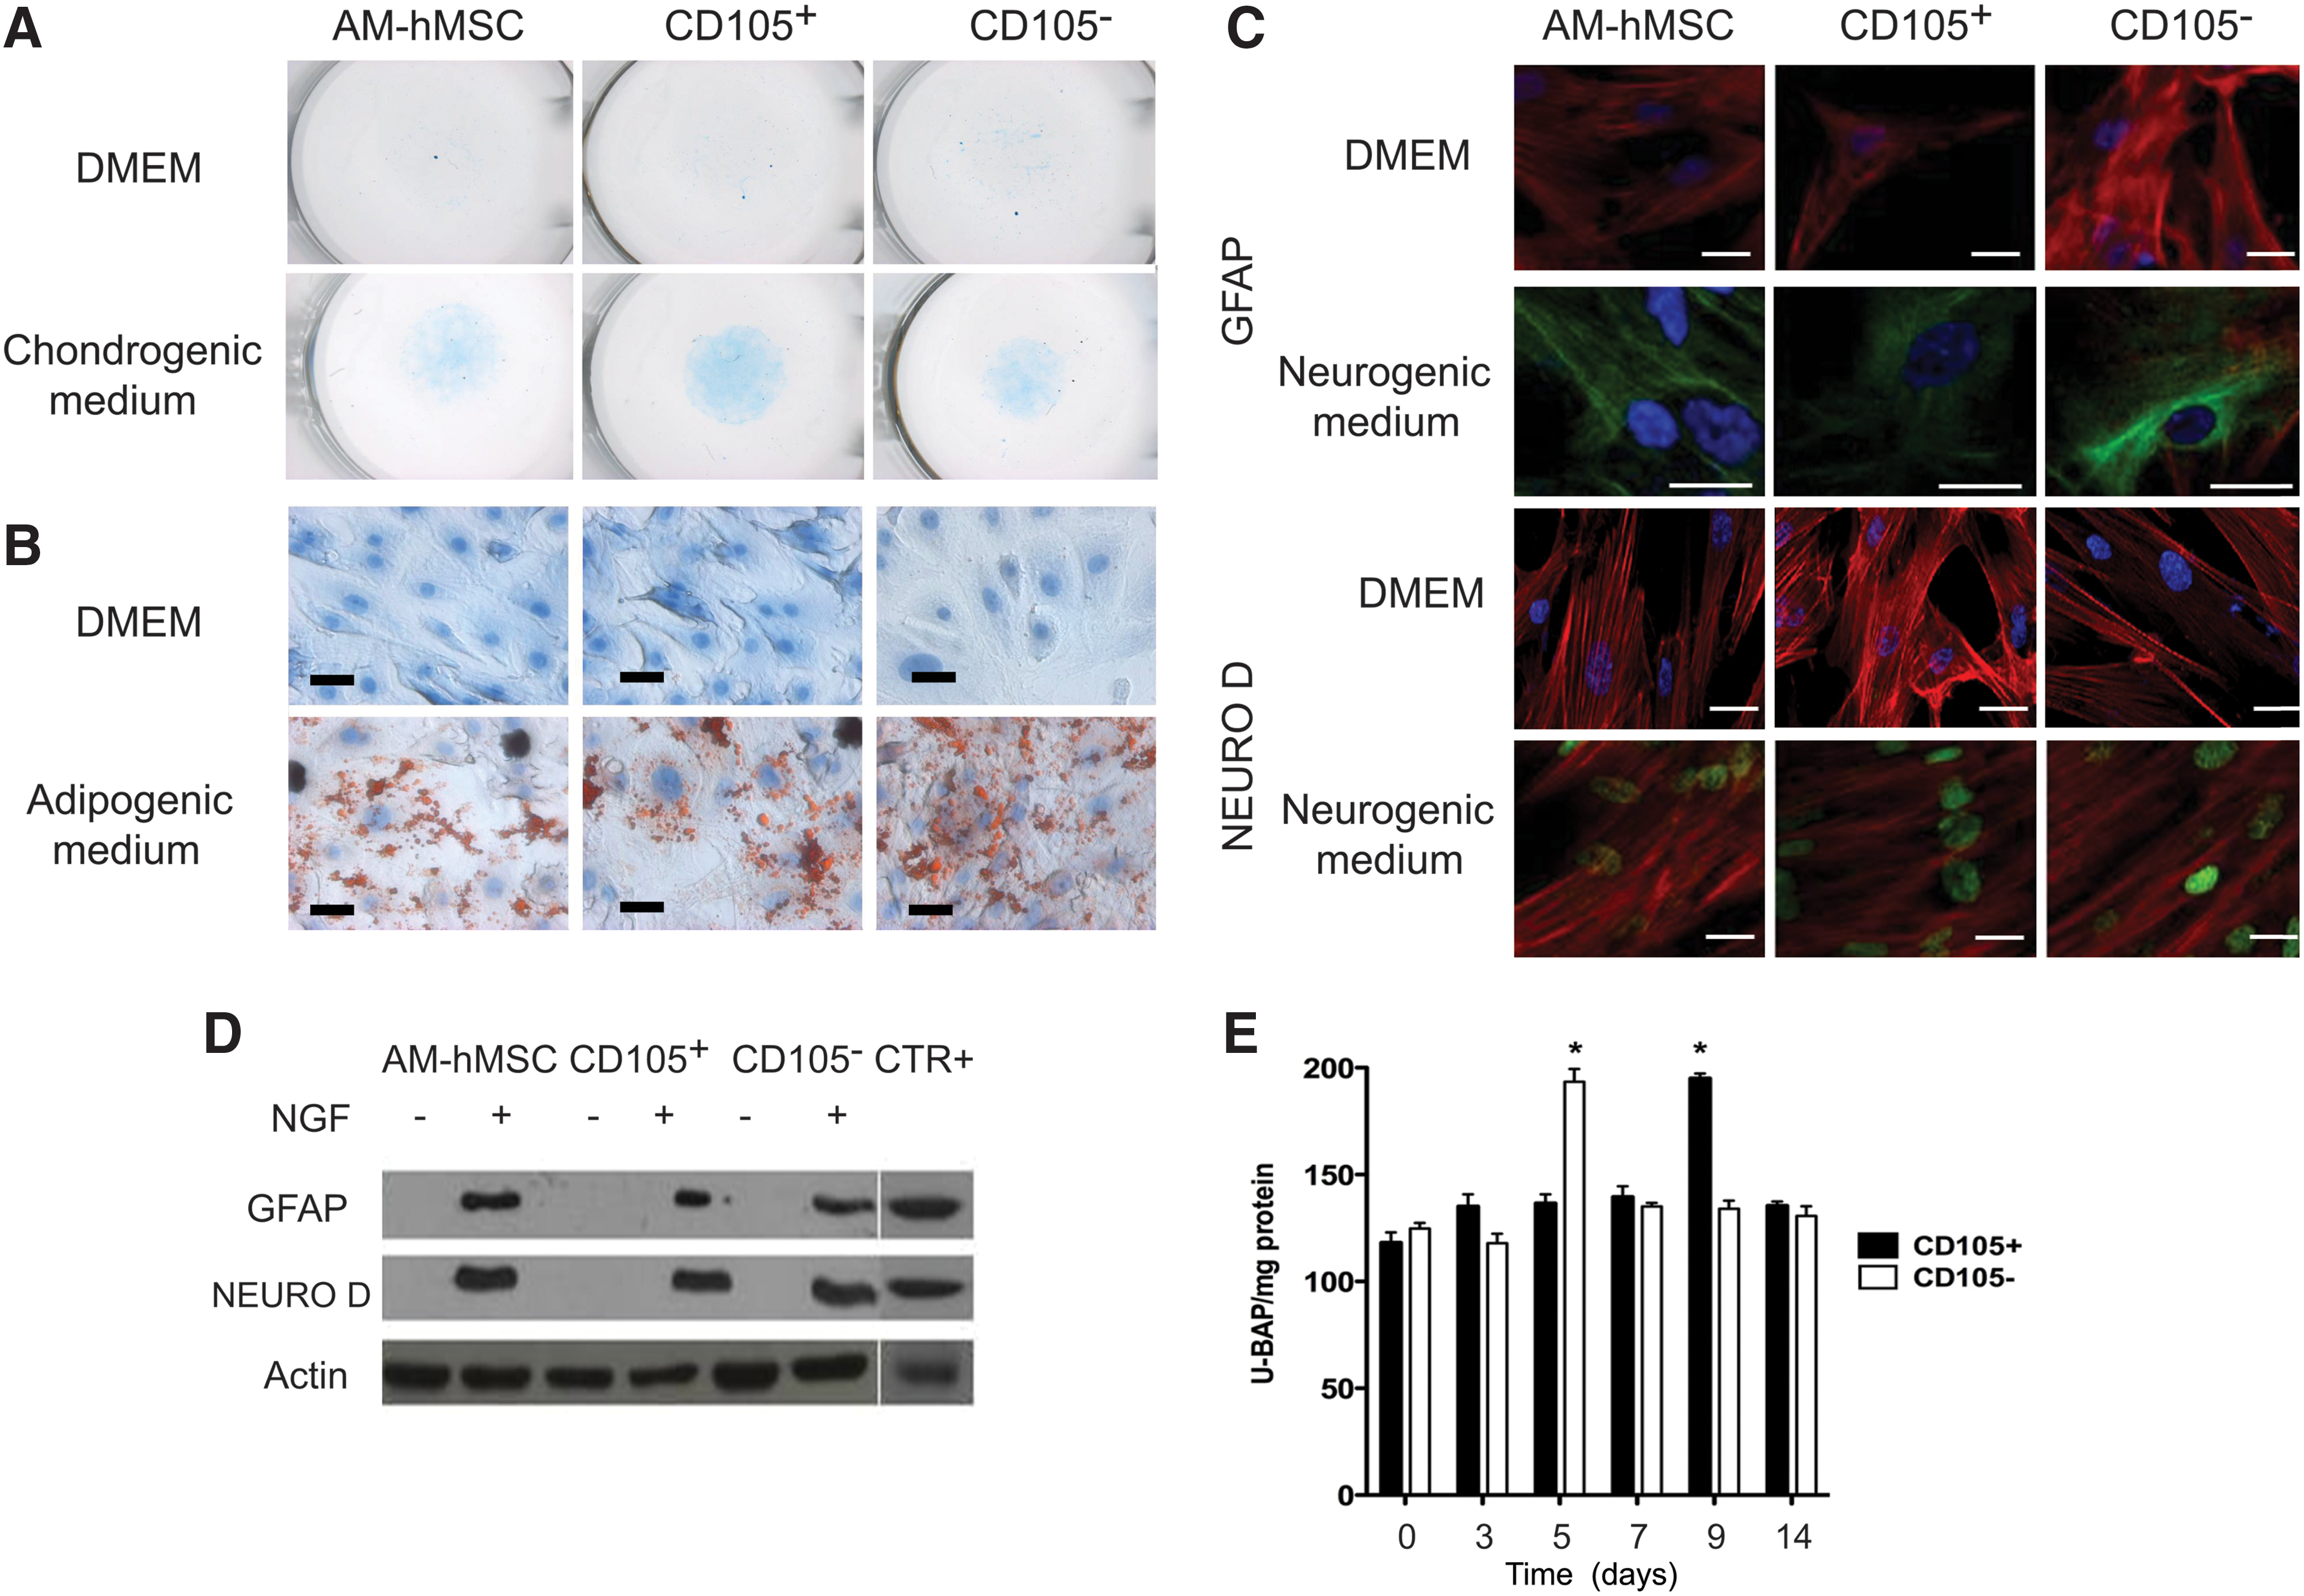
To evaluate the multilineage differentiation potential of the selected CD105+ and CD105− cell subpopulations, we investigated the ability of those cells to differentiate into chondrogenic, adipogenic, neurogenic, and osteogenic lineages. For chondrocyte differentiation, hMSCs and CD105+ and CD105− cells were maintained as micromass cultures; the formed pellets were induced in the presence of a medium containing TGF-β for 3 weeks. The cells were differentiated toward chondrocytes, as shown by glycosaminoglycan deposition and Alcian blue staining (Fig. 4A). For adipocyte differentiation, CD105+, CD105−, and AM-hMSC cultures were induced with an adipogenic differentiation medium containing dexamethasone (1 μM), indomethacin (60 μM), 3-isobutyl-1-metyl-xanthine (500 μM; IBMX), and insulin (5 μg/mL; Sigma-Aldrich).
Assessment of pluripotency in amniotic membrane human-mesenchymal stem cell (AM-hMSC), CD105+, and CD105− cell subpopulations.
After 3 weeks, all of the analyzed cultures differentiated into adipocytes, as demonstrated by Oil-Red-O staining for the presence of lipid droplets (Fig. 4B).
To evaluate the neurogenic potential, the AM-hMSCs and CD105+ and CD105− subpopulations were induced with the DMEM that was supplemented with NGF for a 21-day period. During induction, the cell morphology was evaluated by light microscopy, and drastic morphological changes were observed beginning on the 4th day after induction. These cells were more elongated, and cells in the confluence zones displayed refractile soma and neurite-like processes. Moreover, the expression of the neural markers GFAP and NEURO-D was analyzed by immunofluorescence, confocal microscopy, and western blot assays before and after treatment of the cells with the neural induction medium. Image analysis of the differentiated subpopulation cell cultures showed that the astrocyte marker GFAP signal was present in 20%–50% of the cultured cells, and the neuronal marker NEURO-D signal was present in 80%–90% of the cultured cells. Nonimmunoreactivity was displayed for both markers in noninduced cultures (Fig. 4C). Consistent with the immunofluorescence studies, western blot analysis confirmed Neuro-D and GFAP expression in the AM-hMSCs and CD105+ and CD105− subpopulations after induction with NGF (Fig. 4D).
To evaluate the osteoblastic potential, we measured the ALP activity after a cultivation period of 14 days with an osteogenic medium containing dexamethasone. Cultured samples were taken over a time course of 14 days postinduction, and the bone ALP activity was assessed by ELISA. The results of our biochemical analysis showed a 2-fold increase in the ALP activity in both subpopulations. However, in the CD105+ cells, the maximum peak of ALP activity was detected at day 9, while in the CD105− subpopulation, the peak was reached on day 5 after induction (Fig. 4F).
Dissimilar osteoblastic differentiation of CD105+ and CD105− cell subpopulations
As described above, the osteoblastic differentiation of CD105+ and CD105− cell subpopulations was first evaluated by measuring the enzymatic activity of ALP. We observed a difference in the time that was required for these subpopulations to reach the maximum peak of ALP activity. To assess if the expression of collagenous and noncollagenous key proteins that are related to mineralization also occurs in a time-dependent manner, we studied the protein expression of collagen type I-alpha 1 (COL1A1), secreted protein acidic and rich in cysteine (SPARC), bone gamma-carboxyglutamate protein/osteocalcin (OSC), and osteopontin (OSP) by western blot analysis. Our results showed that all of the studied osteoblastic proteins were expressed beginning on the seventh day after induction in both subpopulations. However, the expression of COL1A1 and OSC did not significantly differ between cell subpopulations. In contrast, the expression of SPARC after 14 days of induction was up to 3-fold higher in the CD105− subpopulation than that of the CD105+ cell subpopulation. A similar pattern was observed for osteonectin. Fourteen days after induction, the expression of osteonectin was up to 6-fold greater in the CD105− subpopulation than in CD105+ cells.
To analyze whether the molecular findings that were observed in the late stage of osteoblastic differentiation were accompanied by an inefficient mineralization, and because osteoblast mineralization depends on the intracellular calcium phosphate, we evaluated the intracellular calcium content in AM-hMSCs and CD105+ and CD105− subpopulations 21 days postinduction. After osteogenic stimulation, all groups showed increased calcium deposition. However, the quantification of bone matrix mineralization was clearly higher for the CD105− than CD105+ subpopulations and, surprisingly, was higher than that of AM-hMSCs (Fig. 5).
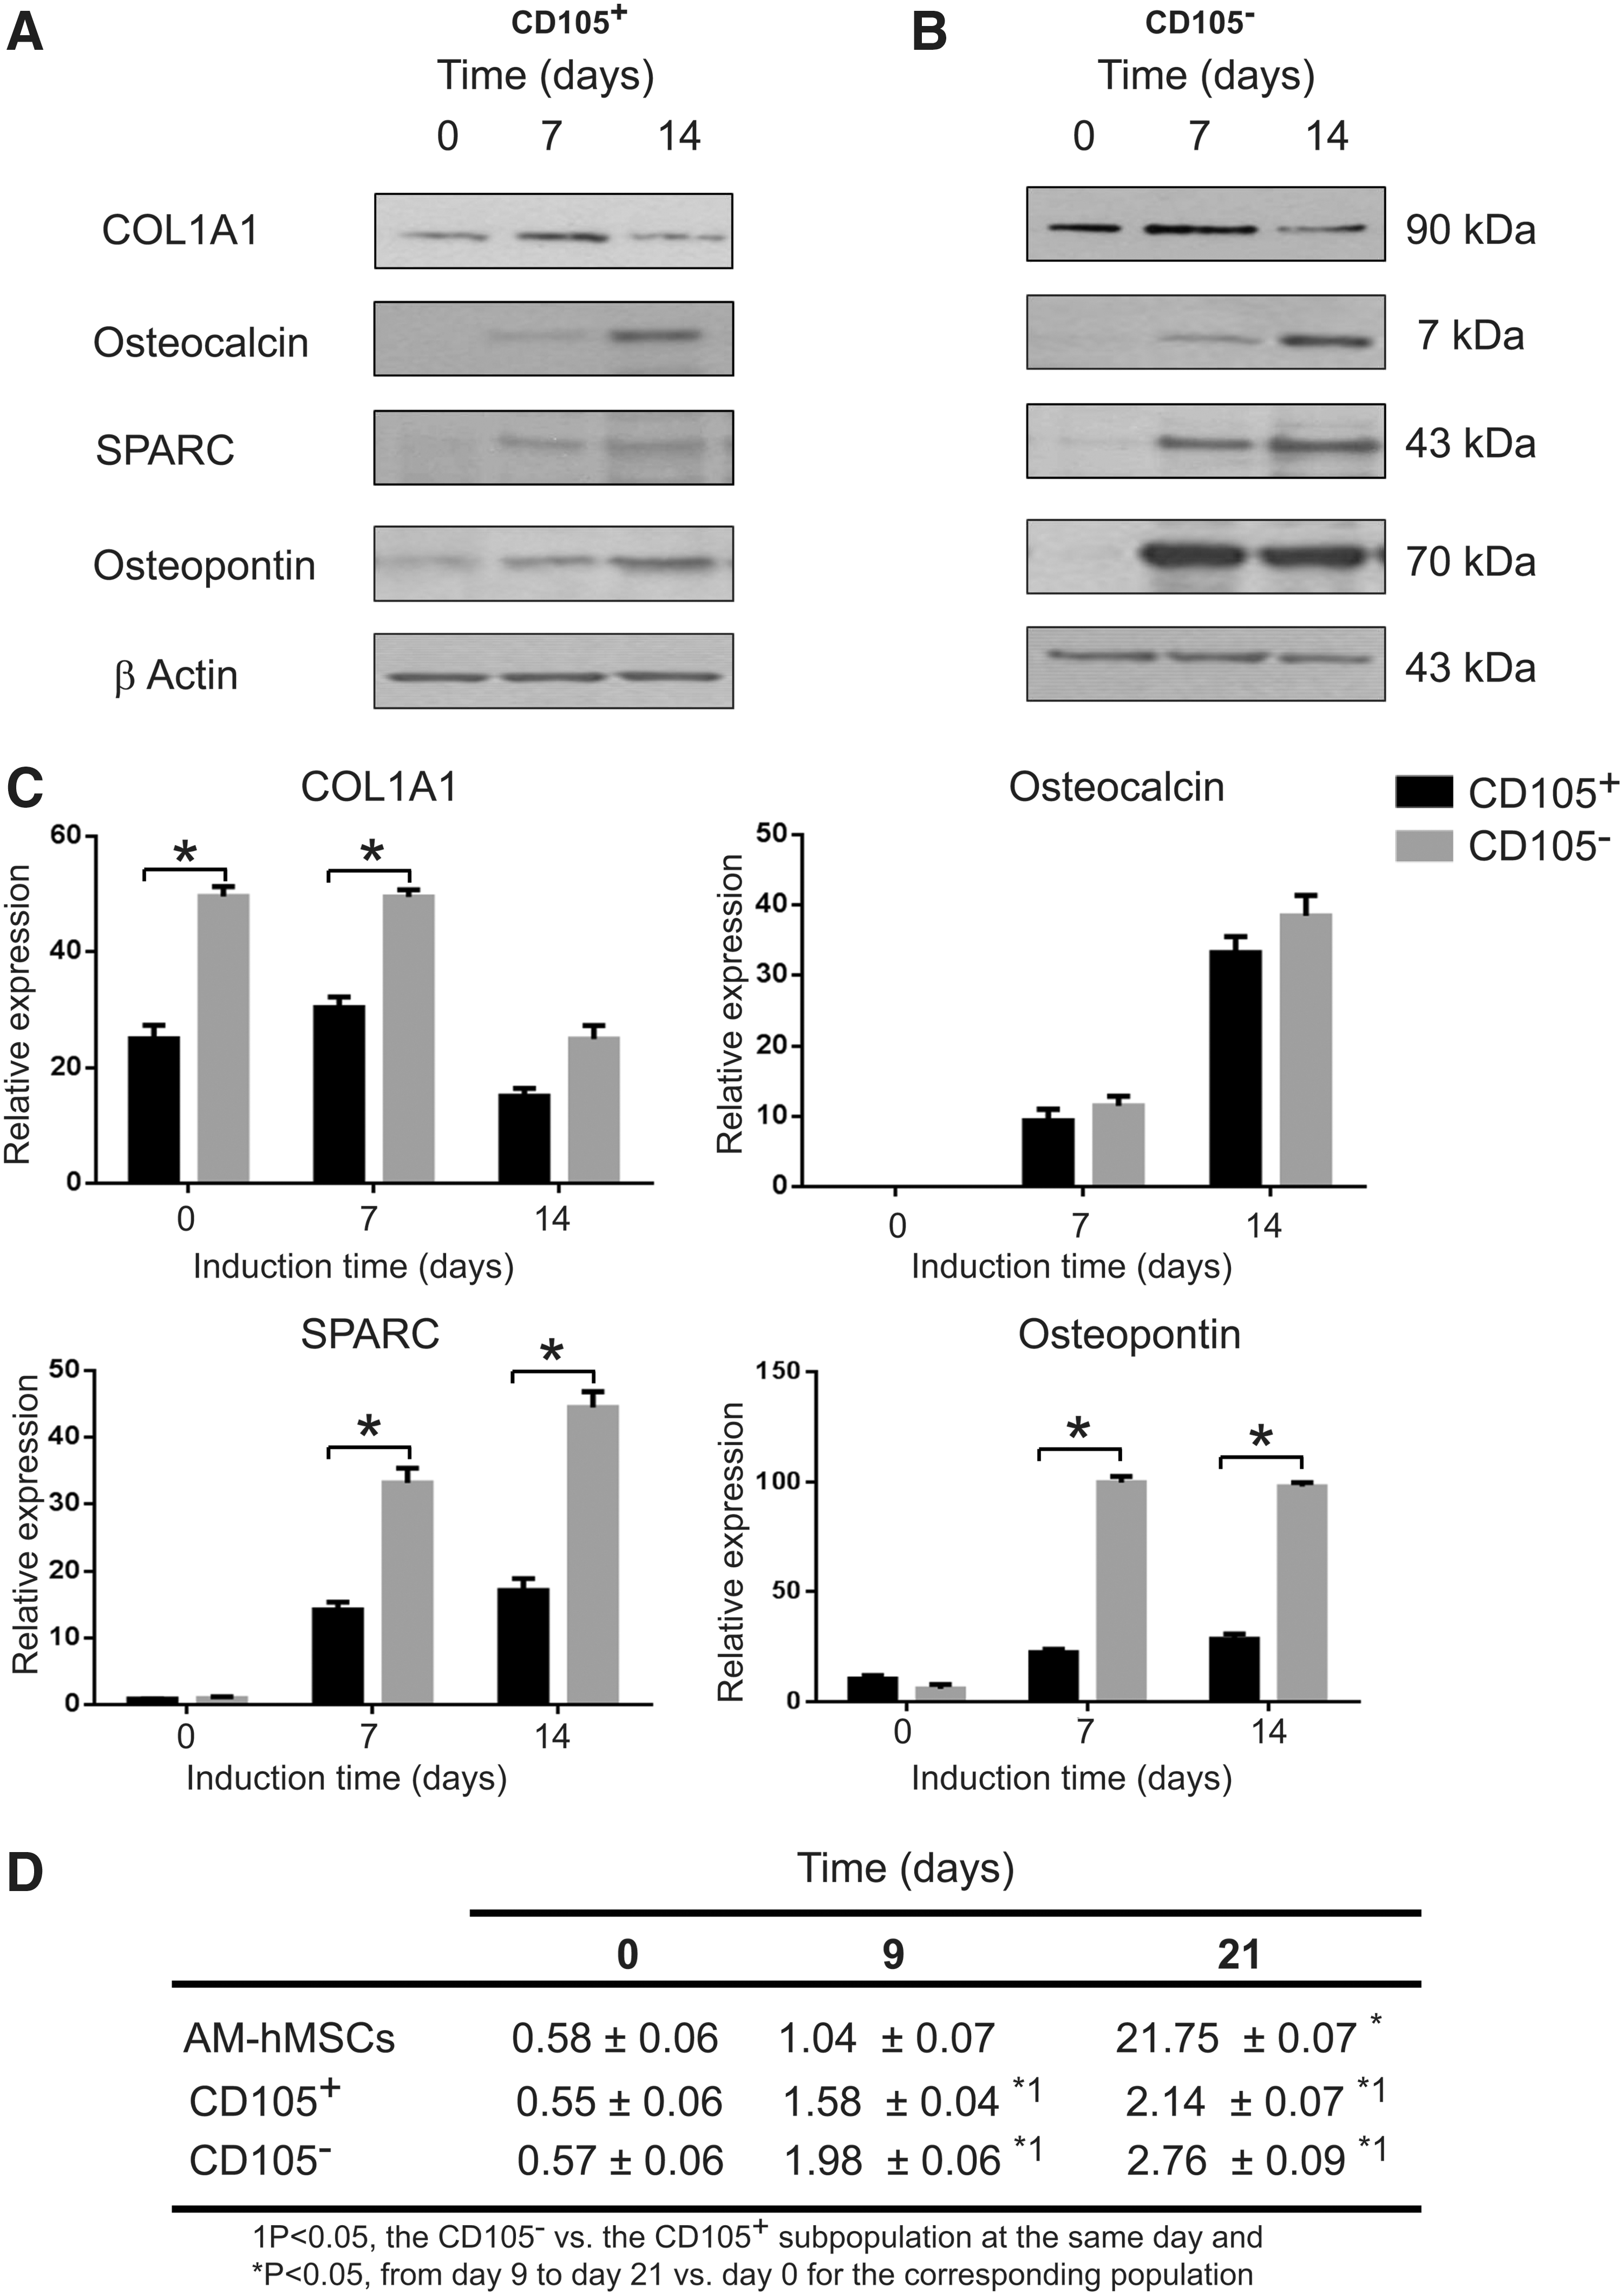
Osteoblastic protein expression and intracellular calcium content after induction with dexamethasone in the CD105+ and CD105− cell subpopulations.
Discussion
The current study describes a methodology that is based on the simultaneous use of 3 stem cell markers to select and sort a homogenous subpopulation of hMSCs that coexpress the CD73+/CD44+/CD105+ (6%–12%) or CD73+/CD44+/CD105− (80%–88%) antigens by FACS. Relevant studies, such as that by Psaltis' group, attempted to devise a selection method to improve the experimental reproducibility of this method by immunoselection that was mediated by the surface marker STRO-1 [37]. Likewise, in the study conducted by Majumdar et al., only the anti-CD105 (endoglin) antibody was used to isolate cells from human bone marrow aspirates. After expansion in culture, those cells displayed an immunophenotype that was distinctive to hMSCs, but had high heterogeneity [38]. Although both studies achieved good reproducibility, the heterogeneity of the culture persisted. These results were explained by the fact that bone marrow, despite being a good source of MSCs, is also a source of multiple cell lineages.
Throughout the analysis of AM-hMSCs, we observed that the expression of CD44 and CD73 remained stable in many passages and in nearly all analyzed cultures. A setback was the low and variable level of the expression of the surface marker CD105. To overcome this scarce expression, we utilized FACS analysis, which determined that the expression level of this marker remained acceptable at the 2nd and 3rd passages. This observation was consistent with those of other authors [39 –41]. To define the best sorting period, the expression of 2 key transcription factors (OCT3/4 and NANOG) that are related to the maintenance of the undifferentiated state of MSCs was analyzed. In the initial population, we found that NANOG expression was lower than that of OCT3/4, and those levels remained unchanged until the 3rd passage. Furthermore, the expression of the transcription factor OCT3/4 decreased between the 2nd and 3rd passages. After taking the expression of CD44, CD73, and CD105 and of the transcription factors NANOG and OCT3/4 into account, it was decided that we would separate the subpopulations from the cultures between these passages.
No single surface marker is specific for MSCs, which express a wide range of surface markers. Therefore, general, minimal criteria for MSCs have been proposed [4], but subtle differences are evident between MSC populations that are derived from different sources. The immunophenotype that includes MSC and HSC markers was defined in the CD105+and CD105− cell subpopulations by FACS, and the observed profile was consistent with an MSC subpopulation [4,6].
The CD90 antigen (also known as Thy-1) is expressed in nervous tissue, in various stromal cell lines, and by a rare subpopulation of human fetal bone marrow cells that contain multipotent hematopoietic progenitor activity [42]. We demonstrated that the CD90 marker was absent in the CD105+ and CD105− subpopulations, and other groups have reported similar data. Campioni et al. focused on defining functional hMSC subpopulations of hematologic malignant and normal samples based on their CD90−antigen expression. The CD90− subpopulation was characterized by peculiar functional and phenotypic characteristics, which supported the role of the microenvironment in selecting a particular hMSC subpopulation when maintaining normal tissue homeostasis or inducing pathologic processes [43]. Furthermore, they suggested a potential role for CD90 with the HLA-G molecule in regulating immune-suppressive functions [44]. Maddox et al. described the isolation of a stem cell subpopulation of adipose tissue that highly expressed CD105 and CD73, but expressed a low level of CD90.2. Interestingly, the CD90.2low cell subpopulation had a better potential to differentiate toward an osteogenic lineage in vitro [41], which is a crucial feature for clinical applications in bone tissue engineering.
No critical differences in surface marker expression were witnessed between subpopulations CD105+ and CD105−, except for their HLA profiles. The outstanding feature of HLA system analysis was that the CD105− subpopulation lacked HLA-ABC and HLA-DR (61.65%), which classifies them as nonimmunogenically active [17].
Pluripotency is mainly maintained by a network of transcription factors [45], and the triad composed of OCT3/4, SOX2 (which acts synergistically and leads to transcription of target genes), and NANOG [46 –49] is fundamental in this process. Our semiquantitative RT-PCR analysis, which was based on previously reported primers [50], revealed high levels of OCT-3/4 and NANOG in AM-hMSCs, CD105+, and CD105− cells. The presence of this triad of transcription factors in these populations confirms that these cells are in an undifferentiated state [47,48].
FOXD3 was strongly expressed in AM-hMSCs before sorting, but it was absent in the CD105+ and CD105− subpopulations. This transcription factor is usually involved in OCT43/4 and NANOG activation in stem cells; therefore, our data suggest that the activation of OCT3/4, NANOG, and SOX2 in these subpopulations relies on an alternative pathway [49].
The presence of PAX-6 in the CD105+ and CD105− subpopulations implies its putative ability to differentiate into a neuronal lineage. When cultures (CD105+ and CD105−) were induced in a neurogenic medium [5,6], the expression of the neuronal marker NEURO-D and the astrocyte marker GFAP was observed, which suggested an efficient neuronal potential.
We confirmed the chondrogenic and adipogenic differentiation ability of the CD105+ and CD105− subpopulations, which was in agreement with the data reported by Alviano et al. and In't Anker et al. regarding AM-hMSCs [8]. The osteogenic potential of the cell population was displayed by induction with dexamethasone, and both subpopulations were able to initiate differentiation. However, differences in the time that was required to achieve each of the stages of osteogenesis were delayed [51 –53]. We observed that the CD105− subpopulation reached of its peak ALP activity as early as on the 5th day. Meanwhile, the activity peak of the CD105+ cells was delayed until the 9th day. The CD105− subpopulation showed strong expression of SPARC and OSP, and it exhibited effective calcium deposition. These data reflect a stable phenotype that has the best mineralization state.
Finally, the simultaneous use of 3 markers (CD44, CD73, and CD105) for MSC selection allowed for the sorting and establishment of a homogenous population of AM-hMSCs that were nonimmunogenic, developed a high osteogenic potential, and had efficient mineralization. This approach could be a strategy to study the aspects of osteoblast differentiation and in bone tissue engineering.
Footnotes
Acknowledgment
We are grateful to Dr. Manuel Hernández (Department of Cellular Biology, CINVESTAV-IPN, Mexico City) for supplying anti-actin monoclonal antibody. This work has been partially financed by CONACyT; CONACYT-87537/SALUD-2008.
Author Disclosure Statement
No competing financial interests exist.