
Abstract
To circumvent difficulties of isolating pure populations of cancer stem cells (CSCs) for the purpose of identifying malignancy-specific gene expression, we have compared exon-resolution transcriptomic profiles of 5 embryonal carcinoma (EC) cell lines, a histological subtype of germ cell tumor (GCT), to their nonmalignant caricature, specifically 6 human embryonic stem (ES) cell lines. Both cell types are readily accessible, and were purified for undifferentiated cells only. We identified a set of 28 differentially expressed genes, many of which had cancer and stemness roles. Overexpression of the recently discovered pluripotency gene NR5A2 in malignant EC cells revealed an intriguing indication of how WNT-mediated dysregulation of pluripotency is involved with malignancy. Expression of these 28 genes was further explored within 2 publically available data sets of primary EC tumors and normal testis. At the exon-level, alternative splicing events were detected in ZNF195, DNMT3B, and PMF1, and alternative promoters were detected for ASH2L and ETV5. These events were validated by reverse transcriptase-polymerase chain reaction-based methods in EC and ES lines, where the alternative splicing event in the de novo DNA methyltransferase DNMT3B may have functional consequences. In conclusion, we have identified malignancy-specific gene expression differences within a rigorous pluripotent stem cell context. These findings are of particular interest for both GCT and ES cell biology, and, in general, to the concept of CSCs.
Introduction
The GCT histological subtype embryonal carcinoma (EC) is stem-like in character, with cells capable both of self-renewal and differentiation into an array of cell and tissue types [6]. EC cells bear striking similarities to embryonic stem (ES) cells, which are derived from the inner cell mass of blastocyst-stage embryos. EC and ES cells express the same pluripotency and cell surface markers, and their global gene, protein, and miRNA expression profiles show extensive agreement [7 –10]. Functional equivalence is supported by the capacity of both EC and ES cells to generate differentiated cells belonging to all 3 germ layers in teratomas.
Nevertheless, EC cell lines can lose the capacity to differentiate, a process which may reflect tumor progression, since reduced propensity for differentiation and a corresponding increase in propensity for self-renewal would produce stem cells with a marked growth advantage. Strikingly, human ES cells grown in vitro over a prolonged period adapt to culturing by increasing their growth rate [11] and altering patterns of differentiation [12]. Simultaneously, they may acquire some of the karyotypic changes commonly found in in vivo tumorigenesis of testicular GCTs (TGCT) [11,13]. Typically, they gain material from chromosomes 12, 17, and X [11]. Extra copies of chromosome arm 12p, often in the form of an isochromosome, is pathognomonic for TGCT [14]. This furthers supports the notion that diploid ES cells represent a normal, nonmalignant, counterpart of a malignant cell with pluripotent properties.
The acquisition of neoplastic properties has implications for the application of human ES cells to therapy of degenerative diseases [15], and a better understanding of the processes which underlie ES cell culture adaptation would be hugely valuable for their future use. The early passage, karyotypically normal ES cells provide a well-characterized comparator from which to identify genes that contribute specifically to the malignant phenotype of EC cells. In this study, we have exploited the phenotypic similarities between EC and ES cells cultured in comparable growth conditions to probe for malignancy-specific gene expression against a stemness background.
Materials and Methods
Cell culture and tissue samples
In this study, 5 EC cell lines, NTERA2, 2102Ep, 833KE, TERA1, and NCCIT, were compared to 6 human ES cell lines, Shef3, Shef5, Shef6, Shef7, H9, and H14. All EC cell lines were grown on plastic as previously described [16]. All ES lines and 3 of the EC lines (NTERA2, 2102Ep, and 833KE) were grown on mitomycin C-inactivated mouse embryo fibroblasts in the knockout Dulbecco's modified Eagle medium (DMEM), supplemented with 10% serum replacement and 4 ng/mL basic fibroblast growth factor (Peprotech). Cells were harvested and passaged by scraping after brief incubation with a solution of 1% collagenase type IV in the basal medium. The colon cancer cell lines HT29, HTC15, LS1034, RKO, SW48, and SW480 were grown in the Gibco advanced DMEM/F12 medium, supplemented with 2% Penicillin–Streptomycin–Glutamine and fetal bovine serum to a final concentration of 10%. Cells were grown in plastic flasks at 37°C with 5% CO2. Cells were harvested for passaging by addition of 2 mL 5% trypsin-EDTA. All media and supplements were from Invitrogen unless otherwise indicated.
All cell lines were maintained and cultured in-house, and DNA isolated simultaneously from the pellets was STR fingerprinted using the AmpFLSTR Identifiler PCR Amplification Kit (Applied Biosystems). Profiles positively matched with those reported in the literature for 2102Ep [7], and obtained from EACC/HPACC (for 833KE), ATCC (for NTERA2, NCCIT, and TERA1), the Wisconsin International Stem Cell Bank (H7, H9, and H14), and the UK Stem Cell Bank (Shef3, Shef5, Shef6, and Shef7).
Thirty-six testicular tissue samples were included in the study, including 5 normal testicular parenchyma, 6 premalignant intratubular germ cell neoplasia (IGCN; also known as carcinoma in situ), and 25 primary TGCT samples representing the histological subtypes EC (n=8), seminoma (n=8), choriocarcinoma (n=1), yolk sac tumor (n=4), and teratoma (n=4). The biobank is registered according to Norwegian legislation (no. 953; Biobank Registry of Norway) and the project has been approved by the National Committee for Medical and Health Research Ethics (S-05368 and S-07453b).
Fluorescence-activated cell sorting for pluripotent cells
All EC and ES cell lines were sorted for expression of the pluripotency marker SSEA3 before microarray analyses. Cells were collected in the fluorescence-activated cell sorting (FACS) buffer [phosphate-buffered saline (PBS)/5% fetal calf serum (Gibco)] following trypsinization, and 107 cells used as input. Cells were incubated with an anti-SSEA3 primary antibody (produced in-house) for 30 min at 4°C before washing 3 times with the FACS buffer. Cells were then incubated with the Caltag® goat anti-mouse fluorescein isothiocyanate (FITC)-conjugated secondary antibody (Invitrogen, 1:100) before washing again with the FACS buffer and analysis and sorting on the MoFlo (Beckman Coulter). Cells expressing SSEA3 were collected, washed once with PBS, and stored in RNA later (Qiagen) until RNA purification.
RNA and DNA extraction
Total RNA and genomic DNA were simultaneously isolated from the cell pellets using the AllPrep DNA/RNA Mini kit (Qiagen) according to the manufacturer's instructions, and RNA and DNA quality assessed on a Bioanalyzer (Agilent Technologies). Total RNA from patient tissue samples was previously isolated by grinding the tissue in liquid N2 before isolation using Trizol (Life Technologies) [17].
Exon-level expression analysis
One μg of high-quality (RNA Integrity numbers 8.1–10.0) total RNA was used as input for the Affymetrix GeneChip Whole Transcript (WT) Sense Target Labeling Assay. Briefly, each sample was subjected to ribosomal RNA reduction, first round first- and second-strand cDNA synthesis, cRNA synthesis, second round single-stranded (ss) cDNA synthesis, ss cDNA fragmentation, and labeling according to protocol. Five μg of biotin-labeled ss cDNA was hybridized overnight at 45°C to each Affymetrix Human Exon 1.0 ST microarray before washing, staining, and scanning again according to protocol.
Data processing and statistics
The Robust Multiarray Average (RMA)-Sketch workflow in Expression Console™ v1.1 (Affymetrix) was used to generate probe set summarization CHP files, which are 17,617 quantile-normalized, background-corrected log-scale gene-level summaries for the core probe sets from cell intensity (CEL) files. CHP files were uploaded into Qlucore Omics Explorer v2.0 (Qlucore) for exploratory principal components analysis (PCA), as well as a panel of 33 CEL files from 11 different normal tissue types (3 samples per tissue type) downloaded from
The DAVID Bioinformatics Resources v6.7 (
Expression data from the resulting significant genes was compared with DNA copy number data generated from DNA isolated from the same cell pellet of all 11 SSEA3-sorted EC and ES cell lines in this study. This complete data set will be published elsewhere (Alagaratnam et al., unpublished). Briefly, CEL files from Affymetrix SNP6.0 arrays were used as input for the DNA Copy Number workflow in Partek Genomics Suite (Partek). This adjusted intensities for probe bias, summarized and normalized allele intensity, and finally created unpaired copy number using the built-in 270 HapMap reference. Default parameters within the segmentation algorithm in Partek were used to detect amplifications and deletions across the genome. These aberrations were tested for association with the EC/ES phenotype, and filtered with a cutoff FDR-adjusted P-value of<0.05. PASW Statistics 18 was used to perform Mann–Whitney testing.
Validation of transcript variants
A list of alternative EC/ES exon usage events ranked by the P-value was generated using XRAY, and all exonwise profiles for genes with one or more exons with an FDR-adjusted P-value<10−2 were examined by eye to identify candidate differential transcript variants. This process excluded complex splicing events involving multiple events in a single gene, and potential false positives where the exonwise plots revealed substantial overlap in EC/ES exon expression. Reverse transcriptase-polymerase chain reaction (RT-PCR) primers PCR with 6-FAM fluorescence tags (MedProbe) were designed using Primer3 software (
Results
Gene-level differences between EC and ES cells
Affymetrix Human Exon 1.0 ST microarrays were used to generate gene expression data at exon resolution for 5 EC and 6 ES cell lines. To ensure that only undifferentiated cells were profiled, all cells were flow cytometrically sorted for expression of the pluripotency marker SSEA3 before preparation of RNA for microarray analysis. Separately, to probe gene expression differences that relate to culture conditions, 3 EC cell lines were also cultured under ES cell conditions, namely, on feeders in the ES cell medium. Table 1 shows the percentage of SSEA3-positive cells for all 14 samples (median 69.3%).
EC, embryonal carcinoma; ES, embryonic stem.
The exon-resolution expression data were summarized per gene giving a high-confidence gene expression level for 17,617 annotated genes in all samples. To determine which genes define the character of the 11 EC and ES cell lines profiled, we compared gene expression between these 11 cell lines in 1 group, and another group combining an in-house generated exon microarray data set of 6 colorectal cancer (CRC) cell lines as well as 33 normal tissue samples. The 6 genes that showed the most significant differential expression between these 2 groups (adjusted P-value<10−28) all had known functions involving pluripotency and/or embryonic development: DNMT3B, NANOG, POU5F1, LIN28, DPPA4, and the let-7 target IGF2BP1.
We performed PCA to visualize the relatedness between overall gene expression profiles of the different cell types (Fig. 1). Filtering by variance (σ/σmax) up to a value of 0.84 for the 33 normal tissue samples, 6 CRC cell lines and the 11 EC and ES lines required 14 out of 17,617 genes for separation of the 3 main groups (Fig. 1A). These included the genes LIN28 and TDGF1 (teratocarcinoma-derived growth factor 1), as well as 8 cytoskeleton and/or structural protein genes. The EC and ES cell lines formed one tight cluster and the CRC cell lines another, whereas the normal tissue samples exhibited a greater spread, though distinct from ES/EC and CRC clusters.
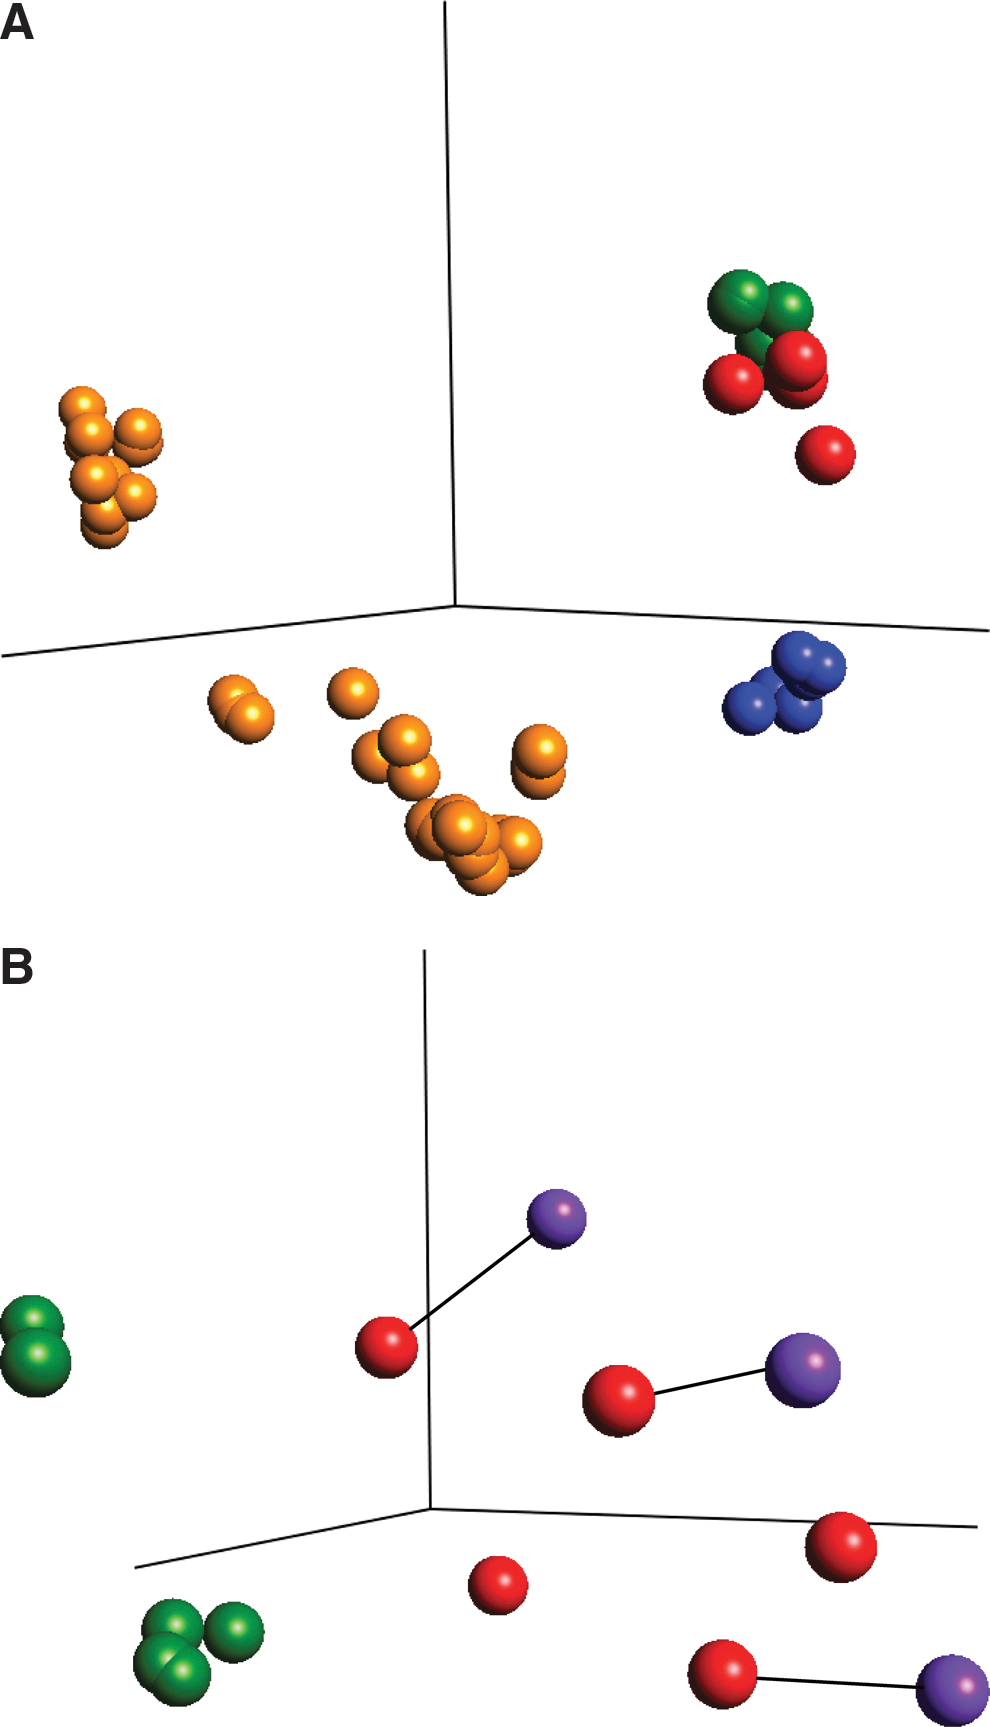
Overall features of the gene expression profiles. Principal components analyses were applied to visualize the relatedness of
A PCA analysis of only EC and ES lines, including the 3 EC cell lines NTERA2, 2102Ep, and 833KE that had been cultured under ES conditions, revealed that the cell line identity had more impact on the general gene expression profile than did growth conditions (Fig. 1B). However, the EC and ES cell lines clustered clearly separately, and the EC cells grown under ES conditions localized as pairs with the same line grown under standard conditions (indicated by black lines in Fig. 1B). Both subclusters of ES lines contained Shef and H lines, so the split did not reflect the laboratory of origin. The spread among the EC lines may be reflected either to the differing extent of pluripotency of the different lines, and/or the different anatomical location/metastatic grade of the tumor from which the cell lines were originally derived.
To identify which genes had expression affected by growth conditions, we performed a pairwise SAM analysis for the 3 EC lines grown under the 2 sets of conditions. This returned a list of 22 genes (with an FDR of 5%) that appeared to be affected by culture conditions, and should be treated with caution in subsequent analyses (Table 2). Twenty of these, including DPPA3, were upregulated, while 2 were downregulated when the EC cells grown on plastic without feeders were compared to EC cells grown on feeders. The extent of the difference in the DPPA3 expression level between EC and ES is probably only minimally due to differences in culture conditions, as expression went up by only 0.22-fold in EC cells grown on plastic compared to feeders, while a fold-change of 60 was observed between EC and ES cells.
SAM, significance analysis of microarrays; FDR, false discovery rate.
To discover which genes were differentially expressed between EC and ES cells, 2 different software packages were applied: ANOVA-based XRAY specifically for exon microarrays, and linear model-based limma. Combining the 100 most differentially expressed genes identified by XRAY and limma, as ranked by their FDR-adjusted P-values, resulted in 172 unique genes. This corresponded to adjusted P-values below 2.45×10⁻² and 4.5×10⁻³ for XRAY and limma, respectively. Twenty-eight genes of the 172 genes were common to both lists, and as such, have high confidence of being differentially expressed between EC and ES cells (Fig. 2, Table 3). Of these, 17 genes had a stronger expression in EC compared to ES cells, and 11 genes had a weaker expression.
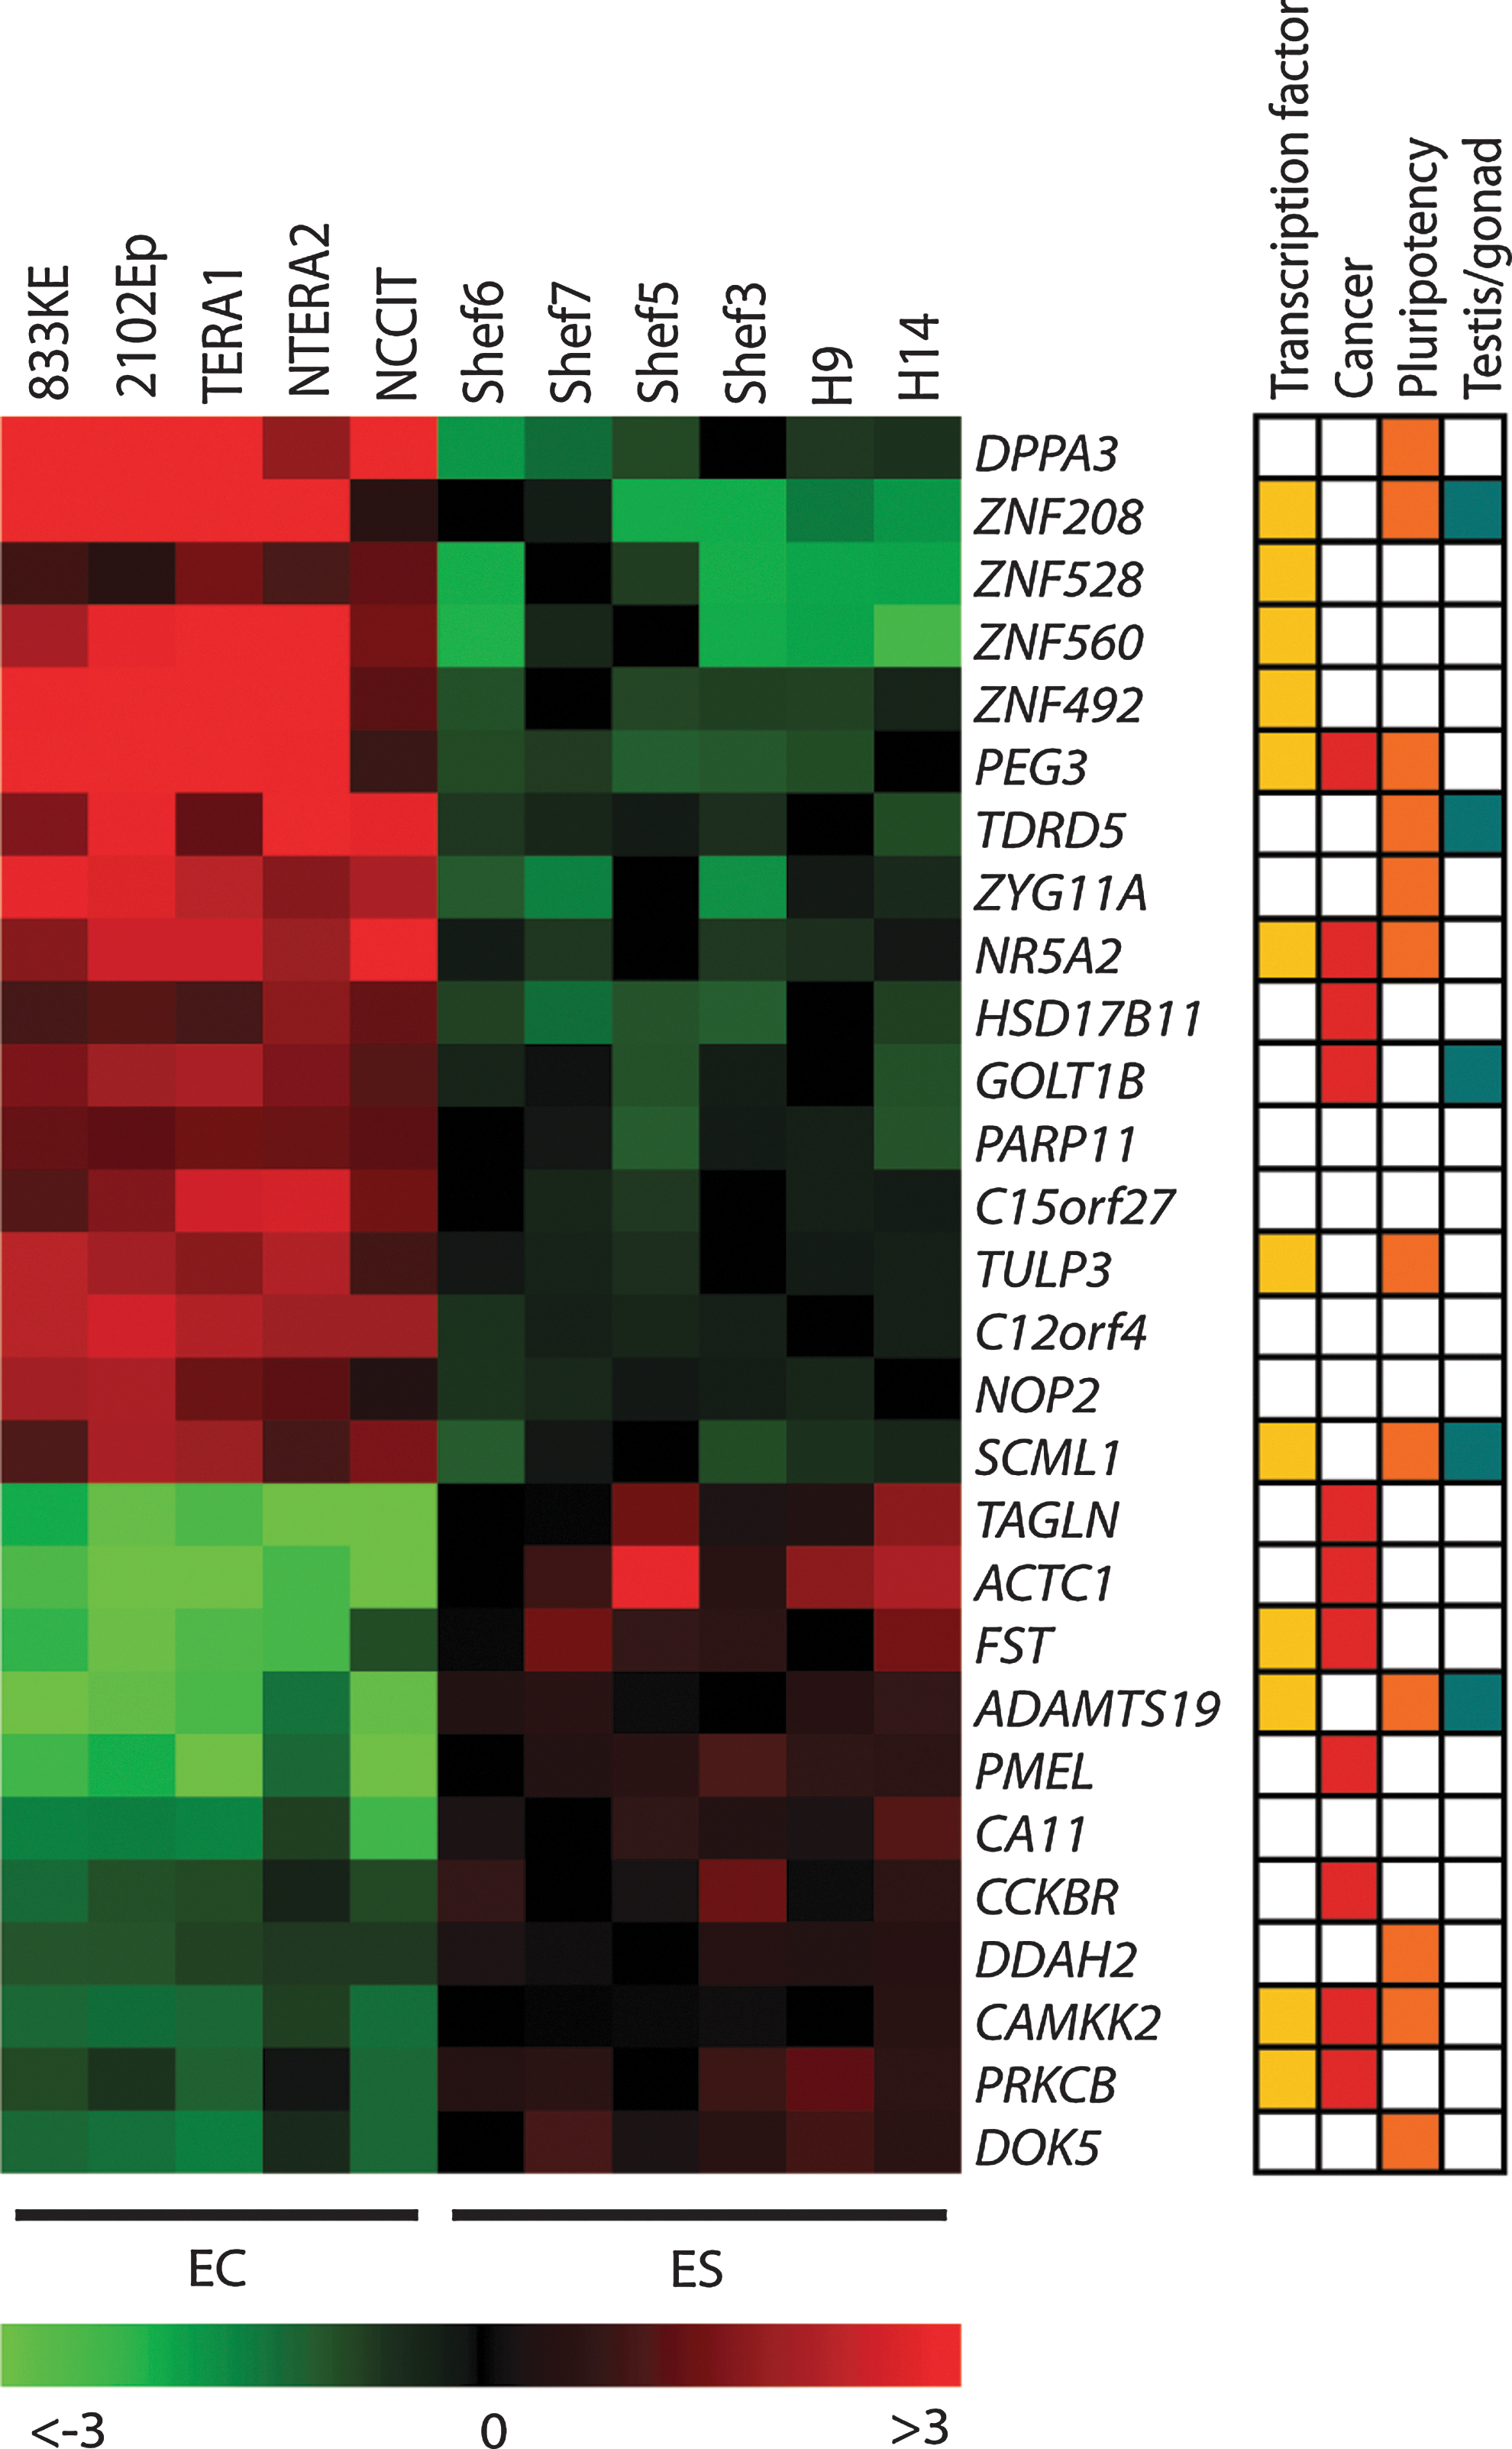
Differentially expressed genes between EC and ES cell lines, and selected associated roles. Genes are clustered for improved visualization. Color images available online at
Gene description, mRNA expression fold change, and presence of DNA copy number change are indicated. DNA copy number gain or loss in 2 or more EC or ES cell lines are listed in the final column, and light gray indicates copy number gain with concordantly stronger gene expression, while dark gray indicates copy number loss with concordant weaker gene expression.
PEG3 is the only gene showing discordance with higher expression levels in EC cells as compared to ES cells, but mapping to a region of loss in 3/5 EC cell lines.
To examine the functions of these 28 genes, we applied the DAVID Functional Annotation Chart tool, which returned regulation of transcription as the most significantly enriched category (enrichment P-value=8×10⁻³; Fig. 2). Ten of the 28 genes encoded transcription factors (yellow boxes, Fig. 2). Given the cell lines' identities, we also ran PubMed batch searches using the terms ‘cancer’ and ‘pluripotency’ (
Since EC cells, in common with other TGCT subtypes, are known to display a range of karyotypic abnormalities [13], we checked the DNA copy number data for the genes reported here in an array-comparative genomic hybridization data set for all 5 EC and 6 ES cell lines, generated from DNA simultaneously isolated as the RNA used for the exon arrays (Alagaratnam et al., unpublished). Thirteen of the 17 genes with higher expression in EC as compared to ES cells showed concomitant gain at the DNA copy number level in 2 or more of the EC cell lines. Two of the 11 genes with lower expression in EC cells had DNA copy number loss in 2 or more cell lines (Table 3).
Expression of 25 and 21 of the 28 genes was validated in 2 separate data sets consisting of normal testicular tissue and primary EC samples. In one data set [21], 5 genes, HSD17B11, DPPA3, NR5A2, GOLT1B, and C12orf4, were stronger expressed in at least 13 out of 15 primary EC tumors than the median of the 5 normal testis samples, while FST had lower expression than the median of the normals. In the second data set [17], 4 genes, NR5A2, GOLT1B, C12 orf4, and ADAMTS1, were stronger expressed in all 5 primary EC tumors than the median of the 3 normal testis samples, while 4 genes, SILV, CCKBR, PKRCB1, and DOK5, had lower expression than the median of the normals. Altogether, GOLT1B, NR5A2, and C12orf4 were changed in the same direction as in the EC/ES model in the primary EC samples across both data sets (Fig. 3). Mann–Whitney testing of the combined normal and primary EC samples from the 2 datasets showed the difference in expression in these 3 genes to be significant (P<0.05).
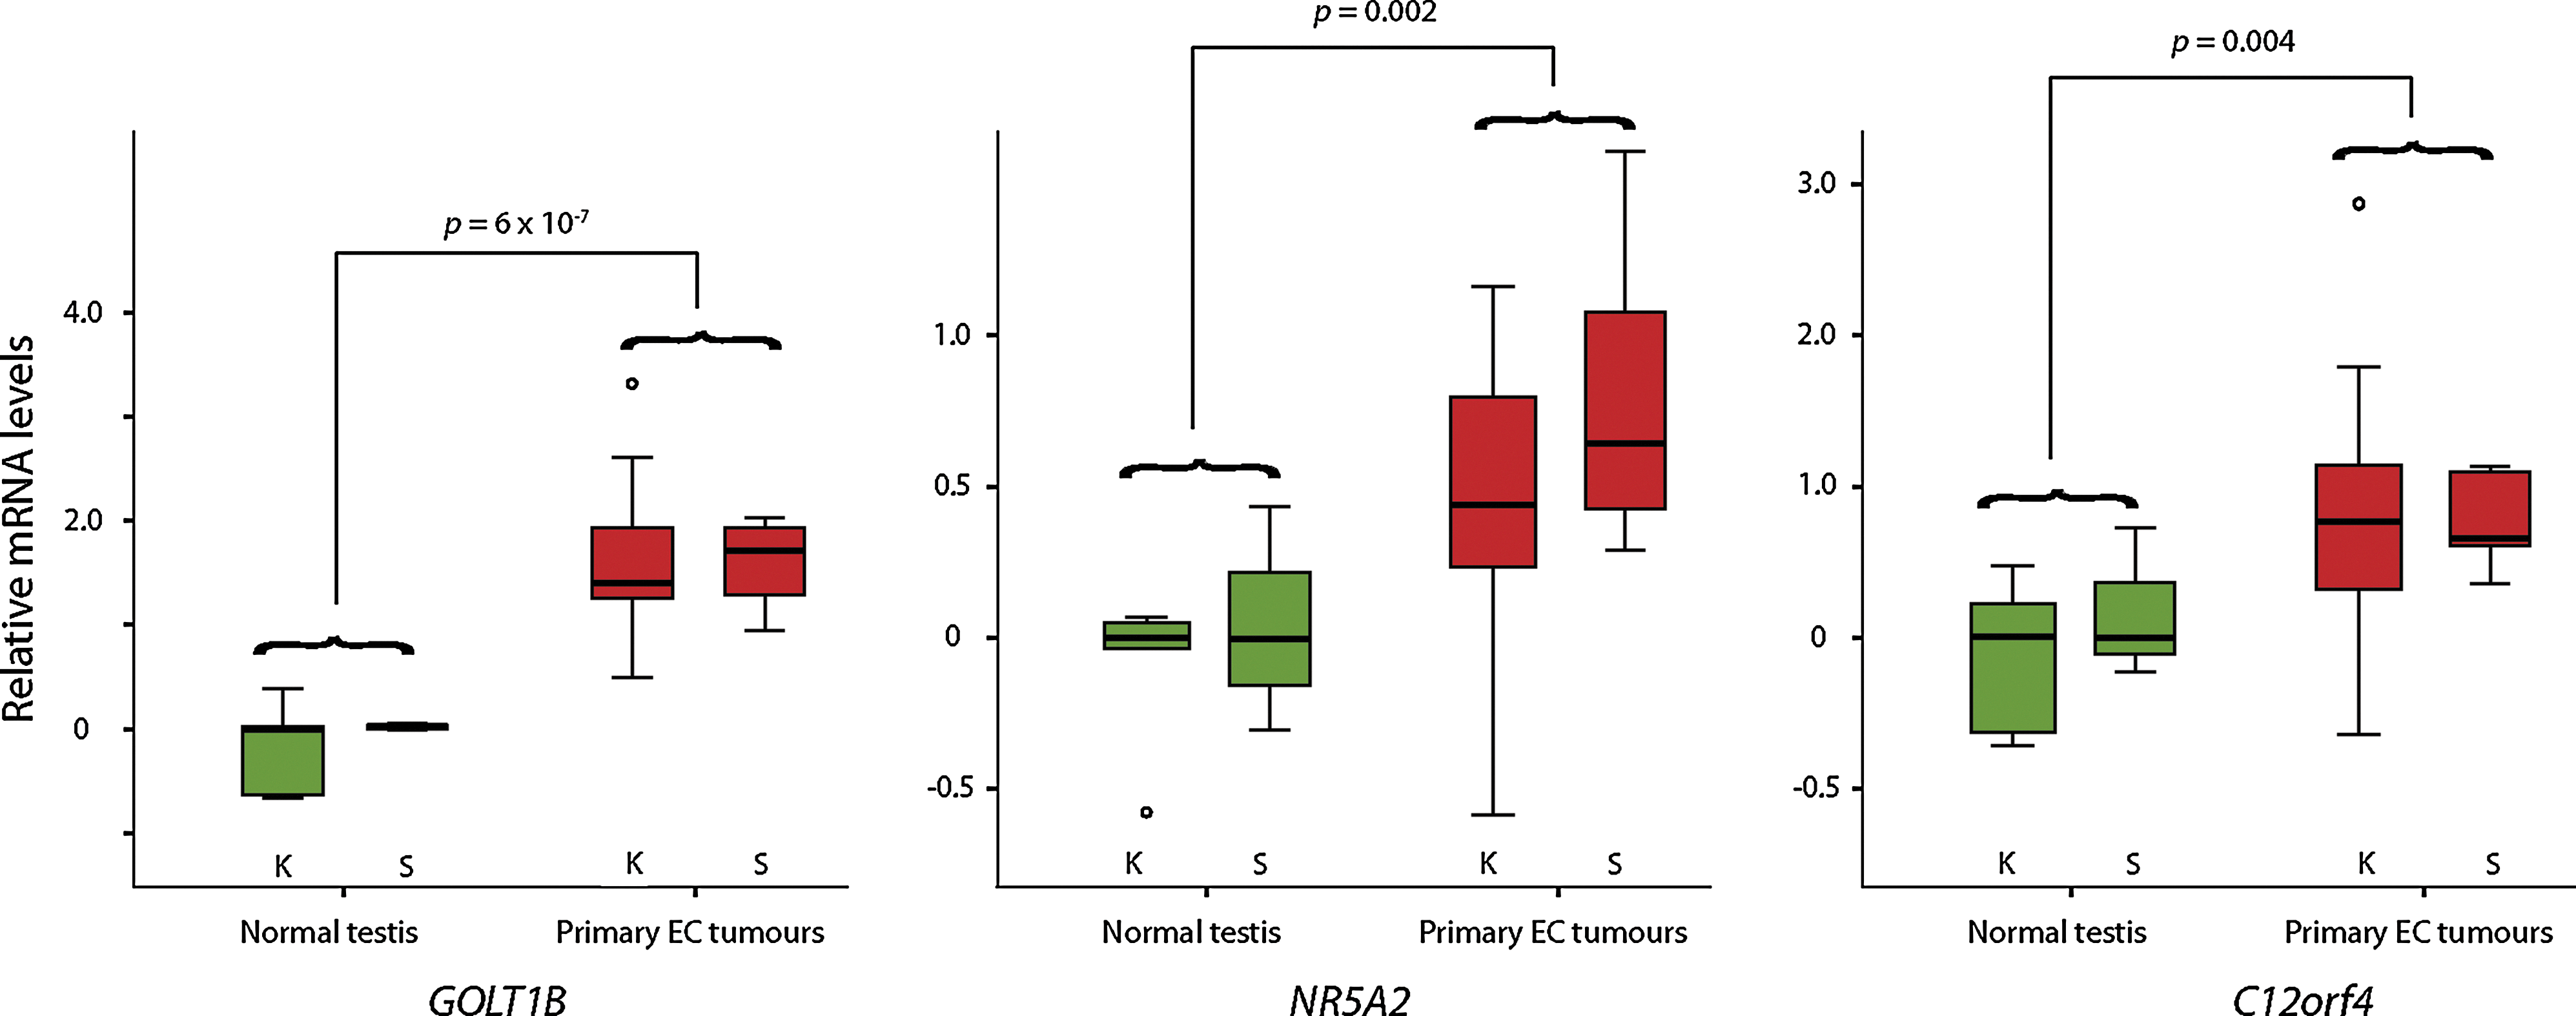
GOLT1B, NR5A2, and C12orf4 are differentially expressed in normal testicular tissue and primary EC tumors. The expression values originate from 2 independent microarray data sets, where K indicates the Korkola et al. data set [21] and S the Skotheim et al. data set [17]. Expression values were centered on the median of the normal testicular samples for each of the data sets before log2 transformation. Color images available online at
Alternative splicing and promoter usage between EC and ES cell lines
Potential alternative splicing events between EC and ES cells were identified and ranked by their FDR-adjusted P-value in XRAY. Visual inspection of the exonwise expression profiles resulted in a shortlist of 30 candidates, all of which were entered into an RT-PCR-based validation pipeline. For 5 of these, ASH2L, DNMT3B, ETV5, PMF1, and ZNF195, the presence of transcript structures indicated by the exon microarray data was positively validated by RT-PCR.
There was substantial variation in exon probe set intensities for the diverging exons, especially for the EC lines. This is exemplified by the exonwise plot of DNMT3B (Fig. 4A). We probed for the presence of the 2 different DNMT3B transcripts with and without exons 20 and 21 by capillary electrophoresis of fluorescently labeled PCR products (Fig. 4B; inset), and found that neither transcript was exclusive to EC or ES cells. Rather, both transcripts were present at different ratios in each individual cell line (Fig. 4B). This was true for all the transcript variants we validated (data not shown for PMF1 or ZNF195). The variation of the expression ratios between the 2 variants of DNMT3B was much larger among the EC cell lines compared to the ES cell lines, where NCCIT and NTERA2 showed transcript ratios that were particularly skewed toward the transcript excluding exons 20 and 21 (Fig. 4B).
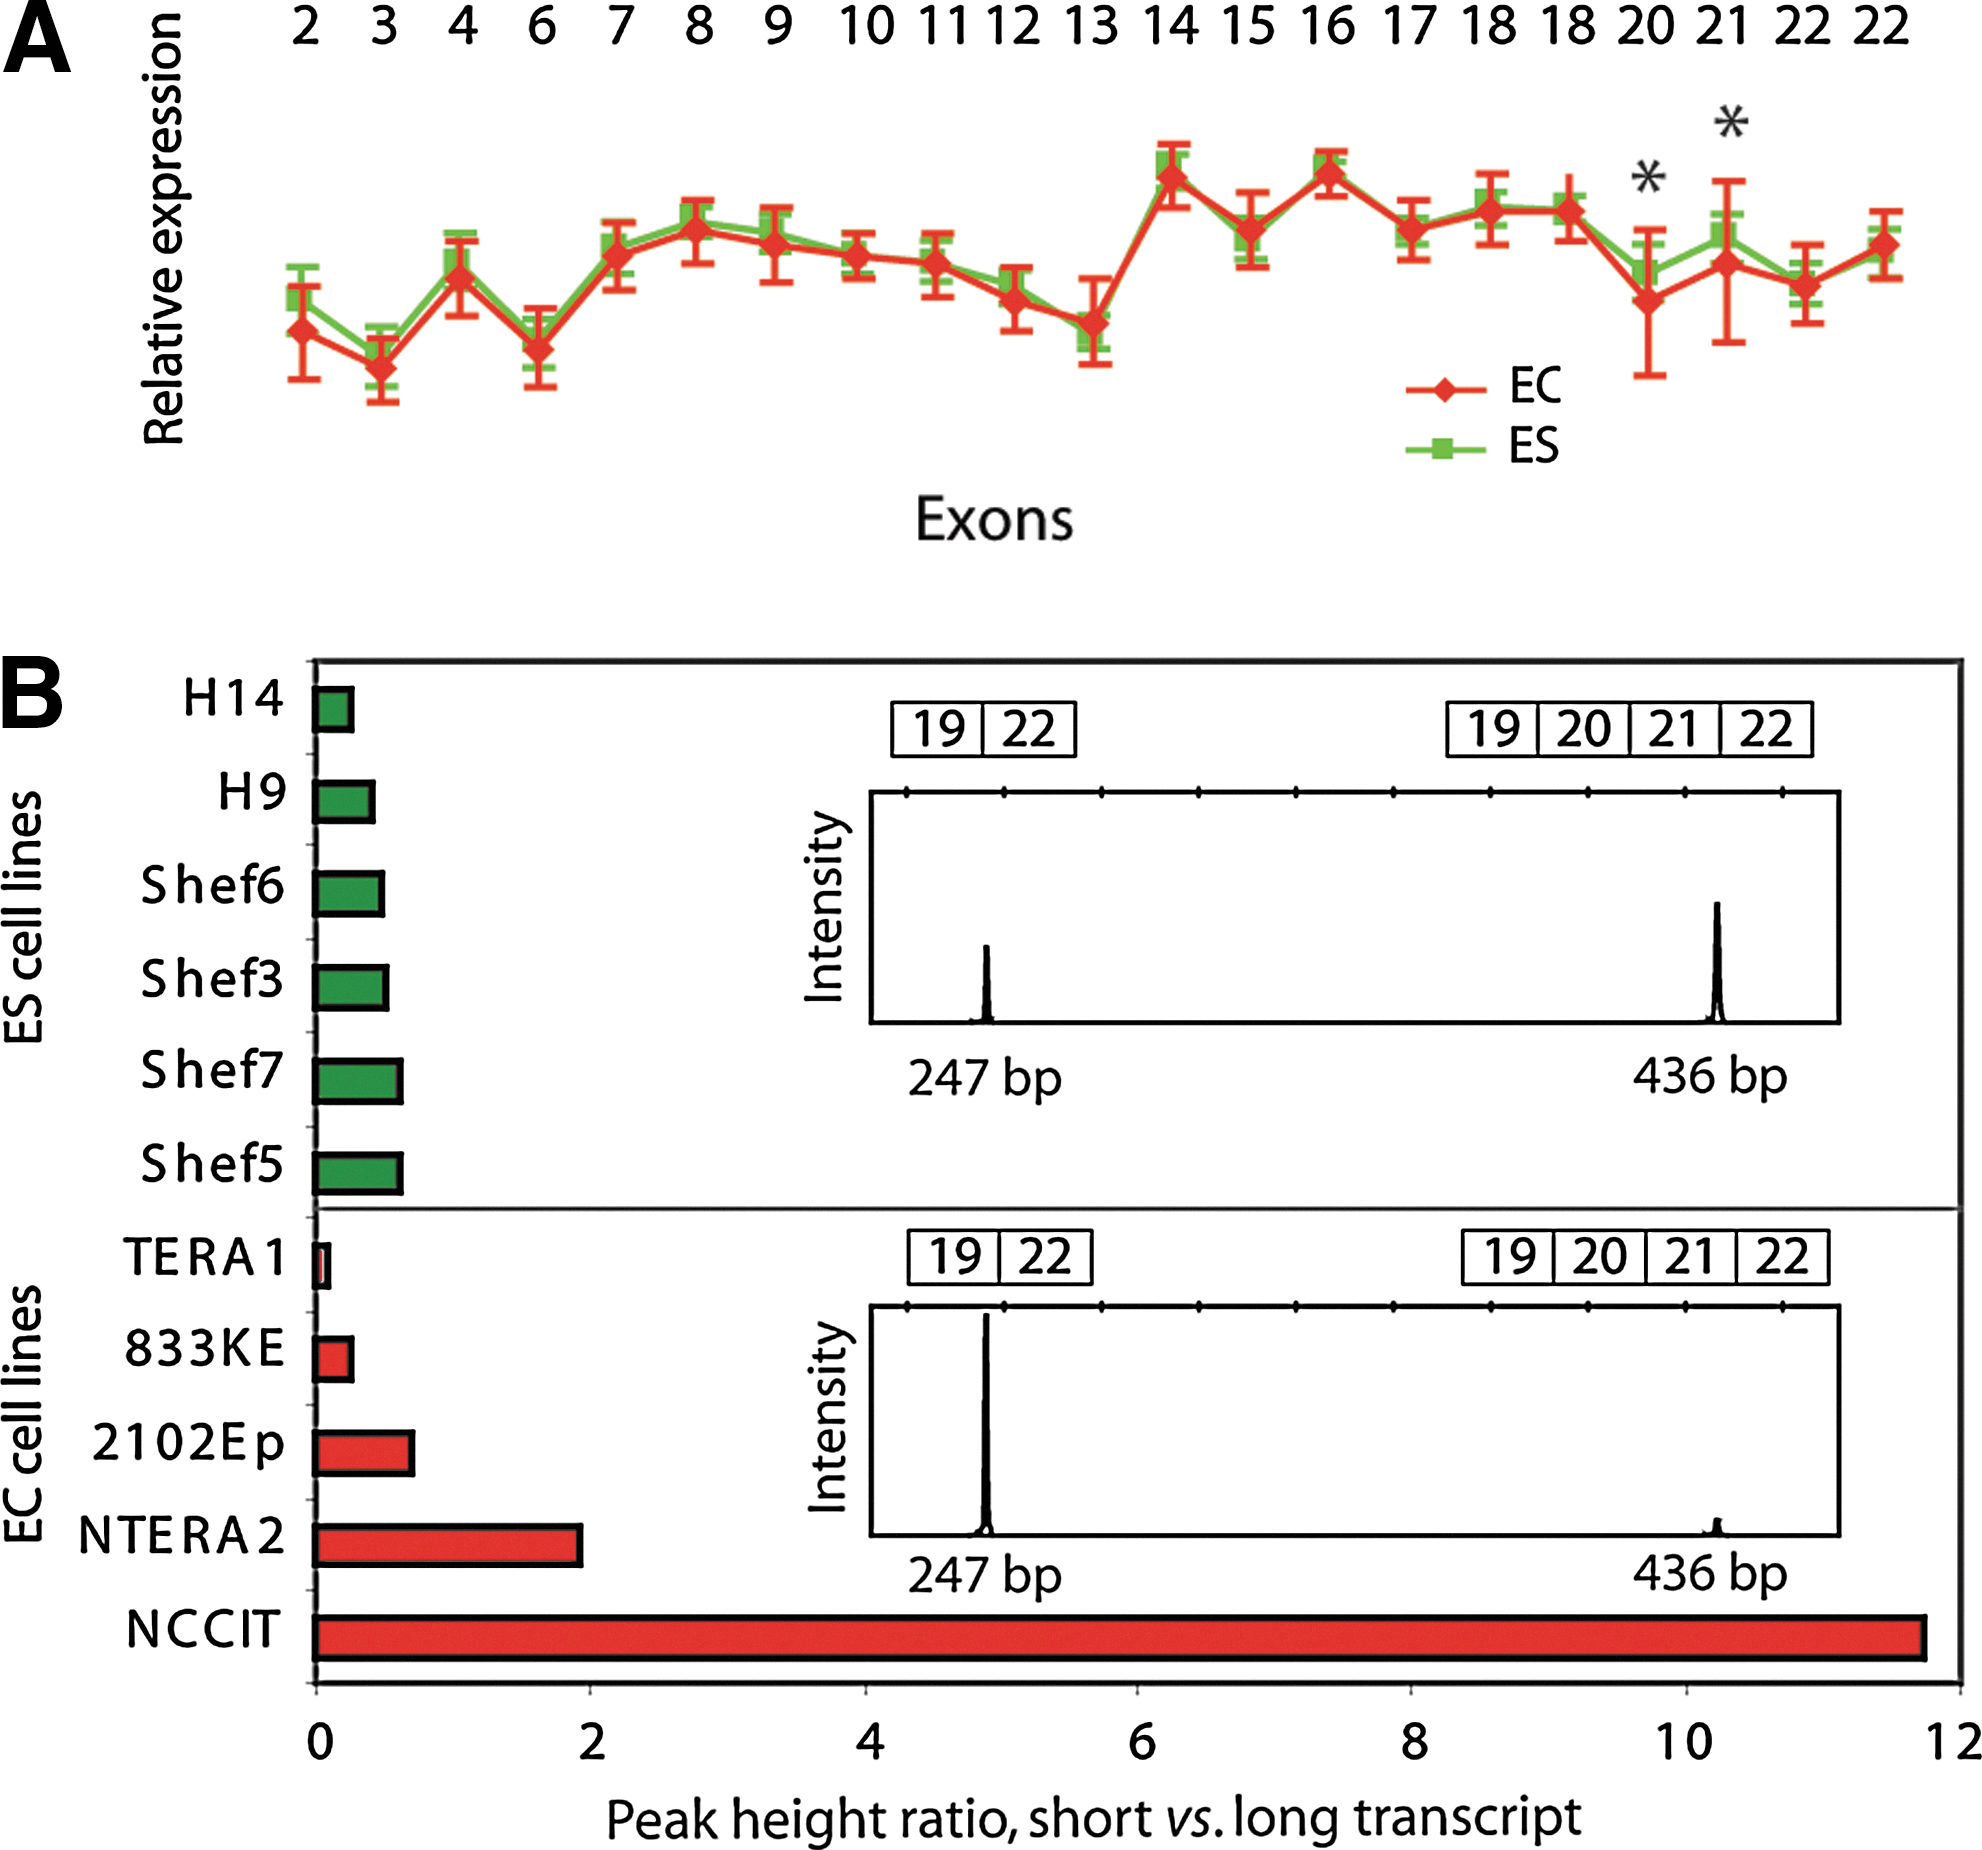
Differential ratios of DNMT3B transcript usage between EC and ES cells.
Two of the differential exon-level events we validated, in ASH2L and ETV5, were caused by alternative promoter usage. The exonwise profile for ASH2L indicated that EC and ES cells express the gene predominantly from different promoters, where ES cells use exon 1B at a significantly lower level than EC cells (Fig. 5A and B; P=0.03). For ETV5, a subset of nullipotent EC cell lines (2102Ep, 833KE, and TERA1) showed a marked increase in relative expression in the 3′ part of the gene, starting between exons 6 and 8. Sequence alignment of the nested 5′-RACE PCR product designed to detect all sequences upstream of exon 8 returned only sequences from exons 7 and 8 of ETV5 itself, indicating transcription from an alternative promoter than the ES cells, close to exon 7 (Fig. 5C). By real-time RT-PCR, we confirmed that the specific transcripts were differentially expressed between the nullipotent EC and ES cell lines (Fig. 5D; P=0.005). We further explored the transcript ratios of ASH2L and ETV5 in a panel of 36 testicular tissue samples, including normal testicular parenchyma, premalignant IGCN, and the different TGCT histological subtypes. In general, the ECs and seminomas had ratios similar to the EC cell lines, while the choriocarcinomas, yolk sac tumors, and teratomas had transcript ratios similar to the ES cell lines (Fig. 5).
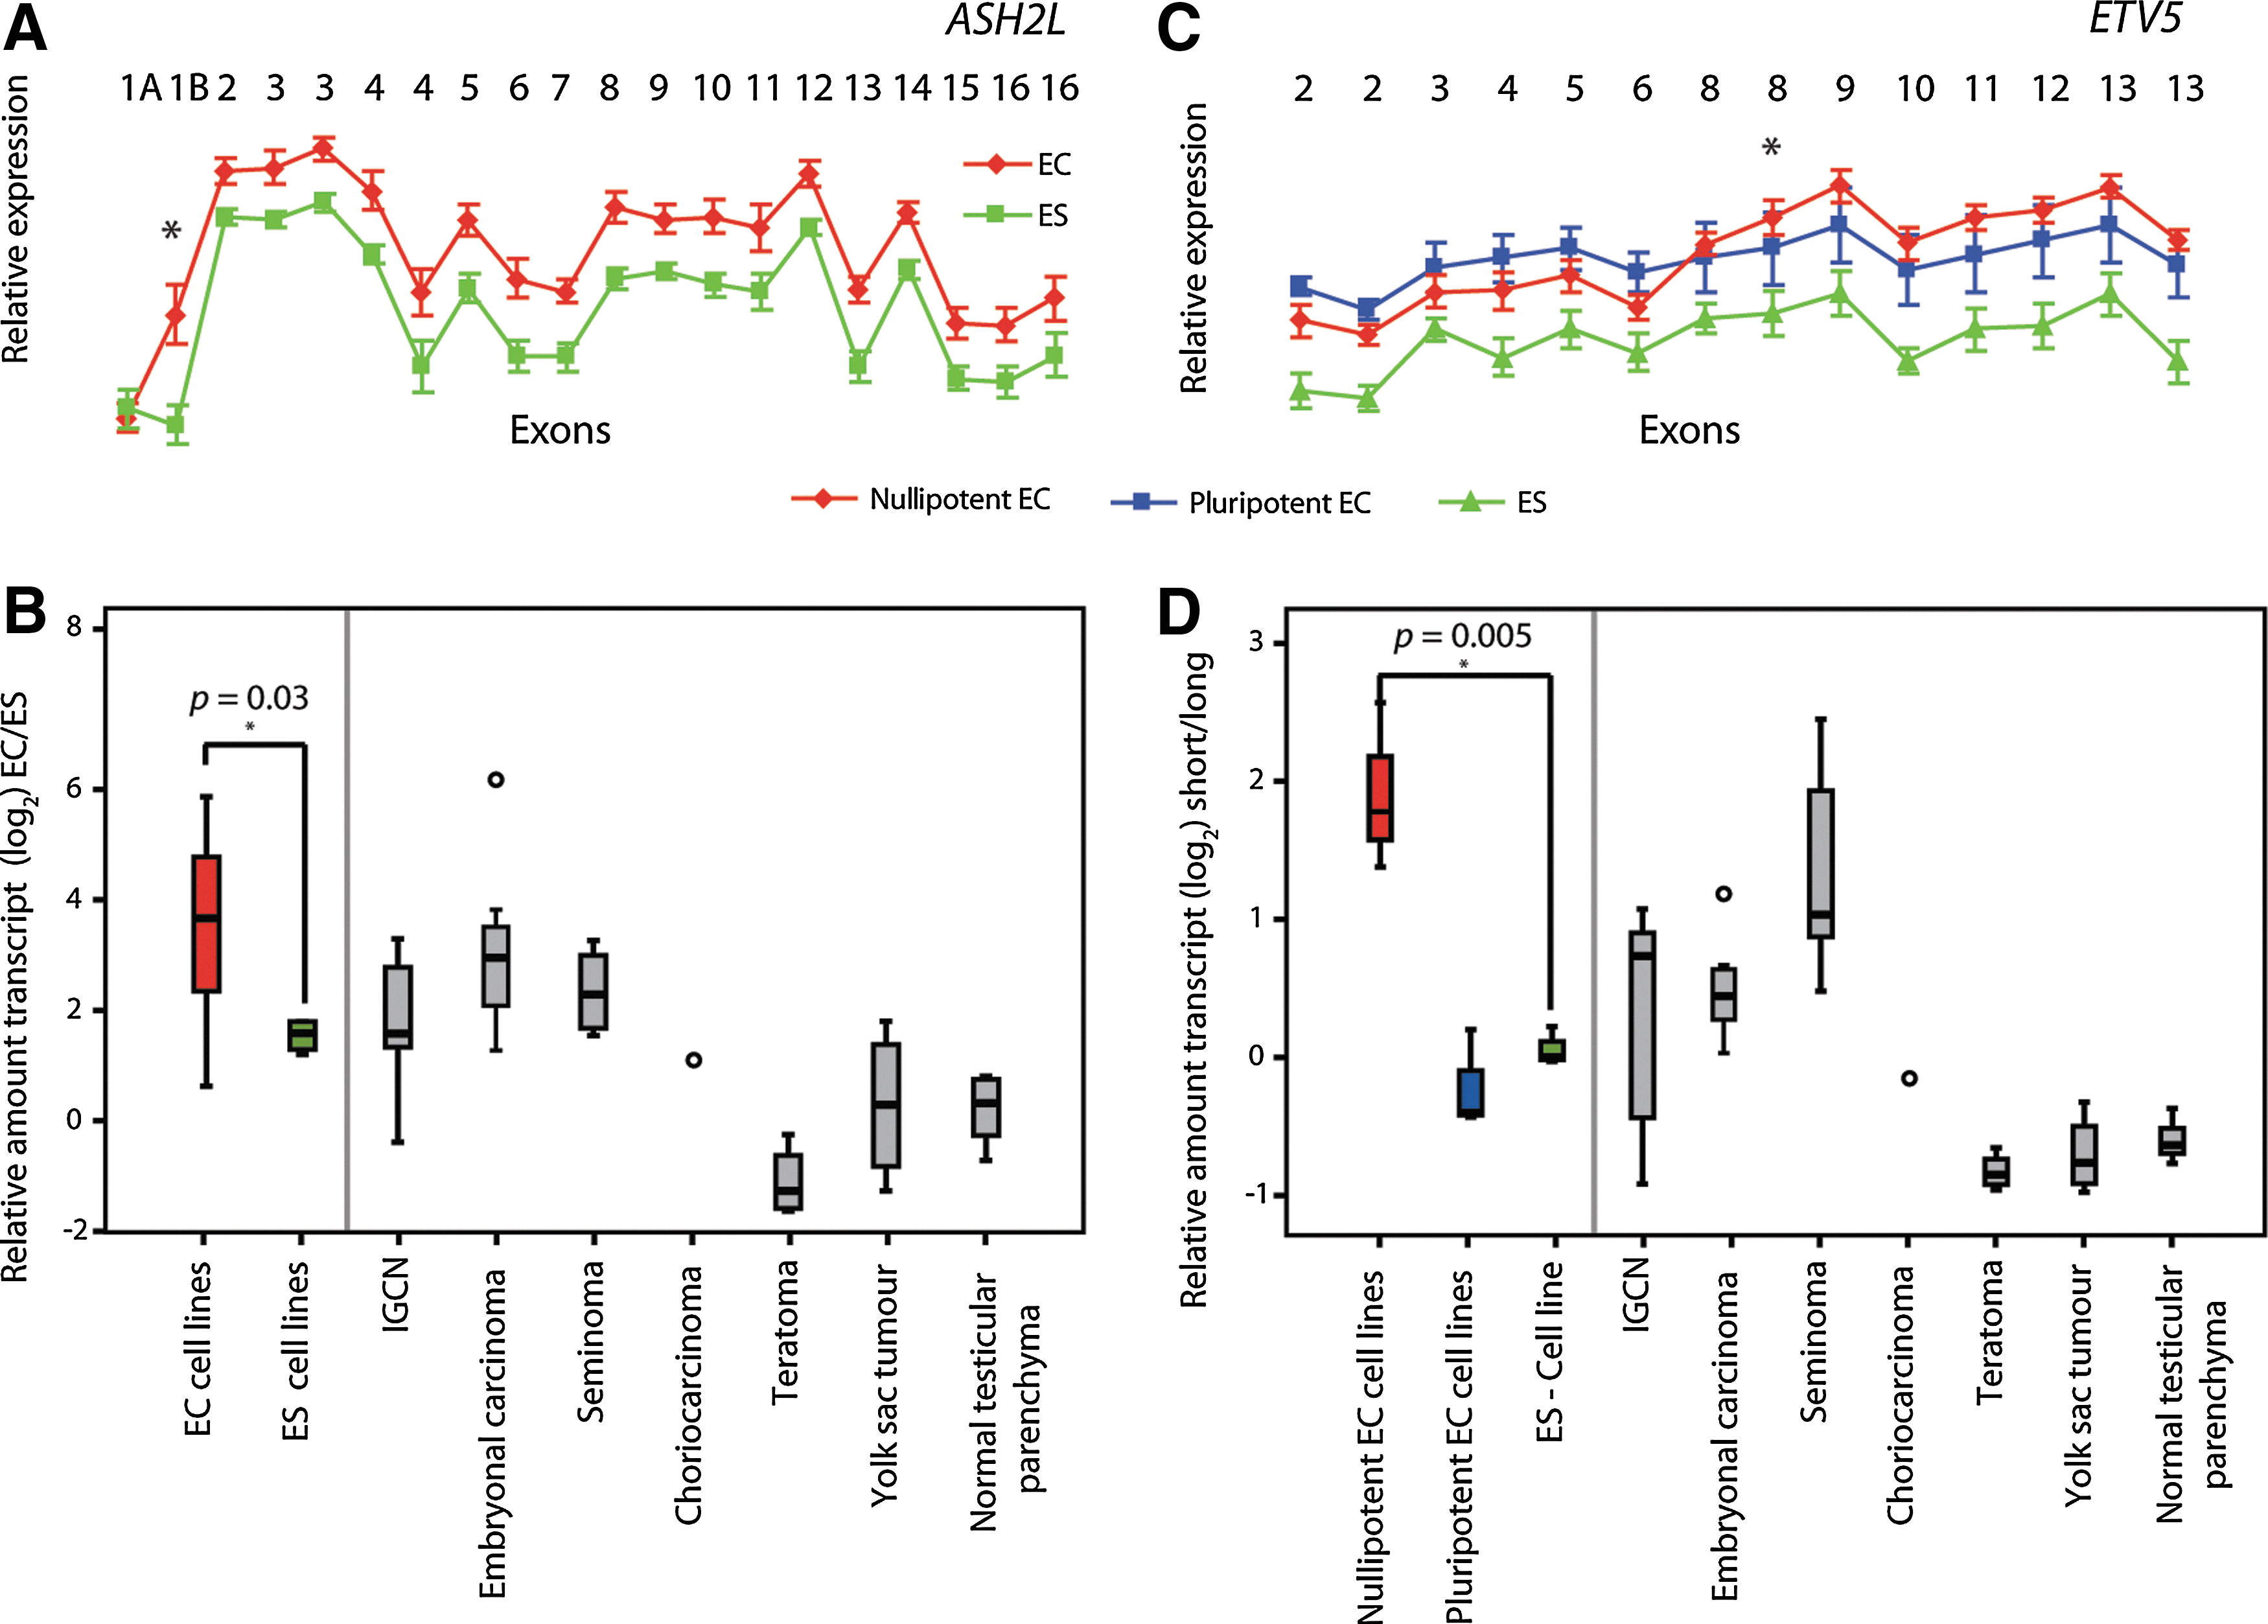
Differential promoter usage in ASH2L and ETV5.
Discussion
The identification of candidates involved in cancer transformation is often hindered by the difficulty of isolating the normal counterpart for comparison. The attempts made to date in the context of CSCs underline the challenges in accessing the appropriate cell populations. Various studies in breast [22], lung [23], and colon [4] cancer cell lines utilize markers of largely unknown function to merely enrich for a tumor-initiating subpopulation. Other more successful studies purify normal and CSCs directly from patient material, for example, for acute myeloid leukemia [5] and prostate cancer [24], but the issues of marker specificity and population purity remain.
The comparison of EC and ES cells provides a convenient model for overcoming these concerns. However, the issues of cell population heterogeneity and culture conditions have not been addressed in any of the previous proteomic [25] and lower resolution transcriptomic EC-ES comparisons to date [8,26]. Pluripotent cells, such as ES cells, but also some EC cells, can differentiate spontaneously, so that cultures are often heterogeneous, and gene expression profiles may reflect a mixture of undifferentiated and differentiated cell types. Here, we chose to sort all EC and ES cells for expression of one of the earliest markers to disappear during ES cell differentiation, SSEA3 [27], thus ensuring that only the well-defined, predominant population of pluripotent cells is profiled (see Table 1).
Culturing of ES cells on feeder layers in modified media may induce long-lasting and confounding gene expression changes [27]. Comparing EC cells grown on plastic and on feeders in the ES cell medium helped us address and delineate this issue. Given that the expression patterns from EC cells grown on plastic and feeder layers cluster in pairs based on cell lines (Fig. 1B), growth conditions appear to contribute less to the overall gene expression than the individuality of the cell lines. DPPA3 was one of the few genes significantly upregulated in plastic as compared to feeder-grown EC cells (Table 2), and was also found upregulated in the plastic-grown EC compared to feeder-grown ES cells (Table 3). This gene is a marker of pluripotency and is expressed in ES cells [28], primordial germ cells [29], and adult GCTs [30]. However, this analysis shows that its overexpression in EC cells—and the other genes similarly identified (Table 2)—should be treated with caution.
Summarizing exon-level data to a single value per gene has been shown to increase the reliability of the gene-level data [31], and global gene expression profiles of EC and ES cells proved to be very similar to each other when compared to colon cancer cells and healthy tissues (Fig. 1A). By subjecting the expression profiles of EC and ES cells to 2 different statistical approaches, however, we were able to identify a set of 28 reliably differentially expressed genes (Fig. 2). The association of many of these genes to cancer, stemness, and testis function is not unexpected, given the testicular cancer and pluripotency background of the samples. However, systematic inspection of the candidate genes revealed a significant overrepresentation of transcription factor-encoding genes.
The differentially expressed genes also included the tumor suppressor TAGLN [32], as well as 2 genes with known oncogenic action: PRKCB, knockdown of which blocked androgen receptor-induced tumor cell proliferation in vitro and in vivo in a prostate cancer model [33], and CCKBR, whose overexpression promoted tumor formation in colonic epithelial cells [34]. GOLT1B and HSD17B11, both upregulated in EC cells, were previously found upregulated in testicular [35] and prostate [36] cancers, respectively, while ACTC1, downregulated in EC compared to ES cells, was recently reported downregulated in urinary bladder cancer [37]. Additionally, of the 4 differentially expressed genes found overexpressed in primary TGCTs (Fig. 3), GOLT1B had been identified in a previous study as being overexpressed in seminomas [35], while the β-catenin target nuclear receptor NR5A2 has recently been shown to act as a functional substitute for POU5F1 in reprogramming somatic cells to induced pluripotent stem cells [38].
The canonical WNT-signaling pathway exemplifies the delicate balance between self-renewal and malignancy. β-catenin mediates the state of nondifferentiation in both embryonic and adult stem cells and keeps proliferation in check [39]. In contrast, abnormal WNT-signaling can cause degenerative disease and tumor formation [40]. In that context, it was interesting that we found 2 genes associated with the WNT-signaling pathway, PEG3 and NR5A2, overexpressed in EC cells. Although PEG3, known to encode a WNT inhibitor [41], did not show a corresponding pattern of overexpression in the primary TGCTs (Fig. 3), NR5A2 did. Overexpression of the latter has also been reported in breast [42] and colon [43] cancers, where it exerts its effects by mechanisms as diverse as cell cycle control, inflammation, motility, and invasion.
Overexpression of NR5A2 in pluripotent EC cells may elucidate a novel tumorigenic role by disruption of proliferation control. Nr5a2 was identified as a β-catenin target gene, which mediates pluripotency via Oct4, Nanog, and Tbx3 in mouse [44]. It was also recently shown to be the only factor capable of replacing Oct4 in its reprogramming role to generate mouse induced pluripotent stem cells, by direct interaction with Nanog, Klf5, and c-Myc [38]. Furthermore, NR5A2 is significantly downregulated upon differentiation of ES cells toward embryoid bodies [45]. Finally, a genome-wide screen in mouse identified Nr5a2 as an inducer of pluripotency in epiblast stem cells, potentially by an alternative mechanism to Oct4 activation [46]. Intriguingly, none of the other reported reprogramming factors POU5F1, NANOG, SOX2, MYC, or LIN28A were identified as differentially expressed between EC and ES cells, despite the fact that at least the first 4 are gene targets of Nr5a2 [38]. This underlines the complex network of control exerted over the genes determining pluripotency, and in the breakdown of control, tumorigenesis.
Of the 28 genes reliably differentially expressed between EC and ES cells, 13 mapped to corresponding regions of copy number gain, and 2 to regions of loss (Table 3). Overall, there was a significant overrepresentation of genes on chromosome arm 12p (adjusted P-value=6×10⁻⁶ in a cytogenetic band enrichment analysis). Gain of this region is common in culture-adapted human ES cells [11] and almost ubiquitously present in TGCTs [13]. However, only 4 of these genes located here, TULP3, PARP11, C12orf4, and DPPA3, map to smallest regions of overlapping gains in TGCTs, while the 2 others, NOP2 and GOLT1B, do not. Also, although the location on 12p where the postulated TGC tumorigenesis driver NANOG maps was identified as gained in EC cells [14], the differential expression of this gene did not reach the significance threshold used to identify the genes with most reliable differential expression between EC and ES cells in our analysis.
DNA copy number alterations may be a driver for gene expression changes in some, but certainly not all differentially expressed genes. When considering the similarities in DNA copy number profiles between EC cells and adapted ES cells, only some of the genes map to commonly gained regions in both, specifically to chromosome arm 12p. Another cluster of overexpressed genes can be found on chromosome 1 (ZYG11A, TDRD5, and NR5A2), which was also found gained in a subset of adapted ES lines [47]. Finally, no overexpressed genes map to chromosome 17, and only 1 to chromosome X, both regions believed to harbor genes relating to tumorigenesis based on their gain in both EC and adapted ES cells [11,13]. An ongoing integration study of the exon array data with high-resolution copy number data for EC and ES cell lines, both normal and adapted, will help delineate these differences.
This article is the first to compare exon-level transcript expression between EC and ES cells. Surprisingly little difference was found, underlining how similar these cell types are. In fact, none of the validated exon-level differences were mutually exclusive for EC or ES cells. Rather, the transcript variants were found to be present simultaneously in the respective cell lines, but with different ratios, and in a cell line-dependent manner, especially for EC cells. This pattern of transcription may simply reflect reality, where the recent whole transcriptome analysis of a single cell showed that up to 20% of genes with multiple known transcript variants expressed at least 2 isoforms concurrently [48].
The alternative splicing event detected in DNMT3B may have functional consequences. The gene encodes a de novo DNA methyltransferase, which specifically methylates centromeric satellite repeats, and has been implicated in various human cancers [49]. The protein resulting from the predominant EC transcript variant of DNMT3B3 lacking exons 20 and 21 (Fig. 4) has been shown to be enzymatically active [50]. However, the relative presence of this splice variant compared to others, in particular DNMT3B4, was found to significantly correlate with the degree of DNA hypomethylation in pericentromeric satellite regions in hepatocellular carcinoma [51], and suggests a mechanism that EC cells may employ in tumorigenesis, especially for NTERA2 and NCCIT.
The quantitative RT-PCR data on ASH2L and ETV5 (Fig. 5) demonstrate statistically significant differences in relative transcript abundance, illustrating a subtle, but important mechanism by which cells apply an additional level of transcriptional regulation. No functional difference has yet been recorded for the 2 transcripts of ASH2L, which encode a subunit of a histone methyltransferase complex. ETV5 is a member of the ETS family of transcription factors, and both the short and long transcripts of ETV5 contain the functional DNA binding domain. Both these alternative promoter usage events appear to be dependent on the histological subtypes of the TGCTs, although the significance of this remains unclear. Preinvasive IGCN and seminomas demonstrated similar relative expression of the transcript variants as the EC cells, while the teratomas and yolk sac tumors seemed to reflect those of the ES cells (Fig. 5B and D).
Two articles have previously compared EC and ES cells on a proteomic level, for plasma membrane proteins [9] and quantitatively for cell lysates [25], although only 1 EC and 1 ES line were included in each study. Nevertheless, there was some overlap between the differentially expressed proteins and the extended list of 172 differentially expressed genes. Two EC-unique (NDUFA9 and REEP6) and 6 ES-unique proteins (ALCAM, AXL, CYP26A1, LECT1, PMEL, and WBSCR17) from the plasma membrane study [9] were also found differentially expressed in our study, while 4 proteins with more than 2-fold difference between EC and ES cells in the cell lysate study [9,25], ACTC1, COPA, GDF3, and TAGLN, were also found to be significantly different on the gene level in this study.
Finally, it is important to keep in mind that although EC cells are thought to derive from primordial germ cells and ES cells from inner cell mass cells, both have likely transitioned during transformation and adaptation to culture, respectively, such that neither is a true representative of their cell of origin. In fact, it has been suggested that the in vivo cell that ES cells may most closely resemble is an early germ cell [52], with the result that both EC and ES cells may be even more closely related with regard to pluripotency than previously believed. Given that, and the fact that only ECs are malignant, the differentially expressed genes identified here are of particular interest as candidate target genes, while the differentially expressed stemness genes may define the individual cell lines' pluripotent potential, and their malignant transformation. These genes may also have relevance in defining and in the study of CSCs, which are defined by similar self-renewal and differentiation traits.
Footnotes
Acknowledgments
We would like to thank K. Amps, A. Wood, H. Spink, and C. Pigott for their help in culturing the human ES and EC cells lines, and M. Løvf and Z. Yohannes for their help with the 5′-RACE and cloning experiments. We would also like to thank Lyn Healy at the UK Stem Cell Bank for her help in matching STR fingerprints for the Shef ES lines. This study was financed by the Research Council of Norway, the Norwegian Cancer Stem Cell Innovation Center, the Norwegian Cancer Society, and the Medical Research Council of the UK.
Author Disclosure Statement
No conflicts of interest to declare by any of the authors.
References
Supplementary Material
Please find the following supplemental material available below.
For Open Access articles published under a Creative Commons License, all supplemental material carries the same license as the article it is associated with.
For non-Open Access articles published, all supplemental material carries a non-exclusive license, and permission requests for re-use of supplemental material or any part of supplemental material shall be sent directly to the copyright owner as specified in the copyright notice associated with the article.