
Abstract
Tissue engineering and cell implantation therapies are gaining popularity because of their potential to repair and regenerate tissues and organs. To investigate the role of inflammatory cytokines in new tissue development in engineered tissues, we have characterized the nature and timing of cell populations forming new adipose tissue in a mouse tissue engineering chamber (TEC) and characterized the gene and protein expression of cytokines in the newly developing tissues. EGFP-labeled bone marrow transplant mice and MacGreen mice were implanted with TEC for periods ranging from 0.5 days to 6 weeks. Tissues were collected at various time points and assessed for cytokine expression through ELISA and mRNA analysis or labeled for specific cell populations in the TEC. Macrophage-derived factors, such as monocyte chemotactic protein-1 (MCP-1), appear to induce adipogenesis by recruiting macrophages and bone marrow-derived precursor cells to the TEC at early time points, with a second wave of nonbone marrow-derived progenitors. Gene expression analysis suggests that TNFα, LCN-2, and Interleukin 1β are important in early stages of neo-adipogenesis. Increasing platelet-derived growth factor and vascular endothelial cell growth factor expression at early time points correlates with preadipocyte proliferation and induction of angiogenesis. This study provides new information about key elements that are involved in early development of new adipose tissue.
Introduction
A
We have developed an in vivo mouse model that successfully generates new adipose tissue in a tissue engineering chamber (TEC) containing the basement membrane-rich extract Matrigel [4 –7]. Inflammation appears key to the process of neo-adipogenesis, and Zymosan (Zy-A), a sterile inflammation inducing yeast fragment, can stimulate spontaneous adipose tissue in this model [8,9]. Fat tissue is an important endocrine and signaling organ and to regulate physiologic processes throughout the body by secreting adipokines [10]. In addition, adipocyte precursors and macrophages are reported to share similar functions [11 –13]. Adipokines and cytokines secreted by macrophages are involved the 3 crucial components of adipose tissue growth and stability: adipogenesis, angiogenesis, and matrix and scaffold remodeling. Monocyte chemotactic protein-1 (MCP-1) and macrophage inflammatory protein-1 alpha (MIP-1α), agents known to be secreted by macrophages, are also secreted by preadipocytes [14].
Adipogenesis is controlled by a complex interplay between positive and negative regulators, which change the activity of different transcription factors. Peroxisome proliferator-activated receptor gamma (PPARγ) and CCAAT/enhancer-binding proteins (CEBP) have emerged as master regulators of adipogenesis [15]. Activin-A and basic fibroblast growth factor (FGF2) have been shown to have critical roles in preadipocyte proliferation in adipose tissue [16], with Activin-A expression increased in the macrophages of obese patients.
We hypothesized that a low level of inflammation can induce adipogenesis, through promoting the mobilization of adipose precursor cells that home to the TEC, differentiating to form new adipose tissue [8,9,17]. In order to further investigate the interplay between inflammation and adipogenesis, we have used our mouse TEC model to study the type and timing of early cellular recruitment to the chamber, and the cytokine profiles associated with these cells. Here we show for the first time, using our unique TEC model, that early cellular recruitment to the chamber is bone marrow driven, whereas later waves of neo-adipogenesis are stromal derived.
Materials and Methods
Implantation of mouse TECs
Animal experiments were approved by the St Vincent's Hospital Animal Ethics Committee or the Peter MacCallum Cancer Centre Animal Ethics Committee and conformed to the NHMRC guidelines. All mice used were male C57/BL6 mice, unless otherwise stated. TECs with an internal diameter of 5×3.35 mm (44 μL volume) made from silicone tubing (Dow-Corning Corp.) and placed on the right epigastric pedicle as described previously [5,9]. The superficial epigastric vessels were dissected free of surrounding tissue from their origin at the femoral vessels to their insertion into the groin fat pad. The chambers were split longitudinally on one side and placed around the cleared epigastric vessels and nerve. The proximal femoral end and the lateral split were sealed with melted bone wax (Ethicon). The chamber was then filled with Matrigel with or without Zymosan–A (Zy-A) at a concentration of 1 μg/mL (Sigma). The distal end of the chamber was sealed with melted wax, creating a seal without damaging the epigastric pedicle exiting the chamber and the skin closed with metal staples. The TEC model was used as the basis of the following experiments.
Confirmation of adipogenic potential of the model
Mouse TEC containing Matrigel with Zy-A were implanted into mice (n=6) on one side of the groin, with Matrigel-only (no Zy-A, no FGF2) controls implanted on the other side to assess the inflammatory impact of the surgery alone on the TEC. At 6 weeks postimplantation, the mice were euthanized and the TEC and their contents harvested. Tissues were fixed in 4% paraformaldehyde, dehydrated, and paraffin-embedded. Each tissue construct was then serially sectioned (5 μm sections) along its longitudinal axis, mounted onto an APES treat glass slide, and stained with hematoxylin and eosin following a standard histological protocol and assessed using the Zeiss Axioskop 2 microscope and photographed using an Axiocam MRc5digital camera and Axiovision software (version 4.2).
Characterization of cytokine and adipokine protein expression during the early stages of adipose tissue development in (i) the TEC and (ii) peripheral serum samples
Cytokine assessment by ELISA
Mice were implanted with TEC containing Matrigel and Zy-A. Mice were euthanized and chambers collected at 6 time points: 12 h and 1, 2, 4, 7, and 10 days postimplantation (n=8 per time point). Control chambers were implanted and harvested at 12 h time point to assess the immediate impact of implanting chambers without the additional inflammatory stimulus of Zy-A.
Quantikine High Sensitivity ELISA kits (R&D Systems) were used to assess MCP-1, MIP-1α MIF-1, interleukin (IL)1β, IFNγ, VEGF-A, platelet-derived growth factor (PDGF), transforming growth factor-β (TGFβ), FGF2, TNFα, and IL-6. Serum samples were collected from each mouse at harvest and diluted to 1 mL total volume in PBS.
Chambers were macerated in 1 mL PBS at 4°C to re-liquefy the Matrigel and centrifuged 10 min, and the supernatant was removed, stored at −80°C, and then transferred and stored at 4°C during assay. Assays were performed as per manufacturer's instructions. About 100 μL of diluent was added to each well of an antibody-coated plate, followed by 100 μL of sample from either macerated chambers or collected serum. Plates were incubated for 2 h at room temperature (RT) and rinsed 4 times with a wash buffer, and then the buffer was removed and 200 μL conjugate added. Plates were incubated for a further 2 h at RT, rinsed 4 times, the buffer removed, and 200 μL color substrate added. After incubating 30 min in the dark at RT, 50 μL of stop solution was added to each well. Plates were read using a Multiskan microplate reader (Pathtech) set at λ 450 nm absorbance with a correction reading set at λ 550 nm and analyzed using Genesis 2 plate-reading software (version 3.04; Lifesciences) and values were calculated back to pg/mL of the original sample volume.
Characterization of cytokine and adipokine gene expression in TEC during the early stages of adipose tissue development using multiplex bead gene expression array
Mice were implanted with TEC and harvested at 4 time points (n=6 per time point): 4, 7, 10, and 14 days postimplantation (insufficient tissue is present at the previous earlier time points for these experiments). QuantiGene Plex (QGP; Panomics) assays were used to examine the expression of the following genes in the TEC: MCP-1, TNFα, IL1β, IL4, IL10, MIF, CEBPα, CEBPβ, NF-κB1, NF-κB2, LCN-2, Leptin, FABP4, and PPARγ.
Following harvest at 4, 7, and 10 days, TEC contents were placed in RNALater (Ambion), stored for 24 h at 4°C, and then processed using the Panomics Tissue Lysis kit. Following centrifugation, RNALater was replaced with 300 μL of lysis reagent. Tissue was disrupted with a Microson Ultrasonic Homogeniser until only small tissue particles remained. Proteinase K (stock concentration 50 μg/mL) was added at a ratio of 1:100 to the lysis mixture. Samples were incubated for 45 min at 65°C and vortexed every 15 min. QGP procedure for transcript analysis has been described elsewhere [18,19]. Mouse Universal RNA was added to each plate for normalization.
Fluorescent bead signal was obtained using BioPlex Suspension Array System (Bio-Rad Laboratories). Fluorescent intensity of the gene of interest was normalized to 2 reference genes. For comparison between multiple plates, data were normalized using mouse universal RNA. Each sample was run in triplicate with 6 different samples per group. The 2 sets of data obtained were similar using either PPIB or HPRT as the reference gene; we have presented the data set using HPRT as a reference.
Culture of the TEC contents for identification of cells tracking to the chamber
Cell culture of chamber contents
To study the cells that home to the TEC, chambers were harvested at corresponding points [12 h, and 1, 2, 4, 7, and 10 days postimplantation (n=8 per time point)] to those chosen for cytokine analysis. The vascular pedicle was removed and chamber contents digested using Collagenase I (Sigma) and Dispase (Invitrogen). The cells were then cultured in BD Falcon 8-well CultureSlides (BD Biosciences) in DMEM (Invitrogen) with 10% FCS and antibiotics for 3 days at 37°C for 3 days before removing media and fixing with ice-cold acetone for 10 min.
Immunocytochemistry
Macrophages were detected using rat anti-mouse F4/80 monoclonal antibody (Abcam), which labels a cell-surface glycoprotein expressed by murine macrophages. To localize STRO-1, a cell surface marker of mesenchymal progenitor cells, a mouse anti-human STRO-1 monoclonal antibody, was used (R&D Systems, Inc.). Pref-1, a transmembrane protein expressed in preadipocytes but not in mature adipocytes, was detected using rat anti-mouse anti-Pref-1 purchased from MBL International. Mouse anti-human alpha-smooth muscle actin (αSMA) antibody, used to label smooth muscle cells, was purchased from Dako. As a secondary antibody, rabbit anti-rat IgG-biotin (Dako), was used for F4/80 and Pref-1 antibodies, goat antimouse IgM-biotin for anti-STRO-1 (Southern Biotech), and Dako mouse envision for αSMA. For negative controls, primary antibodies were replaced by either diluent alone or a matched isotype nonimmune serum. Primary cultures of mouse SVF, mouse smooth muscle cells, and commercial RAW 264.7 macrophages were used as positive controls for STRO-1 and Pref-1, αSMA, and F4/80.
Slides were washed with PBS and incubated in Peroxidase block for 5 min and then in protein block for 30 min. Dako Protein block was used for αSMA, 20% normal goat serum for STRO-1, and 10% normal rabbit serum in PBS for Pref-1 and F4/80. After blotting, sections were incubated with primary antibody for 1 h. Dilutions using PBS were 1:100 with 20% normal goat serum for STRO-1, and 1:100 and 1:200 with normal rabbit serum for Pref-1 and F4/80, respectively. For αSMA, primary antibody was diluted 1:400 in Dako antibody diluent and Dako mouse Envision was used for detection. For the other antibodies, after PBS washing sections were incubated with goat anti-mouse IgM-biotin for STRO-1, and with rabbit anti-rat IgG-biotin for F4/80 and Pref-1 for 30 min. Detection was completed with a streptavidin-horseradish peroxidase conjugate and liquid DAB chromagen (Dako) for all antibodies, followed by counterstaining with hematoxylin. All reactions took place at RT. Slides were scored by 2 independent observers using the Zeiss Axioskop 2 microscope and photographed using an Axiocam MRc5digital camera and Axiovision software (version 4.2).
In vitro cell differentiation with adipogenic media
To confirm that the cells homing to the chamber at early time points included adipose progenitor cells, the contents of 2 further sets of TEC at the 4 and 10 day time points. The cells were then extracted as described previously and cultured on tissue culture coverslips at 37°C with 5% CO2 until 75% confluent, and then seeded into 90 mL culture flasks, and cultured with adipose differentiation media [20] or standard growth media and incubated for 14 days. Cells were fixed using neutral buffered formalin, stained with Oil Red O, and counterstained with hematoxylin. Cultures were photographed on an Olympus CK40 and Camedia C-5050 camera.
Identification of the source of precursor cells in the chamber
Immunofluorescence labeling
In order to determine whether the cells forming the new adipose tissue were recruited from BMSC or elsewhere, we established chambers in male C57/Bl6 mice that had been transplanted with eGFP-labeled bone marrow as described previously [21]. Briefly, recipient mice were lethally irradiated before receiving eGFP-positive bone marrow from NZ-eGFP donor mice. Positive reconstitution (above 95%) was confirmed 6 weeks later by flow cytometry. TEC were implanted as described above and harvested at 3 time points t 4 days, 2 weeks, and 6 weeks (n=5 per group).
Four-day samples that contained cells rather than tissue were rapidly pipetted up and down in PBS, creating a cell suspension. Cell suspensions were placed on positively charged slides and cells were allowed to adhere in a monolayer for 30 min and then fixed with cold acetone for 10 min. For double immunostaining of Stro-1 and GFP, slides were washed with TBS and incubated for 10 min in 0.3% Triton X100 for permeabilization, and then incubated in 20% goat serum block for 30 min. After blotting, cells were incubated with 1:100 Stro-1 at 4°C overnight. Further incubation was carried out with 1:200 goat anti-mouse IgM-biotin (SouthernBiotech; 1021-08), with 1:400 streptavidin-Alexa Fluor 488 (Molecular Probe, Inc.) for 30 min in the dark, with GFP antibody (Abcam ab290) for 1 h at RT in the dark, and then with 1–200 cy3 goat anti-rabbit IgG for 30 min and counterstained with DAPI in prolong gold (Invitrogen).
Two- and 6-week chamber specimens were fixed overnight at 4°C in 4% paraformaldehyde. The tissue was then embedded in paraffin and cut into 5-μm sections for immunostaining of NG2/GFP, CD31/GFP, F480/GFP, and NG2/S-100 Rabbit polyclonal antibody to NG2 [1:1,000 dilution at a final concentration of 1 μg/mL (Abcam; ab87471)], rabbit polyclonal antibody to GFP [1:1,000 dilution (Abcam; ab290)], rabbit anti-cow S100 [at 4.1 μg/mL (DAKO; Z0311)], rat anti-mouse CD31 [at 3.1 μg/mL (BD Pharmingen)], and rat anti-mouse F480 (at 2 μg/mL) were the primary antibodies. In negative controls for individual antibodies, the primary antibody was replaced with an irrelevant antibody at the same concentration as the primary. Sections were labeled following Double Staining Protocol—Sequential Approach for Primary Antibodies Raised from Same Species (
Statistical analysis
Statistical analyses were performed using Prism V5.04 software (Graphpad Software, Inc.). Results were compared using analysis of variance, with a post hoc Bonferroni test where appropriate. P values<0.05 were considered statistically significant. Standard errors (±) of means are given throughout.
Results
Confirmation of adipogenic potential of the model
Chambers initiated with Zy-A harvested at 6 weeks contained significant amounts of mature adipose tissue (Fig. 1), confirming the inflammation-induced adipogenic response previously reported [9].

Confirmation of the adipogenic tissue engineering chamber (TEC) model.
Characterization of cytokine and adipokine expression in chambers and systemically
Local TEC expression
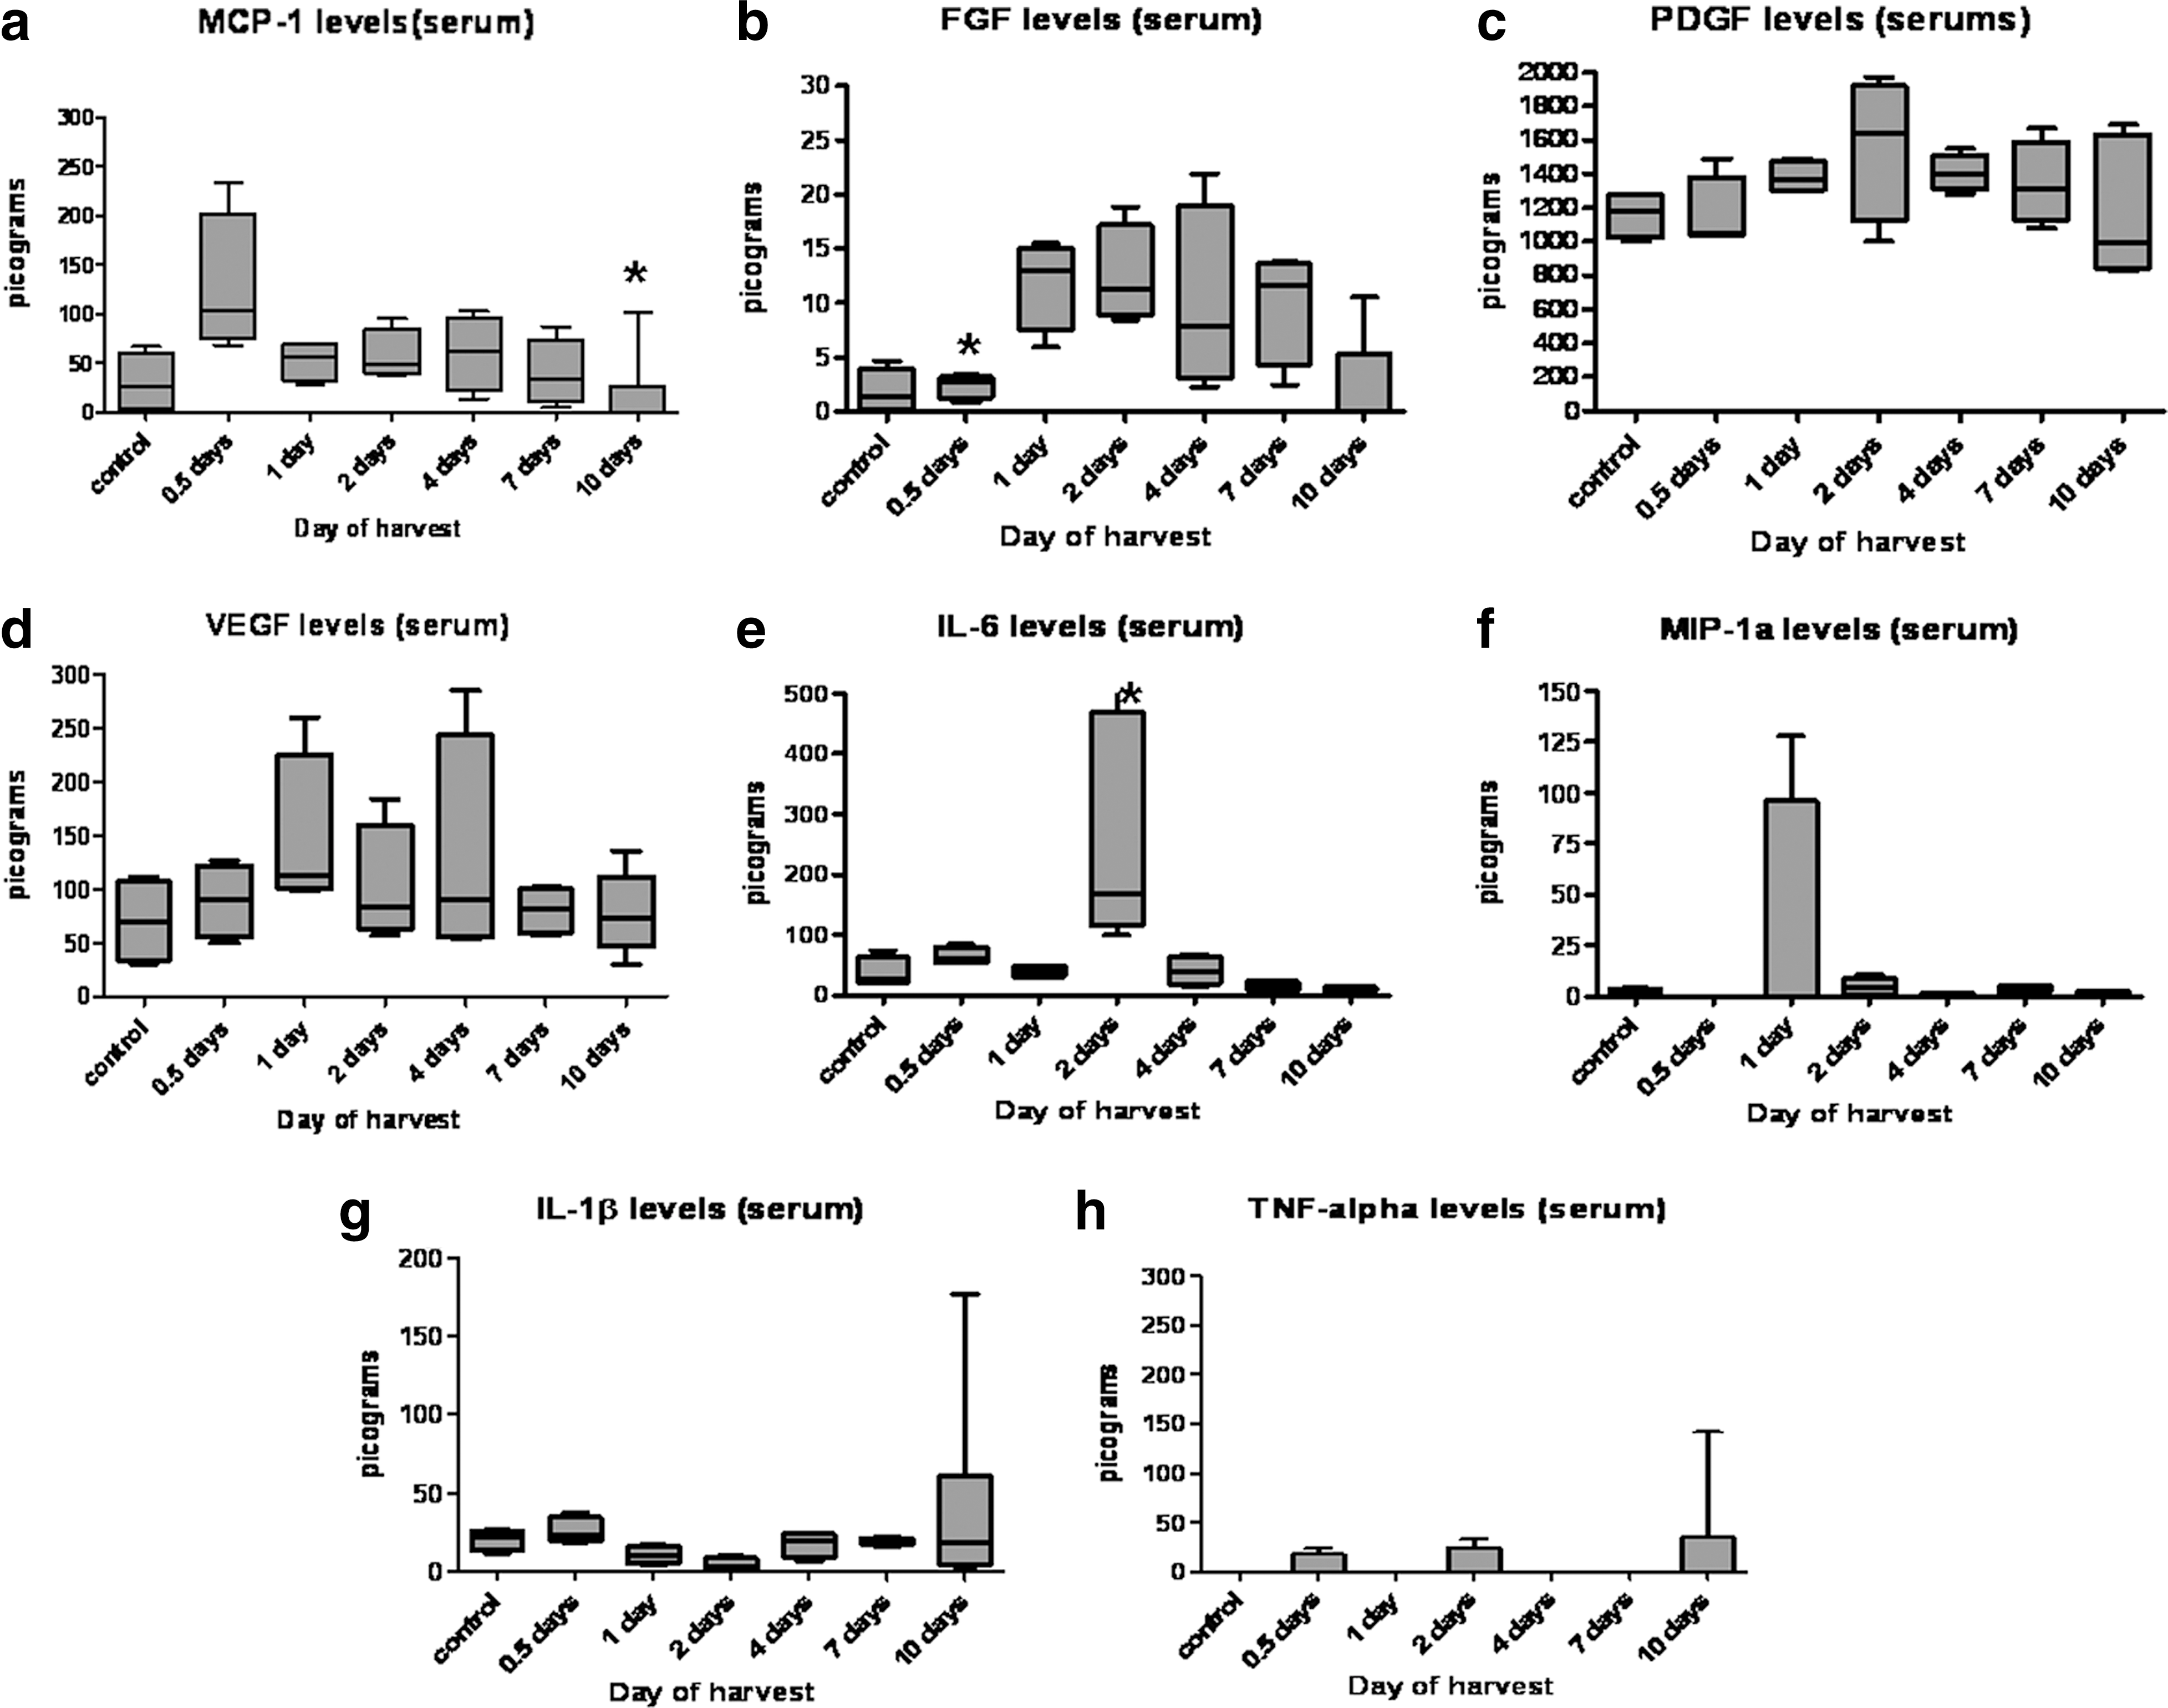
MCP-1 and MIP-1α (Fig. 2b, C) were highly expressed by cells in the chambers between days 0.5 and 2.: MIP-1a expression is significantly elevated compared to controls at D0.5 and D1 (P<0.05), while MCP-1 expression is high for D0.5-D2, but has significantly decreased byD10 (P≤0.05), coinciding with the large numbers of macrophages cultured from the chamber at these time points. Levels of macrophage migration inhibitory factor 1 (MIF-1) protein increased slightly from days 4–10 (data not shown), while mRNA levels were high at days 4–7 and decreased slightly at day 10 (Fig. 3f).

Protein levels of cytokines/growth factors in the TEC as measured by ELISA.
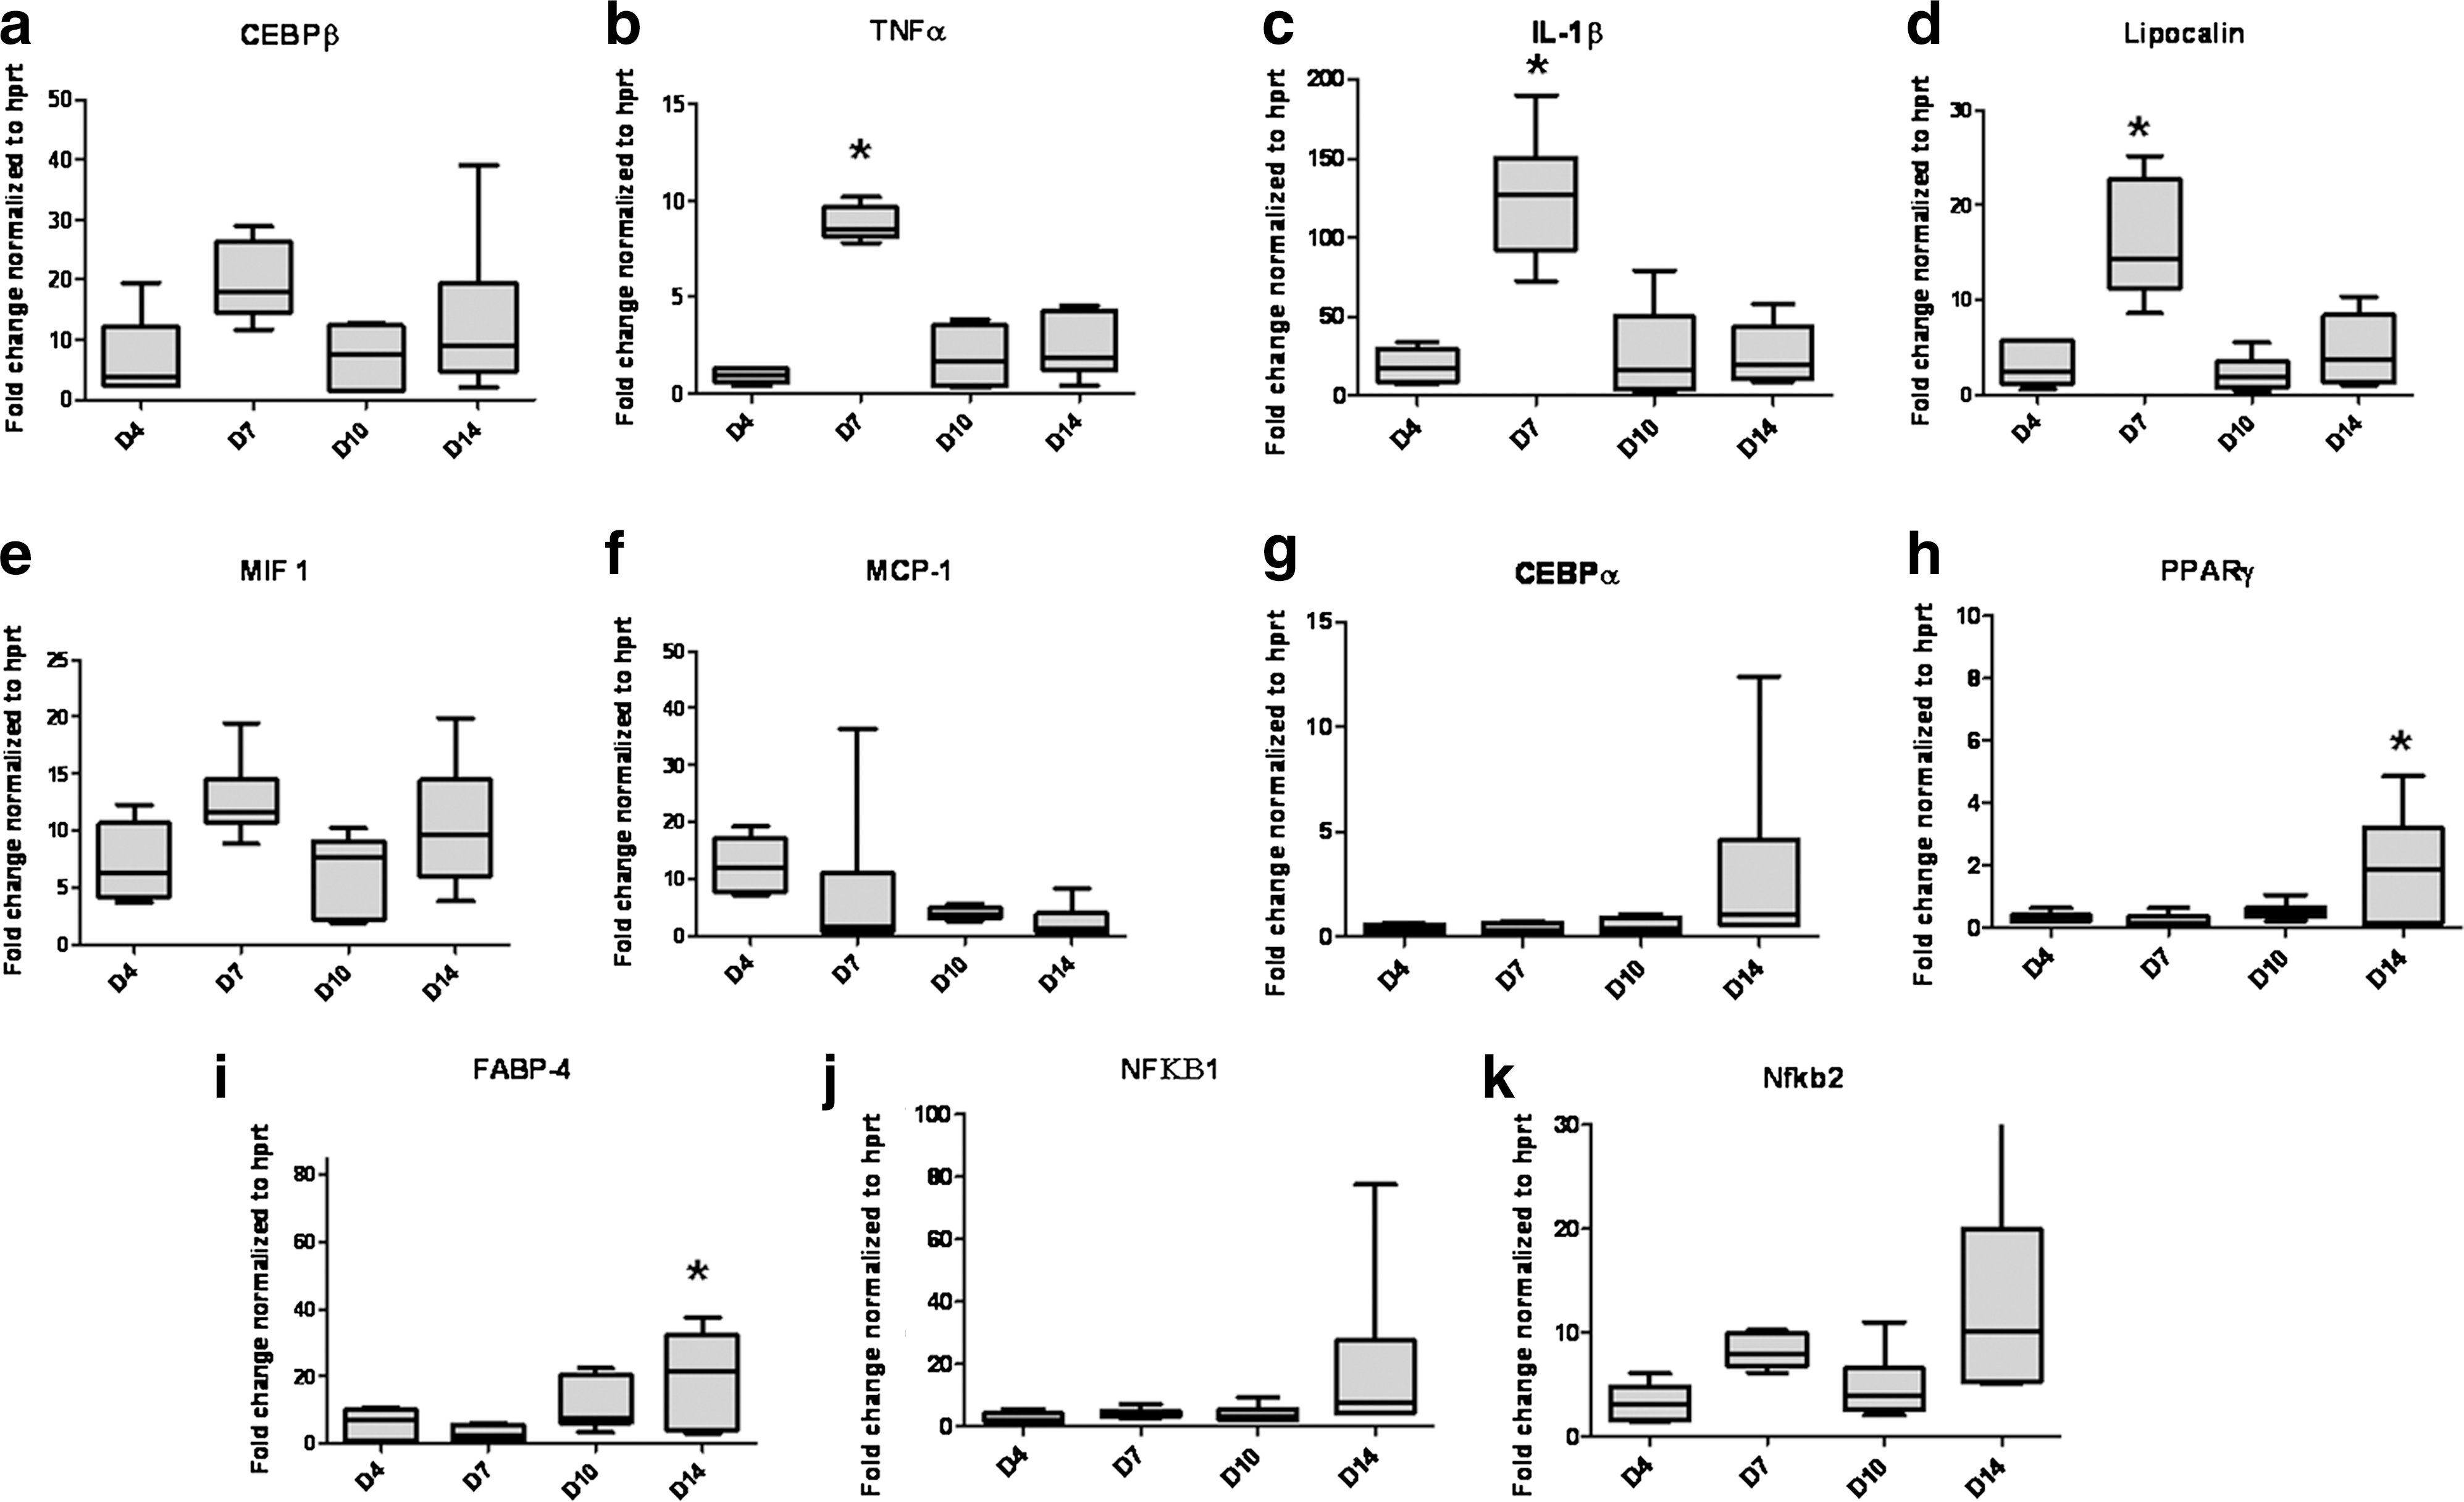
Gene expression of cytokines and transcription factors in the TEC. Significant increases in expression of
The transcription factor, CEBPβ expression remained consistently high in the chamber, showing increased expression at day 7, dropping at day 10, and then increasing again at 2 weeks (Fig. 3a). Although these changes were not significant (P=0.059), they are reflected in significant increases in gene expression at day 7 for the CEBPβ-mediated cytokines IL1β and TNFα and the glycoprotein LCN-2 (P=0.0001 for each factor), all of which decrease by day 10 (Fig.3b–d) and increase at 2 weeks after implantation. This pattern is also seen in Mif-1 expression (Fig. 3e). IL1β and TNFα levels were shown to be increasing from day 4 toward day 10 (Fig. 2d, e). IL1β protein expression was 100-fold higher than TNFα, while mRNA expression was 10-fold higher. IL1β protein expression appears to be biphasic as expression was high immediately after surgery, dropping at day 2 then increasing over days 7–10 (Fig. 2d). In contrast, TNFα expression increased from day 7 (Fig. 2e). IL6 protein levels were elevated from 0.5 to 2 days and decreased from days 7 to 10, but was not increased compared to the surgery alone controls (Fig. 2a). IFNγ was not observed in the TEC. Nuclear factor kappa-light-chain-enhancer of activated B cells (NFκB)-1 expression was consistent from days 4 to 10, increasing slightly at 2 weeks, while NFκB-2 expression increased at days 7 and 14.
Anti-inflammatory/adipogenic related expression
PPARγ, expression which is also induced by CEBPβ, was significantly increased (P=0.013) at 2 weeks compared to earlier time points in the chamber (Fig. 3h). NFκB (a PPARγ antagonist) expression was 25–50 times higher (Fig. 3j, k) than PPARγ at this time but showed a similar pattern of expression, with increases at the 2 week time point. Expression of CEBPα and FABP-4 (P=0.015), which are both induced by PPARγ, were also increased at 2 weeks (Fig. 3g, i). The lowest level of expression for all of these factors occurs at day 7, which is the time point when inflammatory mediators IL1β and TNFα expression were highest (Fig. 3b, c). Leptin and the alternatively activated macrophage markers IL4 and IL10 mRNA expression did not change significantly during the 4 day to 2-week time course (data not shown).
Growth factor expression
PDGF levels in the chamber remained constant with a brief increase around days 1–2. Vascular endothelial cell growth factor (VEGF-A) levels were quite high (1–2 ng/mL) with an increase in VEGF-A secretion at days 4–7, dropping at 10 days (Fig. 2f, g). Transforming growth factor-β (TGFβ1) levels remained constant throughout the time points studied (Fig. 2i). FGF2, levels which have been supplemented in the chamber, were extremely high, but showed a significant drop at day 4, indicating that unbound FGF-2 was being dissipated (Fig. 2h).
Systemic inflammatory cytokine expression
Serum FGF-2 levels are significantly lower in controls and at D0.5 (P≤0.05), PDGF, which is measured at significantly higher levels than other cytokines (here expression in nanograms, while all other cytokines measured in picograms). VEGF-A levels, FGF-2, PDGF, and VEGF levels all appear to increase around day 2 (Fig. 4b–d), Circulating levels of all inflammatory cytokines measured remained low throughout all time points. Circulating levels of MCP-1 (Fig. 4a) showed an increase immediately after surgery in the Zy-A mice compared to controls at D0.5, which decreases by D10 (
Systemic expression of cytokines as measured by ELISA
Identification of cells tracking to the chamber
Cell migration and immunocytochemistry
The first cell population that arrived at the chamber were F4/80-positive macrophages (Fig. 5a). The size and number of F4/80-positive macrophage increased toward day 7, as these cells internalize Zy-A particles and more migrate into the chamber. From day 7, we observed an increase of different cell types and overall cell numbers within the chambers: F4/80-positive macrophages, αSMA-positive cells that are probably myofibroblasts (Fig. 5b), a small number of Pref-1 (adipose precursor cells) and STRO-1-labeled cells (MSC) were seen (Fig. 5c, d). Potential adipose precursor numbers in the chamber by 10 days were estimated at 0.5%–1% of the total cell population.
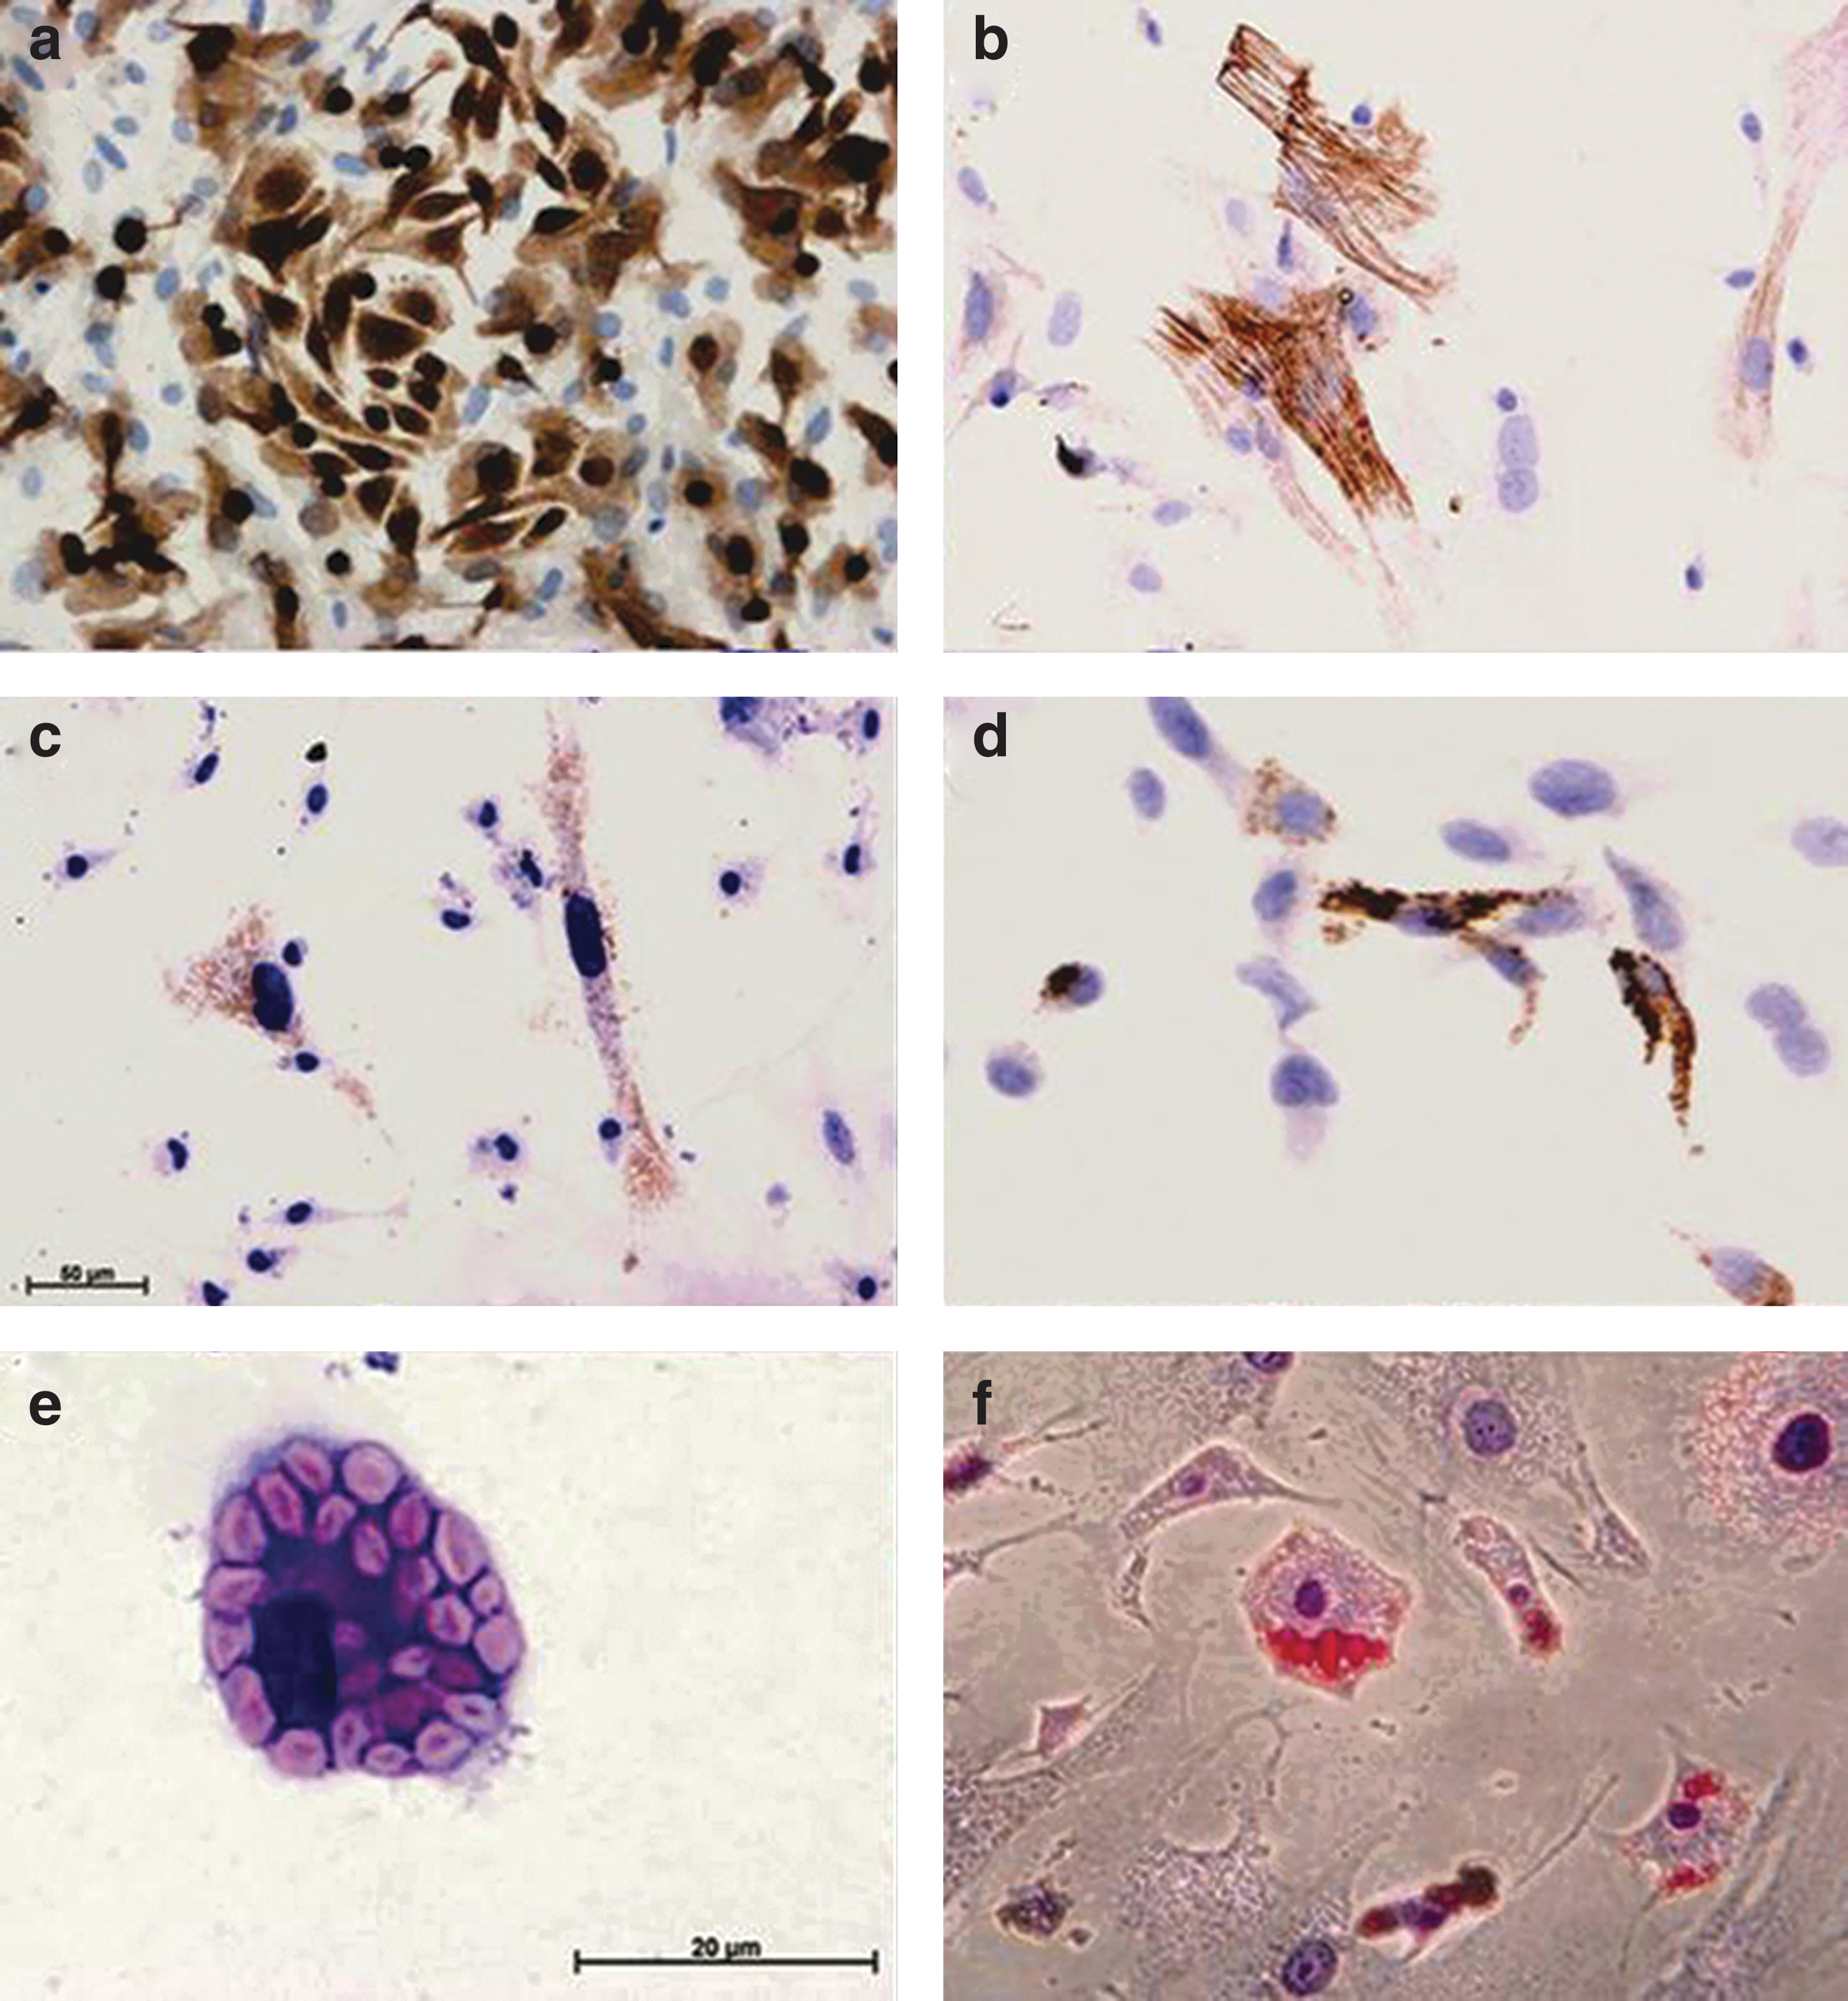
Cell types identified by immunocytochemistry in the TEC contents in culture. Chambers were harvested at day 10 postimplantation.
In vitro differentiation of the cells harvested from TEC
Cells from TEC harvested at days 2, 4, and 10 were expanded in culture with adipoinductive media for 14 days. Day 2 and 4 time points were chosen based on the changes seen in cytokine expression while day 10 was chosen as the time point when the most cells were present. Cells containing lipid droplets were observed in all cultures, with ∼1% of the cells differentiating into new adipocytes (Fig. 5f).
Immunofluorescence staining of eGFP bone marrow-transplanted mice chambers
To determine the origin of the cells infiltrating the chambers, we generated eGFP-bone marrow chimeras. In these mice, all bone-marrow-derived cells are identifiable by their eGFP expression in immunofluorescence. We found that all of the cells in the chambers after 4 days were eGFP positive, indicating that their bone marrow origin. The majority of the cells present were macrophages (F480 positive, Fig. 6a), with a small number of neutrophils as assessed by morphology. Some cells were STRO-1 positive, suggesting that they were MSC. eGFP-positive cells were still evident in the construct after 6 weeks as adipocytes, especially young adipocytes (Fig. 6b, c); however, no STRO-1-positive cells were seen at this time. Both immature and adult adipocytes stained positive for NG2 and s100 although NG2 labeling was more consistent than s100 (Fig. 6d). At 2 weeks CD31+ endothelial cells can be seen invading the chamber (Fig. 6e, f). Some CD31-labeled endothelial cells were eGFP positive, but most endothelial cells are negative for eGFP, indicating that they are derived from local vessels. Associated with these newly forming vessels was a population of extra mural cells that were positive for NG-2 and S100. The results indicate that early precursor cells in the chamber are derived from BMSC, with further migration of precursor cells from the surrounding tissue occurring at around 14 days, at the same time as increased expression levels of inflammatory cytokines are seen in the chamber.
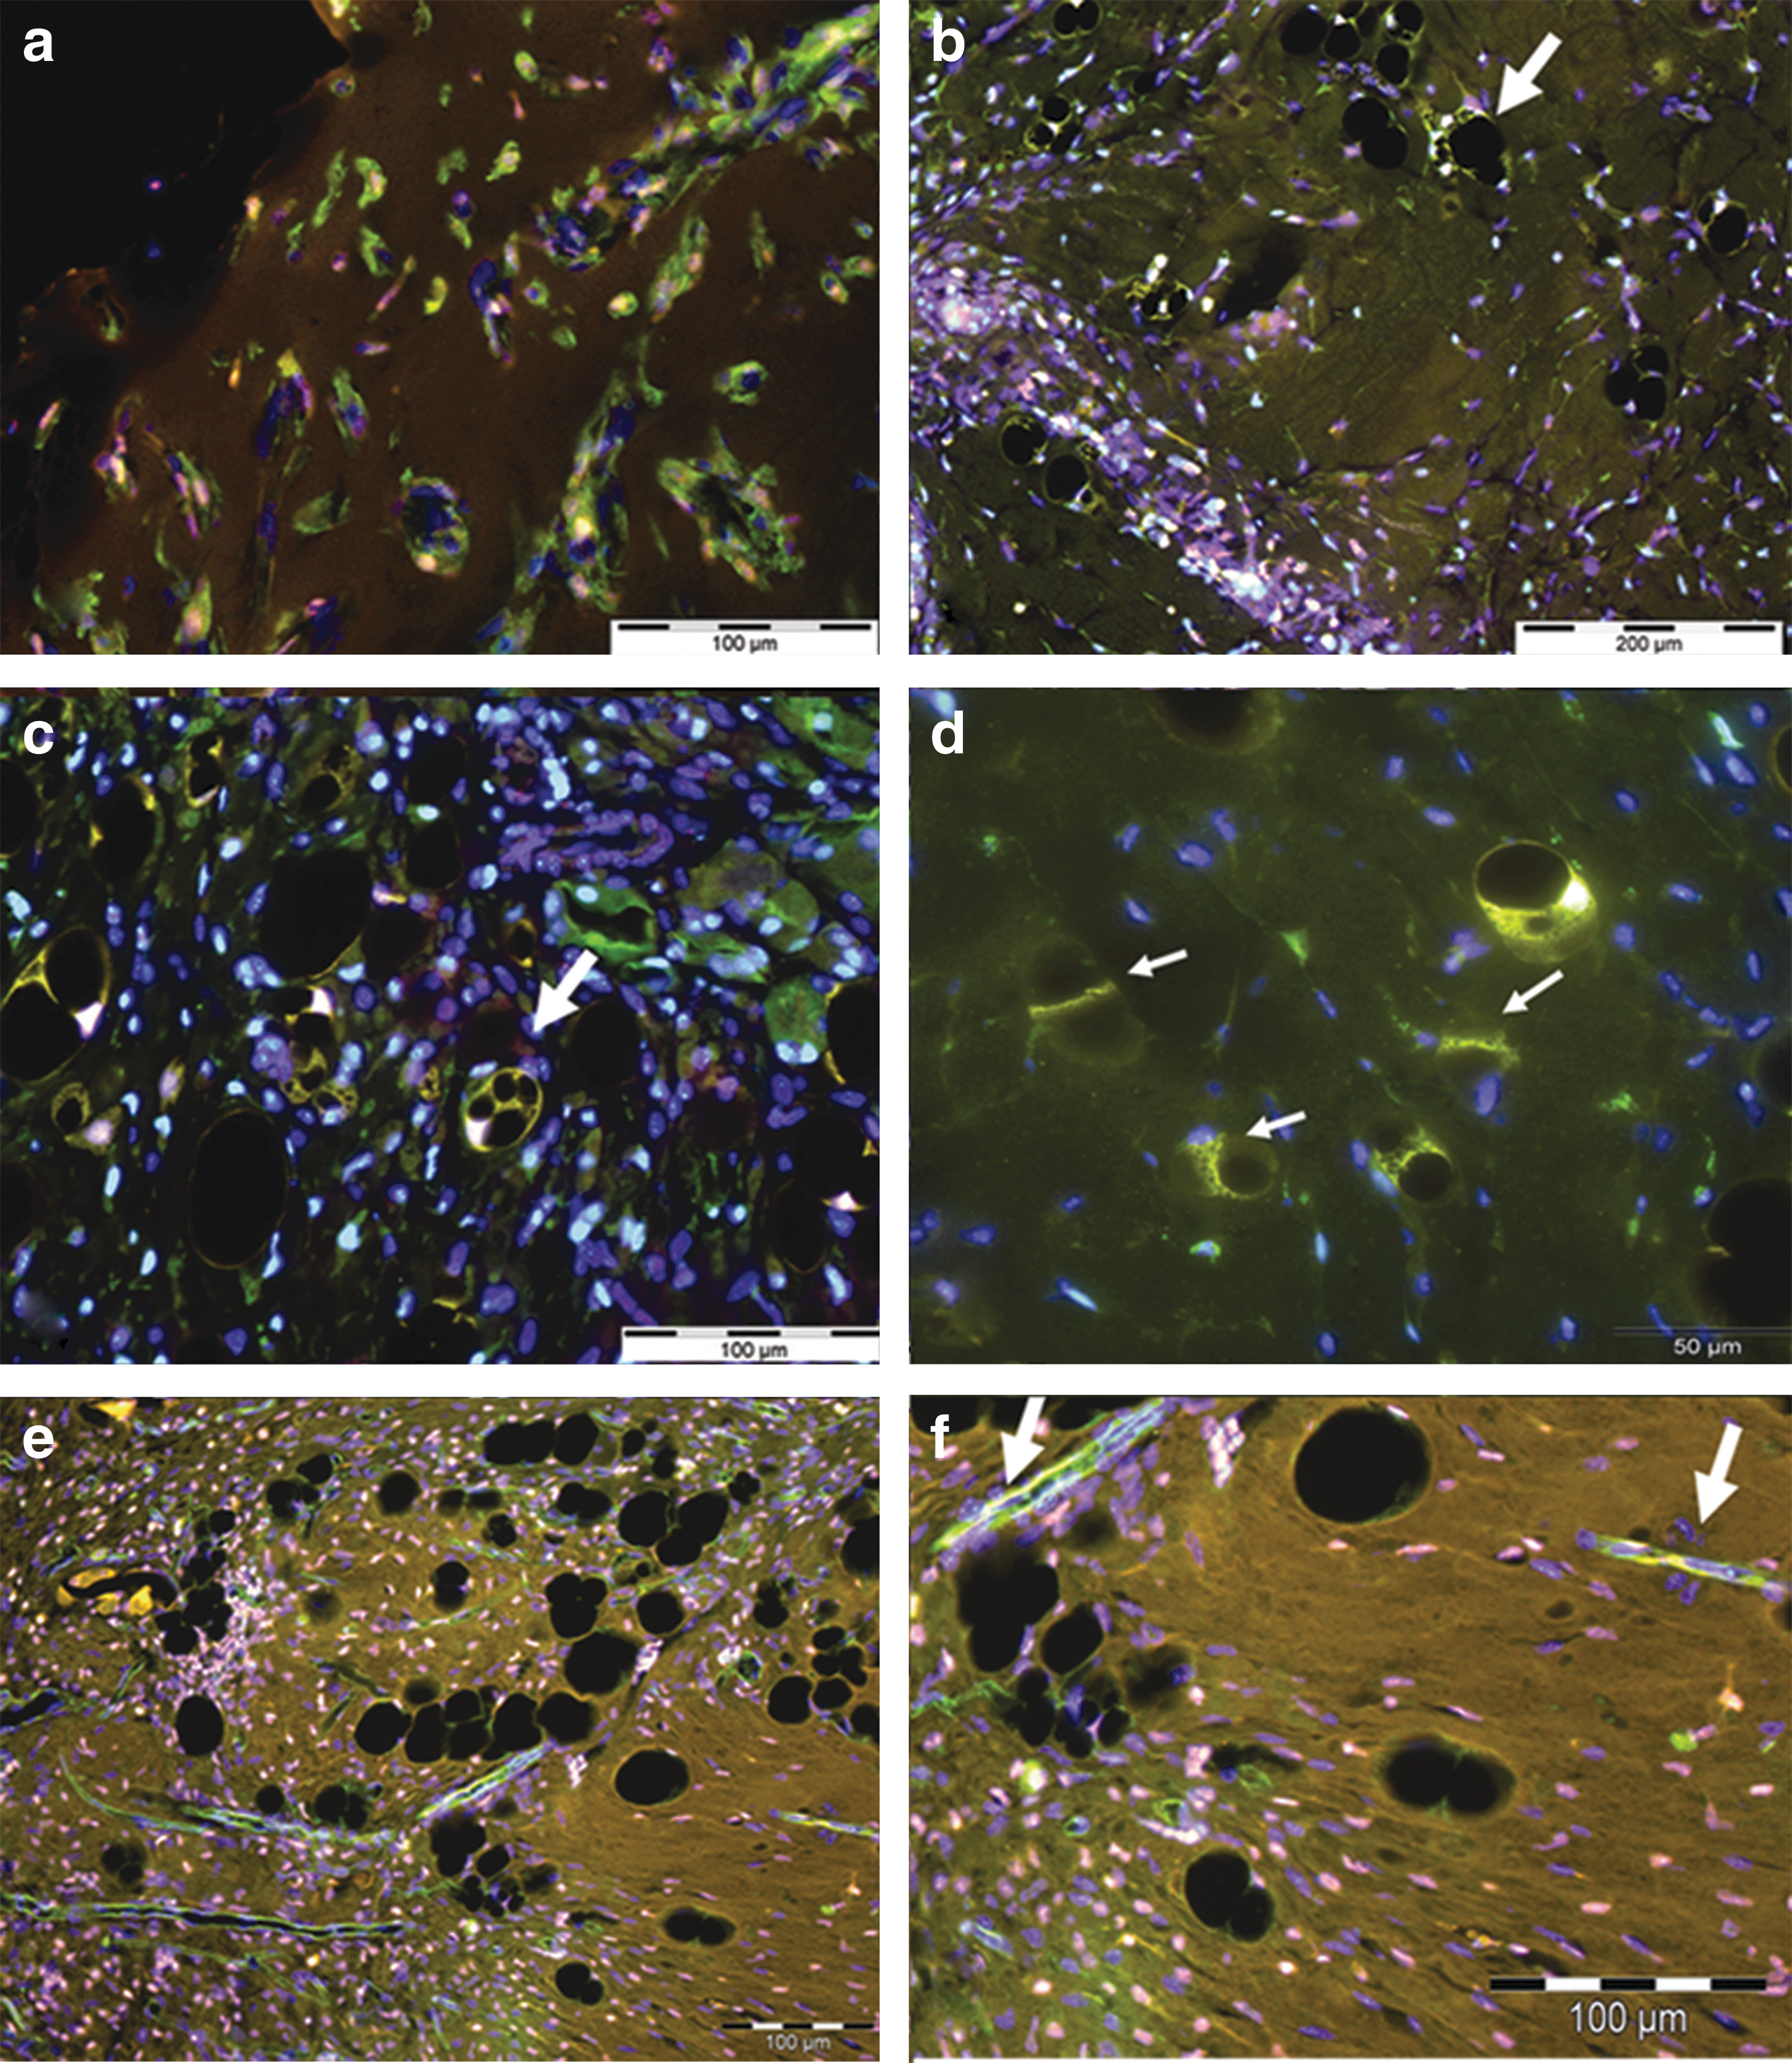
Co-localization of cell markers with eGFP in TEC from eGFP bone marrow chimeric mice. All sections are counterstained with DAPI (blue).
Discussion
Studies in obesity and metabolic syndrome have shown that inflammation and adipogenesis are closely interrelated, with adipocytes and inflammatory cells sharing receptors for and secreting cytokines such as TNFα, IL1β, MCP-1, and TGFβ. Here we have investigated the early stages of adipose tissue formation in the chamber in response to this inflammatory stimulus, with a particular emphasis on the role of cells recruited from the bone marrow.
Macrophages entered the TEC as early as 12 h postinsertion. This led to an immediate increase in MCP-1 and MIP 1a, with MIF levels increasing by day 4 providing a signal for more macrophages to enter the TEC. These cytokines appear to attract precursor cells such as MSC to the chamber to support tissue development. Cytokine levels begin decreasing in the chamber between days 2 and 4, while growth factor expression increases, suggesting an alteration in macrophage activation, as these are the main cell type in the chamber and presumably the source of the increased growth factors. These factors provide an additional stimulus for a more varied influx of cells into the chamber and promote new blood vessel formation. This step appears to be critical for tissue development in this model, as work from our laboratory looking at later time points than this study, has shown that preventing macrophages from entering the chamber through the addition of clodronate liposomes to the TECs prevents tissue growth in the chamber The exclusion of macrophages from the TEC results in a poorly defined acellular construct with severely reduced angiogenesis and adipogenesis (Debels et al., submitted). In combination with the findings from the earlier time points in this study, this suggests that macrophages and the cytokines they secrete play a key role in tissue formation in the TEC.
The main increases in circulating cytokine expression post insertion of the TEC were seen in MCP-1 and MIP-1a. Both are chemotaxic for macrophages and lead to upregulation of IL6. These factors also activate other white blood cell types and increase circulating activated macrophages. Once this inflammatory expression pattern is established in the body, it could then lead to a similar pattern of inflammation and attraction of precursor cells, and then downregulation at a site outside the TEC. Increases in circulating VEGF-A, FGF-2, and PDGF can be seen on days 1–2 postimplantation of TEC, decreasing at day 4. These cytokines are secreted by macrophages and endothelial cells and would be instrumental in establishing the local microvasculature and are involved in preadipocyte proliferation [22 –26].
This study also correlates with previous work from our institute (Rophael et al.) where combinations of the growth factors VEGF, FGF2, and PDGF synergistically enhanced angiogenesis and adipogenesis in the TEC. This was due to a significant increase in cell infiltrate at 2 weeks consisting of mesenchyme-derived cells such as macrophages pericytes and adipose progenitor cells.ie an increased inflammatory response. The current study looks at the earlier mechanisms behind this cellular increase and demonstrates an increase in the angiogenic/adipogenic PDGF and VEGF caused by the inflammatory stimulus, suggesting that the addition of growth factors in the previous study was mimicking this response. A moderate inflammatory stimulus was sufficient to draw in the same cells as were seen in the chamber at the 2 week point in the Rophael study as shown by successful labeling of progenitor cells in the chamber and the explanted chamber contents leading to adipogenesis/angiogenesis without adding exogenous growth factors, which may be a concern in some clinical applications such as postcancer reconstruction.
Potential adipose precursor cells can be identified by 4 days postimplantation. These cells make up only a small population (0.5%–1%) of the cells observed in the chambers at this time; however, culturing the cells in vitro shows that they are capable of adipogenesis. While there has been some debate about whether STRO-1 can be labeled on mouse BMSC, several groups have demonstrated STRO-1 labeling in mouse cells, supporting our use of this marker to identify MSC [27 –30]. In our study, the STRO-1-positive cells and early stage macrophages can be shown to originate from the bone marrow of the mice, indicating that the first cellular response (0–4 days) is a systemic response and not from the surrounding local tissues. BMSC have been shown to possess multiple TLR and regulate cytokine signaling through TLR-2 activation—the same receptor that Zy-A binds to. Among the TLR identified, TLR-2, -3, and -4 seem to be most critical receptors upregulated by inflammation. TLR-2 receptors are activated by Zy-A and upregulate MCP-1, a cytokine that is significantly upregulated in the TEC, while TNF-α, which is also upregulated, can also upregulate TLR-2 expression. TLR-4 receptors upregulate IL6 and MIF to induce moderate MSC migration [31,32]. Endogenous ligands have been identified to TLR4 including heparin sulfate fragments and HSPG, fibrinogen and fibronectin [33,34], which are present in the Matrigel [35] in the chamber and could be cleaved either by macrophage driven proteolysis or in response to the inflammatory stimulus. High-mobility group box 1, which is secreted by inflammatory macrophages [36] is another potential ligand for TLR4 in the chamber. This may explain why the BMSC can be found in chambers at early time points postimplantation, attracted to the chambers by the factors secreted by macrophages and the Zy-A present in the chamber; however, no adipogenic differentiation is seen until further resolution of inflammation. This may be further influenced by macrophage produced Activin-A, which also inhibits adipogenic differentiation of adipose precursor cells while increasing proliferation [16,31] and is also under the control of IL6/TNFα. The 5-fold increase in MIF expression at 2 weeks may be responsible for the migration of a new wave of MSC into the chamber, supplementing the expression of TNFα and IL1β, as MCP-1 and IL6 have been down regulated by this time point.
After 10–14 days, new blood vessels can be seen infiltrating the chamber, preceded by macrophages, in a similar fashion to those seen by in Matrigel plugs [37,38]. These vessels are predominantly GFP negative, indicating that they have arisen from existing blood vessels rather than progenitor cells in the bone marrow. Some GFP-positive endothelial cells can be seen integrated into the vessels, indicating that some bone marrow-derived progenitors have formed part of the endothelium. These vessels are associated with pericyte-like cells that stain positively for S100 and NG2. At 6 weeks, NG2-positive cells can be seen differentiating into adipocytes while still adjacent to blood vessels. Pericytes have been previously suggested to be putative adipose precursor/stem cells with work by showing putative adipose precursor/stem cells clearly surrounding vessels in the extramural space [39 –42], as well as a study by Khan that identified the pericyte marker 3G5 on adipose stem cells in the human infrapatellar fat pad [43]. To examine this possibility, we labeled sections with NG2, a pericytes marker as well as s100. Both NG2 and s100 co-localized in some adipocytes as well as a population of extramural cells surrounding the vasculature at 2 and 6 weeks.
Not all of the newly formed fat is GFP or s100 positive, while the majority of adipocytes appeared to label for NG2. However, eGFP labeling is present in many of the younger adipocytes and these cells are most likely to arise from the population of GFP+/STRO-1+ cells seen in the day 4 chambers, correlating with the STRO-1 and Pref-1 populations seen in cells cultured in vitro from TEC. It is possible that we have 2 sources of adipose progenitor cells in the TE chamber model: (1) BMSC that are attracted to the chamber by inflammatory cytokines acting through TLR and (2) a second wave of adipose precursor cells that arrive with the new blood vessels invading the TEC construct.
Reports of the effects of macrophages and macrophage-secreted factors on adipogenesis have been varied. While we have previously shown MCP-1 induction of adipogenesis in TEC initiated by MCP-1 is dose dependent, Lacasa et al. suggested that macrophage-secreted factors inhibit adipogenesis [24,44]. This would tie in with the changes we see in NFκβ expression at the times when cell numbers are increasing in our chambers. Zaragosi et al. [16] have shown that activin-A induces adipose progenitor cell proliferation and migration. Activin-A is induced by TNF-α and IL1β and acts in turn to down regulate CEBPβ, paving the way for differentiation into adipocytes. These factors may also attract precursor cells from the bone marrow to the chamber to initiate tissue development.
One way an increase in macrophages could lead to neoadipogenesis is through an increase in the transcription factor CEBPβ expression, which regulates the expression of IL6, IL1β, TNF-α, and Lcn2. These factors regulate or are regulated by Activin-A [44,45] and NFκB. CEBPβ expression also upregulates PPARγ, which upregulates adipogenesis directly through the Wnt pathway (Fig. 7) PPARγ and NFκB are mutually antagonistic and as PPARγ expression increases, NFκB expression decreases, and the inflammation begins to resolve. The newly recruited preadipocytes then differentiate and adipogenesis occurs [17,46 –50]. In contrast, recent work by Yonce et al. suggests that MCP-1 produced by macrophages can induce adipogenesis through MCP-1-induced protein (MCPIP) without direct PPARγ initialization in vitro [51], which may be an alternative pathway for macrophage-induced adipogenesis in the chamber.
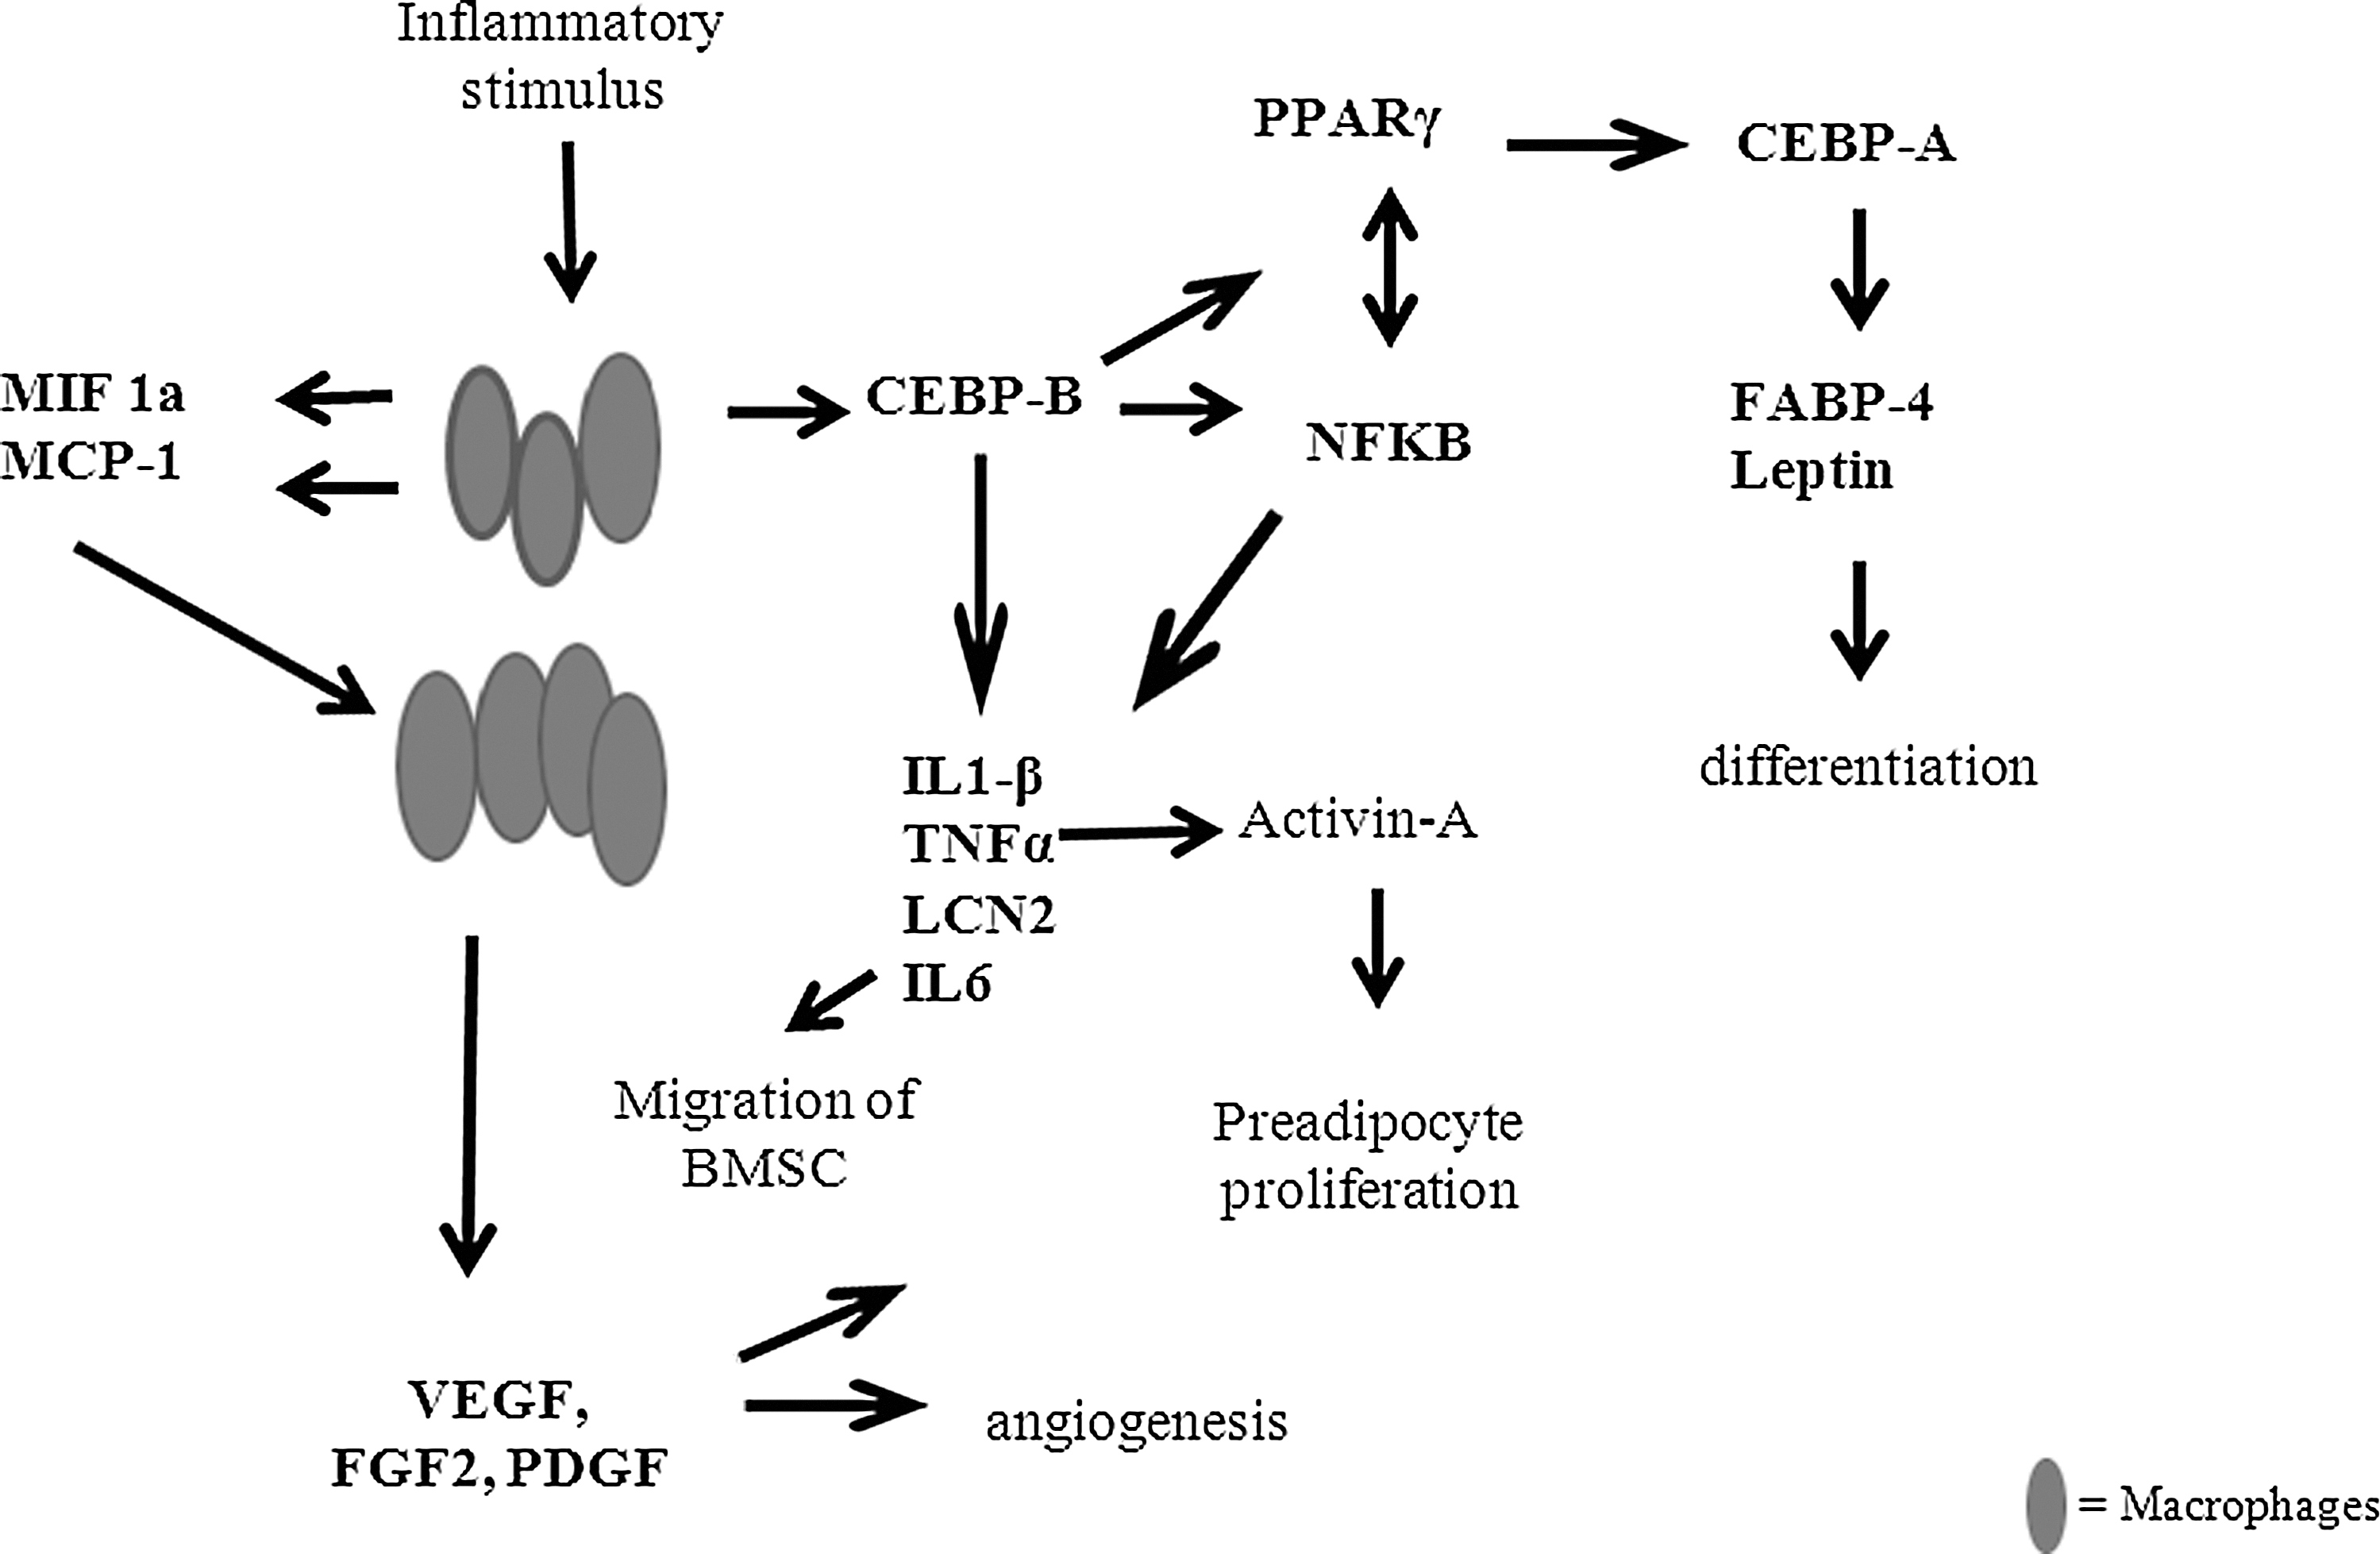
Schematic showing potential pathways for inflammatory mediators involvement in the key aspects of adipogenesis, cell recruitment, angiogenesis, preadipocyte proliferation, and differentiation. All cytokines labeled in bold were investigated in this study; however, Activin-A was not.
Of interest are the significant increases in expression of CEBPβ and the inflammatory cytokines regulated by this transcription factor at day 7. This increase after inflammation has begun to resolve may be due to the BMSC in the chamber. While BMSC are mildly immunosuppressive, activation of the TLR by factors such as Zy-A (TLR2 ligand), and fibrinogen, fibronectin, and HSPG as potential TLR4 ligands in the chamber could lead in turn to the BMSC expressing CEBPβ-driven factors and this may explain the biphasic reactions we see in our gene and protein expression assays. A second significant increase in expression of CEBPβ is seen at D14. MIF expression also increased, as did NFκB, a mutual antagonist to PPARγ, possibly due to the activation of TLR-4. With the reduction of other inflammatory factors and the increase adipogenic and growth related genes such as PPARγ, CEBPα, FABP4, and LCN-2, differentiation can be induced and tissue growth occurs (Fig. 7).
Here we have provided a model for how new adipose tissue growth is occurring, through adipose progenitor recruitment and modulation of BMSC and macrophage activity. Understanding how inflammation can trigger adipose recruitment and growth may give us new targets to fight obesity, by blocking the action of TLR on macrophage and BMSC signaling. From a tissue engineering perspective, we can use this information to guide soft tissue reconstruction to develop controllable stable adipose tissue for reconstructive purposes.
Footnotes
Acknowledgments
This work was supported by the Sigrid Juselius Foundation and Academy of Finland (HL), NHMRC grant 454656, and the Microsurgery Foundation. We gratefully acknowledge Liliana Pepe, Anna Defteros, and Sue Mackay for surgical assistance in the Experimental Medical and Surgical Unit, St Vincent's Hospital, Melbourne, and associate professor Tony Penington for statistical advice. The O'Brien Institute acknowledges the Victorian State Government's Department of Business Innovation Operational Infrastructure Support Program.
Author Disclosure Statement
No competing financial interests exist.