
Abstract
Despite the enormous progress in studying definitive endoderm (DE) differentiation from human embryonic stem cells (hESCs), none of the reported protocols have produced a universal, cost-effective, and competent DE with the capability to further differentiate into endodermal derivatives. In this study, by using a 2-step differentiation strategy, we have treated hESCs for 1 day with “priming” small molecules (SM), [stauprimide, NSC-308848, rapamycin (Rapa), and/or CHIR] and for the next 3 days with “inducing” SM (LY294002, cymarin, IDE1, and/or IDE2) in conjunction with activin A. In the positive control group, we treated hESCs with Wnt3a (25 ng/mL) for 1 day and activin A (100 ng/mL; W/A100-A100) for the next 3 days. Gene expression analysis showed that treatment of hESCs with 100 nM Rapa and 50 ng/mL activin A (Rapa-A50) out of 25 combinations of factors gave rise to higher expressions of 2 DE-specific genes, SOX17 and FOXA2. Similar results were obtained after treating 2 other hESC lines with this regimen. To investigate the competency of Rapa-A50-induced DE for further differentiation into endodermal derivatives, these cells and W/A100-A100-induced DE cells (positive control) were further differentiated into pancreatic progenitors (PP), then into pancreatic endocrine (PE) cells using 5 previously described differentiation protocols. Gene analysis of differentiated cells showed that the established protocols were insufficient to enable universal differentiation into PE, whereas Rapa-A50-induced DE cells were more competent for PP differentiation in a protocol-dependent manner. Additionally, Rapa-A50-induced DE had the capability to differentiate into hepatocyte-like cells (HLCs) as efficiently as W/A100-A100-induced DE. These data have indicated that hESCs primed with Rapa, and induced by a lower concentration of activin A, could lead to DE that had the capability to further differentiate into HLCs and PP cells, but not PE cells. Thus, current protocols for the differentiation of DE into PE still need additional study.
Introduction
H
Additionally, while the scale-up generation of hESC-derived DE offers a promising approach for clinical applications, reported differentiation protocols are costly or to date their cost has not been defined. Therefore, bringing a cell to the clinic setting mandates the development of a cost-effective, efficient process that consistently produces desired cells that are functional and safe.
An alternative for the replacement of replace growth factors is small molecules (SMs) [9 –13]. Cell-permeable bioactive SMs are low molecular weight molecules that are less expensive and possibly more efficient than growth factors in directing differentiation. SMs can reversibly affect the function(s) of single or multiple proteins with excellent temporal control and without genetic modification(s). Therefore, they can target intracellular signaling pathways of hESCs to differentiate into different cell fates such as neural cells [14 –16] and cardiomyocytes [17]. SMs have also been used for differentiation of hESCs into pancreatic cells [18,19]. SMs such as IDE1 and IDE2 have been shown to produce DE cells from hESCs more efficiently than activin A [19].
Additionally, it has been demonstrated that some SMs prime hESCs for differentiation [20]. Possibly, these SMs downregulate pluripotency markers involved in the maintenance of hESC self-renewal and thereby prime hESCs for differentiation in response to intra- and extracellular signaling stimuli. For example, Spd is able to suppress pluripotency by inhibiting C-Myc signaling, therefore, priming hESCs for lineage-specific differentiation [21]. Despite the tremendous progress in studying DE differentiation, the SMs that have a significant role in reproducible and universal differentiation, and the competency of differentiated DE cells for further differentiation into derivatives are still largely unknown.
After testing different combinations of SMs in the “priming” and “inducing” steps, we have described a protocol that uses one SM, rapamycin (Rapa), to prime hESCs followed by activin A for DE induction. This treatment leads to an efficient DE differentiation of hESCs. With this protocol the activin A concentration is reduced by half. The resultant DE has the capability to further differentiate into hepatic cells and pancreatic progenitors (PP), but not pancreatic endocrine (PE) cells, which are similar to differentiated DE cells derived by Wnt3a and activin A treatment [22].
Materials and Methods
hESCs culture
We used the hESC lines, Royan H6 (RH6) at passages 30–60, Royan H2 (RH2) at passages 50–55, and Royan H5 (RH5) at passages 33–34 [23] in these experiments. hESC lines were maintained on matrigel (Sigma-Aldrich; E1270) in hESC medium that consisted of Dulbecco's modified Eagle's/Ham's F12 medium (DMEM/F12; Invitrogen, 21331-020); 20% (vol/vol) knockout serum replacement (KOSR; Invitrogen, 10828-028); 1% (vol/vol) nonessential amino acids (NEAAs; Invitrogen, 11140-050); penicillin/streptomycin (Invitrogen; 15140-122); ITS (insulin 1 mg/mL, transferrin 0.55 mg/mL, selenium 0.00067 mg/mL; Invitrogen, 41400-045); 2 mM L-glutamine (Invitrogen; 25030-032); 0.1 mM β-mercaptoethanol (2 ME; Sigma-Aldrich, M7154); and 100 ng/mL basic fibroblast growth factor (bFGF; Royan Institute). Cells were grown in 5% CO2 at 95% humidity and passaged at a 1:4–1:6 split ratio every 7 days with daily medium changes.
Differentiation protocol to DE
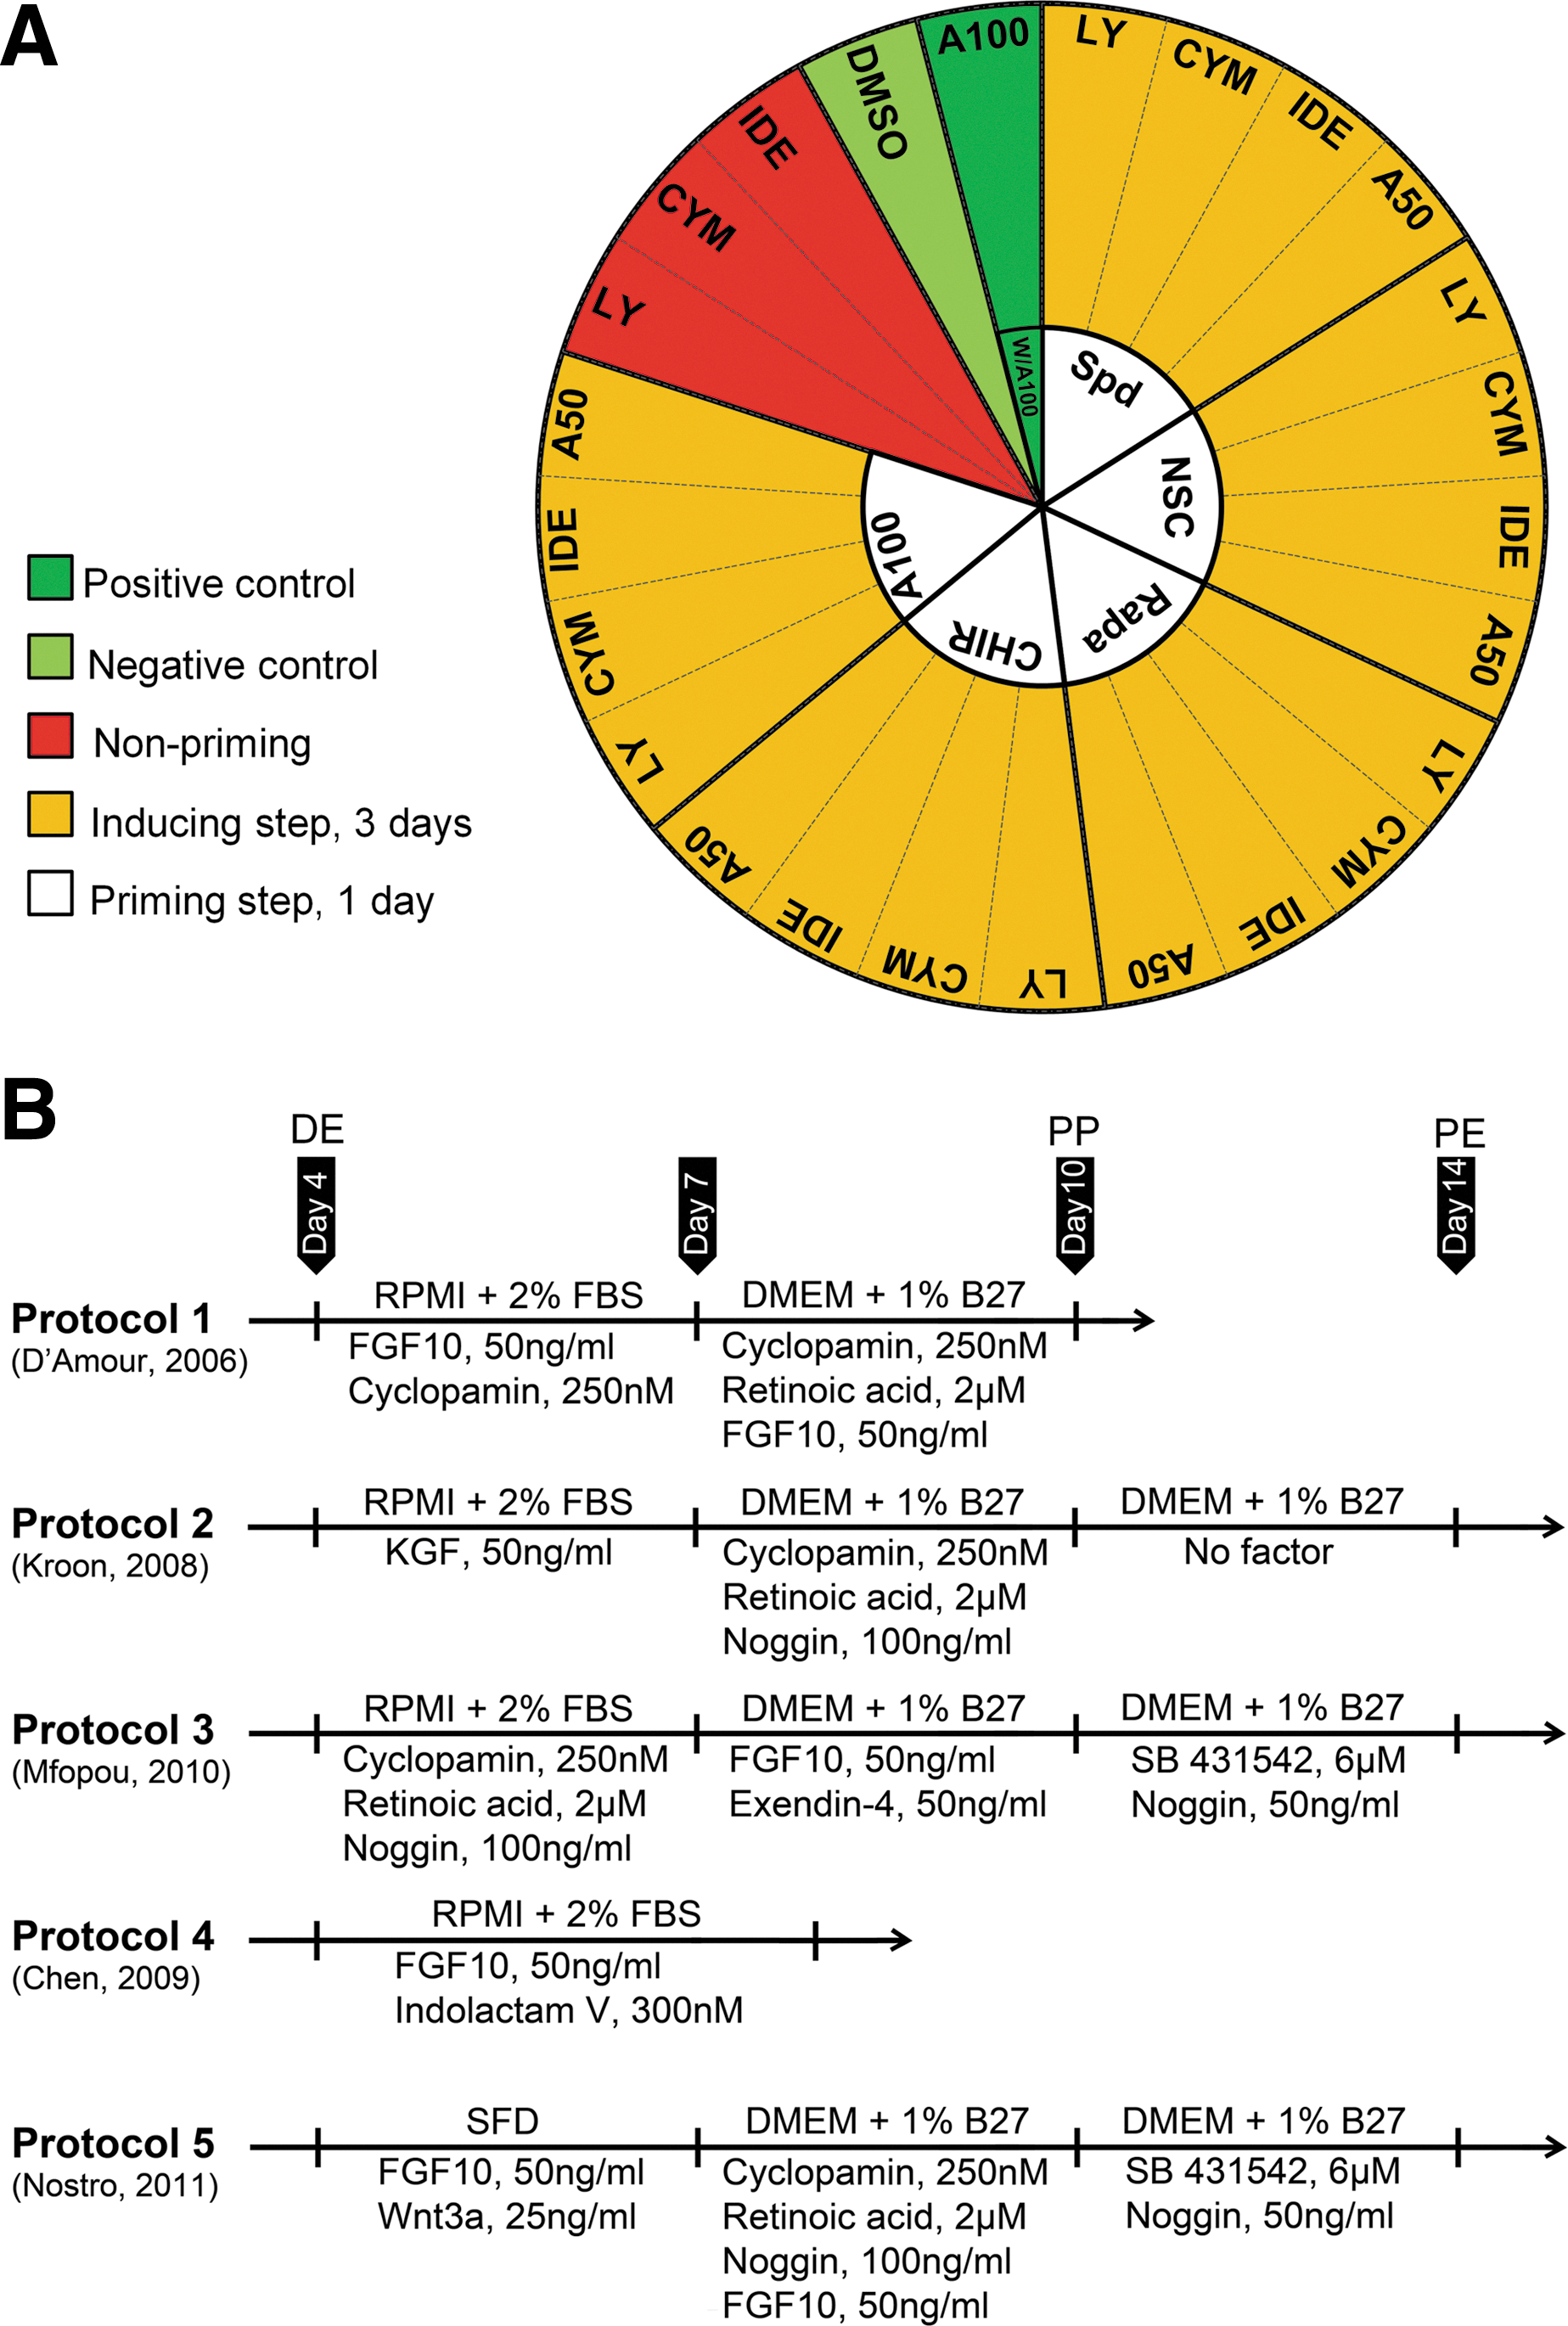
hESCs were differentiated into DE in a 2-step protocol that consisted of priming for 1 day and induction for 3 days as shown in Fig. 1A. Before the priming step, we washed the cells in Dulbecco's phosphate buffered saline (DPBS; Invitrogen, 104040-182). Then, hESCs were treated for 1 day with the “priming” factors Spd, NSC308848 (NSC), Rapa, and CHIR99021 (CHIR) [21,24 –26]. Over the next 3 days, cells were treated with the “inducing” factors, LY 294002 (LY), cymarin (CYM), and IDE [19,27,28]. hESCs were treated in RPMI 1640 (Invitrogen; 51800-035) supplemented with NEAAs, L-glutamine, penicillin/streptomycin, and 0.2% of defined fetal bovine serum (FBS; HyClone, SH3007002). The abbreviations, concentrations, mechanisms of action, and references used for each factor are summarized in Tables 1 and 2.
Experimental groups for testing endoderm and protocols for pancreatic fate induction.
IC, inhibitory concentration.
hESC, human embryonic stem cell; TGF, transforming growth factor.
We used the protocol of D'Amour et al. [22] as the positive control protocol by treating hESCs with activin A (100 ng/mL) and Wnt3a (25 ng/mL) followed by 100 ng/mL of activin A (W/A100-A100). Dimethyl sulfoxide (DMSO), the vehicle, was the negative control used for 4 days. In some treatments, hESCs were induced without priming. Therefore, in this study we treated hESCs in 25 different combinations of priming and inducing factors.
Differentiation into pancreatic and hepatic fates
For PP differentiation (days 4 to 10, Fig. 1B), 5 previously reported protocols (P1 to P5) were used [7,18,22,29,30]. For PE differentiation (days 10 to 14, Fig. 1B), we continued P2 and P5 without modifications. P3 used the same regimen as P5. The working concentrations of inducers are shown in Fig. 1B. The medium was changed every day. Recombinant mouse Wnt3a (1324-WN-002), human FGF10 (345-FG-025), human noggin (6057-NG-025), and human KGF (251-KG-010) were purchased from R&D Systems. All-trans retinoic acid (RA, R2500), DAPT (D5942), exendin 4 (E7144), and SB 431542 (S4317) were purchased from Sigma-Aldrich. KAAD-cyclopamine (K171000) was purchased from Toronto Research Chemicals and Indolactam V (04-0020) was obtained from Stemgent.
For hepatic differentiation, we used a previously published protocol [6] with modifications (Fig. 7A). Hepatocyte basal medium (HBM; Lonza, CC-3199) supplemented with SingleQuots (Lonza; CC-4182) was used as the medium during differentiation and referred to as HCM. FGF-4 (EX1516), hepatocyte growth factor (HGF) (294-HG), and oncostatin M (OSM, 295OM) were purchased from R&D Systems and dexamethasone (Dex, D-2915) was obtained from Sigma-Aldrich.
RNA isolation and real time reverse transcriptase-polymerase chain reaction
We used the RNeasy Mini Kit (QIAGEN; 74104) to extract total RNA from samples of hES, DE, PP, PE cells, and hepatocytes according to the manufacturer's protocol. RNA samples were treated with an RNase-Free DNase (QIAGEN; 79254) to remove contaminating genomic DNA. The total RNAs were reverse transcribed by the RevertAid H Minus First Strand cDNA Synthesis Kit (Fermentas; K1632) using a 0.2 μg random hexamer primer and 1 μg total RNA according to the manufacturer's instructions.
Real time reverse transcriptase (RT)-polymerase chain reaction (PCR) was performed in a Rotor-Gene 6000 instrument (Corbett Life Science) with the following program: stage 1: 95°C for 10 min, followed by stage 2: 95°C for 10 s, 60°C for 30 s, and 72°C for 30 s, for 40 cycles. The PCR mix in each well included 10 μL of SYBR®Premix Ex Taq™ II (RR081Q; Takara Bio, Inc.), 6 μL dH2O, 1 μL each of the forward and reverse primers (5 pmol/μL), 2 μL of single strand cDNA (16 ng/μL) in a final reaction volume of 20 μL. Relative gene expression was analyzed using the comparative Ct method, 2−ΔΔCt [31]. The output data from Rotor-Gene 6000 analysis software (version 1.7; Corbett Life Science) were transferred to Microsoft Excel for further analysis. For each sample, we calculated its relative expression level by normalization of the target genes to GAPDH as a reference gene, which were then calibrated against day 0 hESCs. Samples were obtained from 3 to 5 independent biological replicates and all reactions were performed in duplicate. The primers used were designed with Perl Primer software [32]. Primer sequences, expected product size and GenBank accession numbers are listed in Supplementary Table S1(Supplementary Data are available online at
Immunofluorescent staining and flow cytometry analysis
For immunofluorescent staining, cells were fixed in 4% wt/vol paraformaldehyde (Sigma-Aldrich; P6148) for 15 min at 25°C, permeabilized in 0.1% Triton X-100 (10 min, 25°C), and blocked in 10% secondary antibody host serum in 0.5% bovine serum albumin (BSA) (1 h, 37°C); then they were incubated with primary antibodies (Supplementary Table S2) that were diluted in 0.5% BSA for 24 h at 4°C. Cells were subsequently washed with PBS-Tween 20 (PBST) and incubated with the secondary antibodies (Supplementary Table S2) for 1 h at 25°C followed by DNA staining with 4′,6-diamidino-2-phenylindole (DAPI; Sigma-Aldrich, D8417) for 3 min. Cells were observed under a fluorescence microscope (Olympus; BX51) and imaged with an Olympus DP72 digital camera mounted to the microscope. For negative controls, we omitted the primary antibodies and followed the same staining procedure. To quantify ALB, AFP or low-density lipoprotein (LDL)-positive cells, at least 5 images from different areas of each sample in 3 independent experiments were analyzed by ImageJ software (
For flow cytometry analysis, DE cells were dissociated with TrypLE (5 min, 37°C; Sigma-Aldrich, 12605028), washed with Ca2+- and Mg2+-free PBS supplemented with 0.1% BSA and 0.5 mg/mL ethylenediaminetetraacetic acid, and collected by centrifugation. After fixation, permeabilization, and blocking, cells were incubated for 24 h with primary antibodies at 4°C and for 60 min at 4°C with the secondary antibodies (Supplementary Table S2). Cells were analyzed on a BD FACS Calibur flow cytometer (BD Biosciences). All experiments were replicated thrice and the acquired data analyzed with Flowing Software (version 2.4; Turku Centre for Biotechnology).
Western blot analysis
Cells were lysed in commercial lysis buffer (Qproteome Mammalian Protein Prep Kit; QIAGEN, 37901) and protein concentrations were determined with the BCA protein assay (Pierce; 23225). Equal amount of total proteins (20 μg/lane) were boiled with denaturing loading buffer (200 mM Tris-HCl, pH 6.8, 50% Glycerol, 8% sodium dodecyl sulfate (SDS), 400 mM dithiothreitol, and 0.4% Bromophenol Blue) and then were run on 8% SDS-polyacrylamide gels for 120 min at 15 mA constant and transferred to polyvinylidene fluoride (PVDF) membranes. Membranes were blocked in 5% nonfat dry milk (GE; CPK1075) in Tris-buffered saline with 0.1% Tween-20 (TBST, pH 7.6), according to the antibody manufacturer's protocol. After a brief wash, PVDF membranes were incubated with SOX17, FOXA2, and GAPDH primary antibodies (Supplementary Table S2) diluted in 5% nonfat dry milk-TBST for 2 h at room temperature. All signals were normalized with the GAPDH signal as the loading control. After washing with TBST the membranes were incubated with horseradish peroxidase-conjugated secondary antibodies (Supplementary Table S2) for 120 min at room temperature followed by detection using ECL prime (GE; RPN2232V2). Subsequently, the films were scanned with densitometer (Bio-Rad GS-800) and protein bands quantified using ImageJ 1.44p software (NIH).
Uptake of LDL
LDL, a lipoprotein that transports cholesterol throughout the body for use by various cells, is mostly absorbed and metabolized in the liver. Therefore, we sought to determine whether hESC-derived hepatocytes could absorb LDL by incubating the cells with 1,10-dioctadecyl-10-3,3,30,30-tetramethyl-indo-carbocyanine perchlorate that had been conjugated into acetylated LDL (DiI-Ac-LDL; Biomedical Technologies, Inc., 9202K08). Cells were harvested, washed with PBS, and then stained as described in the manufacturer's protocol. Nuclei were counterstained with DAPI and the treated cells were observed using a fluorescent microscope (BX51; Olympus).
Periodic acid-Schiff staining
Glycogen storage of hESC-derived hepatocytes was evaluated with periodic acid-Schiff (PAS) staining at day 19 of differentiation. Culture dishes that contained the cells were fixed with 4% paraformaldehyde, oxidized in 1% periodic acid for 5 min, and rinsed in dH2O. Afterward, we treated the cells with Schiff's reagent for 15 min with subsequent color development in dH2O for 5–10 min and assessed them under a light microscope (BX51; Olympus).
Testis capsule transplantation and histology
For the in vivo assay, we used a previously reported method [33]. In brief, approximately 2×10⁶ of either RH6 hESCs, Rapa-A50- or W/A100-A100-induced DE cells were dissociated, mixed with 20–30 μL matrigel, diluted 1:1 in DMEM/F-12, and subsequently injected into the testes capsules of 4–5 week-old athymic nude mice. At 10 weeks after transplantation, mice were sacrificed; their testes capsules removed and fixed in 10% formaldehyde, embedded in paraffin wax, and analyzed using the hematoxylin and eosin stain for morphology.
Statistical analysis
We conducted all experiments in at least 3 independent biological replications. Data from real time RT-PCR and flow cytometry were expressed as mean±SD and the differences of the mean values statistically evaluated by SPSS software (version 16) using one-way analysis of variance (ANOVA) followed by Tukey's HSD and LSD post hoc tests. P-values less than 0.05 were significant.
Principle component analysis (PCA) was performed using the R program [33].
Results
Treatment of hESCs with different combinations of priming and inducing factors
To begin the suppression of pluripotency and synergize hESCs with inducing factors or target other signaling pathway(s) [21], we primed the hESCs prior to the induction of differentiation. DE induction was a 2-step process, priming for 1 day followed by induction for 3 days.
Before we used the SMs their toxicities at suggested bioactive concentrations were tested on RH6 hESC, according to the references shown in Table 1 and in cases where the suggested concentration was toxic (Supplementary Fig. S1). After performing a titration test, we chose the highest nontoxic concentration of SMs.
A100, Spd (200 nM), NSC (3 μM), CHIR (3 μM), and Rapa (100 nM) were used for the first step followed by LY (500 nM), CYM (25 nM), IDE (100 nM), and A50, which were used in the second step (Fig. 1A). In some cases, cells were treated without priming. According to the protocol by D'Amour et al., [22] we used W/A100-A100 as the positive control and DMSO as the negative control. The only toxic combination of SMs was NSC-CYM. Although 25 nM CYM was not toxic, it became toxic when used after NSC. To evaluate the efficiency of our experimental groups for endoderm induction, by the fourth day we used Q-PCR to analyze cells for expressions of SOX17 and FOXA2 (also known as HNF3b), 2 endoderm-specific markers [34,35] (Fig. 2). Comparison of the groups induced by SMs alone with their corresponding primed groups showed that priming with Rapa, CHIR, and A100 significantly increased the expressions of SOX17 and FOXA2 (Fig. 2).

Gene expression analysis of 2 definitive endoderm markers in different treatments at day 4. After treating hESCs with 4 priming factors, samples were analyzed for the expressions of SOX17 and FOXA2 by quantitative reverse transcriptase (RT)-polymerase chain reaction (PCR) at the end of the fourth day. In the nonprimed groups, hESCs were treated for 4 days with only the inducing factors. In the control groups, hESCs were treated with 0.1% dimethyl sulfoxide (DMSO) for 4 days and were considered to be the negative control. Cells were treated with wnt3a and activin A for the first day, followed by activin A for the next 3 days (W/A100-A100) as the positive control. The gene expression level of each nonprimed small molecule (SM)-treated group was compared to that of the equivalent primed groups. “a,” “b,” and “c,” respectively, indicate significant increases in gene expression levels of “A,” “B,” and “C.” The target gene expression level was normalized to GAPDH and presented relative to hESC. Data are presented as mean±SD. *Indicates significant difference from all other groups, at least P<0.05 as determined by ANOVA with Tukey's HSD test. n=3–4. Prim: Priming, Indu: Inducing.
In comparison with other treatments, cells from the Rapa-A50 and A100-A50 groups had the highest comparable expressions of both genes to the positive control (W/A100-A100). However, there was a significantly higher increase in SOX17 expression in Rapa-A50 compared with the other groups (P<0.05, Fig. 2).
Q-PCR analysis of other markers for DE (GSC and CXCR4), visceral endoderm (SOX7), mesoendoderm (BRA), and neuroectoderm (SOX1) for the RH6 hESC line showed upregulation of DE markers. However, SOX7, BRA, and SOX1 did not upregulate (Fig. 3). The expressions of pluripotency markers, OCT4 and SOX2 downregulated (Supplementary Fig. S2). Similar results were obtained for RH2 hESCs (Fig. 3). We also tested the Rapa-A50 protocol on another hESC line, Royan H5 [23] and on a human induced pluripotent stem cell line, hiPSC1 [36] and observed a significant increase in the expression levels of DE specific marker genes, SOX17, FOXA2, GSC, and CXCR4 (Supplementary Fig. S3). Therefore, we continued our experiments with the RH6 hESC line.
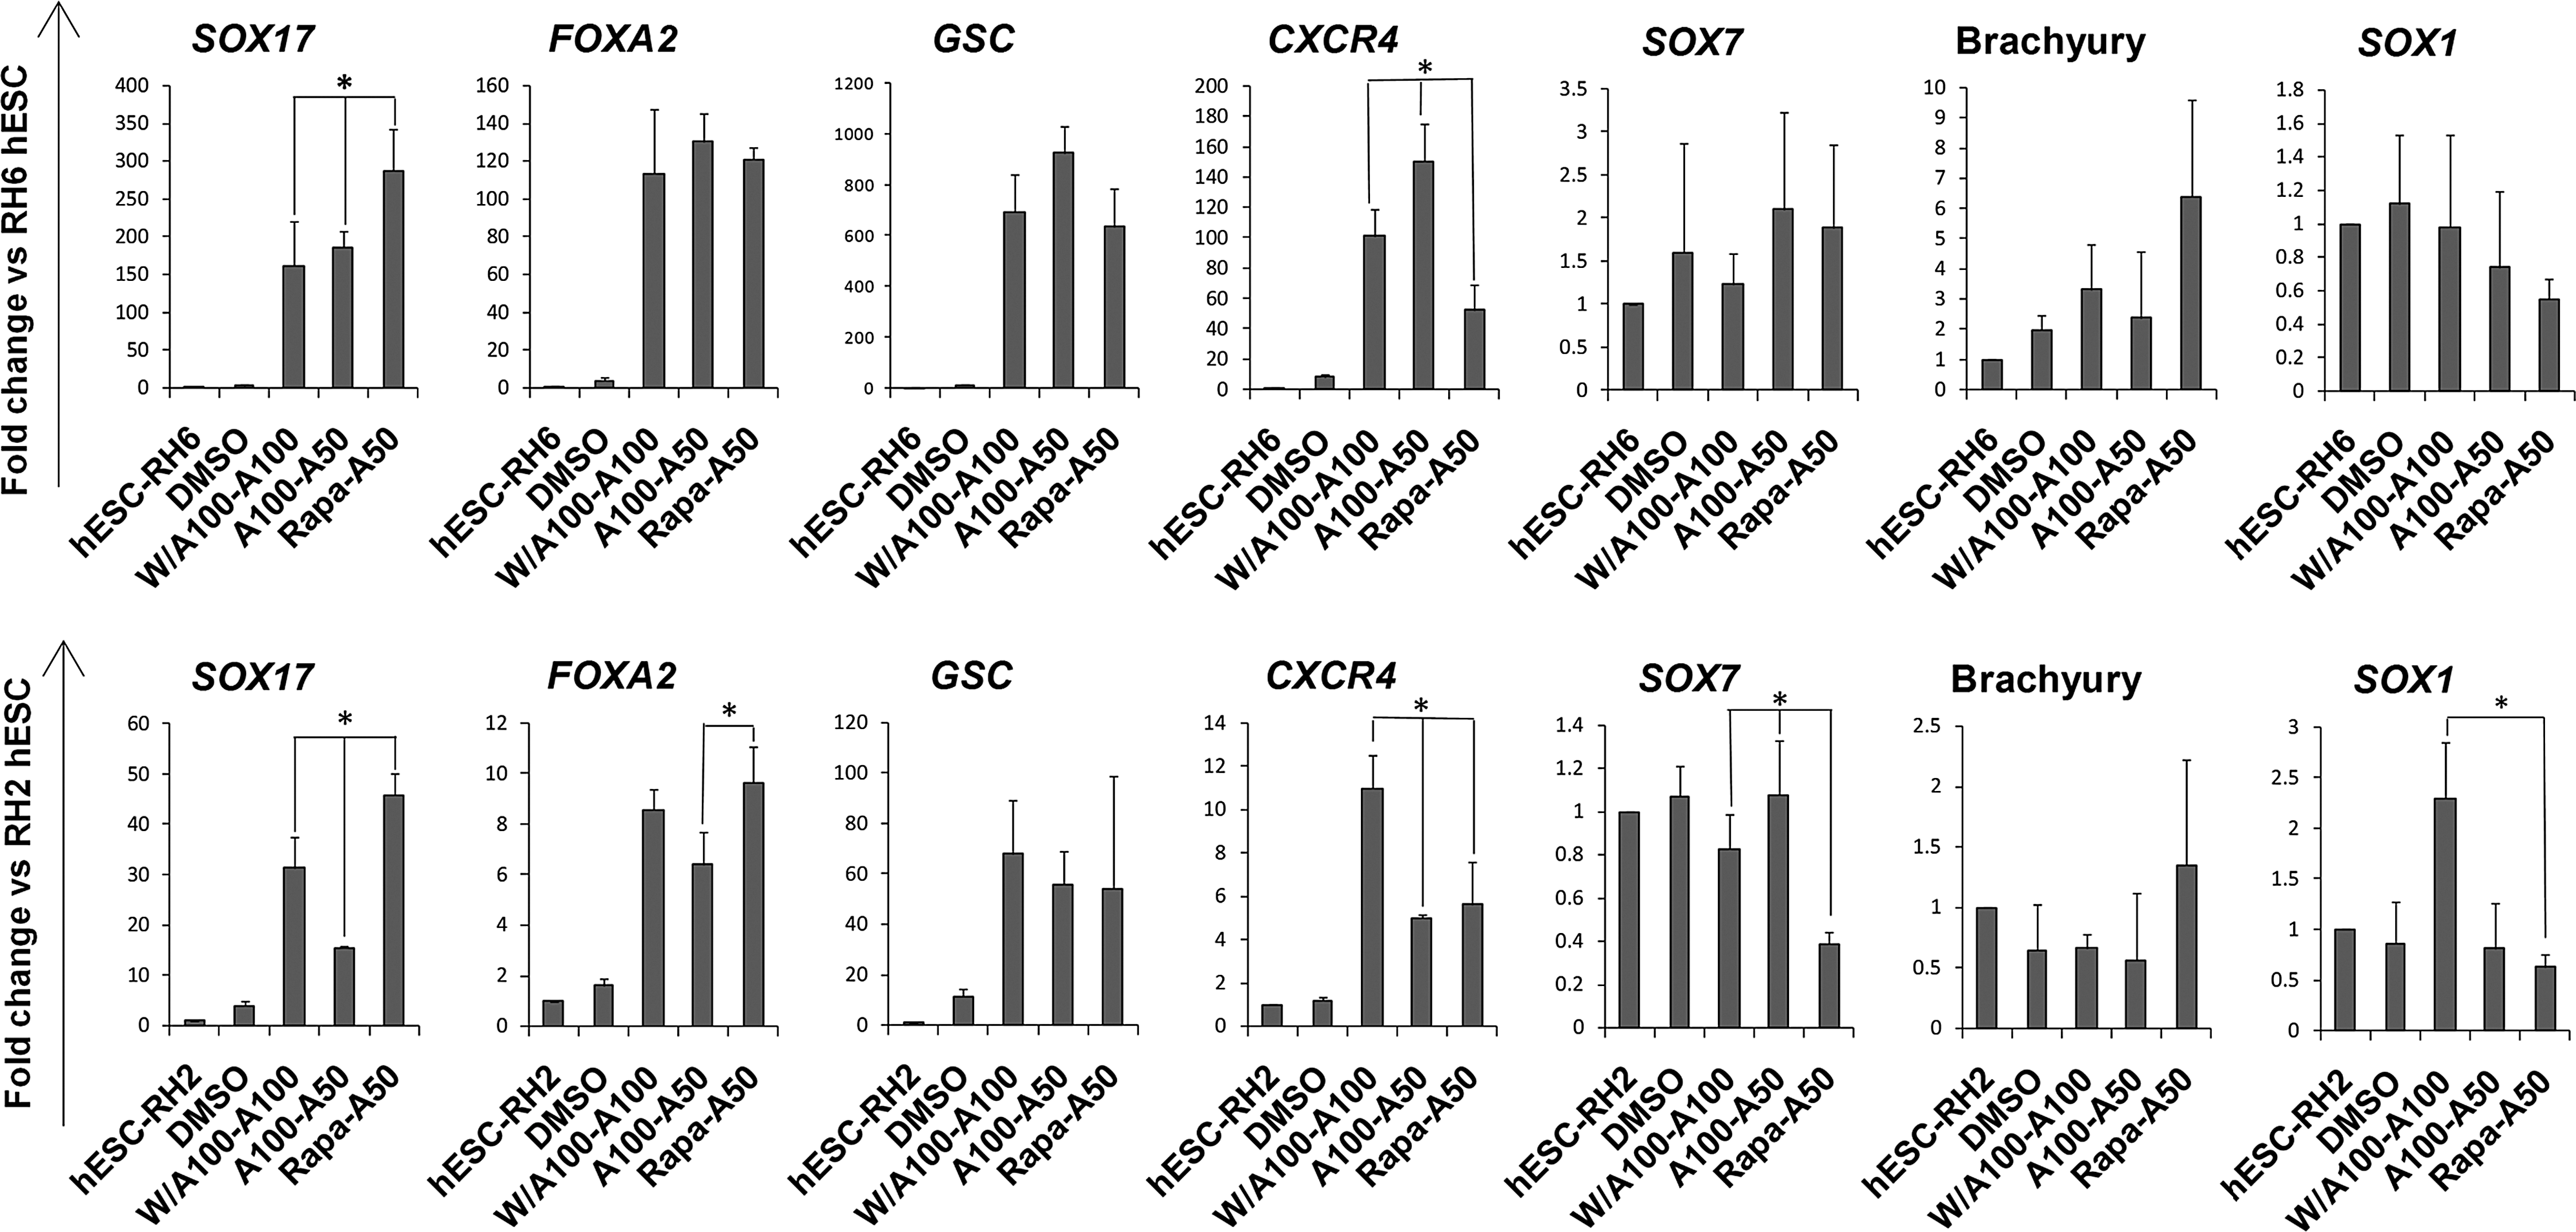
Lineage-specific gene expression analysis of 2 induced human embryonic stem cell (hESC) lines at the definitive endoderm step. As determined by quantitative RT-PCR, SOX17, FOXA2, GSC, and CXCR4 [definitive endoderm (DE) markers] highly expressed in Rapa-A50-treated RH6 (upper row) and RH2 (lower row) human embryonic stem cell (hESC) lines while SOX7 (visceral endoderm marker), Brachyury (mesoendoderm marker), and SOX1 (neuroectoderm marker) showed low-level expressions. The target gene expression level was normalized to GAPDH and presented relative to hESC. *Indicate significant difference between Rapa-A50-treated hESCs compared to the W/A100-A100- (positive control) and A100-A50-treated cells. Data are presented as mean±SD. P<0.05 as determined by ANOVA with Tukey's HSD test, n=3–4.
Next, we further analyzed the W/A100-A100, A100-A50, and Rapa-A50 groups at the protein level (Fig. 4). Immunofluorescence staining of the cells in the highest SOX17 and FOXA2 expression groups treated with W/A100-A100, A100-A50, and Rapa-A50 showed comparable expressions of SOX17 and FOXA2 proteins (Fig. 4A). Flow cytometry data indicated that Rapa-A50 treatment lead to SOX17 expression in 67%±10% of cells, an efficiency similar to treatment with W/A100-A100 (71%±12%) or A100-A50 (49%±17%). The number of FOXA2-positive cells in Rapa-A50-treated cultures (69%±13%) did not significantly differ from treatment with W/A100-A100 (53%±8%) or A100-A50 (52%±15%) (Fig. 4B).
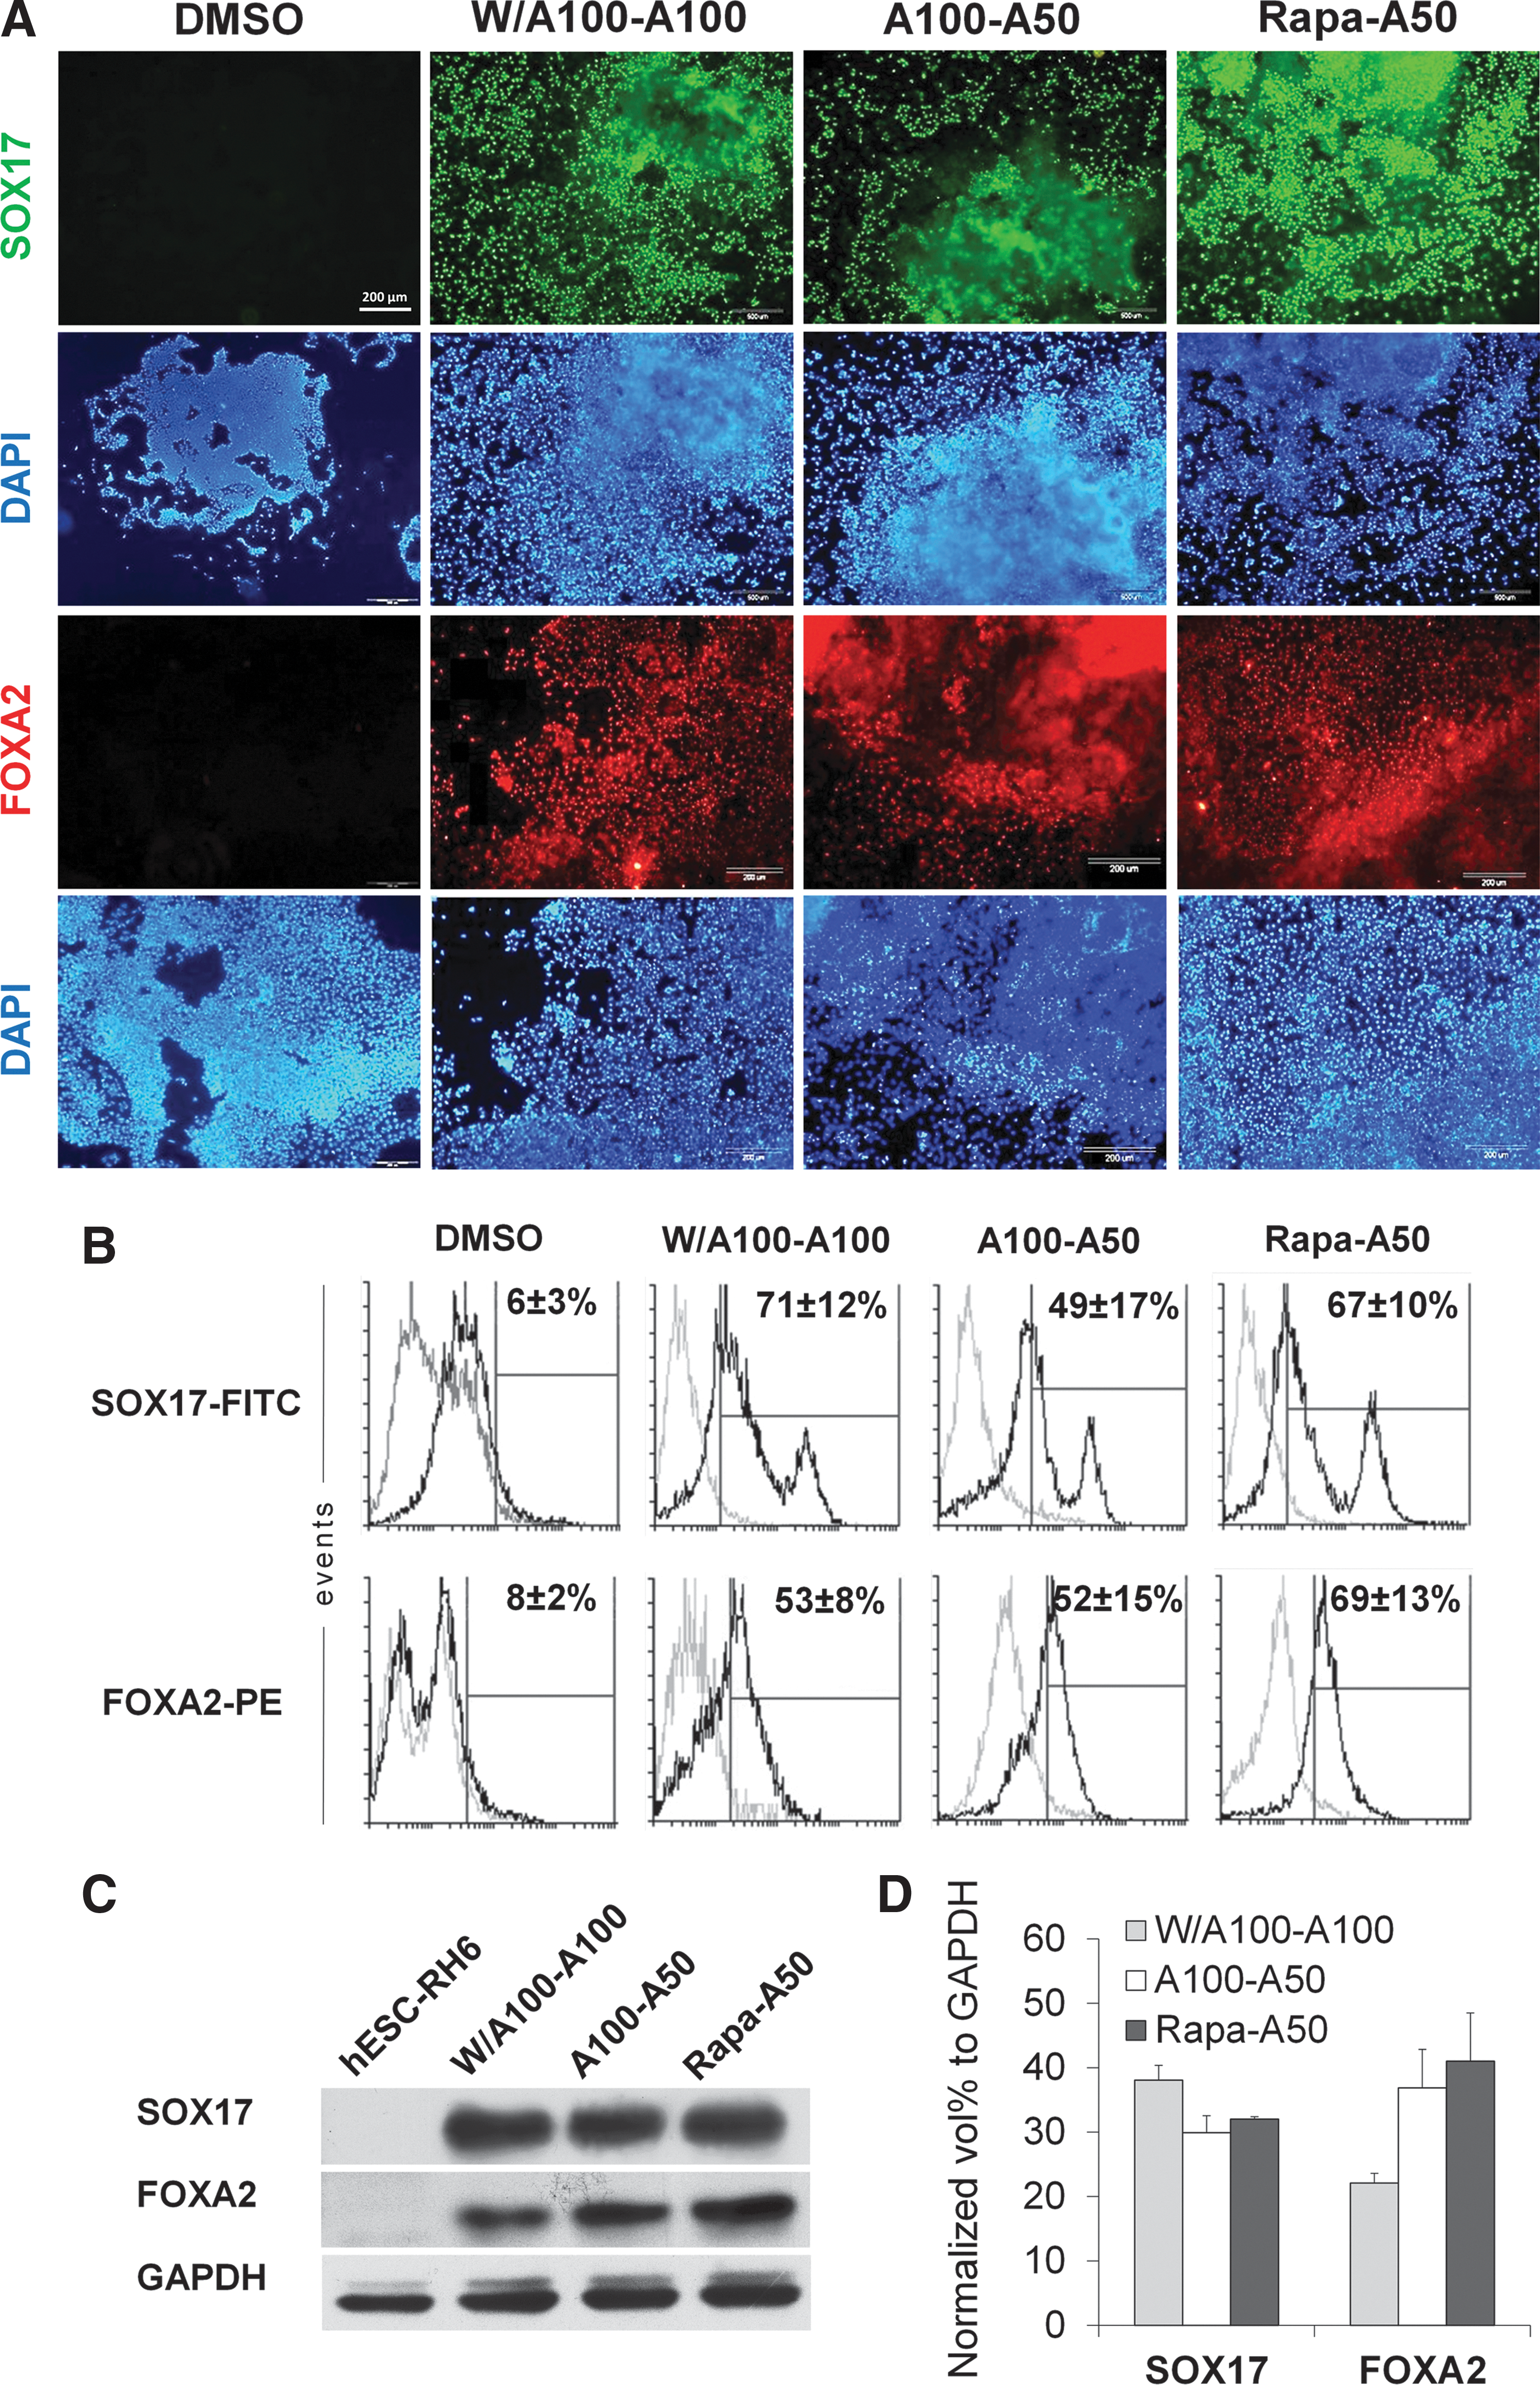
Protein expression analysis by immunofluorescence staining and flow cytometry at day 4 in Rapa-A50-induced definitive endoderm.
To further verify the qRT-PCR and flow cytometry data, we examined the expression levels of SOX17 and FOXA2, by western blotting, using protein extracts derived from the hESC RH6 line (Fig. 4C). The level of expression of both proteins showed there is not a significant difference in western blot results in treatments groups. The expression level of FOXA2 was higher in Rapa-A50-treated cultures compared with W/A100-A100 results, however, there was no significant difference between them (Fig. 4D). This trend was similar to flow cytometry data (Fig 4B).
Treatment of hESCs with IDE1 or IDE2 (SMs previously reported for DE induction) [19], for 4 days or their priming led to upregulation of SOX7 (visceral endoderm marker) while the expression of DE markers (SOX17, FOXA2, and CXCR4) showed very low levels (Fig. 2 and Supplementary Fig. S4).
Therefore, the Rapa-A50 protocol is able to produce DE cells from hESCs with efficiency similar to the previously described protocol, W/A100-A100 [22].
The competency of Rapa-A50-induced DE for differentiation
To determine the competency of Rapa-A50-induced DE we assessed their potential to differentiate into endodermal derivatives. We studied pancreatic and hepatic fates, both in vivo and in vitro.
The transplantation of whole, unselected Rapa-A50- and W/A100-A100-induced cells into the testes capsules of nude mice led to teratoma formation. These teratomas were smaller and contained more endodermal and mesodermal derivatives when compared with hESC-derived teratomas (Supplementary Fig. S5).
Pancreatic fate of Rapa-A50-induced DE cells in vitro by different protocols
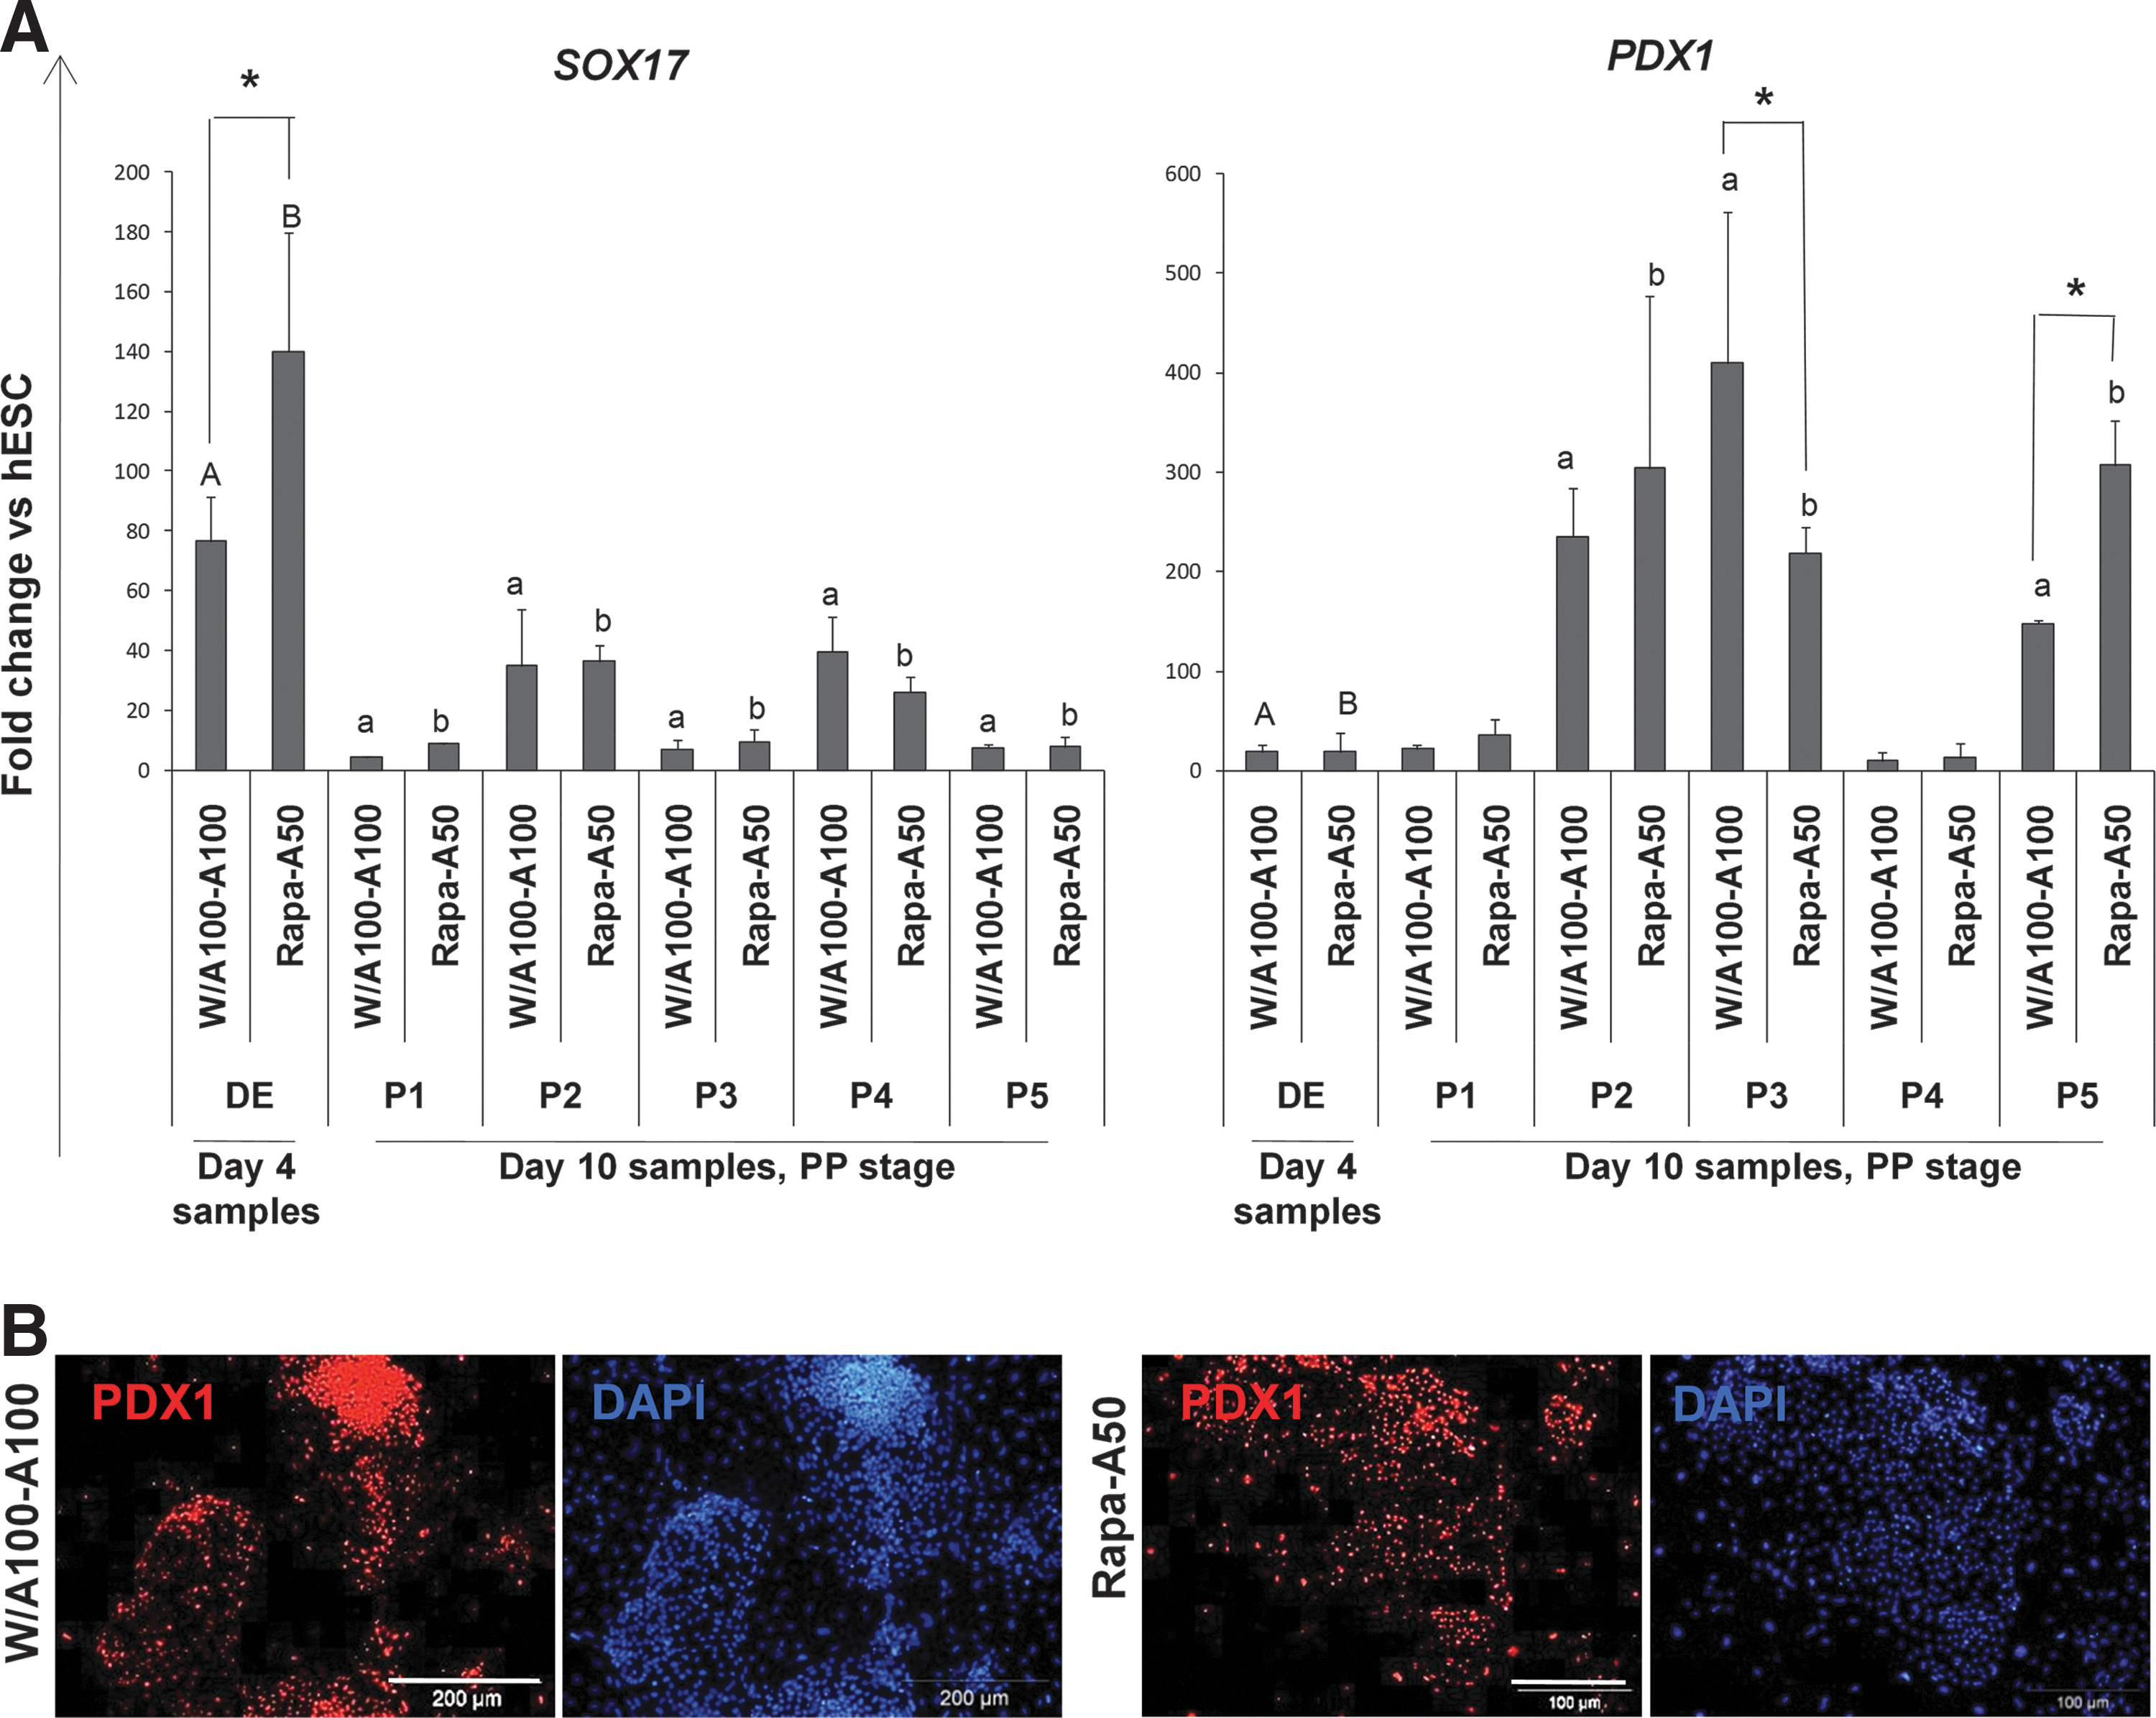
As the first step to pancreatic differentiation, we used the protocol of D'Amour et al. to differentiate the DE cells [22] (Fig. 1B, protocol P1). We used PDX1 expression as the PP marker [22,37]. Q-PCR analysis of the cells showed that although this protocol reduced expression of SOX17, which meant a transition from the DE step, it was not reproducible for our hESC line for either of the DEs derived from W/A100-A100 or Rapa-A50 (Fig. 5A). The expression of PDX1 was also not increased by P1 (Fig. 5A). Therefore, we used the other recently reported protocols and compared them for expressions of SOX17 and PDX1 (Fig. 5A). Q-PCR analysis demonstrated upregulation of PDX1 by protocols P2, P3, and P5 (Fig. 5A). However, the 2 starting DE cell types showed significantly different levels of PDX1 expression after treatment with protocols P3 and P5. In the P3 protocol, W/A100-A100-induced DE cells showed significantly higher PDX1 expression. In contrast, in the P5 protocol, higher PDX1 expression was observed in Rapa-A50-induced DE cells (Fig. 5A). Immunofluorescence staining of differentiated DE cells also showed PDX1 expression in the 3 protocols (Fig. 5B). We used undifferentiated hESCs as the negative control (Supplementary Fig. S6).
Differentiation of Rapa-A50-induced definitive endoderm into PP.
Rapa-A50-induced and W/A100-A100-induced DE cells were further differentiated into PE cells using selected stepwise protocols P2, P3, and P5 with the intent to compare their developmental potential. We compared the expression levels of ten pancreatic developmental markers during the 3 stages of differentiation (DE: day 4, PP: day 10, and PE: day 14) to those of hESCs (SC: day 0). The tested genes included several markers of earlier (HNF4a, HLXb9, HHEX, and PDX1) and later (NEUROD1, ISL1, NGN3, PTF1a, NKX6-1, and PAX4) stages of pancreatic development [22].
Endocrine (NGN3, NKX6-1, and PAX4) and exocrine (PTF1a) differentiation markers were rarely detected above hESC levels during the PP and PE stages. Most other tested markers showed downregulation during differentiation from the PP to the PE stage (Fig. 6A).
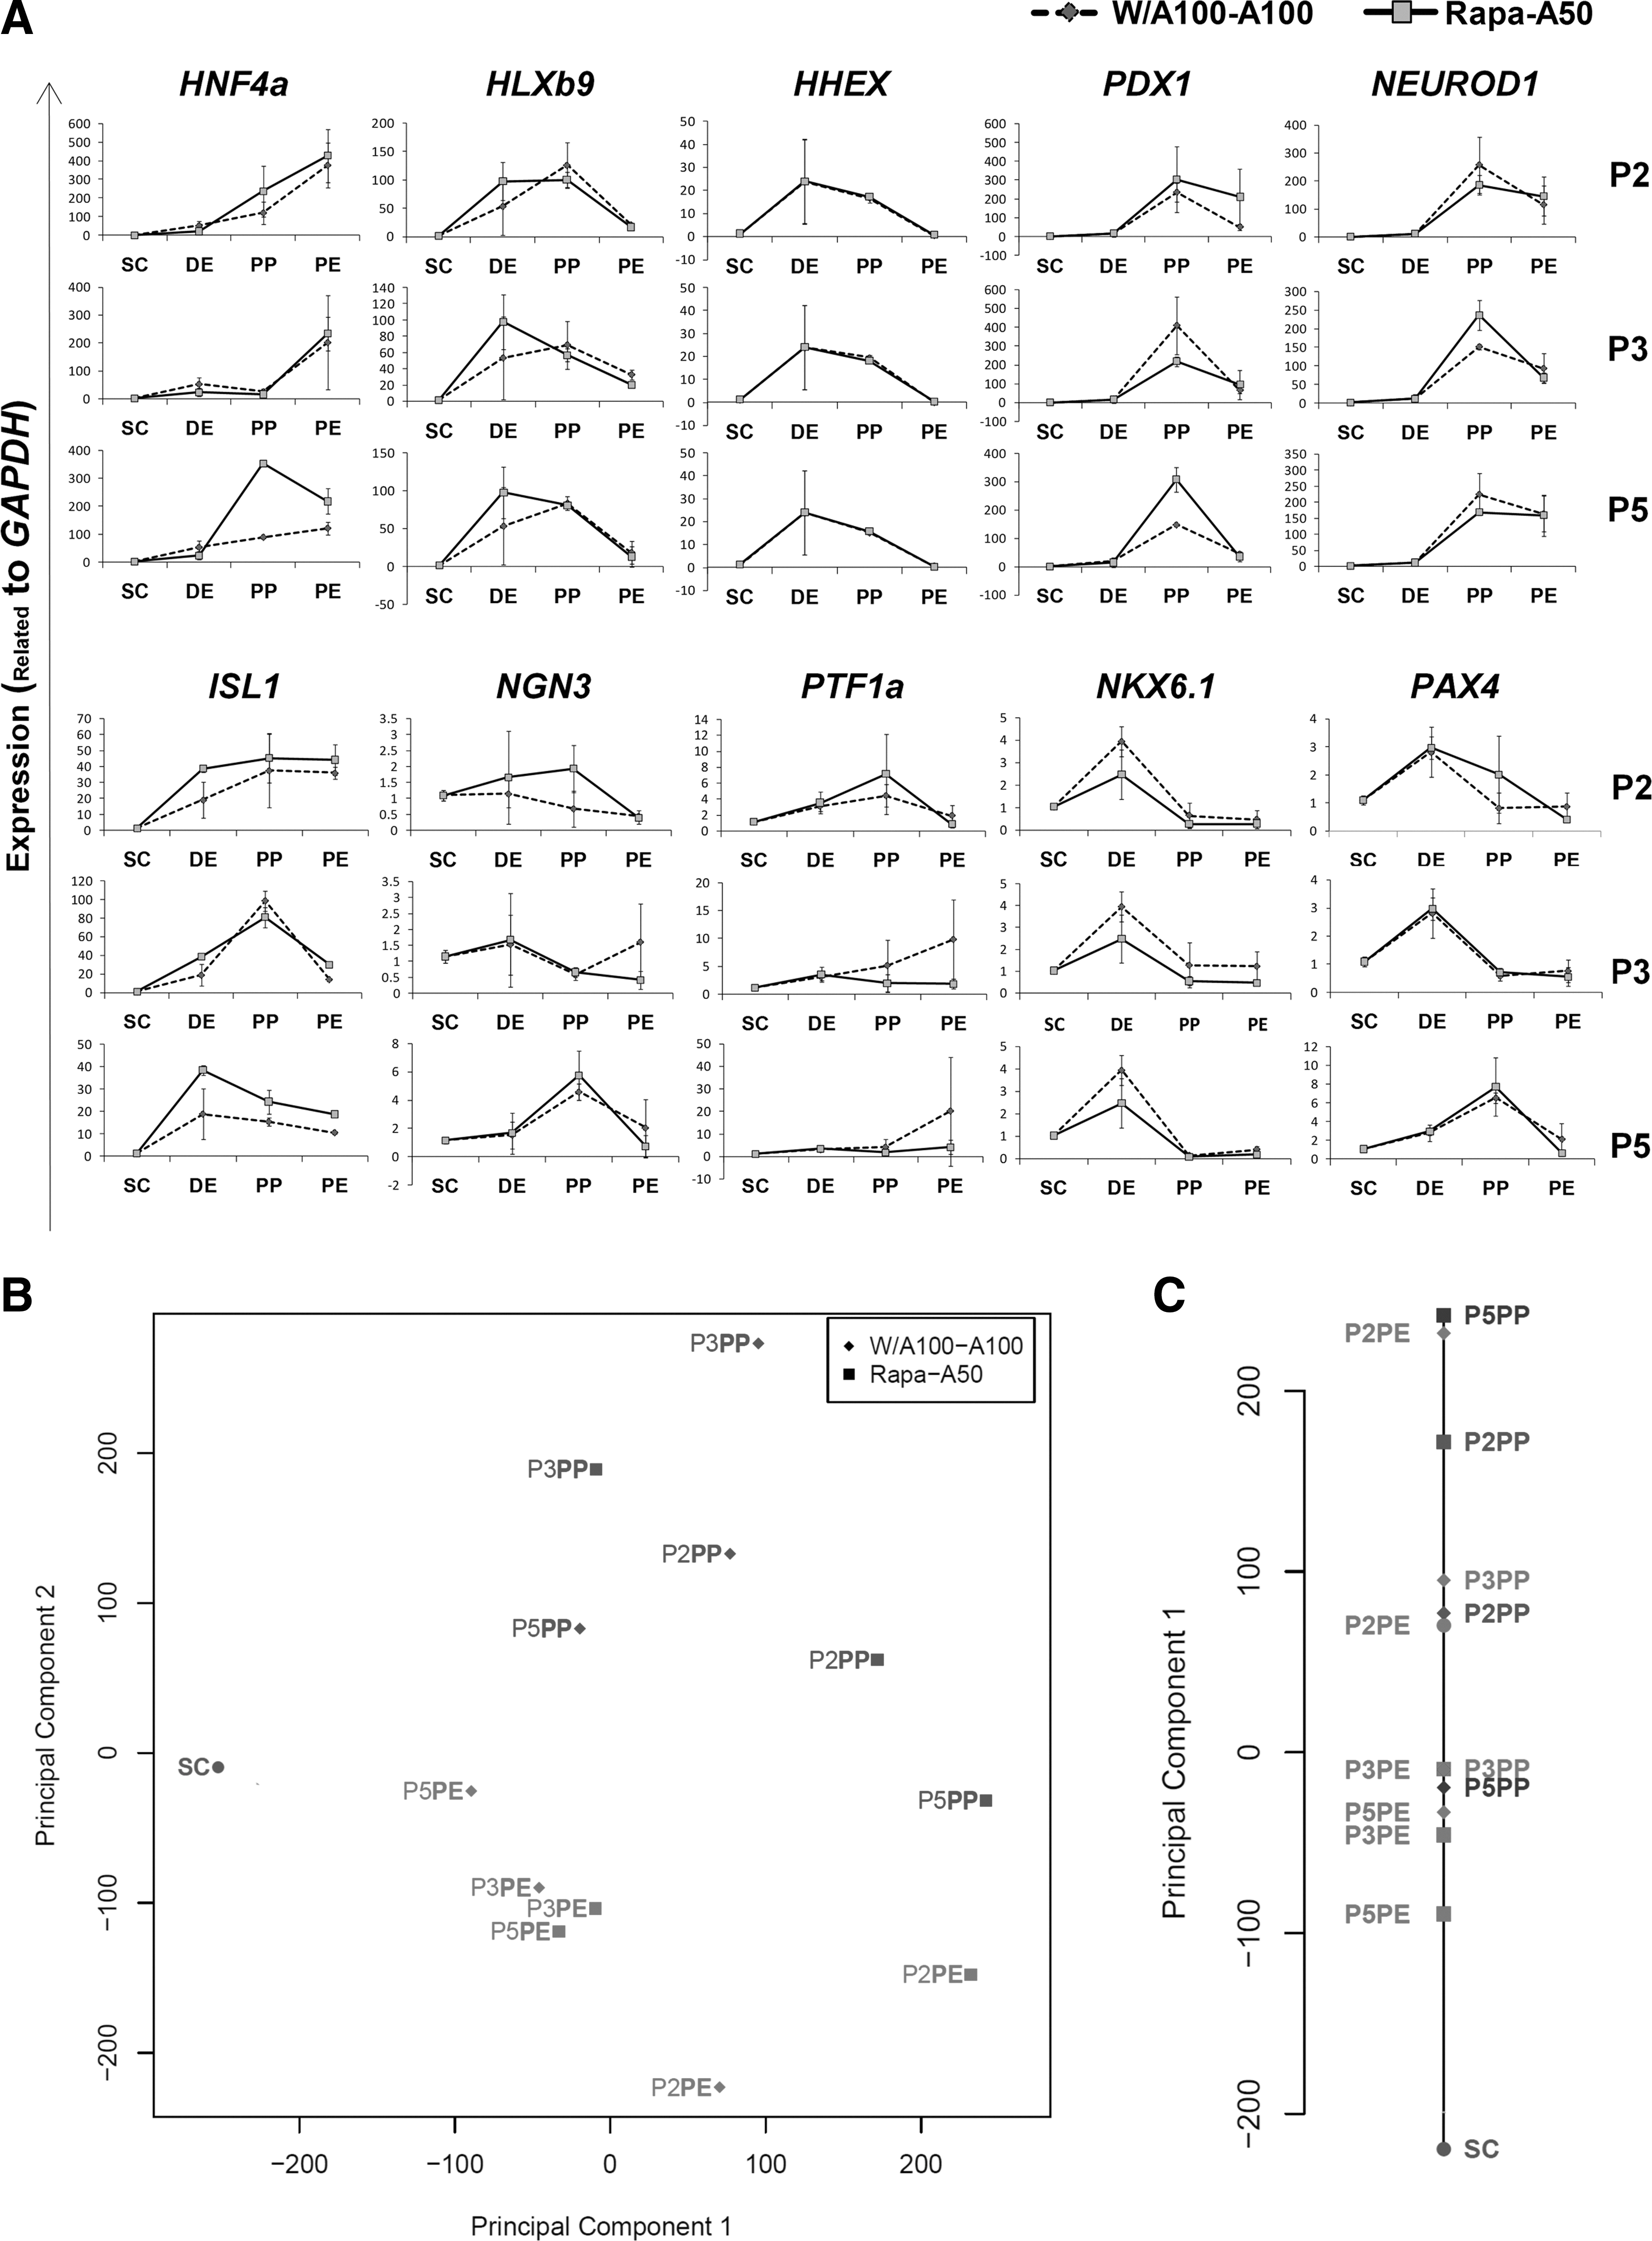
Temporal gene expression during the differentiation of Rapa-A50-induced definitive endoderm into PE cells.
We used PCA to further analyze expression results of the ten tested markers from 4 time points, 3 protocols, and 2 main DE groups. The average expression level of each gene within the replicates was calculated and the results analyzed by one- (1D) and two-dimensional (2D) PCA (Fig. 6B). According to the 2D PCA plot, there was a significant separation of the 4 differentiation stages (SC, DE, PP, and PE), which confirmed data quality and showed the different gene expression patterns of these cells. As indicated by 1-D PCA, although the averaged DE, PP, and PE samples were sorted along the foremost principal component 1 according to the differentiation stage, there was no significant separation between the PP and PE samples. This suggested that the protocols succeeded in differentiation of the cells up to the PP stage, but failed to differentiate PE from PP cells. Also, in protocols P2 and P5, the distance from the SC stage was significantly more for the PP cells derived from Rapa-A50-induced DE than those derived from W/A100-A100-induced DE (Fig. 6C).
Therefore, these results suggest that the established protocols are not sufficient for universal differentiation into PE. However, Rapa-A50-induced DE cells are more competent for PP differentiation by protocols P2 and P5.
Hepatic fate of Rapa-A50-induced DE cells in vitro
Hepatocytes are another clinically important cell type derived from DE. Therefore, investigating the competency of all in vitro produced DE cells for hepatic differentiation is important. During embryonic development the hepatic bud is derived from the ventral foregut under influence of FGF signals from adjacent cardiac tissue and BMP signals from mesenchymal cells [38]. By budding into the septum transversum, HGF stimulates the growth of hepatic tissue. Maturation factors such as the interleukin-6 family cytokine, OSM and glucocorticoid Dex are secreted from hematopoietic cells that migrate to the liver tissue and generate the organ's blood vessels [6,39]. One of the efficient published protocols for differentiation of hESCs into hepatic fates [6] mimics this developmental procedure. Therefore, we have used this protocol with slight modifications to further evaluate the competency of Rapa-A50-induced DE cells in comparison with W/A100-A100 (Fig. 7A).
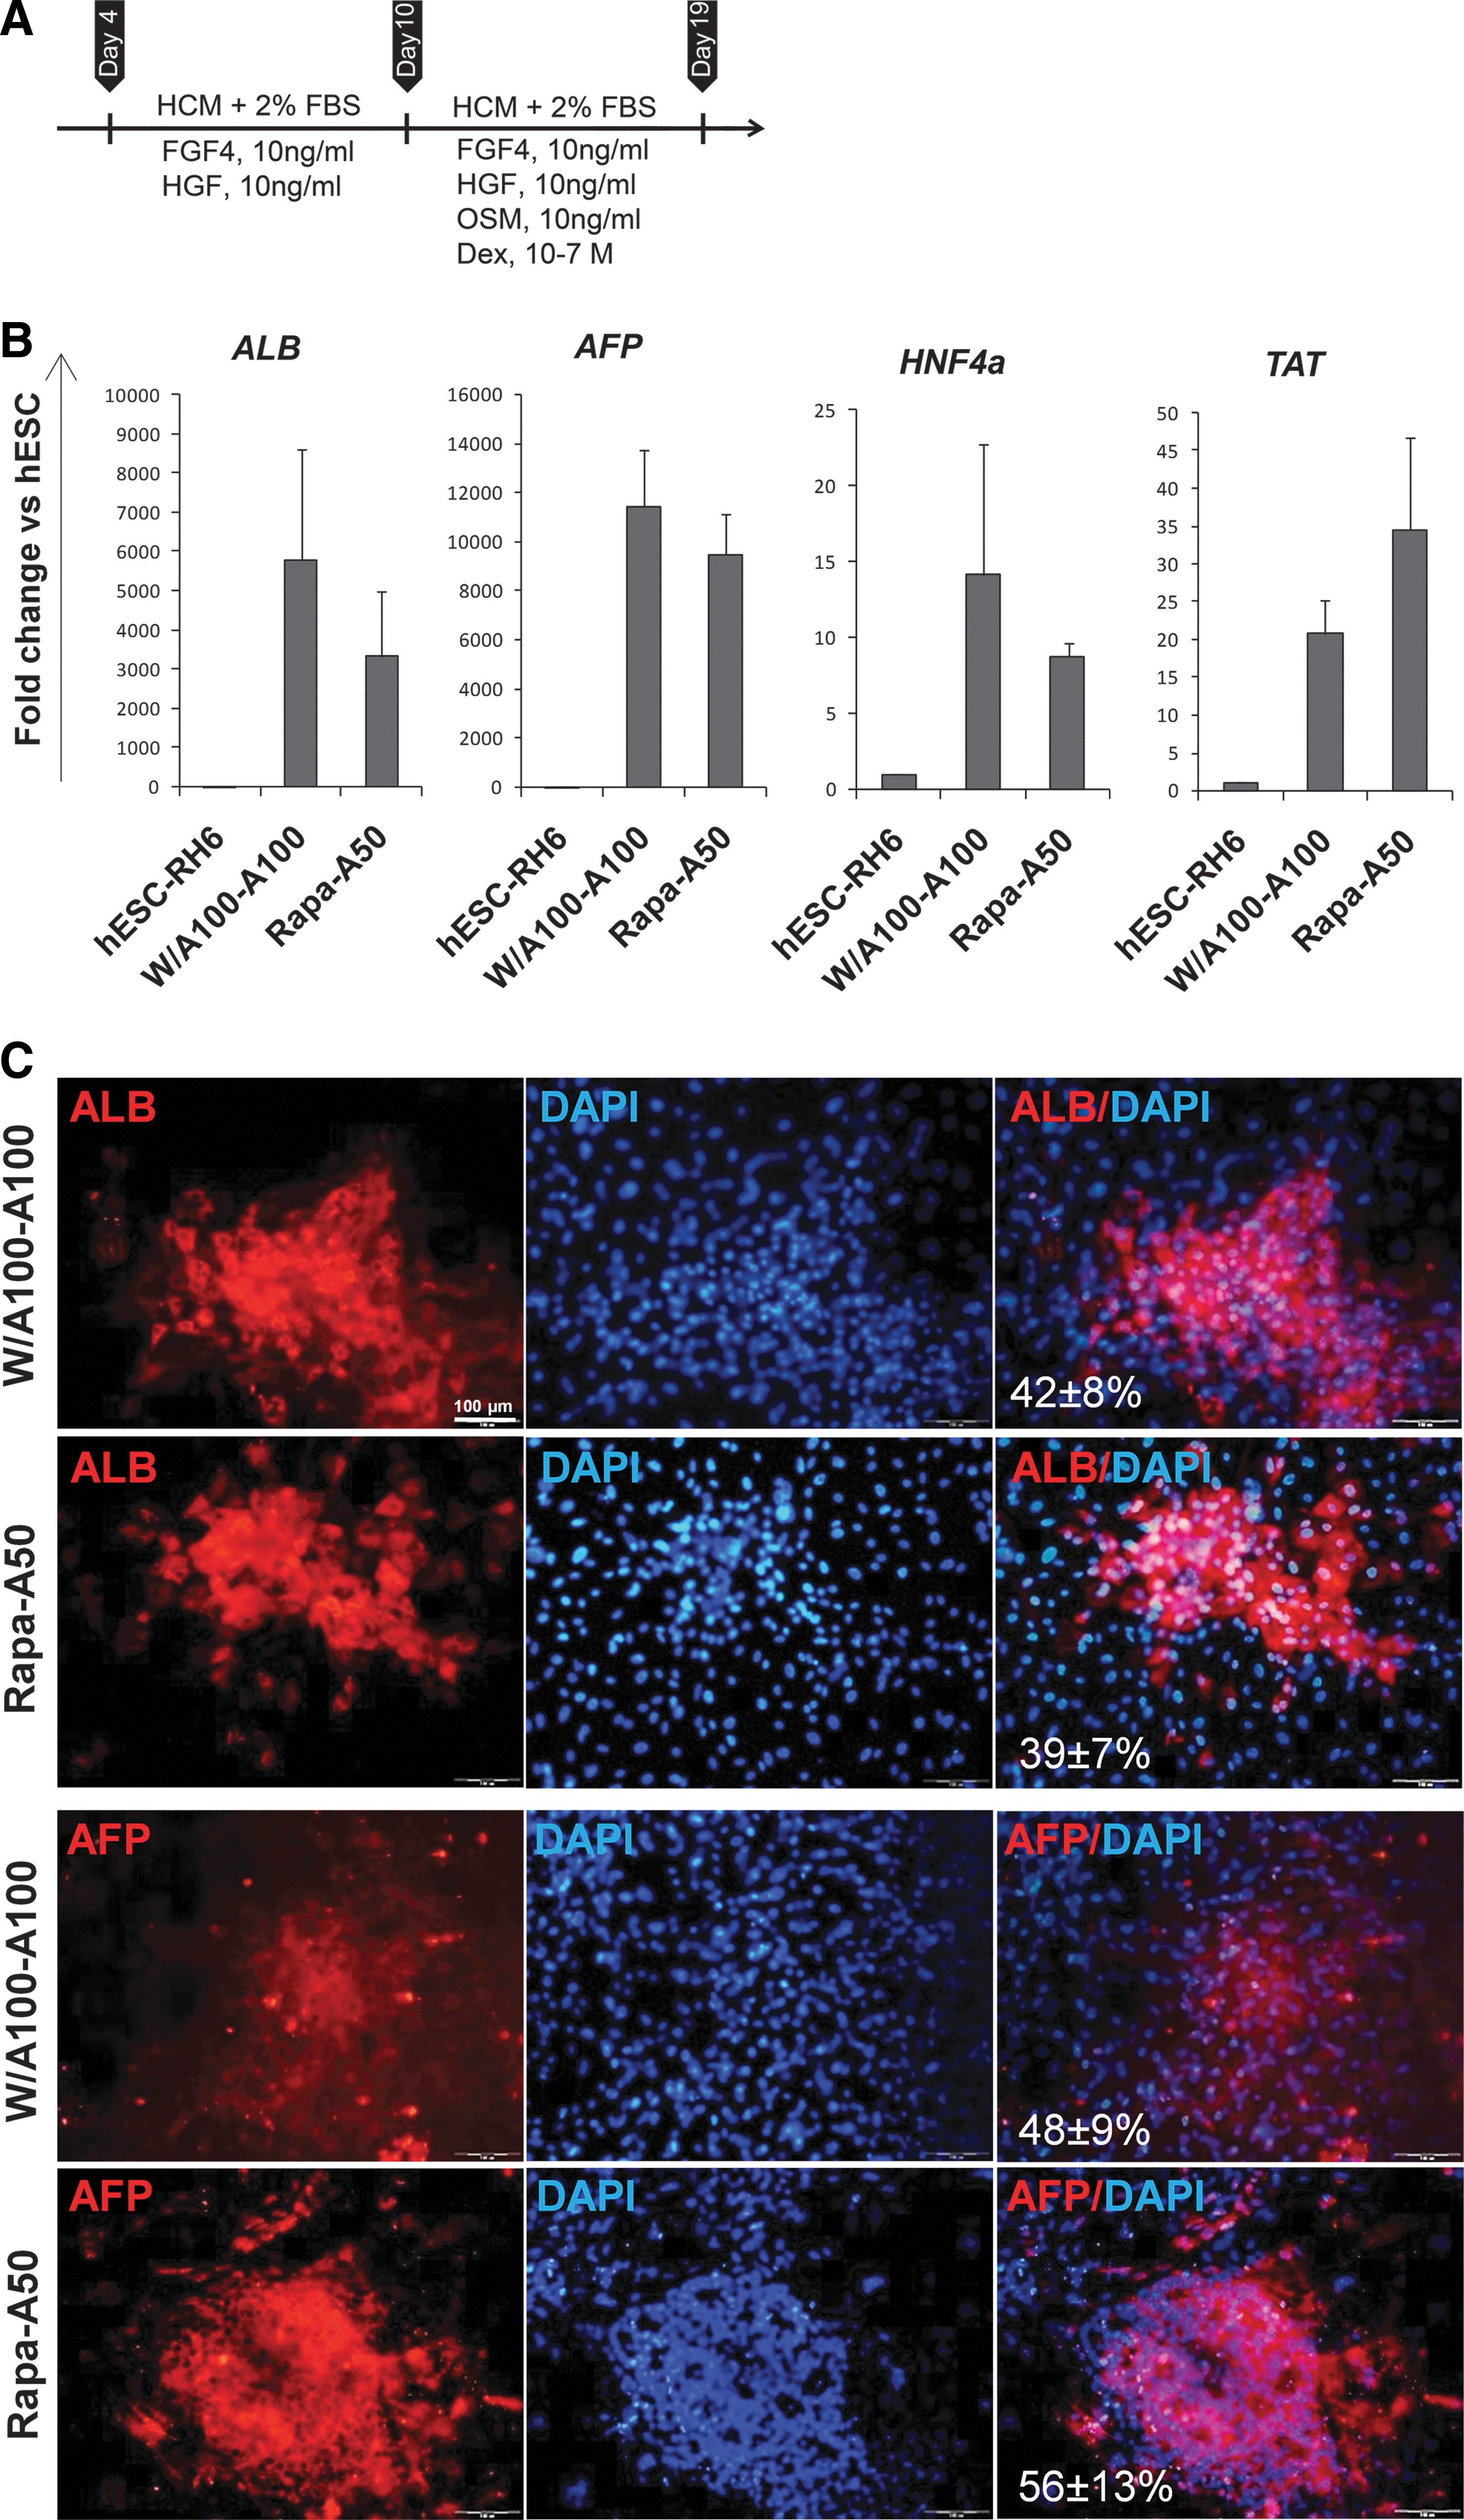
Differentiation of Rapa-A50-induced definitive endoderm (DE) into a hepatic fate.
Using this regimen we performed gene expression analysis for hepatocyte-like cell (HLCs) differentiation markers, α-fetoprotein (AFP), albumin (ALB), HNF4α, and tyrosine aminotransferase (TAT) (Fig. 7B). Expression analysis showed upregulation of the hepatic markers in Rapa-A50, which was similar to the W/A100-A100 group. Additionally, Rap-A50-induced DE cells differentiated into HLCs that expressed AFP (56%±13%) and ALB (39%±7%). In W/A100-A100-induced DE cells the differentiated cells expressed 48%±9% of AFP and 42%±8% expressed ALB (Fig. 7C). There was no significant difference between groups.
To examine the functionality of the produced HLCs, we tested their glycogen storage and LDL uptake ability. Glycogen storage was evaluated by staining for cytoplasmic glycogen using the PAS staining procedure. PAS-positive populations were detected in both HLCs derived from the 2 sources of DEs (Fig. 8A). LDL uptake in Rapa-A50-derived HLCs was 63%±12% and in W/A100-A100-derived HLCs, it was 54%±10% (Fig. 8B).
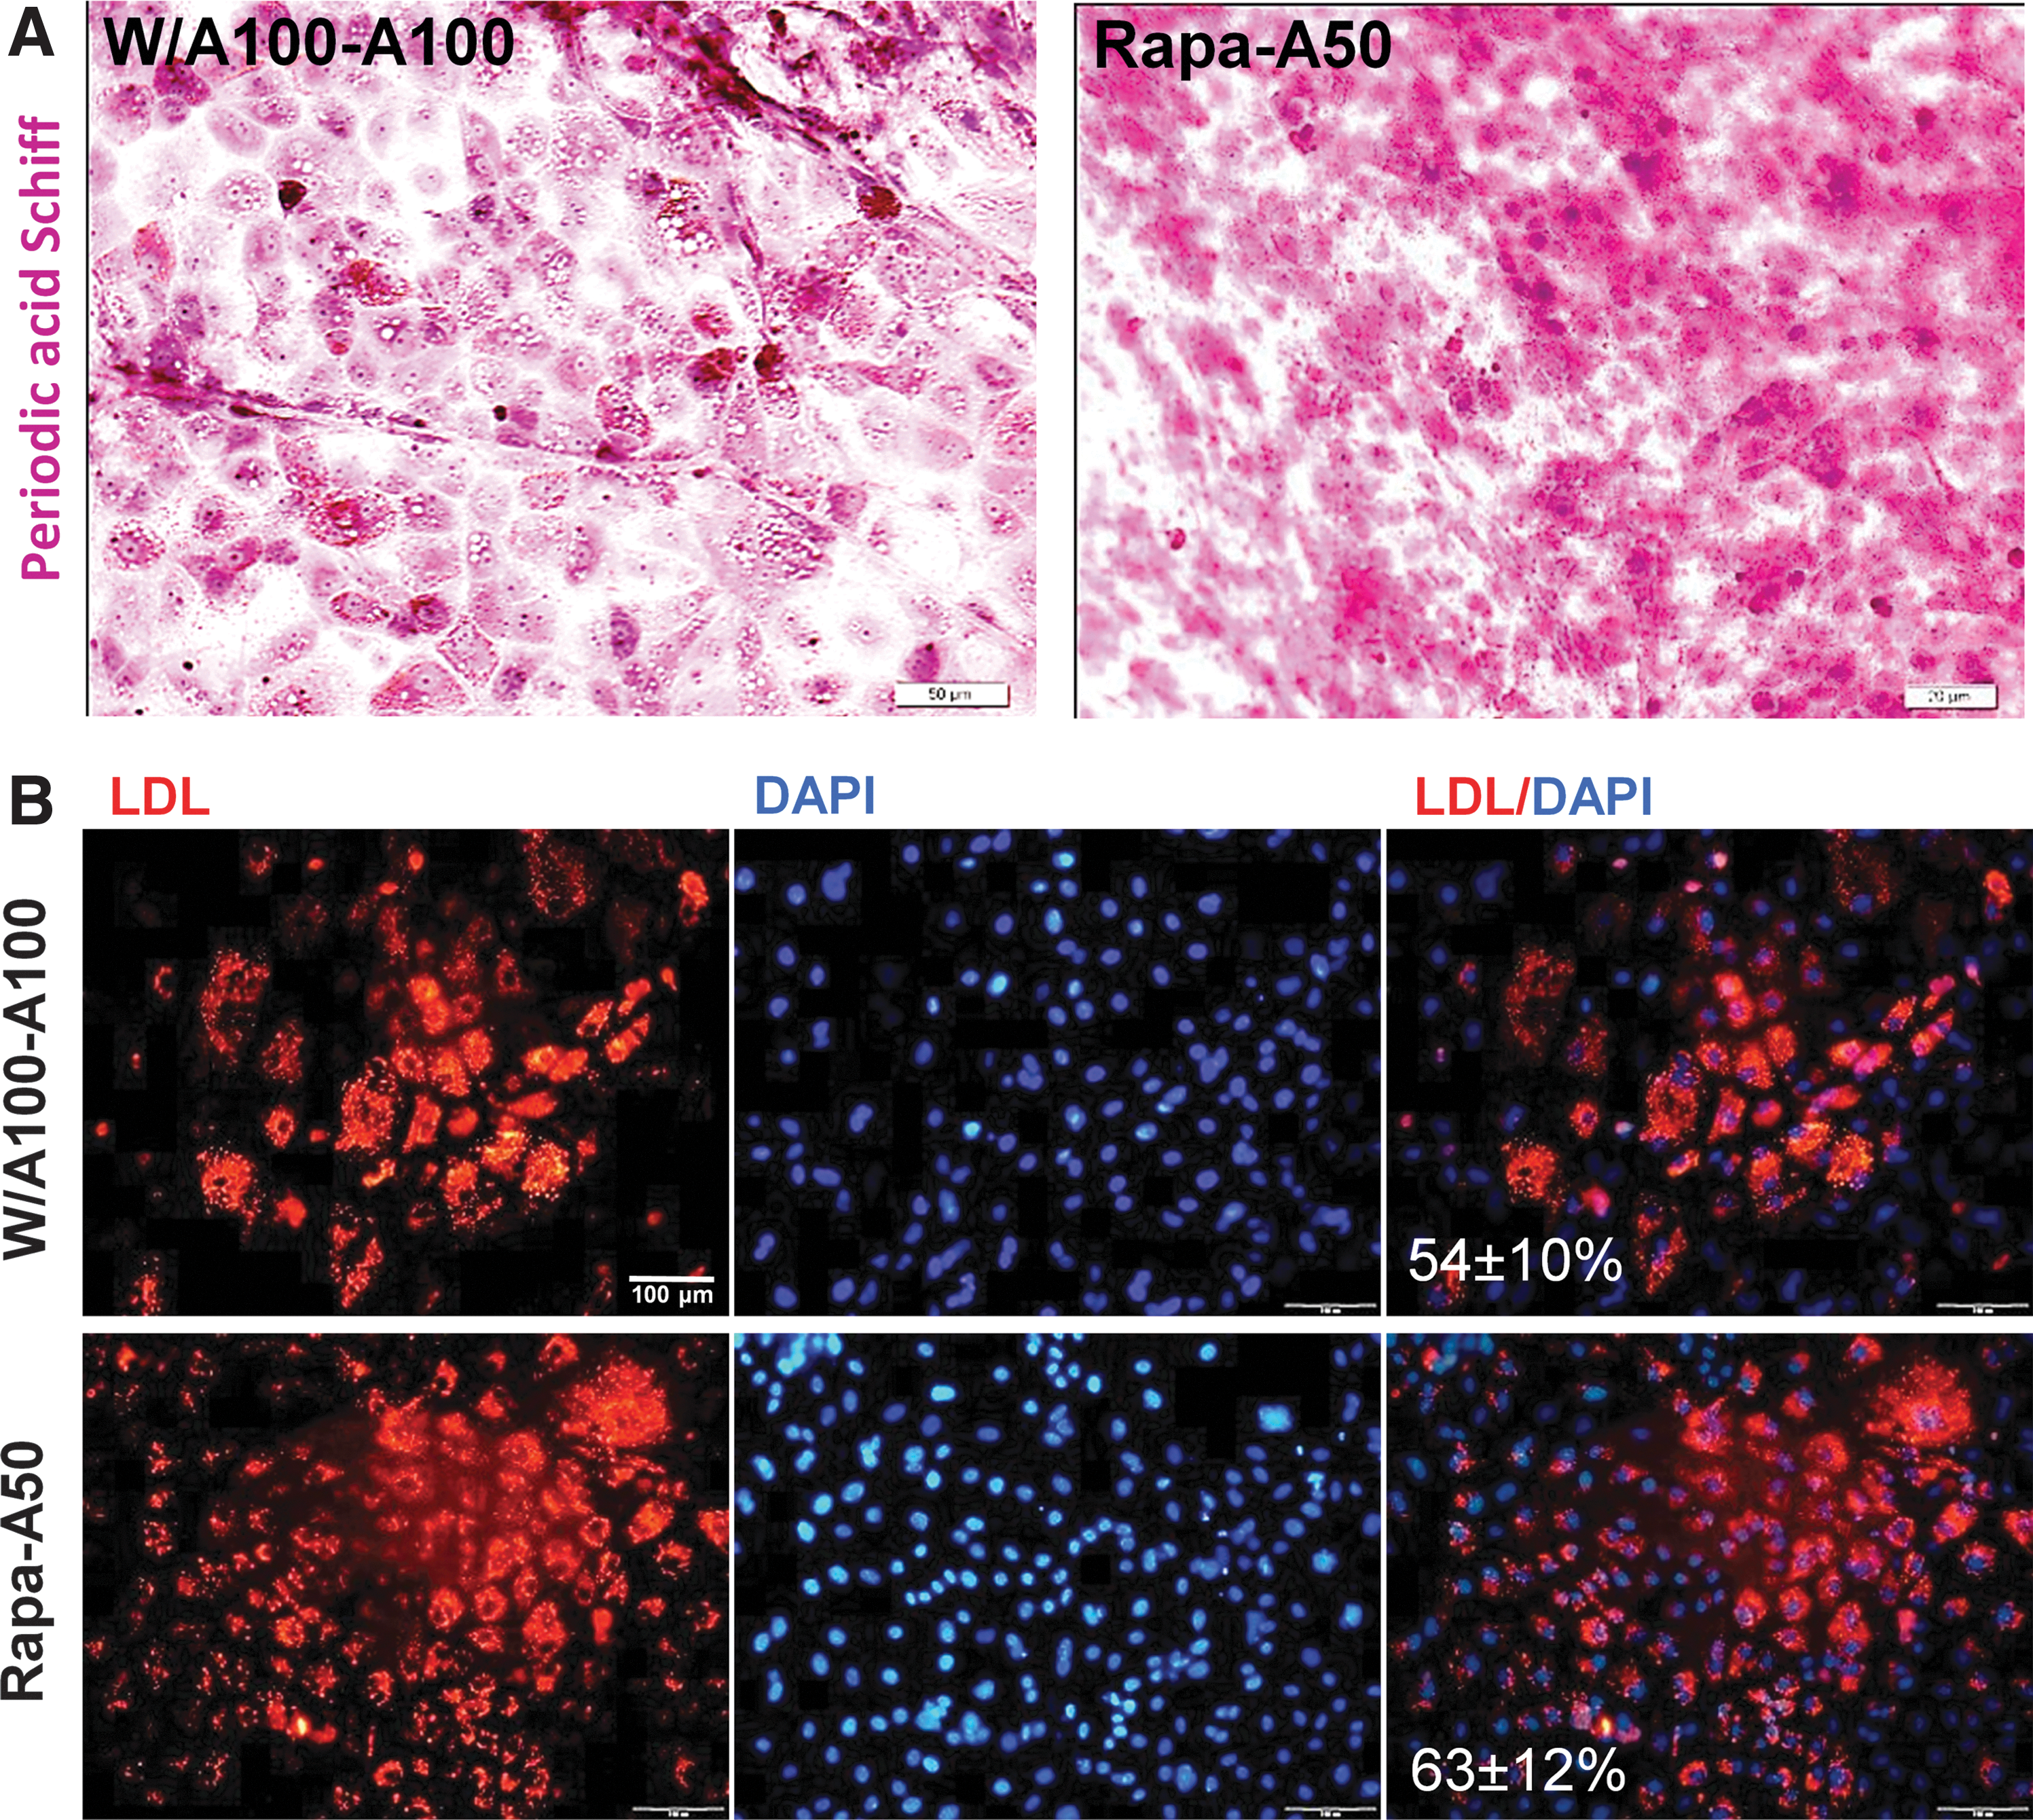
Assessment of the functionality of differentiated hepatocytes from Rapa-A50-induced definitive endoderm.
Therefore, the Rapa-A50-induced DE had the same capability to differentiate into HLCs as W/A100-A100-induced DE.
Discussion
In this study, we found that priming hESCs by SMs (Spd and Rapa) for 1 day followed by induction of cells with activin A (SM-A50) greatly promoted expressions of SOX17 and FOXA2 in 2 hESC lines and one hiPSC line. The other markers for DE (GSC and CXCR4) were upregulated. In conjunction, the extra-embryonic primitive endoderm (SOX7) marker [35,40] did not upregulate, which was considered to be DE differentiation. By this method the concentration of activin A was reduced by half. However, priming with Rapa was more effective in expression of these genes.
The exact mechanism by which these SMs prime hESCs is unknown. However, it has been demonstrated that Spd inhibits the nuclear localization of nucleoside diphosphate kinase B (DNPK B) and leads to the downregulation of c-Myc, a known primary factor in hESCs self-renewal [21]. Rapa is a macrocyclic lactone product of soil bacteria, a selective inhibitor of mammalian target of Rapa (mTOR) and a serin/threonine kinase [41]. Treating hESCs for 1 day with 100 nM Rapa has been shown to inhibit mTOR signaling as indicated by a decrease in threonine-389 phosphorylation of the ribosomal subunit S6 kinase 1, a downstream target of mTOR [21]. mTOR activity is required for the regulation of pluripotency-related genes and its inhibition can lead to their disruption and differentiation [21]. Another possible mechanism for Rapa priming is its inductive effects on BMP4/Smad signaling [42,43]. This induction can lead to DE formation by suppressing the expression of pluripotency genes [44].
Additionally, none of the applied SMs including LY, IDE, or CYM used in the inducing stage caused induction of DE marker expression at levels comparable to activin A. These SMs have been previously reported to support hESC differentiation into DE [19,27,28]. This discrepancy may be related to the cell line variation used for differentiation [45].
To investigate the competency of Rapa-A50-induced DE cells for differentiation into endodermal fates, these cells were further differentiated into PP cells and HLCs, then compared with W/A100-A100-induced DE cells. For PP differentiation from both DEs, we used 5 previously published protocols (P1–P5). By expression of PDX1, a PP marker, we found P2 [29], P3 [30], and P5 [7] to be more efficient for PP induction than the other protocols [18,22]. Although Rapa-A50 and W/A100-A100 showed different PDX1 levels during PP induction by P3 and P5 (Fig. 5A), further investigations of the expressions of 9 other important pancreatic development markers by PCA indicated that the maximum difference between the 2 tested DEs at this stage belonged to the P5 group. In this protocol, the Rapa-A50-induced DE showed better potential for PP differentiation than W/A100-A100-induced DE.
Next, the PP cells produced by P2, P3, and P5 were further induced for PE differentiation. As indicated by 1-D PCA, there was no significant separation between the PP and PE samples, which suggested that the protocols were unable to differentiate PE from PP cells. Thus, none of the tested protocols had the potential to further differentiate the DEs into PE cells. This has shown that the established efficient protocols that consistently generate pancreatic beta cells from different hESCs are still required.
We also differentiated Rapa-A50- and W/A100-A100-induced DEs into a hepatic fate. Both DEs were competent for the differentiation of functional HLCs. We demonstrated significant upregulation of hepatic specific genes, ALB, AFP, HNF4α, and TAT, which were comparable from both DEs. Additionally, the differentiated HLCs exhibited high expressions of ALB and AFP proteins and showed LDL uptake and glycogen storage capability. These results agreed with previous reports that indicated the applications of growth factors in hESC-DE gave rise to a hepatic lineage [46 –52].
Conclusion
These data indicated that priming of hESCs with SM and Rapa, and inducing them by a lower concentration of activin A can lead to DE formation. These hESC-derived DE cells have the capability to further differentiate into HLCs and PP cells, but not PE cells. Also, differentiated DE cells in the positive control group, W/A100-A100, showed a similar trend. We have demonstrated that established protocols were insufficient for universal differentiation into PE either from Rapa-A50- and/or W/A100-A100-induced DEs. However, Rapa-A50-induced DE cells were more competent for PP differentiation in a protocol-dependent manner. Additionally, the low efficiency of PE differentiation and the higher rate of HLC production during our study might have been related to the higher competency of DE cells for hepatic versus pancreatic differentiation or this difference could be related to the protocols' efficiencies for PE differentiation.
Footnotes
Acknowledgments
This study was funded by grants provided by Royan Institute. We express our appreciation to Azadeh Moradmand and Mohamad Mehdi Naghizadeh for technical assistance and data analysis, respectively.
Author Disclosure Statement
The authors declare they have no competing financial interests.
References
Supplementary Material
Please find the following supplemental material available below.
For Open Access articles published under a Creative Commons License, all supplemental material carries the same license as the article it is associated with.
For non-Open Access articles published, all supplemental material carries a non-exclusive license, and permission requests for re-use of supplemental material or any part of supplemental material shall be sent directly to the copyright owner as specified in the copyright notice associated with the article.