
Abstract
Hematopoietic stem cells (HSCs) and hematopoietic progenitor cells (HPCs) play a vital role in replenishment of blood cells. In addition to growth factors, energy metabolism plays an important role in cellular proliferation. Oxidative phosphorylation that occurs in the mitochondria is the major source of ATP. In this study, we have investigated the role of peroxisome proliferator-activated-γ coactivator-1α (PGC-1α), a major regulator of mitochondrial biogenesis, in hematopoiesis. PGC-1α is expressed in HSC/HPCs. Loss of PGC-1α minimally affects basal hematopoiesis; however, it significantly impairs stress hematopoiesis. Recovery of hematopoiesis poststress involves rapid proliferation of HSC/HPCs. Growth factors stimulate HSC/HPC proliferation in a dose-dependent manner and this response is modulated by oxygen tension. Although severe hypoxic conditions inhibit HSC/HPC proliferation, mild hypoxia enhances the clonogenic potential; however, the mechanism underlying this phenomenon remains largely unknown. Our studies demonstrate that PGC-1α-mediated mitochondrial biogenesis is critical for the increased clonogenic potential of progenitors under mild hypoxia. Metabolic programming and increased glucose uptake can drive rapid progenitor cell proliferation under relatively low oxygen tension only if the HPC has the capacity to increase PGC-1α expression and mitochondrial biogenesis. Loss of PGC-1α also impairs the long-term repopulating potential of HSCs. Our findings may have therapeutic applications for rapid recovery of blood cells following myeloablation.
Introduction
In addition to growth factor stimulation and activation of transcription machineries that control proliferation by regulating cell cycle regulatory proteins, a switch in the basal metabolic pathway may regulate proliferation of HSCs and HPCs during hematopoiesis. One fundamental requirement for sustaining proliferation is a supply of precursor molecules for the biosynthesis of membranes and nucleotides, which are required to make the daughter cells during replication. These precursor molecules are biosynthesized de novo mostly through glucose metabolism by using intermediates of the tricarboxylic acid (TCA) cycle or intermediates from other sources that feed into the TCA cycle [7]. Uptake of glucose and other nutrients is significantly increased in proliferating cells to support the platform for biosynthesis [8]. The process of biosynthesis requires energy. In the absence of or very limited flux of glucose-derived intermediates to the TCA cycle, active proliferation cannot be sustained [7]. Therefore, regulation of TCA cycle flux by limiting substrate/oxygen availability is likely to be another method of control for determining HSC/HPC fate.
Mitochondria are not only the powerhouses of cell, but they also generate reactive oxygen species (ROS). Mitochondrial ROS is crucial for stabilization of hypoxia inducible factor-1α (HIF-1α) protein [9,10]. HIF-1α is a major metabolic regulator that controls flux of pyruvate through the TCA cycle [11]. In addition to generating ATP by oxidative phosphorylation (OXPHOS), TCA cycle that occurs in mitochondria also supplies many substrates to anabolic pathways in order to generate substrates that support replication [7]. Our hypothesis based on the above information is that mitochondria, by virtue of their ability to integrate microenvironmental oxygen cues to stabilize HIF-1α, regulate several metabolic pathways, and, being an important source of ROS generation, play a deterministic role in HSC/HPC fate and regulate hematopoiesis.
Peroxisome proliferator-activated-γ coactivator-1α (PGC-1α) is an important regulator of mitochondrial biogenesis and respiration [12]. PGC-1α transduces many physiological stimuli into specific metabolic programs, often by stimulating mitochondrial activity [13]. PGC-1α also regulates the production of various ROS-detoxifying enzymes [13]. PGC-1α is highly expressed in tissues undergoing OXPHOS, and its function has been defined in these tissues [14]. The role of PGC-1α in hematopoiesis remains unexplored. In this study, we establish that HSC and HPCs in the BM express PGC-1α and that PGC-1α regulates mitochondrial activity of HPCs. Importantly, it plays an important role in the rapid proliferation of HSC/HPCs in response to stress conditions.
Materials and Methods
Animal studies
All animal studies were evaluated and approved by the Institutional Animal Care and Use committee. PGC-1α knockout (PGC-1α−/−) mice were a kind gift from Prof. B. Spiegelman (DFCI, Boston, MA) and used after 9 backcrosses to C57/Bl6 mice. PGC-1α+/+ littermate mice were used as control and are designated as wild type (WT) in this study. C57/Bl6 mice were purchased from Jackson Laboratories; C57/Bl6:BoyJ F1 and Boy/J mice were from the In Vivo Core Therapeutic Facility of the Indiana University School of Medicine.
Phenotypic and functional analysis of BM cells
BM cells were obtained from the long bones (tibias and femurs) of mice. Lineage-positive cells were identified based on the staining pattern with fluorescent dye-conjugated antibodies against B220, CD3, Gr-1, Mac-1, and Ter119 and CD71 (BD Biosciences, San Jose, CA). The above set of antibodies, except CD71, was used to gate out the lineage-positive cells for analysis of HSC/progenitor populations. c-kit+Sca-1+IL-7Rα−Lin− cells are designated as KSL and c-kit+IL-7Rα−Lin− cells are designated as (KL/MP), HSCs designated as KSL IL-7Rα−CD34−, and multipotential progenitor (MPP) defined as KSL IL-7Rα−CD34+. Fluorochrome-conjugated antibodies were purchased from eBioscience (San Diego, CA), Biolegend (San Diego, CA) and BD Biosciences. Flow cytometry analysis was performed on an LSR II (BD Biosciences), and cells were sorted using FACSAria (BD Biosciences). Cell cycle status was determined by fixing and permeabilizing cells with BD Per/Fix buffer reagents (BD Pharmingen, San Jose, CA) and staining the cells with 2 μg/mL Hoechst 33342 (Invitrogen, Carlsbad, CA) for 10 min, washing the cells, and then staining with either 4 μg/mL PyroninY or 5 μL of the phycoerythrin-conjugated anti-Ki-67 antibody (BD Biosciences). Mice were injected intraperitoneally with BrdU (Sigma, St. Louis, MO) at a dose of 0.1 mg/g body mass and fed with BrdU in drinking water (1 mg/mL) for additional 2 days. BrdU uptake by BM cells was analyzed by staining the cells with anti-BrdU-APC staining kit (BD Pharmingen).
ROS and mitochondrial staining
Various subpopulations of BM cells were sorted based upon expression of specific surface markers followed by staining with specific dyes to measure intracellular ROS and mitochondrial activity. Sorting various subpopulations of cells is a time-consuming process during which the cells are exposed to conditions different from that in vivo BM cells that could potentially alter both the ROS level and mitochondrial activity; therefore, for a few BM samples, cells were directly stained with antibodies against various phenotypic surface markers and then stained with the specific dyes. Intracellular ROS was measured using dichlorofluorescin diacetate (DCFDA; Invitrogen). DCFDA has no fluorescence until it passively diffuses into cell, where esterases cleave the acetate and intracellular oxidation by ROS produces a green fluorescent signal [15]. Cells were stained with 10 μM DCFDA for 15 min at 37°C and then analyzed using the LSRII FACS machine. Mitochondrial activity was measured by staining the cells with Mitotracker Deep Red (Invitrogen) according to manufacturer's instructions (50 nM for 15 min at 37°C). For determining mitochondrial activity using tetramethyrhodamine (TMRE), cells were stained with 0.1 μg/mL of TMRE (Invitrogen) in the presence of 10 μM veerampil (Sigma-Aldrich, St. Louis, MO) for 20 min at 37°C in dark and then washed twice with phosphate buffered saline. For determination of the mitochondrial trans-membrane potential (ΔΨm), cells were incubated with 10 μg/mL JC-1 dye (Invitrogen) in a fresh culture medium for 15 min at 37°C. After incubation with JC-1, the cells were washed with the culture medium and then analyzed using the LSRII FACS machine.
Relative quantification of mitochondria
Total DNA was isolated from various subfractions of sorted BM cells using the PicoPure DNA Extraction kit (Arcturus, Mountain View, CA) according to manufacturer's instructions. The amount of mitochondrial DNA relative to nuclear genomic DNA was determined by quantitative real-time polymerase chain reaction (qRT-PCR) using primers for cytochrome oxidase subunit II (COXII) and succinate dehydrogenase (SDH). Relative mitochondrial DNA levels were calculated based on the threshold cycle (Ct) using the following formula: Ct COXII /Ct SDH . The fold increase in mitochondrial biogenesis in progenitor cells following culture in 5% O2 was calculated as following: first, Ct COXII /Ct SDH ratios for WT and PGC-1α−/− progenitors were calculated and then the fold change in mitochondrial biogenesis in WT progenitor cells compared to PGC-1α−/− progenitor cells was calculated as follows: WT(Ct COXII /Ct SDH )/PGC-1α−/− (Ct COXII /Ct SDH ).
Colony assay and liquid culture
BM cells, either 2.5×10⁴ or 5×10⁴, were plated in 1% methyl cellulose, 10−4 M 2-mercaptoethanol, 2 nM L-glutamine, and 30% fetal calf serum, in the presence of a single growth factor 10 ng/mL recombinant murine granulocyte–macrophage colony-stimulating factor (rmu GM-CSF), 10 ng/mL rmu interleukin-3 (rmu IL-3), 10 ng/mL macrophage colony stimulating factor (M-CSF) or mixed growth factors [1 U/mL recombinant murine erythropoietin (rmu Epo), 5% (vol/vol) pokeweed stimulated spleen conditioned medium and 50 ng/mL rmu stem cell factor (rmu SCF) and Hemin 0.1 mM]. Cultures were set up in triplicate and the cultures were incubated in a humidified atmosphere, 5% CO2, and either in 5% or 20% O2 at 37°C for 7 days. Total and differential colony counts [granulocyte-macrophage colony-forming cell (GM-CFC) erythroid burst colony-forming units (BFU-Es), and mixed erythroid-myeloid colony-forming cells (CFC-GEMMs)] were scored on day 7. All growth factors used in this study were purchased from R&D Systems (Minneapolis, MN).
For liquid cultures, cells were grown in the StemPro-34–serum-free medium (SFM; Invitrogen) supplemented with the human Flt-3 ligand (100 ng/mL), human thrombopoietin (100 ng/mL), and rmu SCF (50 ng/mL), rmu IL-3 (10 ng/mL), and rmu GM-CSF (10 ng/mL) (all growth factors were purchased from R&D Systems). For the single cell assay, single HSC or MPP were sorted into individual wells containing SFM supplemented with growth factors (total 48 wells) of a 96-well plate using FACSAria. After sorting, wells were examined under microscope to assure that each well had a single cell.
ATP assay
ATP content was measured using the Cell-Titer-Glo luminescent cell viability kit [16] according to manufacturer's instructions (Promega, Madison, WI). Cell counts were performed on each sample before ATP determination, and relative luminescent unit (RLU) recorded (representing the ATP content) for each sample was normalized to a cell count of 104 cells based on the cell count.
Lactate and glucose measurement
MPs were cultured in SFM in the presence of 50 ng/mL rmu SCF, 100 ng/mL thrombopoietin, 100 ng/mL Flt-3 ligand, 10 ng/mL rmuIL-3, and 10 ng/mL rmuGM-CSF for 24 h, and the lactate produced and glucose depleted from the medium were measured using specific measurement kits (Biovision, Milpitas, CA) according to manufacturer's instructions. Briefly, 6×10³ cells per well were plated in the presence of 150 μL of the medium supplemented with growth factors in 96-well plate. After 24 h, the plate was centrifuged at 400g for 10 min at 4°C. Thereafter, 50 μL of supernatant was carefully aspirated and filtered through 10-kDa molecular weight spin filter (Biovision). About 10 μL of the undiluted medium was used for lactate assay and the medium was diluted 10 times before being assayed for the glucose assay. The medium was mixed with enzyme mix and the probe as per manufacturer's instructions and the color developed was read using the ELISA reader. Lactate and glucose standards were used for calibration according to the manufacturer's instructions. ATP was measured by using the ATP measurement kit (Invitrogen) according to manufacturer's instruction.
Gene expression by qRT-PCR
mRNA was isolated and cDNA prepared using MACS cDNA module (Miltenyi Biotec, Auburn, CA) from freshly sorted cells or cells cultured in SFM supplemented with a cocktail of growth factors (50 ng/mL rmu SCF, 100 ng/mL human thrombopoietin, 100 ng/mL human Flt-3 ligand, 10 ng/mL rmuIL-3, and 10 ng/mL rmuGM-CSF). Expression of genes was studied using real-time PCR (Stratagene, Mx3000P; Agilent Technologies, La Jolla, CA) based on SYBR Green (Invitrogen) monitoring of PCR product accumulation. Following primer pairs were used—Catalase: FWD 5′ AAGACAATGTCACTCAGGTGCGGAC, REV 5′ TTCAGGTGGCCAGCAATGTTCTC; superoxide dismutase 2 (SOD2): FWD 5′ TGAACAATCTCAACGCCACCGAG, REV 5′TGAACTTCAGTGCAGGCTGAAGAG; COXII: FWD 5′ CTACAAGACGCCACAT, REV 5′ GAGAGGGGAGAGCAAT; SDH: FWD 5′TACTACAGCCCAAGTCT, REV 5′TGGACCATCTTCTATGC. PCR primer pairs for other genes were purchased from SABioscience (Qiagen, Valencia, CA).
Homing of HSCs
BM cells from 3 WT and 3 PGC-1α−/− mice were pooled and HSCs/HPCs were partially enriched by depleting lineage-committed cells using the Lineage Depletion kit according to manufacturer's instructions (Miltenyi Biotec). Partially purified HSC/HPCs (8.14×10⁶ cells/mouse) were injected through lateral tail vein into recipient mice that were irradiated (950 rad) 18 h before transplantation. The number of HSCs (CD34−IL-7Rα−KSL) injected was determined by staining an aliquot of BM cells with antibodies against surface markers and analyzing using flow cytometry. Recipient mice were sacrificed 20 h post-transplantation and BM cells were collected from both the femurs and tibias of each mouse by crushing the bones using pestle and mortar. RBCs were lysed and BM cells were stained with antibodies against various specific surface markers to distinguish various subpopulations of HSCs/HPCs as well as donor versus recipient HSCs (based on CD45.2 and CD45.1 expression). The total number of donor HSCs that had homed to these bones was estimated by flow cytometry by acquiring and analyzing all the cells harvested from these 4 bones of each mouse. The number of HSCs that had homed was corrected to represent the total BM, by multiplying the number of HSCs that had homed in these 4 bones with 5.88, based on previous studies that estimate that 2 tibias and 2 femurs contain approximately 17.0% of total BM [17].
Competitive repopulation assay
The recipient mice were fed doxycyclin for a week before irradiation (950 rad) and continued on the doxycyclin-supplemented feed for next 2 months to prevent spontaneous infection. Competitive repopulation assays were performed as previously described. Briefly, either 2×10⁵ (1:1 group) or 0.5×10⁵ (0.25:1 group) BM cells from either PGC-1α−/− mice or C57/Bl6 mice (CD45.2) were mixed with 2×10⁵ BM cells from BoyJ (CD45.1) mice and injected intravenously through lateral tail vein into irradiated recipient C57/Bl6:BoyJ F1 double-positive recipients (CD45.1:CD45.2). Peripheral blood was obtained from the tail veins of recipients at indicated times to monitor chimerism. RBCs were lysed using the RBC lysis buffer (ammonium chloride/potassium bicarbonate buffer) before staining. For the secondary transplant, BM cells from each of the primary recipient were injected into 3 irradiated (950 rad) secondary recipients (2×10⁶ cells/secondary recipient mouse). Chimerism in blood was evaluated 2 months after transplantation. For assessing the repopulation potential of purified HSCs and MPPs, 100 cells of each type were mixed with 2×10⁵ BM cells from BoyJ (CD45.1) mice and injected into irradiated recipient C57/Bl6:BoyJ F1 double-positive recipients, and percentage chimerism in peripheral blood was determined as explained above.
5-fluorouracil treatment
Mice were treated with 150 mg/kg wt of 5-fluorouracil (5-FU; Sigma-Aldrich) intraperitoneally on day 0 and the changes in peripheral blood cell counts and BM cellularity were followed thereafter.
Statistical analysis
Data are presented as mean±SD unless indicated otherwise. Significance of differences was analyzed using Student's 2-tailed t-test.
Results
Mitochondrial mass and mitochondrial transmembrane potential are lower in BM cells of PGC-1α−/− mice
The TCA cycle in mitochondria is the hub for generation of many macromolecules required for biomass production during proliferation. Hematopoiesis requires continuous production of cells; thus, it is likely that mitochondrial biogenesis plays a role in hematopoiesis. PGC-1α stimulates mitochondrial biogenesis [12]. Therefore, we examined whether PGC-1α is expressed in HSCs and HPCs. We found that although PGC-1α is expressed in both HSCs and HPCs as previously shown [18], it is preferentially highly expressed in CD34+IL-7Rα−KSL cells, which represent the MPP population (Fig. 1Ai). Among mature cells in BM, PGC-1α was detected in B lymphocytes but not in granulocytes or Ter119+ cells (Fig. 1Aii).
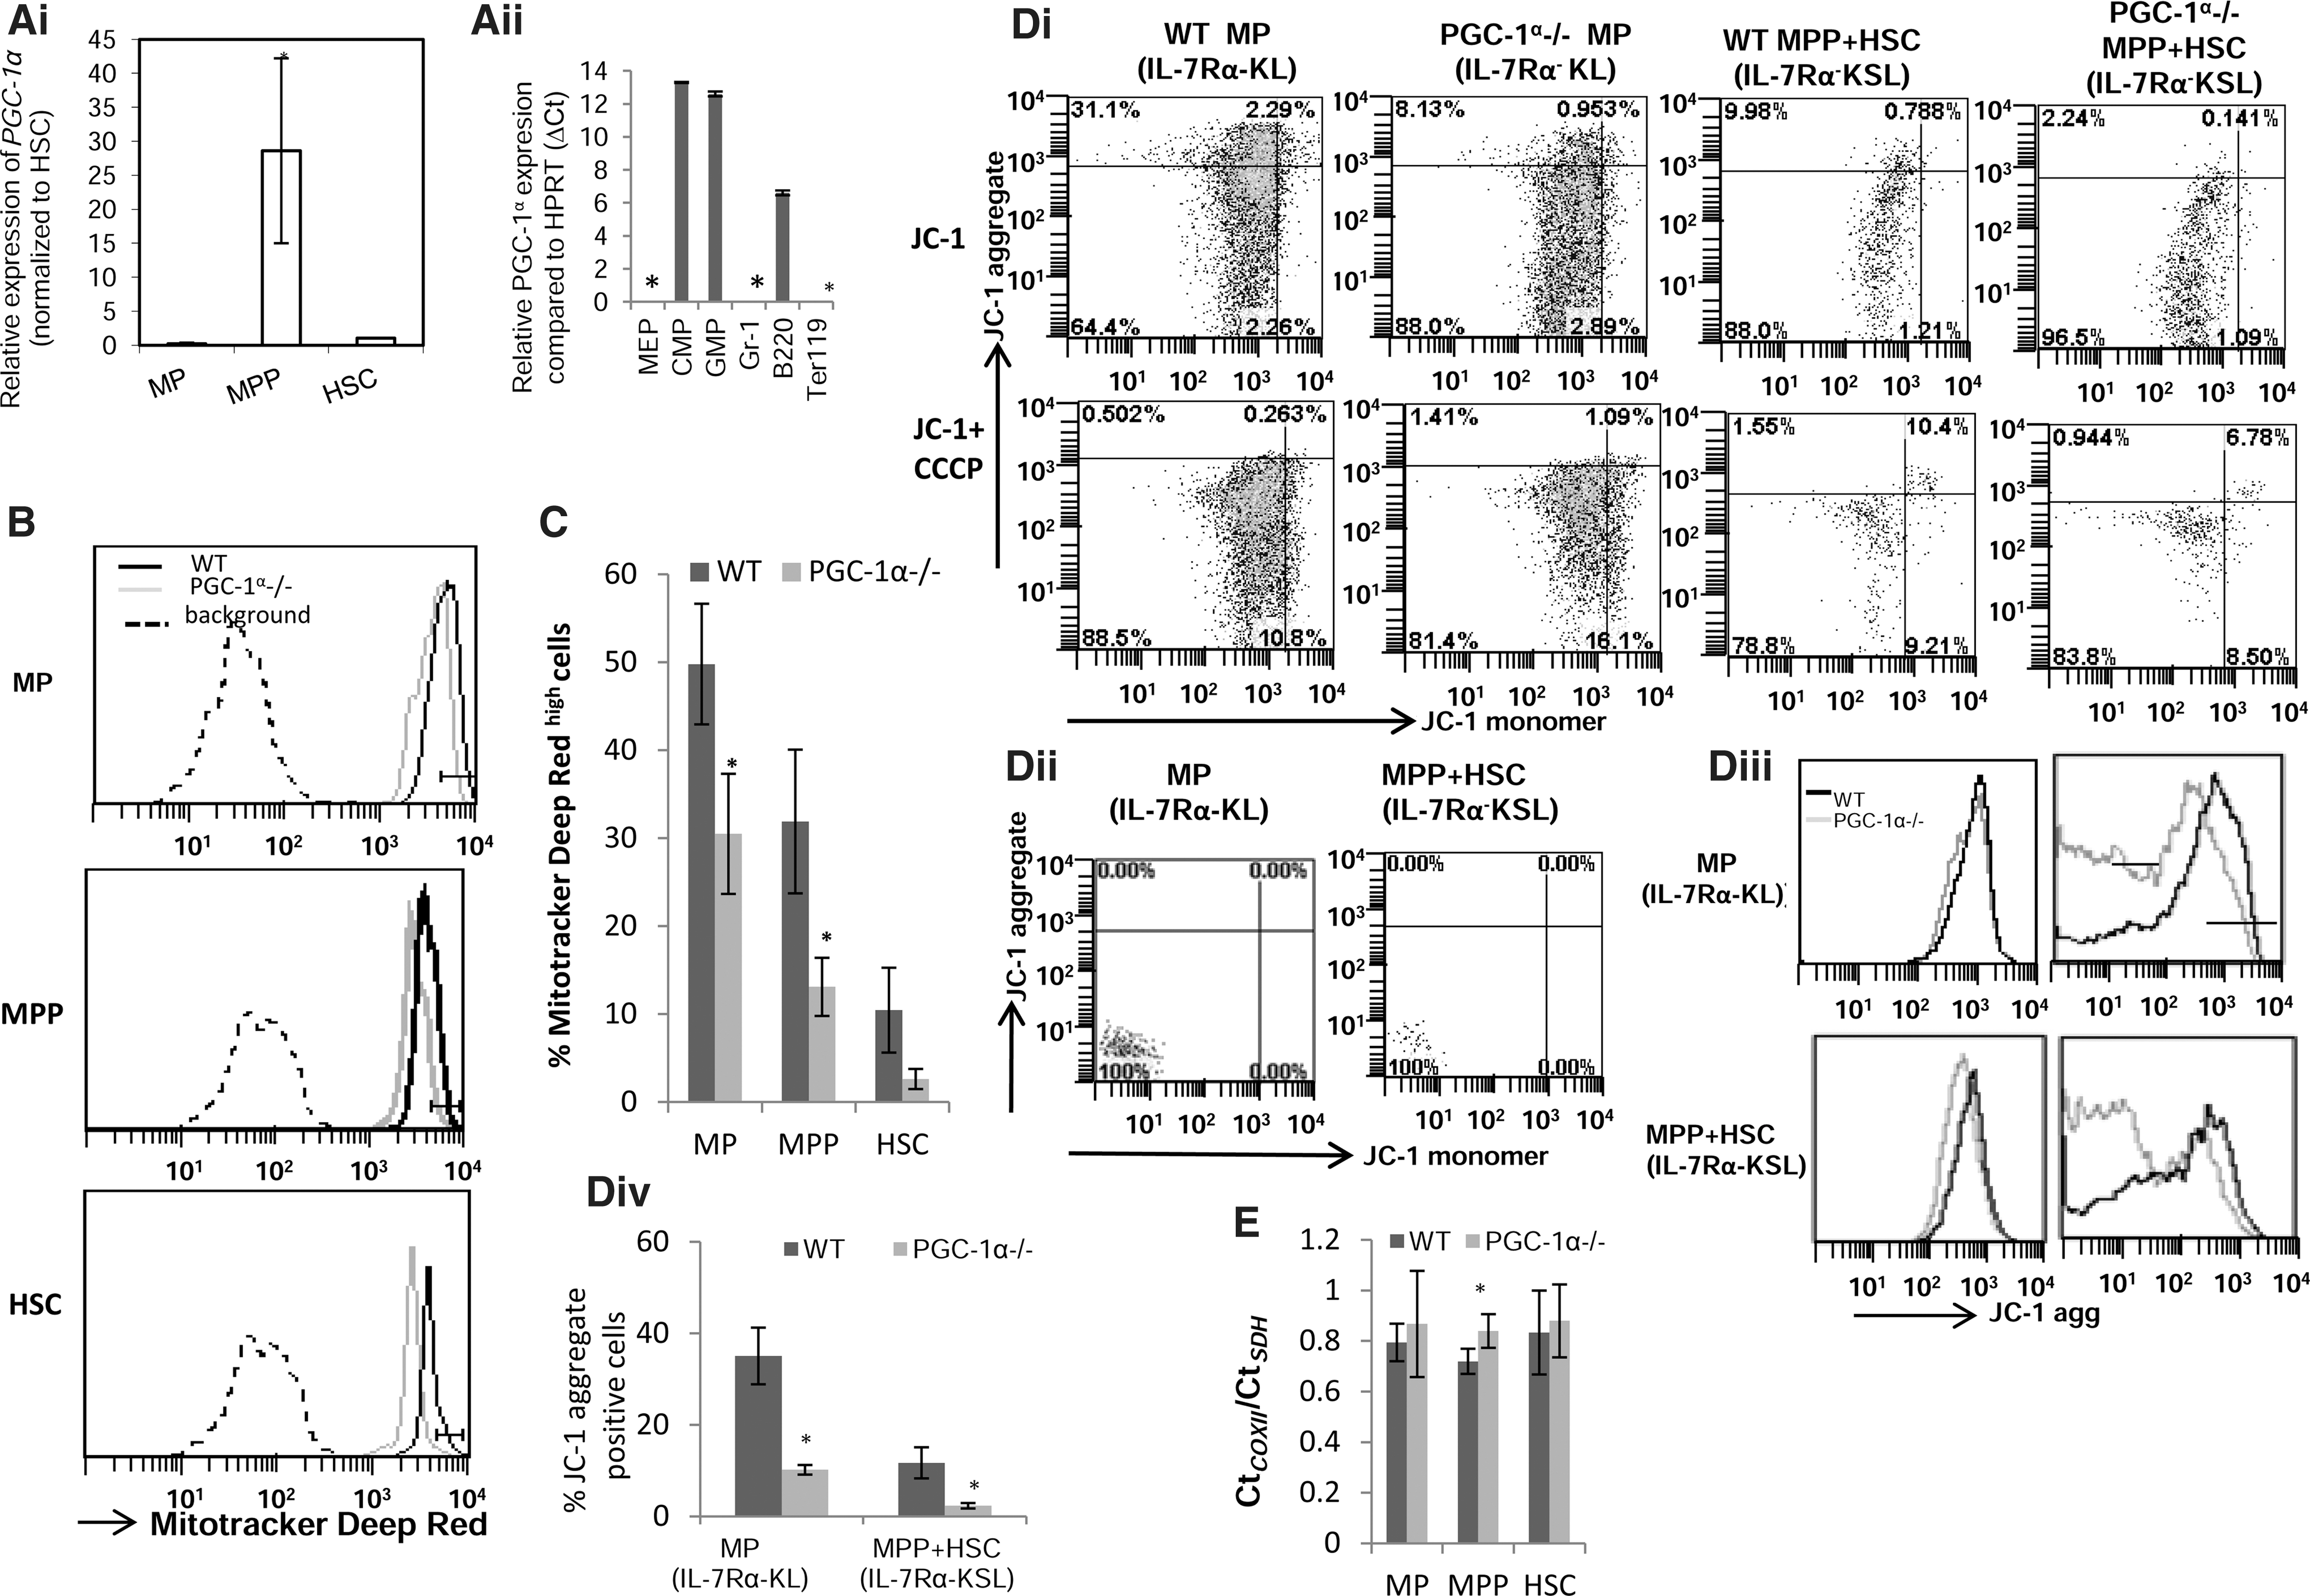
Expression of peroxisome proliferator-activated-γ coactivator-1α (PGC-1α) in bone marrow (BM) cells and its effect on regulating mitochondrial activity and mitochondrial biogenesis of hematopoietic stem cells (HSCs) and hematopoietic progenitor cells (HPCs).
The mitochondrial membrane potential (ΔΨm) is an important parameter of mitochondrial function and is indirect evidence of the energy status of the cell [19]. Mitotracker Deep Red (MDR) is a mitochondria-specific dye that gives fluorescence intensity proportional to the membrane potential [20]. The total myeloid progenitors (MP- that include MEP, CMP, and GMP), phenotypically defined as IL-7Rα−KL, had the greatest fluorescence intensity followed by MPPs; the least fluorescence intensity was displayed by the fraction enriched for primitive HSCs (CD34−IL-7Rα−KSL) (Fig. 1B, C). PGC-1α−/− BM cells had a lower fluorescence intensity than WT BM cells (Fig. 1B, C), demonstrating that PGC-1α loss leads to a decrease in mitochondrial activity in primitive populations of BM cells. A similar pattern was observed when the cells were stained with TMRE, another fluorescent dye that measures mitochondrial activity (data not shown). Furthermore, measurement of the mitochondrial transmembrane potential (ΔΨm) using JC-1 dye, the most specific dye for measuring ΔΨm [21 –23], also showed that various fractions of PGC-1α−/− cells have a lower mitochondrial potential, indicating a lower mitochondrial activity (Fig. 1Di–iv). However, JC-1 is a strong flurochrome and, therefore, limits the use of phycoerythrin-based tandem fluorescent dyes in combination in an assay. Due to the limitation on the number of flurochromes that could be used in this assay, we were restricted to analyzing the KSL population and could not distinguish it further based on CD34 expression. Addition of carbonyl cyanide m-chlorophenyl hydrazone (CCCP), a mitochondrial uncoupling agent, led to collapse of JC-1 fluorescence in both WT and PGC-1α −/− BM cells, confirming that the JC-1 staining pattern is specific and represents ΔΨm. The above results establish that the loss of PGC-1α leads to a significant loss of the mitochondrial activity in various fractions of immature BM cells.
We examined the ratio of expression of cytochrome oxidase II (COXII-mitochondrial DNA) to succinate dehydrogenase (SDH-nuclear DNA) to estimate the mitochondrial mass. Consistent with a recent study [24], we found that despite differences in mitochondrial activity, the mitochondrial density of various early BM subpopulations of WT mice is similar (Fig. 1E). Moreover, the mitochondrial density of various early BM subpopulations of PGC-1α−/− mice was not different or only modestly lower (as indicated by a small but significantly higher value of the Ct COXII /Ct SDH ratio for MPPs) compared to corresponding WT cells (Fig. 1E).
Steady-state hematopoiesis in PGC-1α-deficient mice
No differences were observed in either total BM cellularity (Fig. 2A) or peripheral white blood cell (WBC) count between age- and sex-matched WT and PGC-1α−/− mice (Table 1). Furthermore, the proportion and, hence, the total number of MPP (CD34+IL-7R−KSL) are lower in the BM of PGC-1α−/− mice than in WT mice (Fig. 2Bi, ii). Staining with SLAM markers [25] also showed a decrease in MPPs (KSLCD48−CD150−) (data not shown). However, other subpopulations of phenotypically defined cells, including HSCs, MPs, and mature cells, are not significantly altered (Fig. 2Bi–iv). Moreover, no significant difference in splenic and thymic subpopulation of cells was observed between WT and PGC-1α−/− mice (Fig. 2Ci–iii). Thus, at a steady state, the hematopoietic composition in PGC-1α−/− mice was only mildly affected. The mild hematopoietic phenotype of PGC-1α−/− mice at a steady state could have been due to compensatory role played by other members of PGC-1 family.
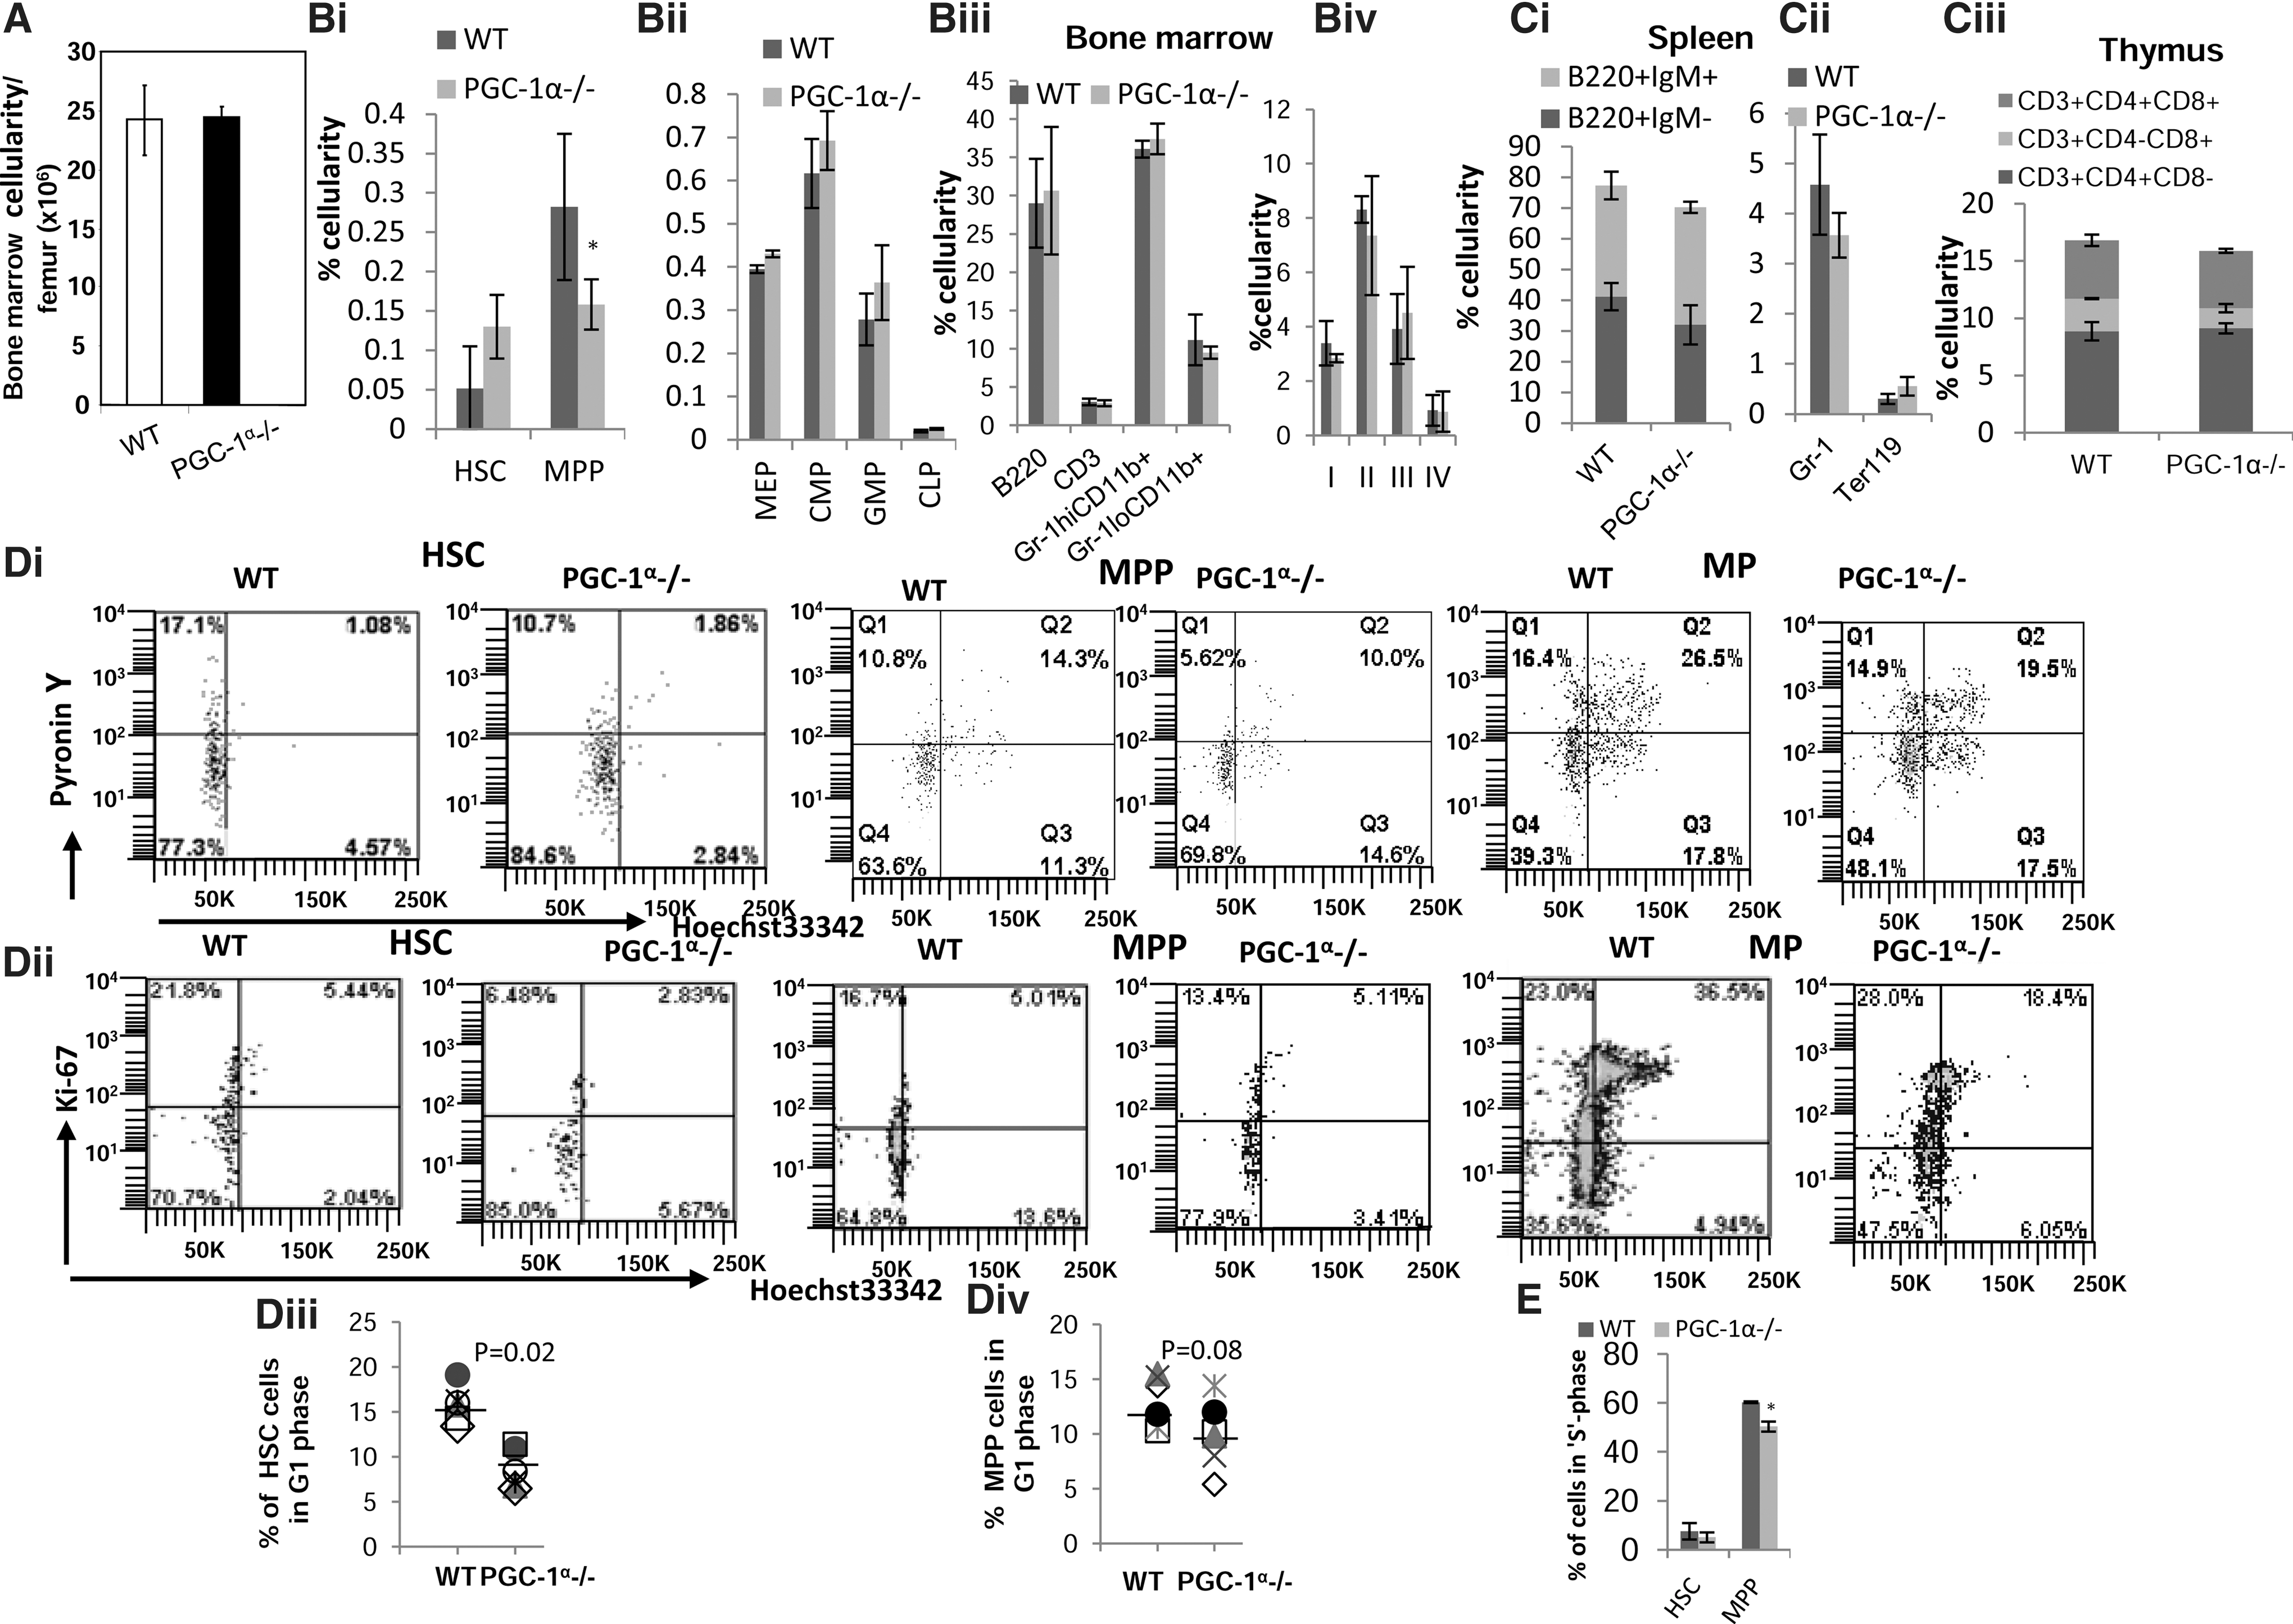
Effect of PGC-1α on BM, splenic, thymic cell populations and the cell cycle status of BM HSC/HPCs.
Differential WBC count of WT and PGC-1α−/− mice is shown. Data are presented as mean±SD (n=4). WT, wild type;
Progression through the G1 phase of the cell cycle is associated with an increase in ΔΨm and respiration [26]. Since the deficiency of PGC-1α led to a significant decrease in the mitochondrial activity, we next analyzed the cell cycle status. In vitro labeling revealed that the percentage of HSCs cells in G1 phase in PGC-1α−/− mice was significantly reduced compared to WT mice (Fig. 2Di–iii). There was also a modest but not significant reduction of MPPs in the G1 phase (Fig. 2Di–ii, iv). In vivo labeling with BrdU further revealed that the percentage of MPPs that had incorporated BrdU over a 3-day period was modestly but significantly reduced in PGC-1α−/− mice compared to WT mice (Fig. 2E). These findings indicate that during steady-state hematopoiesis, PGC-1α plays a role in entry of both HSC and MPP into the cell cycle; in the absence of PGC-1α, progression of MPP into cell cycle is impeded.
Expression of various anti-oxidant enzymes and ROS in PGC-1α−/− BM cells
Examination of the intracellular ROS level in various subpopulations of BM cells using DCFDA, a fluorescent-based probe for ROS showed that both PGC-1α−/−MPs and MPPs have lower levels of intracellular ROS than corresponding WT cells (Fig. 3Ai). Intracellular ROS levels in PGC-1α−/− and WT HSCs were comparable (Fig. 3Ai). In MPPs, both the proportion of DCFDAhigh cells as well as the intensity of staining was lower in PGC-1α−/− than WT cells (Fig. 3Aii, iii).
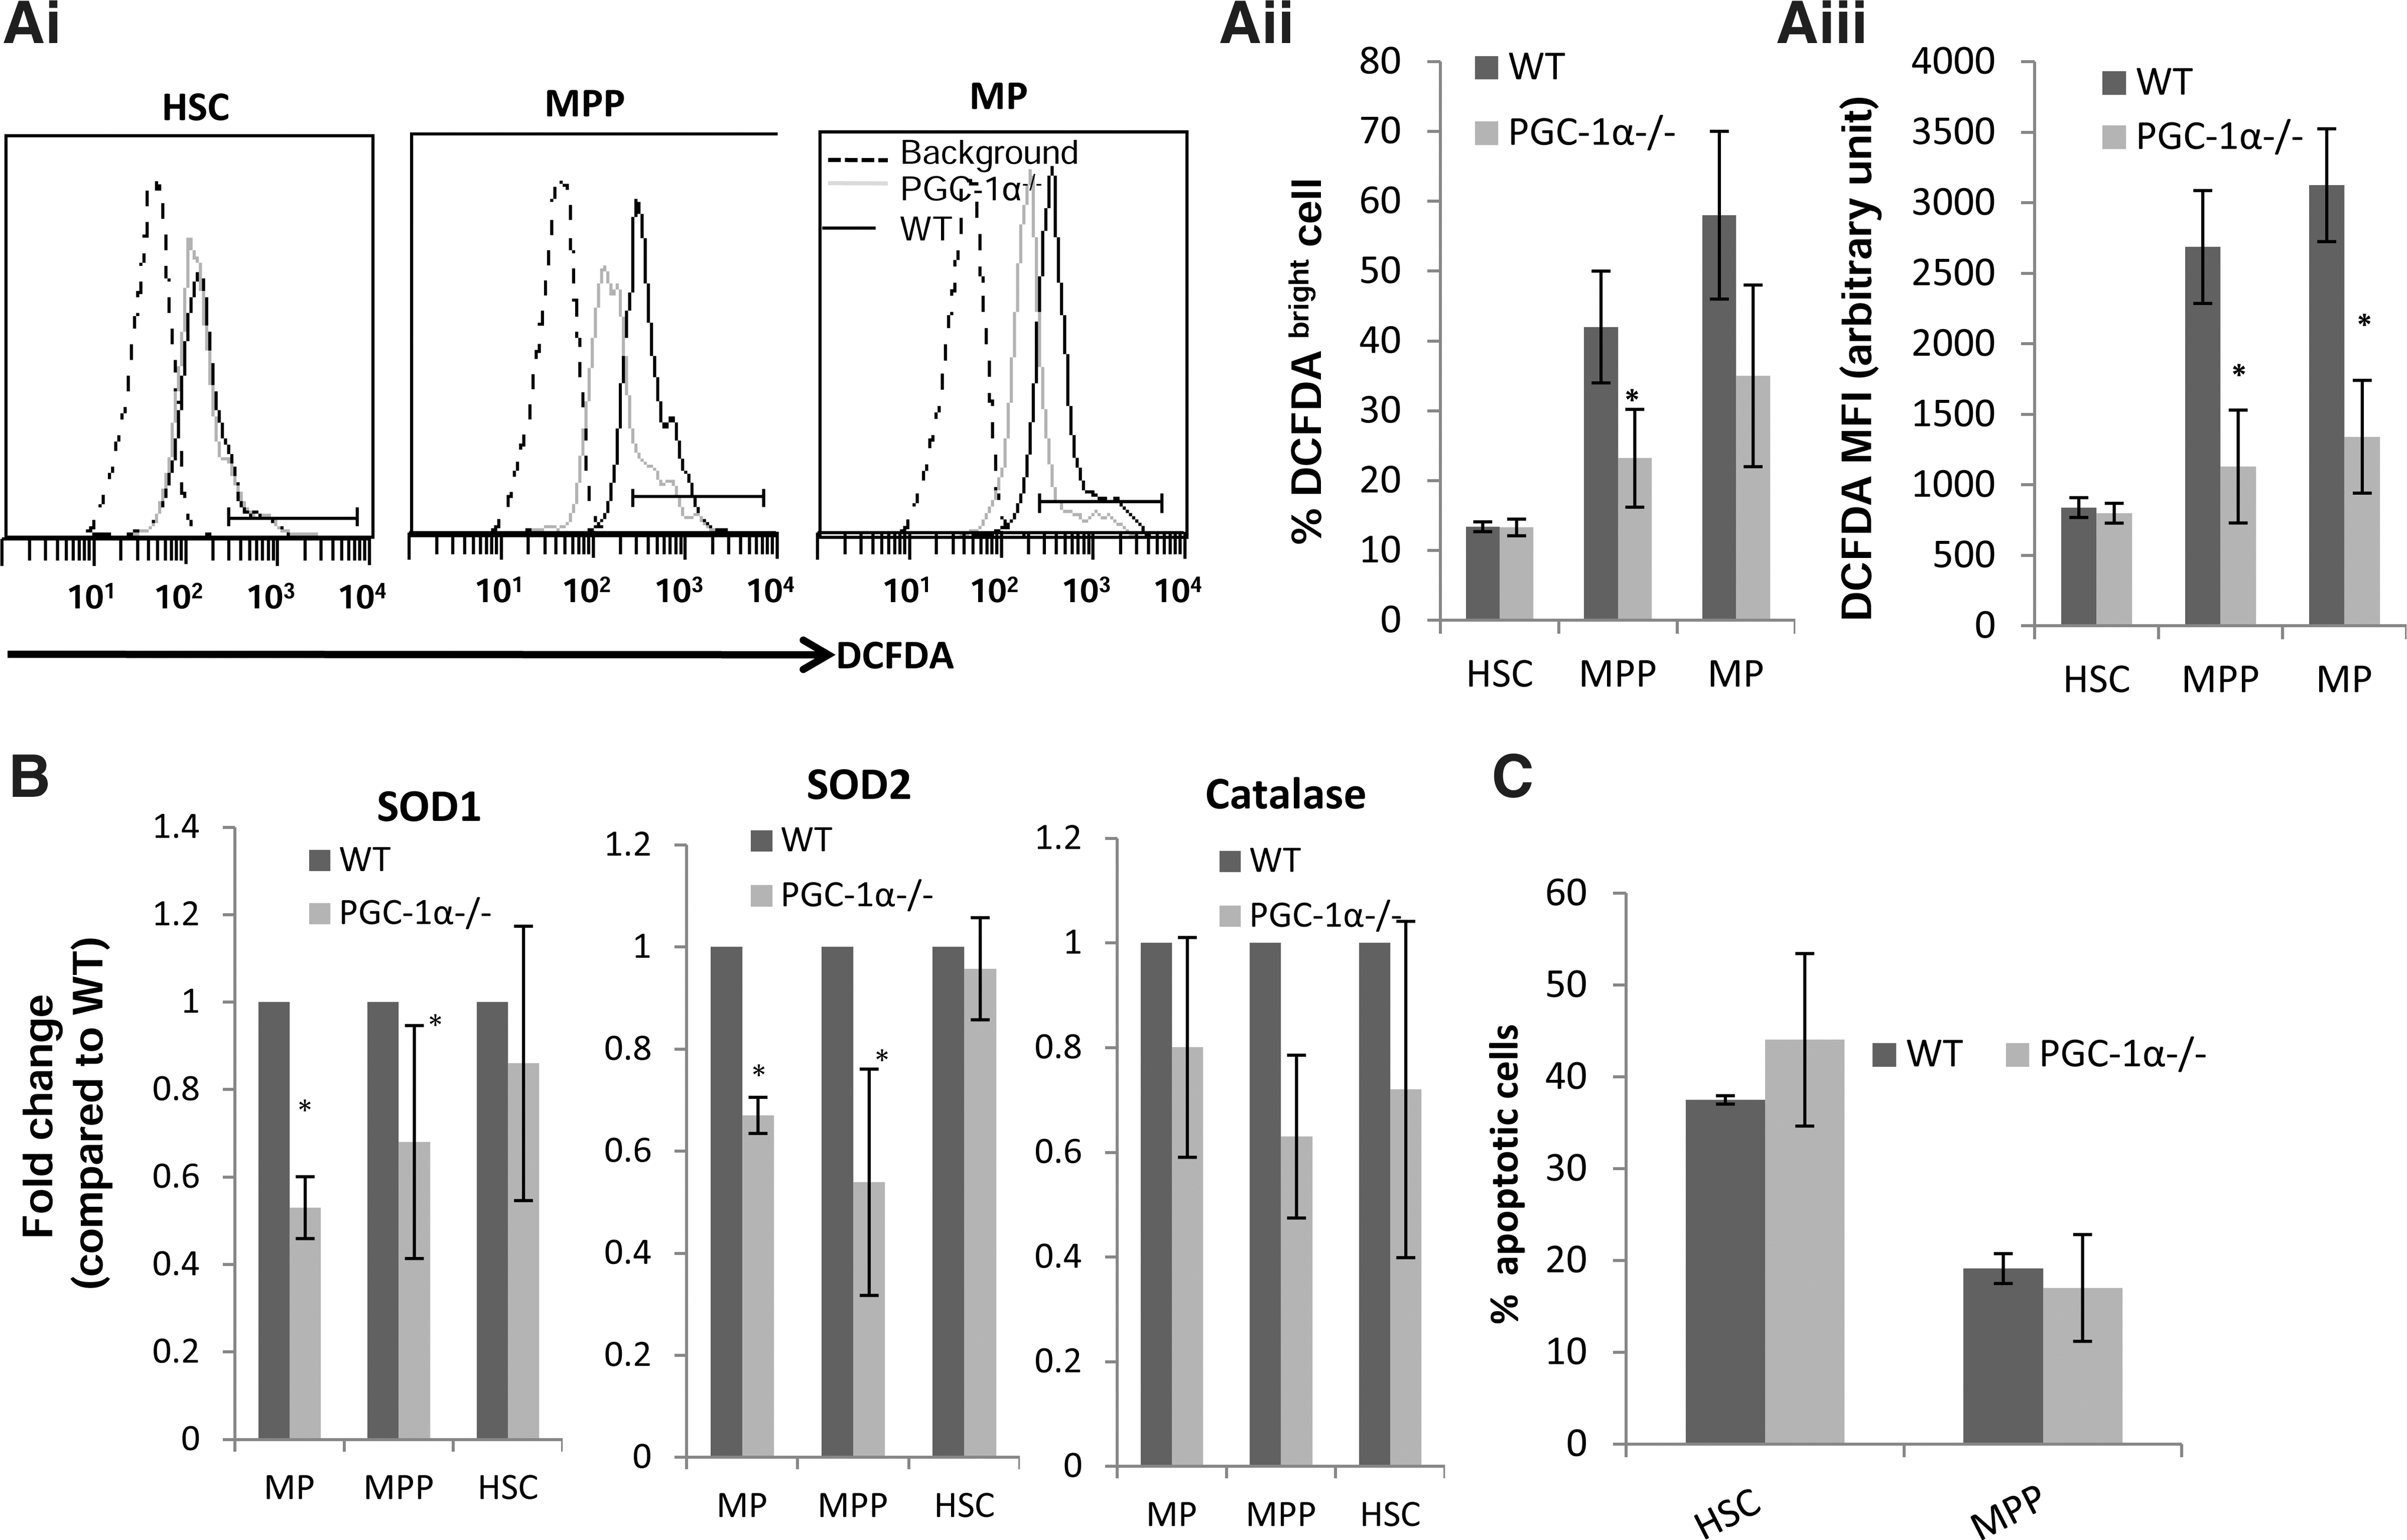
PGC-1α modulates the reactive oxygen species (ROS) level and anti-oxidant enzymes expression but does not affect apoptosis of HSC/HPCs.
Since the ROS level was reduced in PGC-1α−/− BM MPs and MPPs, we examined whether PGC-1α regulated ROS detoxifying enzymes in BM cells. We found that expression of various antioxidant enzymes though differently affected in various subpopulations was, in general, lower in PGC-1α−/− than in WT BM cells (Fig. 3B).
As the number of MPPs was lower (Fig. 2Bi) and the expression of a few of the anti-oxidant enzymes was also reduced in PGC-1α−/− BM cells (Fig. 3B), it was possible that due to deficiency in anti-oxidant enzymes, which could affect ROS detoxification rate, apoptosis is enhanced, resulting in reduction in a number of MPPs in PGC-1α−/− BM. However, the analysis of Annexin-V-positive stained cells as a measure of apoptosis demonstrated that WT and PGC-1α−/− MPPs and HSCs had similar apoptosis (Fig. 3C). In the absence of any significant difference in apoptosis, the reduction in number of MPPs in BM of PGC-1α−/− mice is likely due to slower rates of the cell cycle.
Clonogenic potential of BM cells in lower oxygen tension is compromised by PGC-1α deficiency
We next examined the clonogenic potential of BM cells in vitro both in lower oxygen (5% O2) and normoxic (20% O2) conditions. The clonogenic potential of WT BM cells was significantly enhanced in low O2 tension (Fig. 4A, B). The total numbers of colonies per femur generated of all subtypes (CFU-GM, BFU-E, and CFU-GEMM) were significantly lower in PGC-1α−/− BM compared to WT (Fig. 4A, B) when cultured in 5% O2, but these differences could be, in part, due to differences in the total progenitor numbers in WT and PGC-1α−/− BM cells. Therefore, the difference in input BM populations complicates the direct comparison of the colony numbers generated from WT and PGC-1α−/− BM. However, it is evident that the ability to enhance clonogenic potential at low O2 tension was significantly impaired in PGC-1α−/− BM cells (Fig. 4A, B). Although total number of progenitors generated was higher when PGC-1α−/− BM cells were cultured in 5% O2 compared to 20% O2 (Fig. 4Ai), when stimulated with a single growth factor, the magnitude of increase was significantly small compared to WT cells (Fig. 4Aii). In 20% O2 condition, there is only a modest, not a significant, decrease, in GM-type colony numbers, although both CFU-GEMM and BFU-E generated from PGC-1α−/− BM cells were significantly reduced (Fig. 4B). The differences in input populations may explain why CFU-GEMM and BFU-E progenitors are reduced in PGC-1α−/− BM cells cultured in 20% O2. To further establish the proliferative defects of PGC-1α−/− progenitors observed at 5% O2, we assessed the clonogenic potential of HSCs and MPPs at a single-cell level by sorting single cells and culturing them in SFM supplemented with growth factors at 5% O2. On day 7, two different types of high proliferative colonies (>600 cells)—compact and spread-type—were found in these cultures. The “compact” colony chiefly comprised of blast-like cells, while the “spread-type” type colony contained greater proportions of granulocytes and macrophages (data not shown). We found that on day 7, PGC-1α−/− HSCs and MPPs gave rise to fewer high proliferative colonies and, importantly, a greater proportion of these high proliferative colonies were of spread-type, whereas the WT HSCs and MPPs gave rise to more compact, high proliferative colonies (Fig 4Ci, ii). These findings demonstrated that the proliferative potential of the PGC-1α−/− HSCs and MPPs is indeed impaired when these cells are cultured at 5% O2.
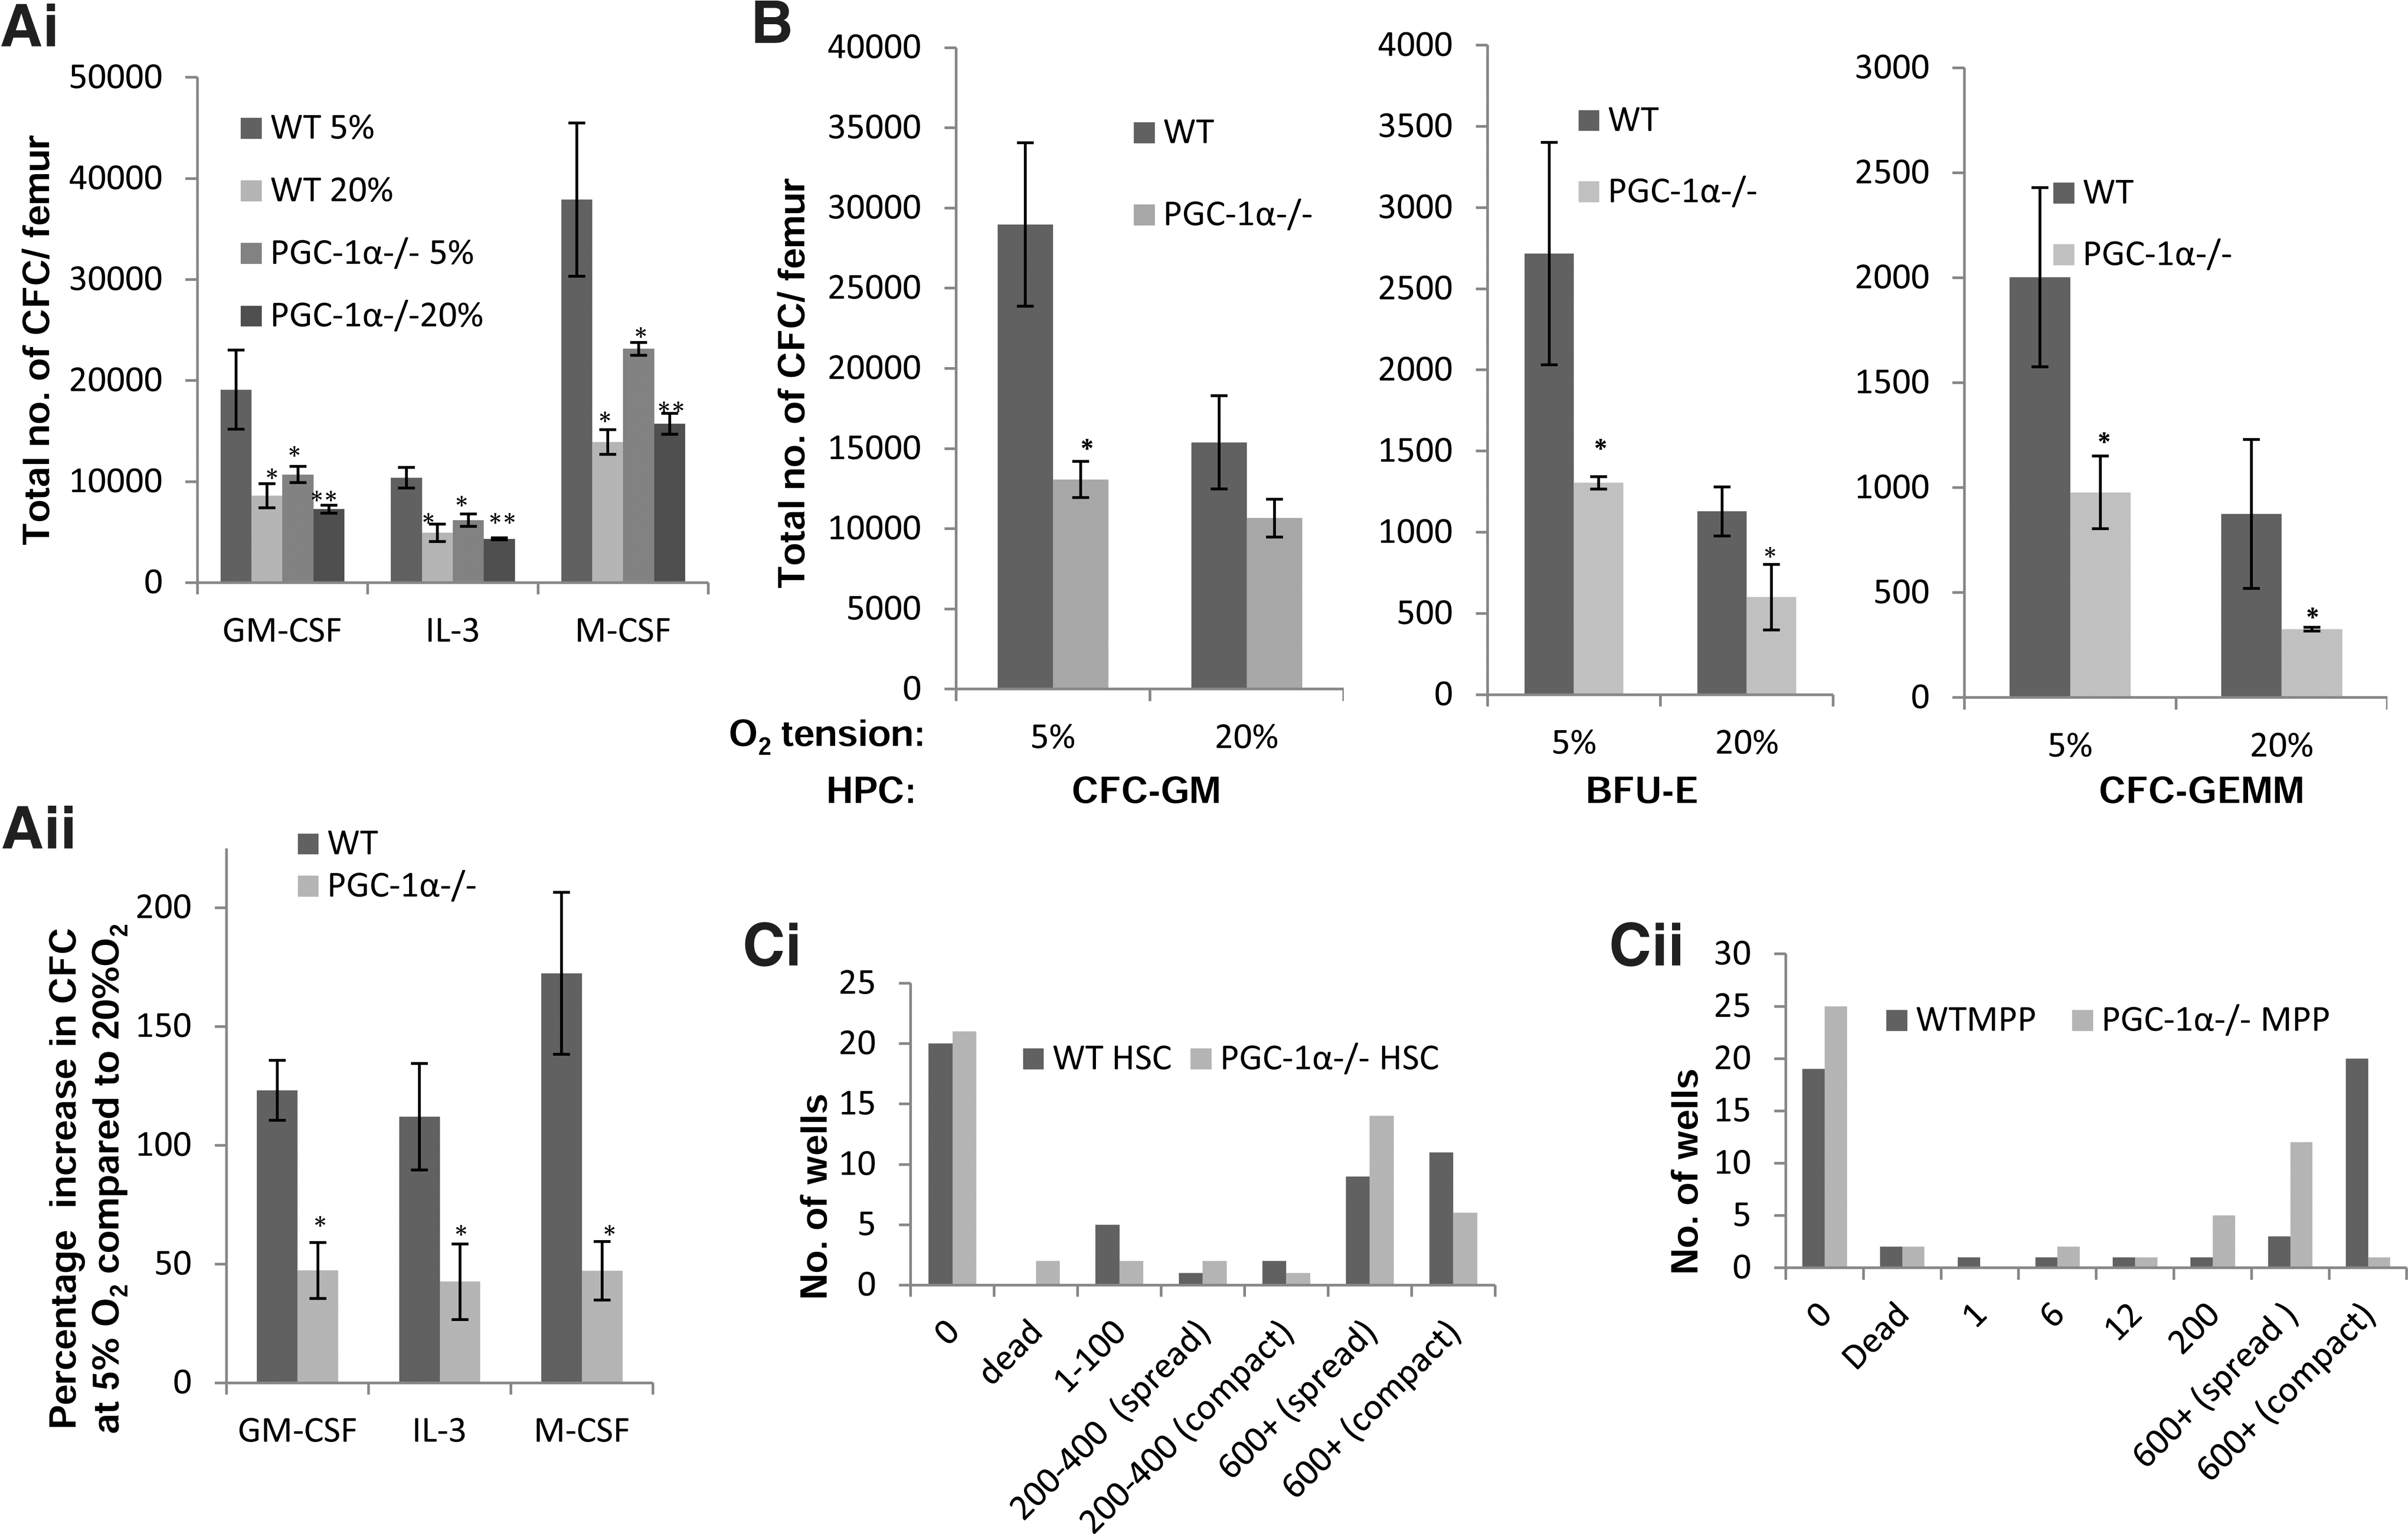
PGC-1α modulates the clonogenic potential of BM cells. BM cells were plated in methylcellulose in the presence of a single growth factor or mixed growth factors, and cultured for 7 days in either 20% or 5% O2 conditions and the total number of colonies generated in the presence of a
PGC-1α expression and mitochondrial activity is increased in WT progenitor cells in lower oxygen tension
Bradley et al. [5] had first reported that the clonogenic potential of hematopoietic progenitor cells is significantly enhanced when the assays are performed in mild hypoxic (5% O2) compared to normoxic (20% O2) conditions, otherwise stimulated identically. The mechanism underlying this phenomenon remains largely unknown. As we had hypothesized that increased mitochondrial activity is required to provide the energy and substrates to sustain increased proliferation, and the magnitude of increase in clonogenic potential at 5% O2 tension was significantly lower for PGC-1α−/− BM cells, we reasoned that PGC-1α plays a role in this phenomenon. Therefore, we investigated the effect of moderate hypoxia on PGC-1α expression in progenitor cells from WT mice. MPPs and MPs were sorted and cultured in a serum-free liquid medium supplemented with various growth factors (as described in Materials and Methods) in either 5% or 20% O2 conditions. Expression of PGC-1α in WT MPPs and MPs after 20 h of culture was significantly higher in cells cultured in 5% O2 than those cultured in 20% O2 (Fig. 5A). We also found that various subfractions (MPs, MPPs+ HSCs) of WT BM cells cultured in 5% O2 conditions had a significantly higher intensity of MDR staining (Fig. 5Bi, ii), suggesting an increase in mitochondrial activity compared to cells cultured in 20% O2 for 4 days. ROS levels were also higher in WT progenitors when cultured in 5% O2 compared to 20% O2 (5Bi &iii). Both higher MDR staining intensity and ROS levels (DCFDA MFI) in cells cultured in 5% O2 strongly suggest that lower O2 tension leads to increase in mitochondrial activity. This supports the enhanced proliferative rate compared to identically stimulated MPs (medium supplements and growth factor/s) cultured in 20% O2. The mitochondrial activity as evidenced by MDR staining was also enhanced in PGC-1α−/− MPs (Fig. 5Ci) when cultured in 5% O2 condition; however, it was significantly less compared to WT MPs (Fig. 5Cii). Consistent with this finding we also found that at lower O2 tension, mitochondrial biogenesis was significantly higher in WT MPs than in PGC-1α−/− MPs (Fig. 5D). Similar to WT MPs, intracellular ROS level in PGC-1α−/− was higher when cells were cultured in 5% O2 than in 20% O2 (Fig. 5E). Interestingly, at 5% O2, the ROS level in PGC-1α−/− MPs was higher than that in WT MPs most likely due to lower expression of anti-oxidant enzymes in PGC-1α−/− MPs (Fig. 3B). Thus, an increase in PGC-1α and a concomitant increase in mitochondrial activity facilitate increased clonogenic activity of hematopoietic progenitors in 5% O2.
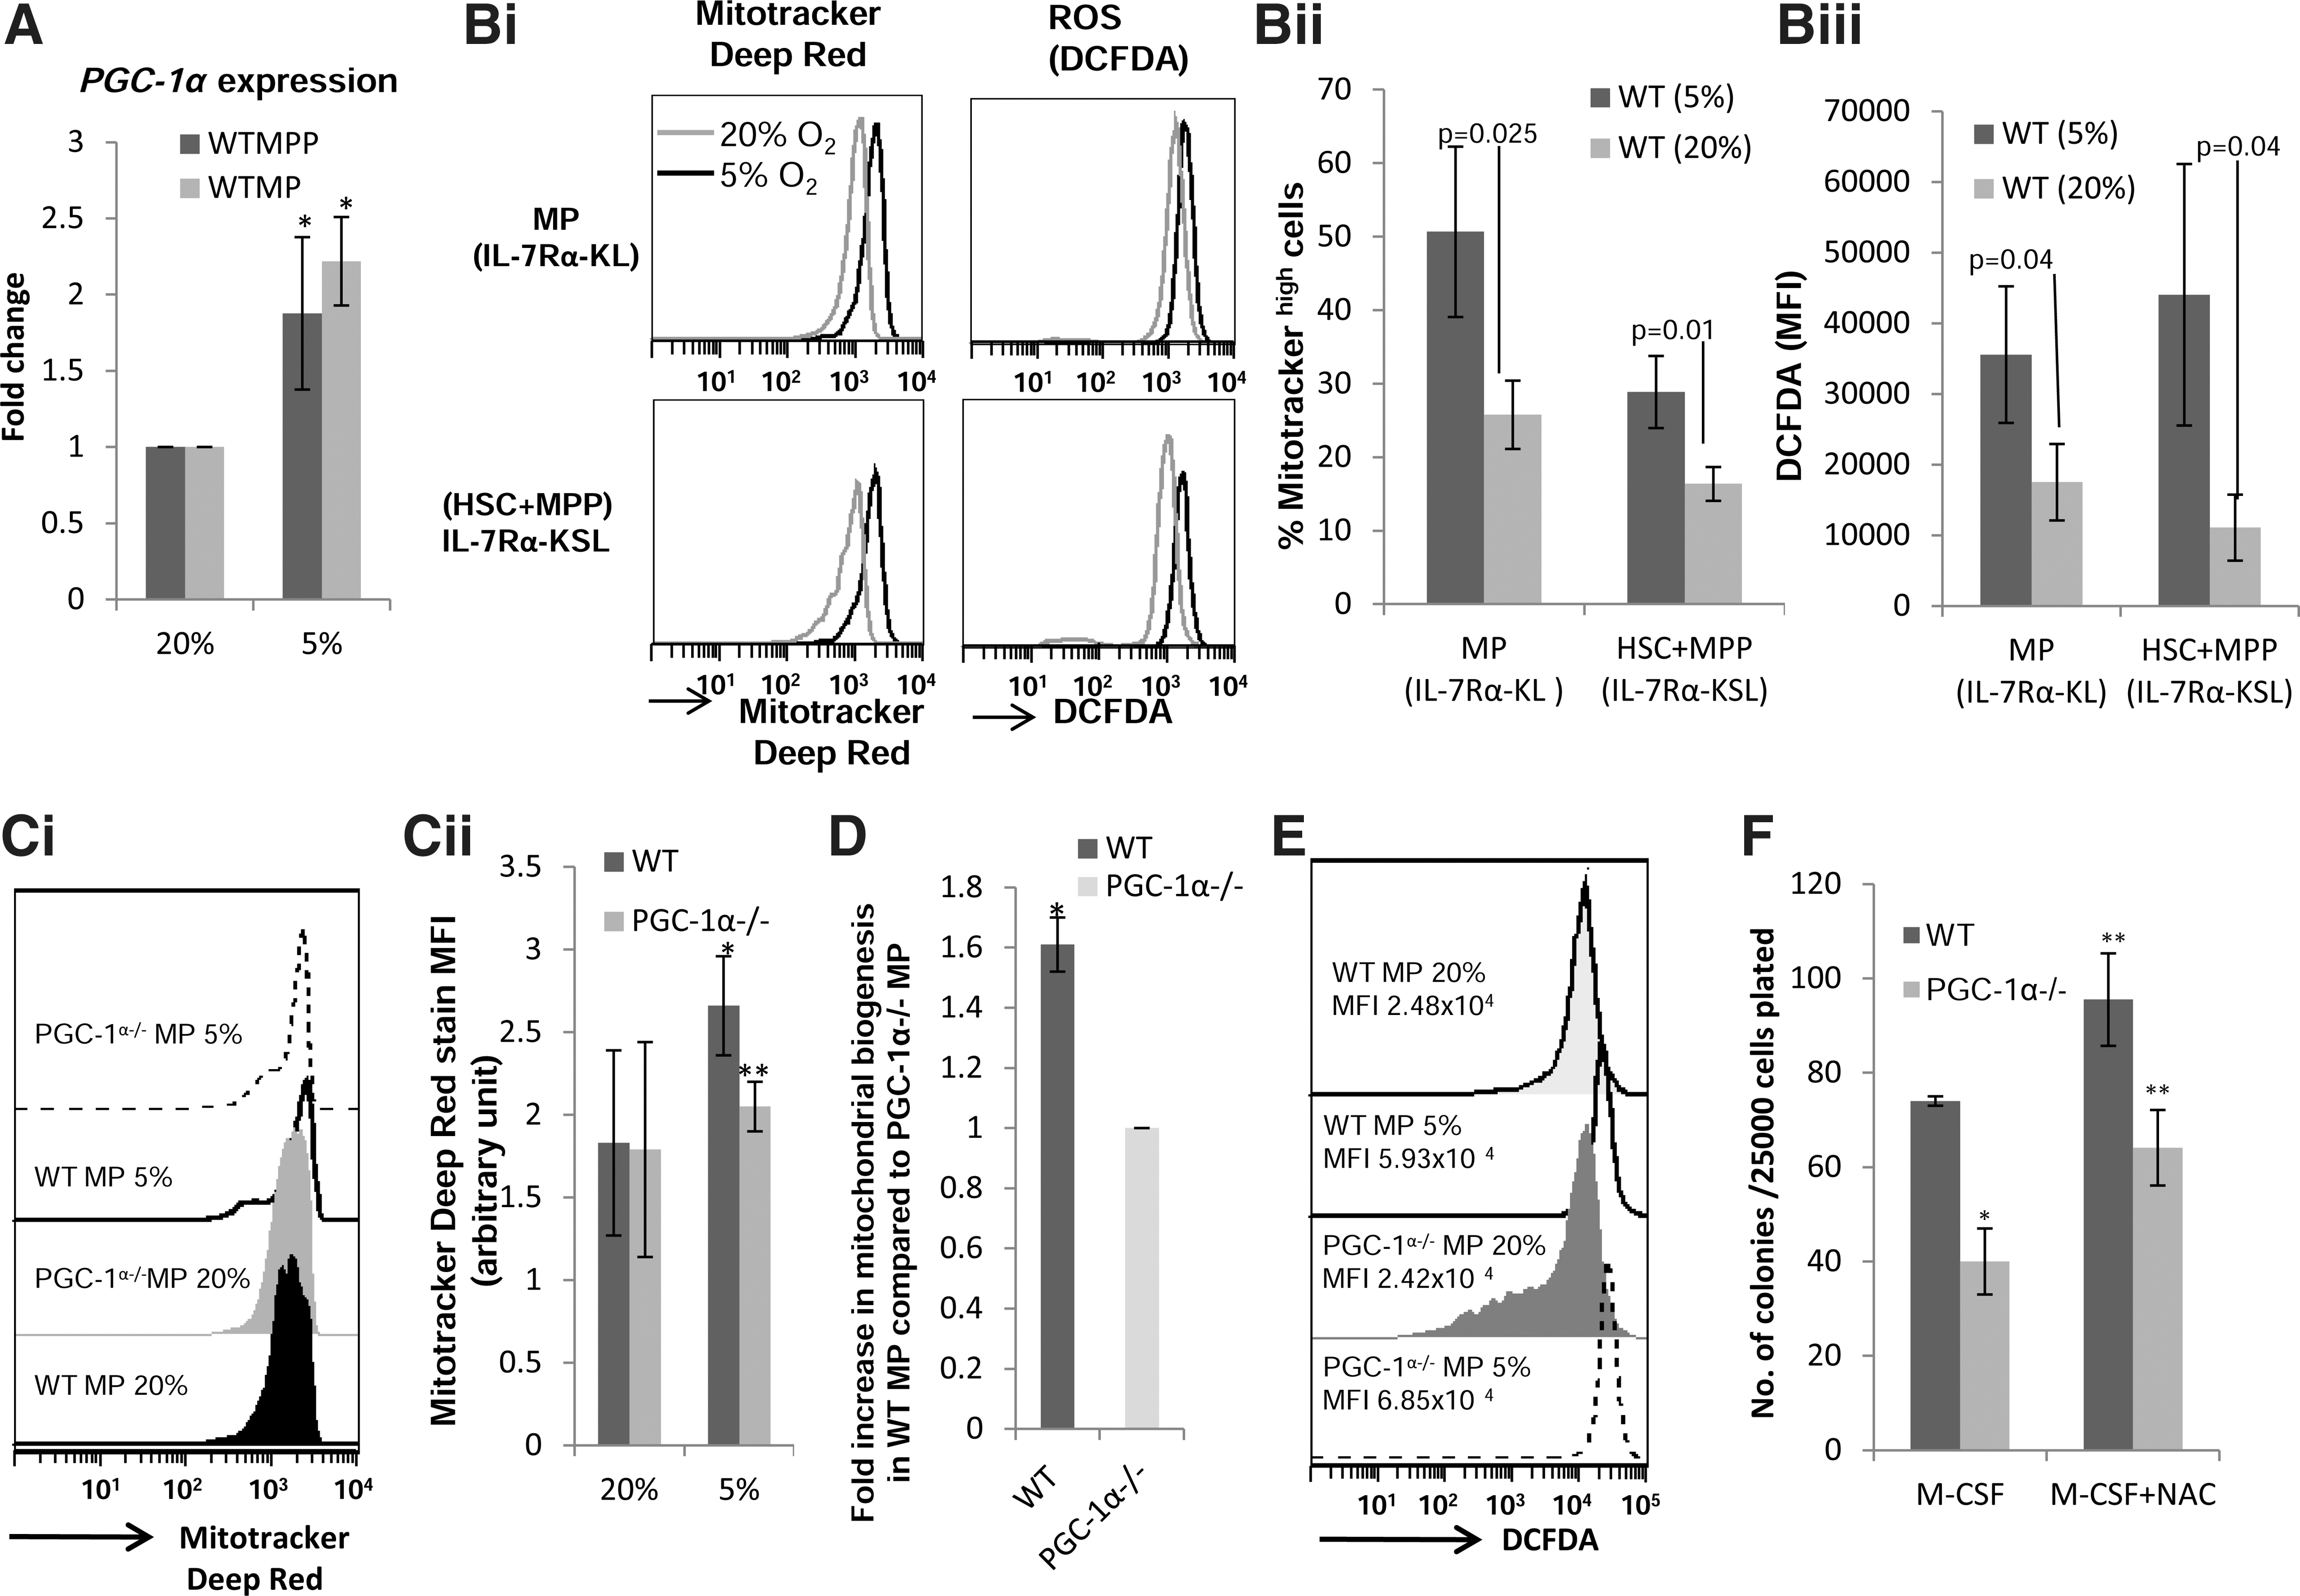
Lower oxygen condition modulates PGC-1α expression, mitochondrial activity, and ROS level in progenitor cells.
Since both WT and PGC-1α−/− MPs cultured in 5% O2 tension had higher intracellular ROS levels than in those cultured in 20% O2, which can lead to cell death, we examined the effect of N-acetyl cysteine (NAC), an anti-oxidant, on colony forming capacity of BM cells. In this experiment, we used M-CSF to stimulate colony formation of BM cells. M-CSF alone specifically stimulates growth of myeloid lineage cells [27]. Because the proportions of myeloid progenitors are comparable in the WT and PGC-1α−/− BM cells, using M-CSF alone to stimulate proliferation of the BM cells in the clonogenic assay allowed for the direct comparison of the differences in colony formation between WT and PGC-1α−/− BM cells. NAC enhanced M-CSF-stimulated colony generation from both WT and PGC-1α −/− BM cells. However, the number of colonies generated from PGC-1α−/− BM was still significantly lower than from WT BM cells (Fig. 5F), demonstrating that enhanced mitochondrial activity is required to sustain optimal proliferative potential of progenitor cells in 5% O2 conditions when stimulated with growth factor/s.
Metabolic reprogramming in progenitors in lower oxygen tension
Since PGC-1α expression and mitochondrial activity is increased in rapidly proliferating progenitors, we next examined whether there is indeed a metabolic reprogramming in these cells to meet the energy requirement and demand for macromolecule generation for replication. HIF-1α regulates the flux of pyruvate, the end product of glycolysis, into TCA cycle by regulating pyruvate dehydrogenase kinase (Pdk1) expression [11,28]. We observed that in the first 20 h of culture in 5% O2, the Hif-1α transcript level in WT MPs progressively decreased with time in culture, and this was followed by a decrease in expression of Pdk1 and lactate dehydrogenase A (LdhA) expression (Fig. 6A), except at 12h when Pdk1 expression was higher than baseline. Concomitantly, expression of Glut3, a glucose transporter with highest affinity for glucose among various glucose transporters [29], progressively increased in MPs (Fig. 6A). Increases in PGC-1α, coupled with increases in Glut3 and decreases in Pdk1 expression (increase in mitochondrial metabolism), represent an ideal condition that can meet the demands of a proliferating cell. In addition, since uptake of glucose and glycolytic flux is significantly enhanced upon growth factor stimulation [4], it is critical that flux of pyruvate to mitochondria is regulated such that it optimally matches the electron transfer capacity (ETC) of the mitochondria to minimize oxidative stress. Similar metabolic reprogramming and a shift of metabolic activity toward mitochondria were also observed in PGC-1α−/− MPs (Fig. 6A), but the extent of shift toward mitochondria compared to WT BM progenitors was lower, as indicated by Mitotracker Deep Red staining (Fig. 5Ci, ii). In addition, although Glut3 expression increased in PGC-1α−/− MP compared to WT MP the change was relatively small (Fig. 6A). Consistent with this, we found that at 24 h postculture in low O2 tension, PGC-1α−/− MP consumed less glucose and produced more lactate than WT MP (Fig. 6Bi, ii), thus confirming that a shift toward mitochondrial metabolism was comparatively less in PGC-1α−/− MP. Also, after 3 days of culture in 5% O2 tension, along with a higher intracellular ROS level in PGC-1α−/− MPs under these culture conditions (Fig. 5E), the percentage of cells expressing a higher HIF-1α protein level was greater for PGC-1α−/− compared to WT MP (Fig. 6C). Thus, in the absence of the ability to increase mitochondrial biogenesis, there is an adaptive response in PGC-1α−/− cells that modifies both the glucose uptake as well as mitochondrial metabolism, resulting in reduced proliferative response.

Modulation in expression of various metabolic programming regulating genes in progenitor cells stimulated with growth factors in low oxygen tension.
To determine the contribution of OXPHOS to ATP content in BM progenitors cultured in 5% O2 tension, we treated the cells with oligomycin, a mitochondria ATP synthase inhibitor. MPs were cultured in hypoxia in the presence of growth factors for 24 h, and then oligomycin was added to the cultures. Oligomycin inhibited ATP levels both in WT and PGC-1α−/− MPs (Fig. 6D). Decreases in ATP level were observed within 2 h of treatment with oligomycin and it was further reduced 24 h post-treatment (Fig. 6D). Moreover, the percentage decrease in ATP levels by oligomycin was greater in WT MPs than in PGC-1α−/− MPs (shown in the inset of Fig. 6D), thus demonstrating that the contribution of mitochondrial ATP to total cellular ATP was lower in PGC-1α−/− than in WT MPs. This is consistent with the relatively smaller shift toward mitochondrial metabolism observed in PGC-1α−/− cells when stimulated with growth factors at 5% O2. Interestingly, oligomycin also affected cellular proliferation and the inhibition of proliferation by oligomycin was greater for PGC-1α−/− MPs (74.3%±0.04% and 87.0%±0.16% for PGC-1α−/− and WT MPs, respectively).
Examination of the cell cycle status of MPs cultured at 5% O2 after 17 h revealed that a greater proportion of WT MPs are in G1 phase compared to PGC-1α−/− MPs and that a greater proportion of PGC-1α−/− MPs were undergoing apoptosis (sub G0/G1 fraction). We also found that the proportion of apoptotic cells was significantly higher in PGC-1α−/− MPs after 60 h in culture at 5% O2. Interestingly, as observed after 24 h in culture, the mitochondrial pool of ATP was higher in WT MPs than in PGC-1α−/−MPs after 60 h of culture at 5% O2. These findings collectively suggest that enhanced the mitochondrial activity is important for rapid proliferation of progenitors.
In vivo stress hematopoiesis models: competitive repopulation assay and recovery of hematopoiesis following 5-FU treatment
Reduced mitochondrial activity in BM cells of PGC-1α−/− mice as well as reduced clonogenic potential of PGC-1α−/− progenitors in low O2 tension raised the possibility that HSC/HPCs from PGC-1α−/− mice may be functionally compromised. To test this possibility we performed competitive bone marrow transplantation and followed the contribution of donor-type cells in the blood of recipient mice. One month post-transplantation, PGC-1α−/− BM had comparatively lower contribution to peripheral blood cells of recipient mice than WT BM cells, particularly at a lower donor:competitor graft ratio (Fig 7Ai, ii). Moreover, at 2 months post-transplantation and onward, unlike WT BM cells, whose contribution toward recipients' blood cells progressively increased over time, the contribution of PGC-1α−/− cells did not increase any further than that observed at 1 month post-transplant, and from 4 to 6 months, it was significantly less than the contribution of WT BM cells (Fig. 7Ai). This observation was more striking when transplantation was performed at a lower donor:competitor cell ratio (0.25:1) (Fig. 7Aii). Contribution of PGC-1α−/−-derived BM cells to various lineages of blood cells in the recipient mice was also low and was similarly affected (Fig. 7Aiii). The defect in long-term repopulation activity of PGC-1α−/− BM cells was not due to homing defect since homing of HSCs to BM of irradiated recipient mice 18 h post-transplantation was comparable between WT and PGC-1α−/− HSCs (24.1%±5.2% and 30.2%±3.2% for WT and PGC-1α−/− HSCs respectively). Analysis of BM cells of recipient mice that had received a lower donor:competitor cell ratio graft, 8 months post-transplantation, revealed a significant decrease in both PGC-1α−/− progenitor and stem cells (Fig. 7Bi). Although secondary transplantation using purified HSCs/HPCs from BM of primary recipient mice would have been ideal to further compare the re-populating ability of these cells, instead we used total BM cells of primary recipients for secondary transplant. When BM of primary recipients (0.25:1) was used for secondary transplant, there was negligible contribution of PGC-1α−/−-derived blood cell in the secondary recipients (Fig. 7Bii). The selective reduction in CD45.2 chimerism in recipient mice that had received PGC-1α−/− BM cells in competitive setting, particularly, at a lower donor:competitor ratio strongly suggested that PGC-1α−/− HSCs are intrinsically less competitive than WT HSCs.
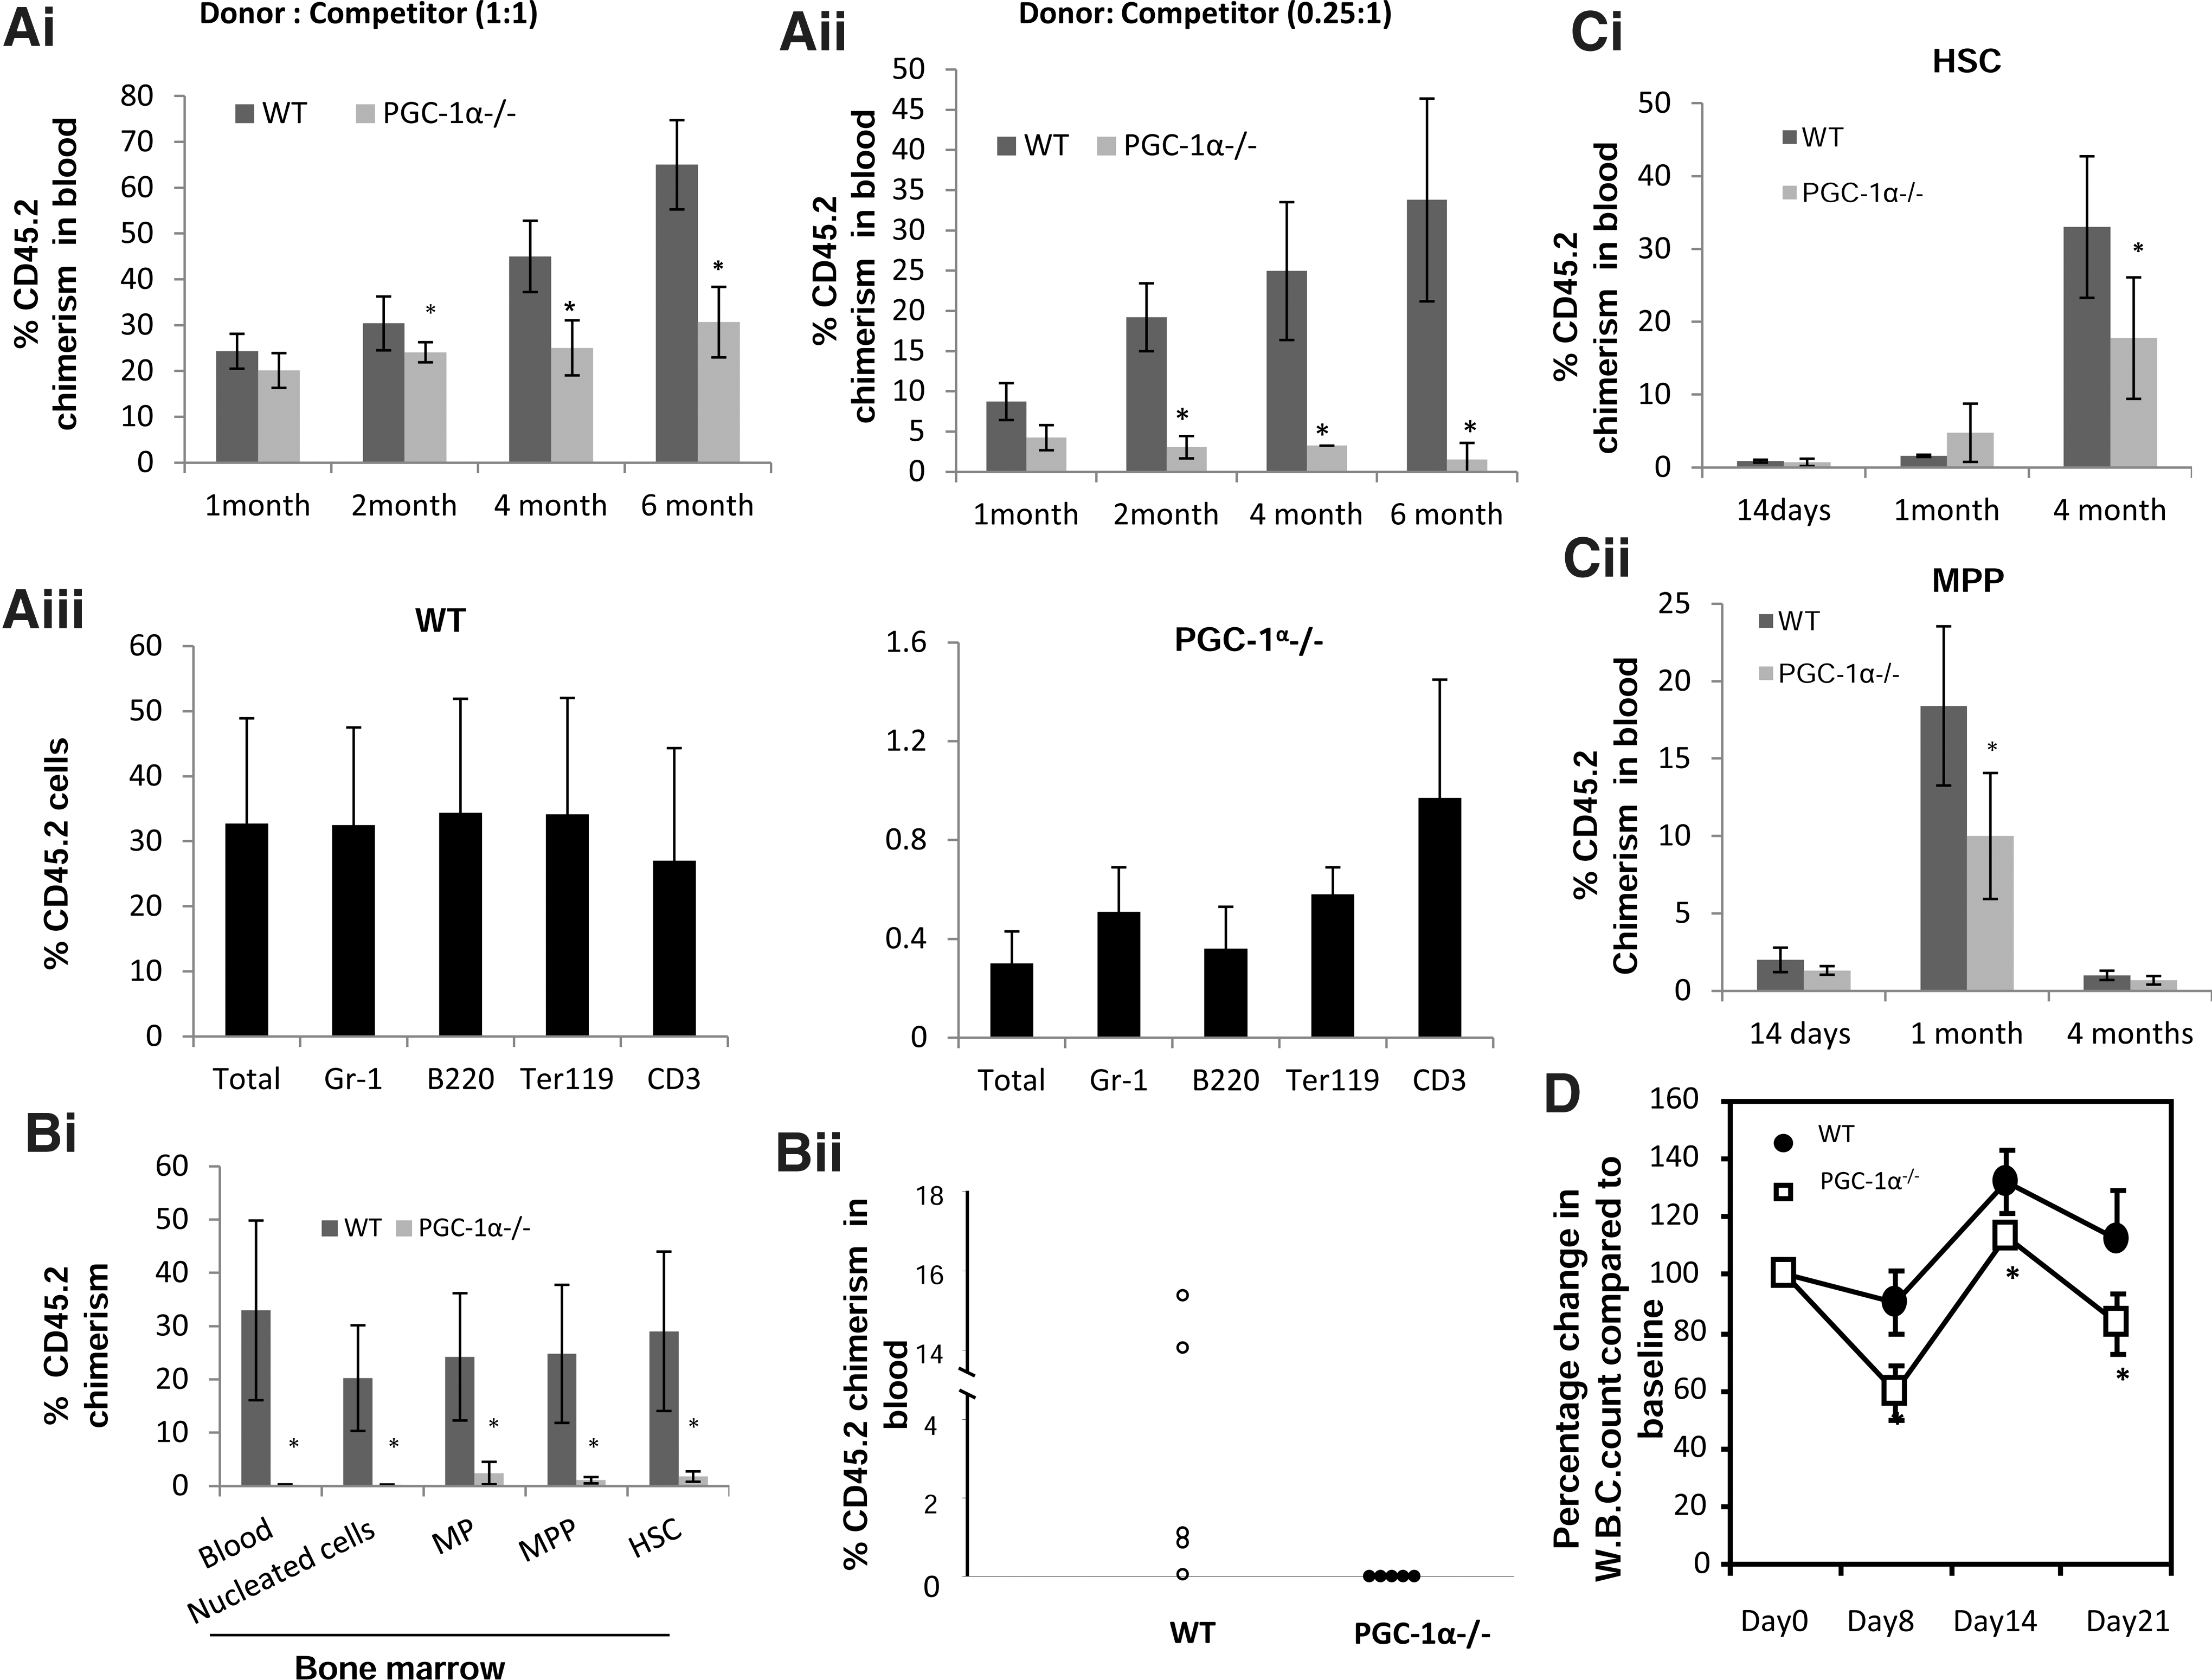
Loss of PGC-1α impairs competitive repopulating potential of BM cells and recovery of hematopoiesis following 5-fluorouracil (5-FU) treatment. WT or PGC-1α−/− BM cells (CD45.2) were mixed with competitor cells from BoyJ mice (CD45.1) and injected into lethally irradiated F1 (CD45.1/CD45.2) mice at
To gain further insight into the impaired re-populating potential of PGC-1α−/− BM cells, purified HSCs and MPPs were co-injected along with 2×10⁵ cells competitor cells (BoyJ) into lethally irradiated recipient mice (F1) and followed for reconstitution. Compared to WT MPPs, contribution of PGC-1α−/− MPPs to recipient peripheral blood cell was significantly less both at 14 days and 1 month post-transplantation (Fig. 7Cii). Moreover, in mice that had received either WT or PGC-1α−/− HSCs, although donor-derived contribution to peripheral blood cell was comparable on day 14, at 4 months post-transplant, the percentage of donor-derived blood cells in circulation was significantly less in recipient mice that had received PGC-1α−/− HSCs (Fig. 7Ci). These findings demonstrate that the loss of PGC-1α impairs repopulating ability of both HSCs and progenitor cells.
To further characterize the loss of PGC-1α on stress hematopoiesis, we challenged the mice with 5-FU, a myeloablative agent that evokes stress response. Following 5-FU treatment, peripheral WBC count decreased in both WT and PGC-1α−/− mice and this was followed by recovery of WBC count (Fig. 7D). The kinetics of changes in WBC count following 5-FU treatment was comparable between WT and PGC-1α−/− mice; however, the recovery of WBC count was significantly impaired in PGC-1α−/− compared to WT mice. This finding further demonstrates that PGC-1α plays an important role during stress hematopoiesis.
Discussion
PGC-1α is a major regulator of mitochondrial biogenesis and energy metabolism [30,31]. We found that PGC-1α is expressed in early subsets (HSC, MPP, and MP) of BM cells as well as in B-lymphocytes. Although the numbers of MPP are reduced in PGC-1α−/− mice, this reduction was not reflected in mature blood cell numbers, suggesting that a compensatory mechanism exist during later stages of blood cell development. Furthermore, we demonstrate that while PGC-1α minimally affects unperturbed steady-state hematopoiesis, PGC-1α is a critical regulator of stress induced hematopoiesis.
Among early undifferentiated BM cells, PGC-1α is expressed in MPs, MPPs, and HSCs; however, its expression was highest in MPPs. Mitochondrial activity was reduced in both HSC and HPC compartments of BM of PGC-1α −/− mice. Moreover, intracellular ROS was lower in PGC-1α−/− compared to WT BM cells. Since OXPHOS is the major source of ROS in most cells [32], low ΔΨm as well as reduced ROS levels found in PGC-1α−/− BM cells indicate that OXPHOS is reduced in PGC-1α−/− BM cells.
Compared to WT BM cells, PGC-1α−/− BM cells gave rise to significantly fewer colonies when cultured in 5% O2 condition, although phenotypic analysis revealed only a small difference in the numbers of MPP and no difference in MP between PGC-1α−/− and WT mice. This most likely reflects differences in hematopoiesis being evaluated, that is, steady-state versus stress hematopoiesis. Concentrations of growth factors used to stimulate cell proliferation in in vitro are higher than that found in a normal physiological state and is comparable to that found in vivo in response to various stress conditions [33]. Although progenitor cells are located in relatively oxygen-rich areas in BM, oxygen tension in these areas is lower than normoxia [6]. Thus, proliferation of progenitor cells in vitro in lower oxygen tension mimics proliferation of progenitors during stress hematopoiesis. Reduced clonogenic potential of PGC-1α−/− BM cells cultured in 5% O2 condition, therefore, indicates that deficiency of PGC-1α compromises ability of progenitors to undergo rapid proliferation in response to stress conditions.
Metabolic programming in rapidly proliferating cells needs to be altered so that the flux of metabolites to biosynthetic pathways is maintained at an optimal rate. We found that expression of various molecules that regulate metabolic programs underwent change in MPs cultured in 5% O2 tension. In the first 24 h of culture, the relative abundance of Hif-1α transcript decreased progressively with time, followed by a decrease in both LdhA and Pdk1 expression, strongly suggesting a shift in glucose metabolism toward the mitochondrial TCA cycle [11,28]. Metabolic reprogramming in WT MPs stimulated with growth factors in 5% O2 and, hence, represents an ideal set of conditions for supporting maximal cellular proliferation.
Although an increase in the shift toward mitochondrial metabolism was observed in PGC-1α−/− progenitors at low O2 tension, the shift was less pronounced than that in WT progenitors. Moreover, the increase in clonogenic potential in low O2 tension was significantly less in PGC-1α−/− progenitors. Thus, although metabolic reprogramming in PGC-1α−/− MPs occurs when cultured in low O2 tension, it is not enough to support maximal proliferation. Our findings suggest that to harness the full potential of metabolic programming the cell should posses the capacity to enhance ETC complex and flux of pyruvate to mitochondria is attenuated to match optimally with the ETC capacity to avoid significant increase in ΔΨm and or increased ROS production that would lead to apoptosis. Although there are other members of the PGC-1 family (PGC-1β and PGC-1 related co-activator [PRC]), that can lead to mitochondrial biogenesis [34], our findings demonstrate that PGC-1α is important for increased proliferative response of hematopoietic progenitors stimulated with growth factors in low O2 tension.
ATP production was significantly inhibited by oligomycin in hematopoietic progenitors proliferating in low O2 and these cells had high levels of ROS, demonstrating that at least a proportion of pyruvate that enters the TCA cycle undergoes OXPHOS to generate ATP. Consistent with the previously described critical role of mitochondrial ATP in cell cycle progression [35,36], inhibition of mitochondrial ATP by oligomycin treatment repressed proliferation of progenitors. Interestingly, despite a relatively smaller decrease in the ATP level in PGC-1α−/− MPs compared to WT MPs upon oligomycin treatment, a higher reduction in proliferation of PGC-1α−/− MPs was observed, suggesting that the pool of mitochondrial ATP is smaller in PGC-1α−/− MPs compared to WT MPs when cultured in vitro at 5% O2 in the presence of growth factors, which is consistent with lesser shift toward mitochondrial metabolism in these cells.
Reduced in vitro clonogenic potential of PGC-1α−/− hematopoietic progenitors (MPP and lineage committed progenitor) in 5% O2 tension suggested that situations demanding rapid proliferation of hematopoietic progenitors in vivo will be similarly compromised. Indeed, in competitive repopulation assay, PGC-1α−/− BM cells were severely compromised in their ability to re-populate irradiated recipient BM. Defects in progenitor cell proliferative potential should affect early repopulation after transplant. Based on short-term repopulation data (1 month post-transplant; Fig. 7Ai, ii), at higher donor:competitor graft, the deficiency in progenitor cell proliferative capacity was not apparent; however, at a lower ratio, competitive repopulating potential of PGC-1α−/− BM was modestly impaired. This difference in repopulating capacity between the 2 grafts (1:1 and 0.25:1 grafts) is likely due to the presence of more than sufficient number of progenitors in a higher donor:competitor ratio graft. Moreover, although total HSC numbers at a steady state were unaffected by the loss of PGC-1α−/−, and homing of HSCs is not affected by the loss of PGC-1α, long-term repopulating activity of PGC-1α−/− BM cells was impaired. Lower long-term repopulating ability of PGC-1α−/− BM cells could be due to an intrinsic defect in PGC-1α−/− HSCs. On the other hand, it could be an indirect effect of impaired PGC-1α−/− progenitor cell proliferative capacity; that is, lower PGC-1α−/− progenitor cell proliferative potential requires the HSCs' to proliferate more in order to replenish the progenitor cell pool leading to the exhaustion of HSCs. A selective reduction in CD45.2 chimerism in the recipient mice that had received PGC-1α−/− BM cells (Fig. 7Aiii) argues against the latter possibility. Besides the findings of the in vitro single-cell clonogenic assay, the finding that recipient mice that had received purified PGC-1α−/− HSCs (along with competitor BM cells) had lower CD45.2 chimerism at 4 months post-transplantation further confirmed the intrinsic defect in PGC-1α−/− HSCs.
In addition to impaired repopulating potential of PGC-1α−/− BM cells in competitive transplantation setting, recovery of hematopoiesis following 5-FU treatment was also impaired in PGC-1α−/− mice, thus demonstrating that PGC-1α and mitochondrial metabolism plays an important role in proliferation of both HSCs and progenitor cells during stress hematopoiesis, when there is a greater demand on both HSCs and HPCs to proliferate rapidly to restore hematopoiesis.
In conclusion, our findings demonstrate an important role of PGC-1α in recovery of hematopoiesis post-myeloablative stress. PGC-1α is a target that has the potential to be pharmacologically regulated [37]. Our findings may thus have clinical implications for patients undergoing chemotherapy and/or transplantation treatment.
Footnotes
Acknowledgment
The study was supported by funding from National Institutes of Health (NIH RO1 HL56416) to H.E.B.
Author Disclosure Statement
The authors declare no conflict of financial interests.