
Abstract
Human embryo stem cells or adult tissues are excellent models for discovery and characterization of differentiation processes. The aims of regenerative medicine are to define the molecular and physiological mechanisms that govern stem cells and differentiation. Human mesenchymal stem cells (hMSCs) are multipotent adult stem cells that are able to differentiate into a variety of cell types under controlled conditions both in vivo and in vitro, and they have the remarkable ability of self-renewal. hMSCs derived from amniotic fluid and characterized by the expression of Oct-4 and Nanog, typical markers of pluripotent cells, represent an excellent model for studies on stemness. Unfortunately, the limited amount of cells available from each donation and, above all, the limited number of replications do not allow for detailed studies. Here, we report on the immortalization and characterization of novel mesenchymal progenitor (MePR) cell lines from amniotic fluid-derived hMSCs, whose biological properties are similar to primary amniocytes. Our data indicate that MePR cells display the multipotency potential and differentiation rates of hMSCs, thus representing a useful model to study both mechanisms of differentiation and pharmacological approaches to induce selective differentiation. In particular, MePR-2B cells, which carry a bona fide normal karyotype, might be used in basic stem cell research, leading to the development of new approaches for stem cell therapy and tissue engineering.
Introduction
H
Human mesenchymal stem cells (hMSCs) are multipotent stem cells, retaining good self-renewal properties. These cells differentiate in vivo and in vitro into a wide range of tissues, such as neurons, glia, chondrocytes, adipocytes, cardiomiocytes, and osteoblasts. [8 –10]. hMSCs can be isolated from several adult tissues, [including peripheral blood, periosteum, muscle, adipose and connective tissues, skin, bone marrow (BM), brain, etc.], as well as from embryonic appendages such as placenta, umbilical cord blood, and amniotic fluid [11 –14]. hMSCs derived from adult tissues are an important source for the regeneration of damaged tissues and the maintenance of homeostasis in tissues in which they are located (adult stem cells) [7,15 –21]. Although hMSCs display multipotent capability and self-renewal, these cells do not pose major ethical issues when used in research [8 –10,22 –24]. hMSCs include a broad range of cells with different morphology, physiology, and surface expression markers [25 –27]; therefore, sorting and collection of amniotic hMSC sub-populations depends on their ability to attach to a plastic surface. To date, most studies on the molecular mechanism(s) and characterization of hMSCs have been carried out using BM cells. While surface markers from BM are CD44, CD105 (SH2; endoglin), CD106 (vascular cell adhesion molecule; VCAM-1), CD166, CD29, CD73 (SH3 and SH4), CD90 (Thy-1), CD117, STRO-1 e Sca-1 [28 –32], auβ3 and auβ5, LFA-3 and L-selectin [22,29,30,33 –35], other markers, typical of hematopoietic and epidermal cells (CD11b, CD14, CD31, CD33, CD34, CD133, and CD45), are absent [22]. Pittenger et al. showed that only 0.01% to 0.001% of mononuclear cells isolated on density gradient (Ficoll/Percoll) give rise to plastic-adherent fibroblast-like colonies [22,36 –38]. One of the main problems in the use of BM-derived hMSCs is their extremely low concentration. Moreover, the number of hMSCs seems to decrease with age [37] and infirmity [38]. An additional problem is represented by senescence, which occurs after relatively few duplication cycles [40–50 population doubling level (PDL)] [18,19,21].
hMSCs from cord blood, placenta, and amniotic fluid offer a number of advantages compared with adult BM-derived hMSCs: (i) easy availability with lower risk (collection of amniotic fluid is a routine test carried out between the 16th and 18th week of pregnancy, with low risk for the fetus <0.1%) [39]; the umbilical cord and placenta are removed at childbirth after informed consent; (ii) less stringent criteria for donor-recipient HLA matching, allowing the use of umbilical cord blood, placental and amniotic samples for transplants between unrelated or partially compatible patients (the reduced risk is correlated to the lower expression of HLA class II antigens) [40]; (iii) reduced risk of graft-versus-host-disease (GVHD) due to incomplete development of the infant's immune system (and therefore the relative immaturity of T cells), even when donor/recipient compatibility is not perfect [40]; and (iv) low risk of infection, for example caused by CytoMegaloVirus (CMV) (<1% of infants contract the virus in the womb) [41].
Although the growth potential in long-term cultures of hMSCs derived from umbilical cord, placenta, and amniotic fluid is superior to that of BM cells, they are used exclusively for transplantation in pediatric patients due to the limited amount of cells derived from donations [40]. Even a small amount (about 2 mL) of amniotic fluid taken during the second trimester of pregnancy is able to generate typical MSC-expressing markers [22,29,30,33 –35]. Their ability to differentiate into multiple cell lines after cultivation in specific differentiating media has also been demonstrated [42]. Amniocytes deriving from the epithelium, skin, uro-genital apparatus, respiratory and gastrointestinal systems of the fetus have been described in the literature [43 –47]. Early classifications of these cells were mainly based on morphological criteria and are, thus, inadequate. Very limited biochemical data on these cells, their morphology, and growth characteristics exist to classify these human amniotic fluid cells into epithelium cells, amniotic fluid-specific cells, and fibroblastic cells [44,45]. Different origins have been suggested for all three cell types [1,43 –49]. The very recent discovery of the existence of a population of adult stem cells expressing Oct-4 in human amniotic fluid is a promising source of stem cells [50], which can be harvested without the ethical controversies associated with hESCs [4 –6,43 –49]. Finally, amniotic fluid stem cells are not able to form tumors in immune-deficient mice [51 –58], thus increasing their potential use in the treatment of human diseases. Human amniotic fluid stem cells express markers of adult stem cells along with typical markers of ESCs, indicating that these cells might be considered as having some features of both embryonic and adult stem cells. Whether these cells present the advantages of both types of stem cells remains to be established [1,50].
Here, we describe the creation of
Materials and Methods
Cell collection, culture, and infection
Amniotic fluid samples were obtained after informed consent from pregnant women (aged 20–42 years) between the 16th and 18th week of gestation through ultrasound-guided transabdominal puncture. Samples carrying an abnormal karyotype were excluded. Collection of amniotic fluid samples (20 mL) is a routine medical procedure used in prenatal diagnosis (with low risk for the fetus <0.1%) [39], and only 2 mL of amniotic fluid was donated for our experiments.
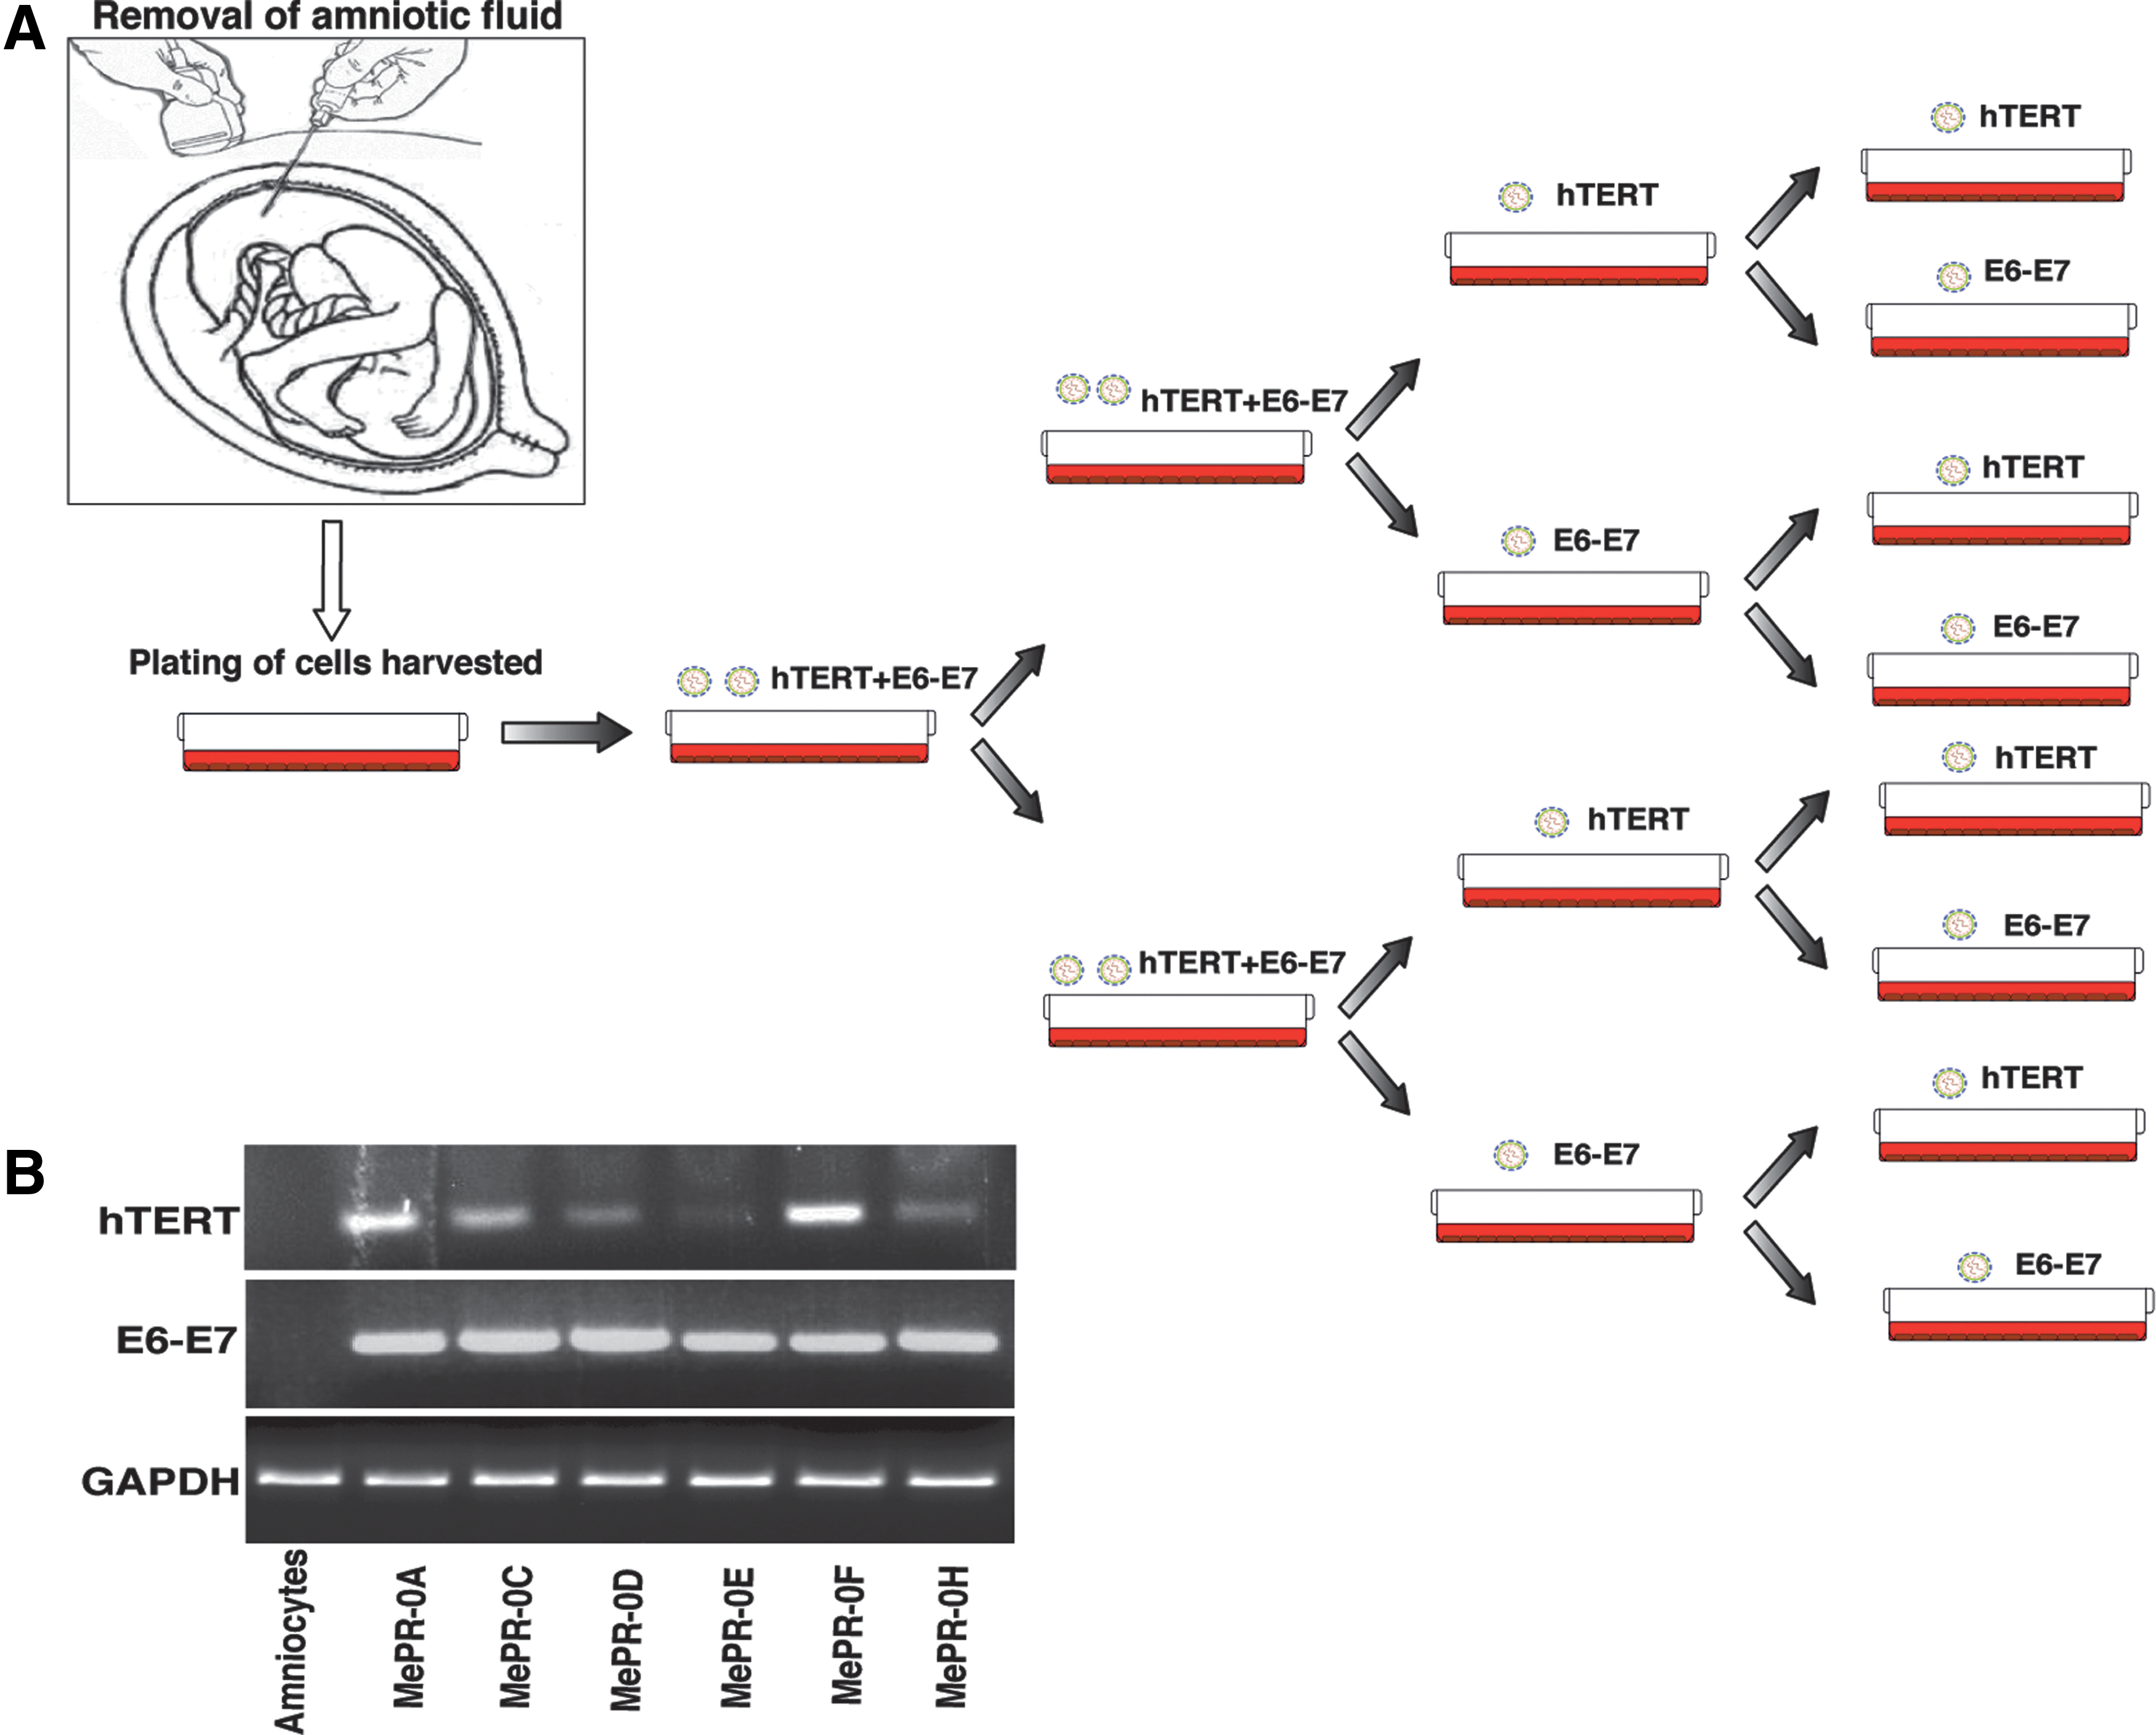
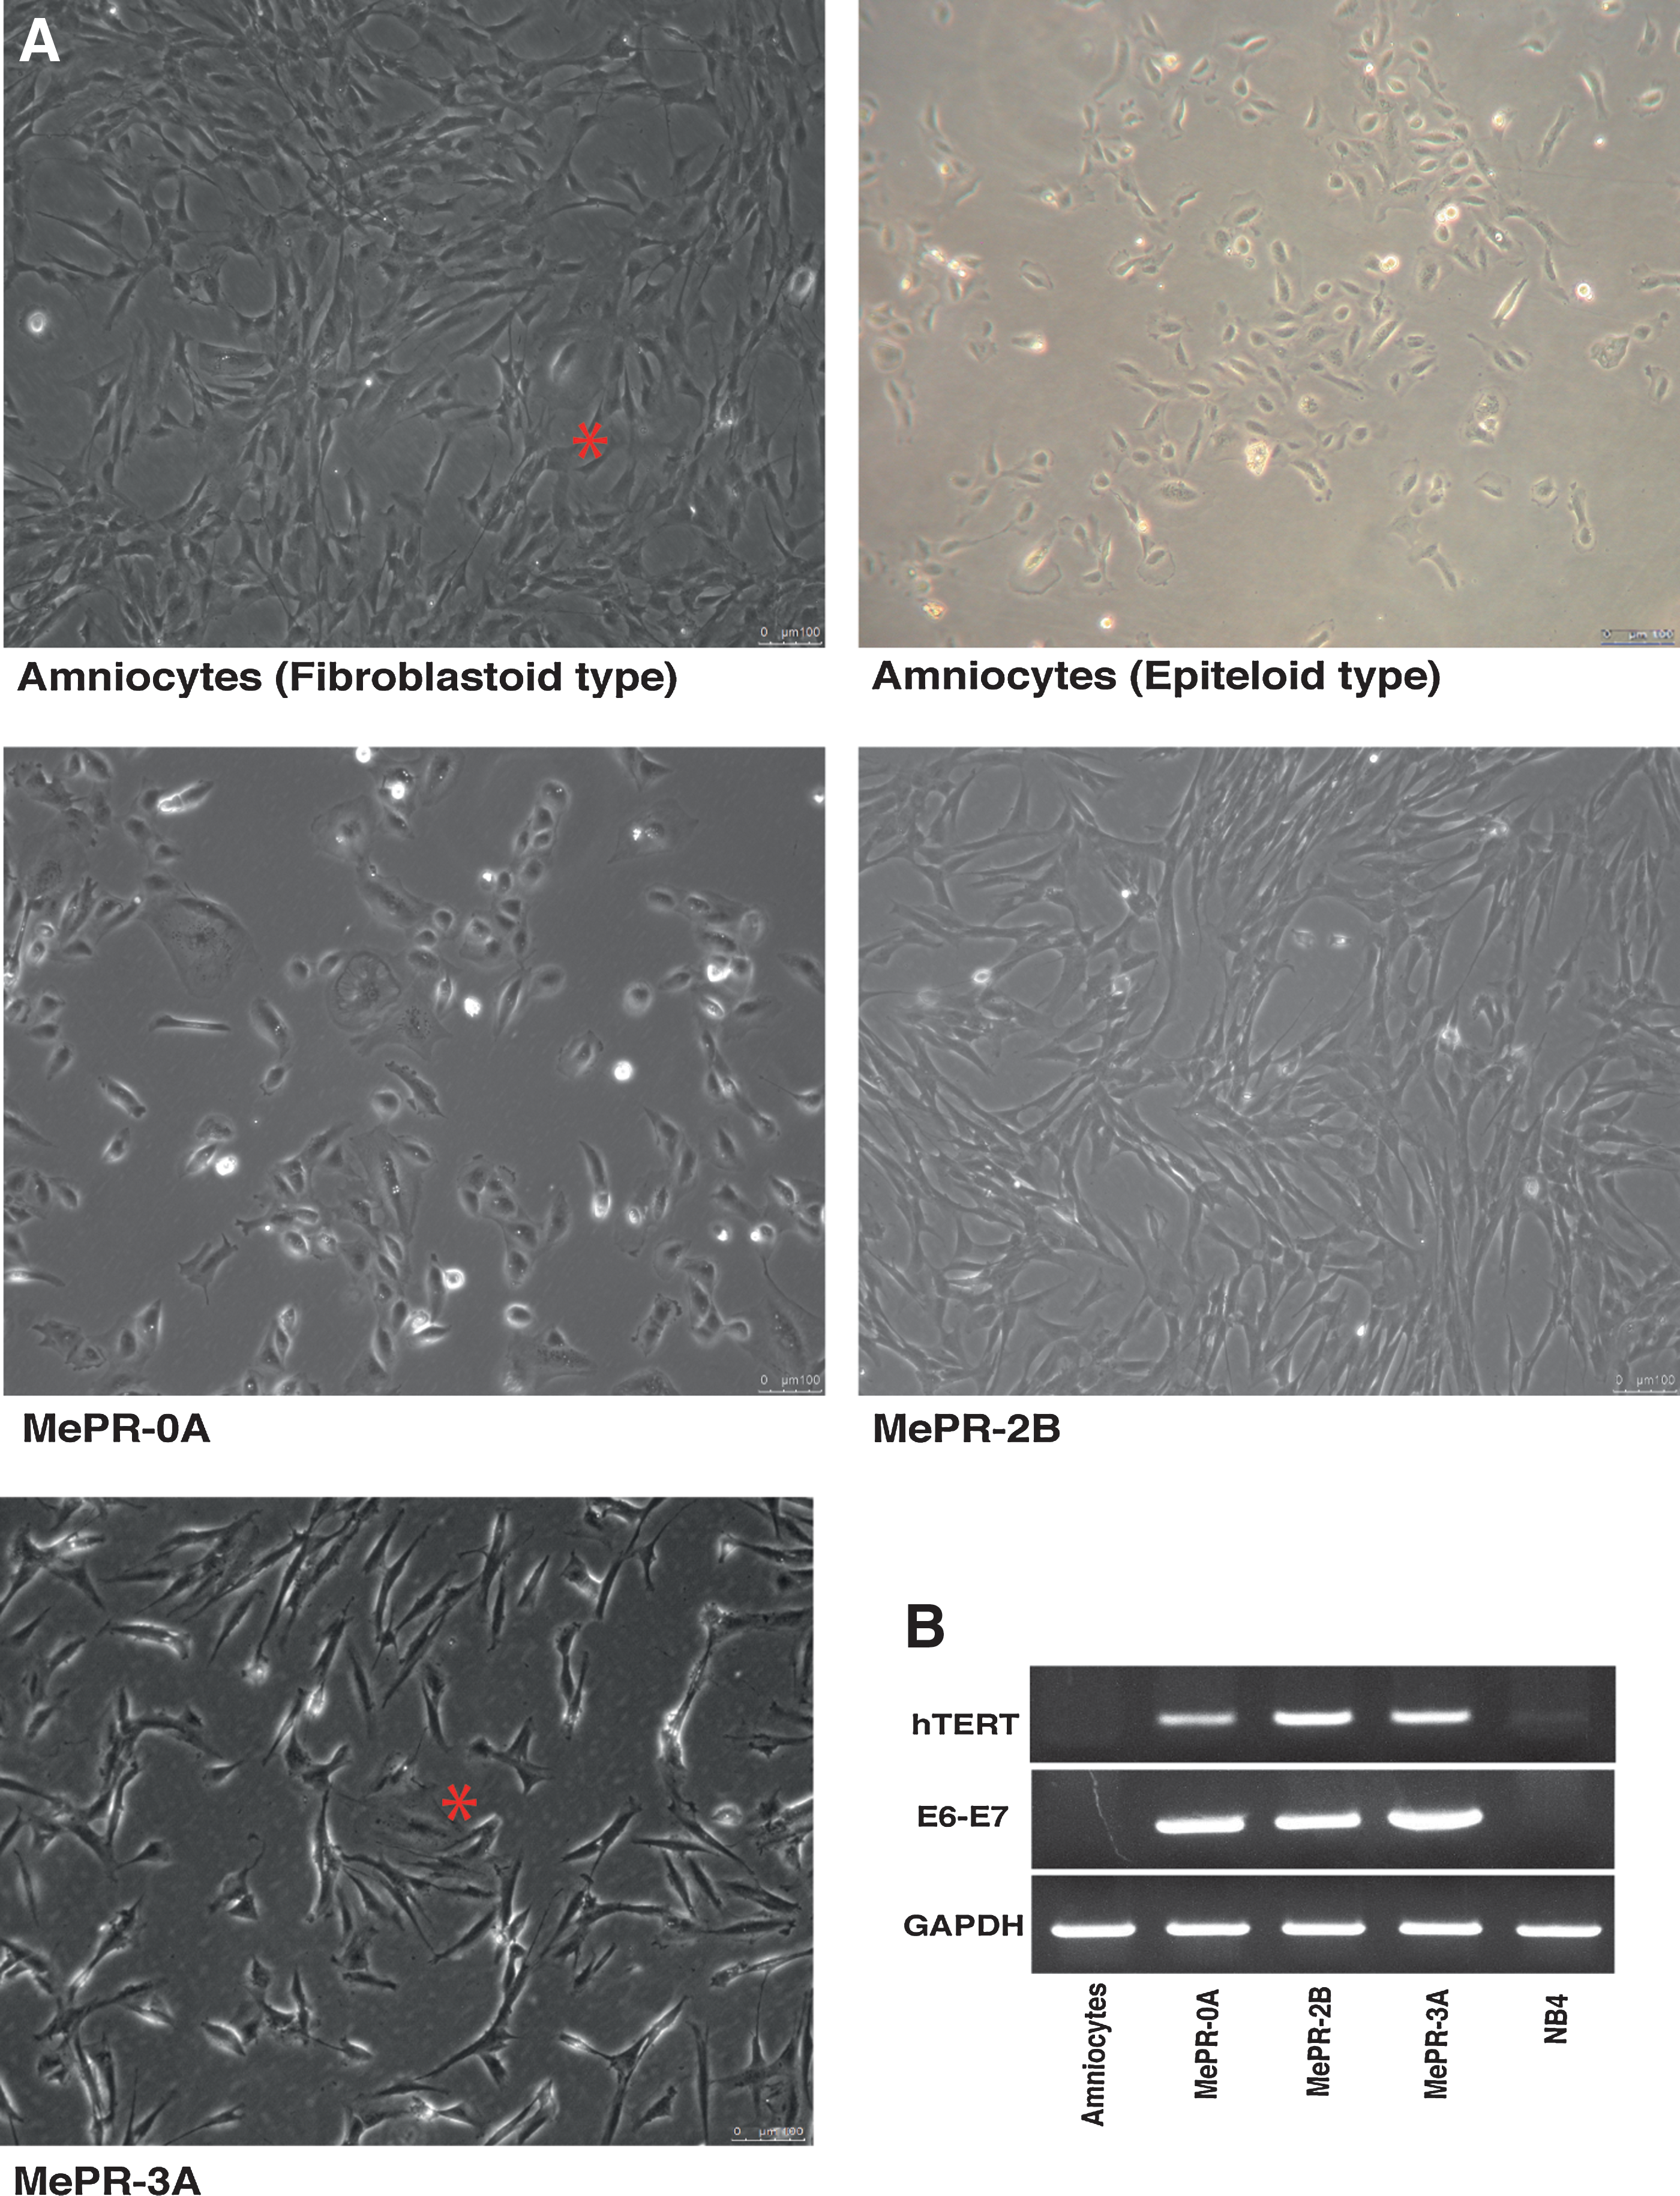
Cells were centrifuged and re-suspended in 7 mL RPMI 1640 medium 4.5 g/L glucose (Euroclone) supplemented with 20% fetal bovine serum (FBS) (Euroclone), 100 U/mL pen-strep (Lonza), 2 mM L-Glutamine (Lonza) at 37°C, and 5% CO2 in a fully humidified atmosphere. Cells were first grown for 10 days until the appearance of colony-forming cells (CFCs). After a first splitting, amniocytes were grown to confluence and co-infected with human papillomavirus type16 genes (HPV16)-E6/E7 and HPV16-human telomerase reverse transcriptase (hTERT) lentiviral vectors (infection #1, Fig. 1A). After a week, the cells were split and infected again (infection #2, Fig. 1A). After a second week, the cells were split and infected again with HPV16-E6/E7 or hTERT (infection #3, Fig. 1A). After a further week, a fourth infection was carried out in the same way as described earlier (infection #4, Fig. 1A). At the end of the multi-infection, eight cell lines were obtained and cultured for 1 month. Samples were observed and photographed with a DMI 6000 inverted microscope (Leica Microsystems) using Leica LAS Image Analysis software (Leica Microsystems) (Fig. 2A).
Collection and “Multi-Infection Program.”
Morphological analysis.
HPV16-E6/E7 and -hTERT lentiviral production
HIV-1-based SIN lentiviral vectors were derived from SINF-MU3-W-S vector backbone [59]. HPV16-E6/E7 was inserted upstream of a gene cassette containing an encephalomyocarditis virus internal ribosome entry site (IRES) and yellow fluorescent protein (YFP) gene into SINF-MU3-W-S to generate SINF-MU3-E6E7-IRES-YFPW-S. SINF-MU3-hTERT-IRES-GFPW-S was generated by inserting hTERT cDNA upstream of a gene cassette containing an IRES and green fluorescent protein (GFP) gene into SINF-MU3-W-S. VSV-G-pseudotyped lentiviral vectors were generated in 150 mm tissue culture dishes by transient co-transfection with (i) 66 μg VSV-G-expressing construct pCMV-VSV-G (Invitrogen); (ii) 48 μg packaging construct pCMVΔR8.2 (Addgene); and (iii) 66 μg lentiviral vector plasmids (pSin hTERT or Psin E6/E7) into sub-confluent HEK 293FT cells (Invitrogen) by calcium phosphate precipitation (Clontech; Calphos Mammalian Transfection Kit) [60]. The supernatant containing the virus was produced in HEK 293FT, collected, filtered, and used to infect primary amniocytes.
Calculation of population doublings
Calculation of population doublings was carried out at each cell passage, assuming exponential growth of cells, according to the following formula [61]:
Nx=N0×2X
X=ln (NX/N0)×(1/0.6931=In2),
where N0 is the number of cells at the time of plating in culture dishes (beginning of growth period), Nx is the number of cells at the time of harvest (end of growth period), and X is the number of population doublings between N0 and Nx. To calculate the population doubling, 200,000 cells were seeded in the dishes (100 mm) (N0). After 1 week, cells were harvested, centrifuged, and re-suspended in 1 mL of medium. Cells were counted using Trypan blue assay (Sigma) (Nx). The procedure was subsequently repeated weekly over a period of 23 weeks, recording the number of population doublings each week.
Cell cycle analysis
Cells were re-suspended in the staining solution containing RNAse A, propidium iodide (50 μg/mL), sodium citrate (0.1%), and NP40 (0.1%) in PBS 1 × for 30 min in the dark. Cell cycle distribution was assessed with an FACScalibur flow cytometer (Becton Dickinson), and 10,000 cells were analyzed by ModFit version 3 Technology (Verity) and Cell Quest (Becton Dickinson) [62].
RNA extraction, RT-PCR, and real-time PCR
Total RNA was extracted using TRIZOL (Life Technologies), and reverse transcription was carried out using SuperScript® VILO™ cDNA Kit (Invitrogen) according to the manufacturer's protocol. Converted cDNA was amplified using AmplyTaq Gold™ (Roche). Amplified DNA fragments were loaded on 1.0% agarose gel and photographed on a Gel Logic 200 Imaging system UV transilluminator (Kodak). Real-Time PCR was performed using iQ™ SYBR® Green Supermix (Bio-Rad) in a DNA Engine Opticon2 thermal cycler (MJ Research Incorporated). Primers for amplification and experimental conditions are shown in Supplementary Tables S1 and S2 (Supplementary Data are available online at
Western blot analysis
Forty micrograms of total protein extract was separated on 10% polyacrylamide gel and blotted as previously described [62]. Western blot of Col2A1 (1:1,000; Santa Cruz) was performed, and extracellular-signal-regulated kinases (1:1,000; Santa Cruz) were used for equal loading.
Differentiation assays
Myogenic differentiation [63,64]
To induce myogenic differentiation, amniocytes (control) and the three cell lines were grown in the following differentiating medium: RPMI 1640 4.5 g/L glucose supplemented with 2% FBS, 10 ng/mL epidermal growth factor, 10 ng/mL Platelet-Derived Growth Factor (PDGF-BB) (both by Peprotech), and 3 μM 5-azacytidine (Sigma). After 24 h of treatment, the myogenic medium was replaced without adding 5-azacytidine. The cells were also cultured in a commercial skeletal muscle cell growth medium (PromoCell). The medium was replaced weekly, and the cultures were observed for the presence of multinucleated cells (myotubes). After 14 days of culture, Real-Time PCR analysis was performed to analyze changes in the expression of myogenic markers (Myogenin; MyoD).
Adipogenic differentiation [63,64]
To induce adipogenic differentiation, amniocytes (control) and the three cell lines were cultured for 2–3 weeks in RPMI 1640 4.5 g/L glucose supplemented with 10% FBS, 0.5 mM isobutyl-methylxanthine, 200 μM indomethacin, 10−6 M dexamethasone, and 10 μg/mL insulin (all by Sigma). The medium was replaced weekly. After 3 weeks of culture, Real-Time PCR analysis was performed to analyze changes in the expression of adipogenic marker PPARγ2, and PLIN2, a marker of lipid accumulation in diverse cell types [65,66].
Osteogenic differentiation [63,64]
Osteogenic differentiation was performed by culturing the cells with RPMI 1640 4.5 g/L glucose supplemented with 10% FBS, 10−8M dexamethasone, 0.2 mM ascorbic acid, and 10 mM ß-glycerol phosphate (all by Sigma) for 2–3 weeks. The medium was replaced weekly. Real-Time PCR analysis was also performed using osteopontin- and osteocalcin-specific primers.
Chondrogenic differentiation [67]
Chondrogenic differentiation was performed by culturing the cells with serum-free RPMI 1640 4.5 g/L glucose supplemented with 10 ng/mL TGF-ß3 (Sigma) for 2 weeks. The medium was replaced weekly. Real-Time PCR analysis was also performed using specific primers (Sox9, Colxa1, and Col2a1).
Neuro-glial differentiation [63,64]
For differentiation of neural cells, amniocytes were incubated with RPMI 1640 supplemented with 20% FBS, 1 mM/l βmercapto-ethanol, and 5 ng/mL bFGF (Sigma) for 24 h, and then treated with serum depletion for 5 h. Immunocytochemical staining and Real-Time PCR were also performed with neuronal-specific marker, βIII Tubulin (TuJ-1); glial marker, GFAP, was used to assess the capacity of neural differentiation.
Detection of neuronal differentiation by immunocytochemical analysis
Cells were grown in Lab Tech tissue culture chamber slides (NalgeNunc International). Ten thousand cells were plated and cultured for 24 h before starting differentiation. Treated and untreated cells (see differentiation methods) were then washed thrice with PBS and fixed with 4% paraformaldehyde (PFA) in PBS 1 × at room temperature for 30 min. After washing, cells were incubated with 10% Normal Goat Serum in 0.1% Triton X-100/1 × PBS for 15 min at room temperature. The samples were incubated with primary antibody (mouse anti-βIII-tubulin 1:400 (Sigma-Aldrich), and Rabbit anti-GFAP (Dako; Glostrup), 1:300) in 10% Normal Goat Serum/1 × PBS for 1 h at room temperature. Fluorophore-conjugated secondary antibodies were used for visualization: 1:400 DyLightTM 488-conjucated (Green) AffiniPure Goat Anti-Mouse IgG (Jackson ImmunoResearch) and 1:400 DyLightTM 594-conjucated (Red) AffiniPure Goat Anti-Rabbit IgG (Jackson ImmunoResearch), in 10% Normal Goat Serum/1 × PBS for 30 min at room temperature in the dark. Cells were then incubated with Hoechst 33342 (Thermo Scientific) 1 μg/mL in 1 × PBS for 5 min at room temperature. After washing, PBS residuals were carefully removed. Cells were observed and photographed with a DM 6000/B Upright microscope (Leica Microsystem) using Leica LAS Image Analysis software (Leica Microsystem) (Fig. 8A).
Cell staining
Staining experiments were performed after differentiation (adipogenic, osteogenic, and chondrogenic) to detect accumulation of the final products characteristic of differentiation. Ten thousand cells per well were plated and cultured in Lab Tech tissue culture chamber slides (Nalge Nunc International).
Adipocyte detection (intracellular lipid vesicles)
Oil Red O (0.3%) was dissolved in isopropanol and stored in the dark. Cells were washed with PBS, fixed with PFA (4%), and incubated at room temperature for at least 30 min. Three parts of the Oil Red O stock solution were diluted with two parts of distilled water, and the mixture was filtered with a syringe filter. The fixation buffer was removed, and the cell monolayer was washed. After removing water, the cell monolayer was covered with 60% isopropanol and incubated at room temperature for 5 min. Isopropanol was removed, and the cell monolayer was covered with Oil Red O staining solution and incubated at room temperature for 15 min. The cell monolayer was then washed several times until the water became clear.
Osteoblast detection (calcium deposits)
2g Alizarin Red S was dissolved in 100 mL of distilled water, and 0.1% NH4OH was added until pH was between 4.1 and 4.3. The solution was filtered and stored in the dark. Cells were washed with PBS, fixed with PFA (4%), and incubated at room temperature for at least 30 min. The fixation buffer was removed, and the cell monolayer was washed. Next, the cellular monolayer was covered with Alizarin Red S staining solution and incubated at room temperature in the dark for 45 min. Later, the cells were washed four times with distilled water and once with PBS.
Chondroblast detection (extracellular matrix)
Sixty mL ethanol (98%–100%) was mixed with 40 mL acetic acid (98%–100%). 10 mg Alcian blue 8 GX was dissolved in this solution. 120 mL ethanol was mixed with 80 mL acetic acid to obtain the destaining solution. The chamber slides were washed twice with PBS 1 ×, covered with PFA (4%), and incubated at room temperature for 60 min. PFA was aspirated, and the cells were washed twice. The Alcian staining solution was added to cover the cells. Chamber slides were incubated overnight at room temperature in the dark. Alcian staining solution was removed, and the cells were washed with the destaining solution for 20 min. The washing step was repeated twice. The destaining solution was removed, and PBS was added. Cells were observed and photographed with a DM 6000/B Upright microscope (Leica Microsystem) using Leica LAS Image Analysis software (Leica-Microsystem).
Measurement of chromosome number and aberrations
Cells were prepared from exponentially growing cells at 80 PDL. Chromosomal analysis was performed according to standard methods [68]. Chromosomes were counted and examined through a Nikon Eclipse-1000 epi-fluorescent microscope (Nikon Instruments), equipped with Genikon System V.3.8.5. (Nikon). To examine statistically significant chromosome numbers, ±1 deviation was allowed and 50–100 metaphase spreads were scored for each assay.
CGH array
Molecular karyotyping was performed using a 4X180K Agilent microarray. Genomic DNA was extracted according to the manufacturer's protocol. Labeling, hybridization, and postwashing were performed according to the manufacturer's specifications (Agilent Oligonucleotide Array-Based CGH for Genomic DNA Analysis protocol, version 6.1; Agilent Technologies). Array slides were analyzed with an Agilent G2505 scanner. Scanned image analysis was carried out with Feature Extraction software (version 10.5.1.1; Agilent Technologies). For identifying duplications and deletions, the standard set-up of the Aberration Detection Method 2 (ADM-2) algorithm for the data that passed quality control metrics testing was used. All copy number changes observed were compared with copy number variants reported in previous studies of normal populations documented on the Database of Genomic Variants.
Trascriptome analysis
RNA concentration and integrity were determined by NanoDrop spectrophotometer (Nanodrop Technologies), Agilent 2100 Bioanalyzer (RNA 6000 Nano Chip kit Agilent), and agarose gel electrophoresis. Gene expression profiles were analyzed by Whole Human Genome Two-Color Microarray (Agilent Technologies no. G4112F), following the manufacturer's protocol.
Gene expression microarray data processing
Microarray quality control reports generated by Agilent Feature Extraction software were used to detect hybridization artifacts. Probe-level raw intensity was processed using R/BioConductor [69] and Limma package [70]. Background correction was performed using normexp Limma method, and data normalization was carried out in two steps: loess normalization within array to correct systematic dye bias and quantile normalization between arrays to detect systematic nonbiological bias. Ratios representing the relative target mRNA intensities compared with control RNA probe signals were derived from normalized data. In order to detect the statistical significance of differential expression among the four different cell types, a one-way ANOVA and Tukey multiple comparison test as Post-ANOVA was performed. For each P value, the Benjamini–Hochberg procedure was used to calculate the false discovery rate (FDR) in order to avoid the problem of multiple testing [71]. The selected gene lists were obtained using the following thresholds: FDR<0.01 and abs(ratio)>2. The relative abundance of GeneOntology Biological Process (BP) terms in each of the selected lists was analyzed using the Database for Annotation, Visualization, and Integrated Discovery (DAVID) Functional Annotation Clustering tool [72].
Results
Immortalization of MePR cells
hESCs escape cellular senescence through the expression of hTERT [73 –77]. The ectopic expression of hTERT has been reported to extend the life span of hMSCs and progenitor cells of human neurons [76,77]. The use of hTERT alone is not sufficient to immortalize hMSCs, but requires the combinatorial expression of HPV16 E6 and E7 [17], which accelerate the degradation of p53 and pRb, respectively [78]. E7 is also able to bind and inactivate the cyclin-dependent kinase inhibitors p21 and p27 [79]. After morphological selection, the three cell populations (MePR-3, MePR-2, and MePR-0) were infected with HPV16-E6/E7 and hTERT, using lentiviral vectors expressing pSin hTERT and pSin E6/E7 [80].
To overcome the difficulties in infecting human amniotic cells [81], we developed a “Multi-Infection Program” as outlined in Fig. 1A. This approach was applied to all MePR cell types. At the end of the procedure, some clones died, while others survived in all cell lines. In MePR-0A cells, for example, eight clones were obtained, but only six survived and were tested for the presence of hTERT and E6–E7 transcripts (Fig. 1B). Based on semi-quantitative PCR data, we chose a clone having a high level of hTERT transcript, as E6/E7 expression level is always similar (Fig. 1B). The procedure was repeated twice to obtain MePR-2B and MePR-3A cells (Fig. 2B). NB4 acute promyelocytic leukemia cells were added as a positive control for the expression of hTERT (Fig. 2B).
Identification of MePR-0, MePR-2, and MePR-3 as epithelial and fibroblastic cell lines
During our studies, a much lower number of cuboidal cells in primary fibroblastic amniotic culture (Fig. 2A top left) was observed. These cells are completely different in terms of morphology. Fibroblastic cells account for more than 99% of cell populations, displaying a fusiform shape similar to small fibroblasts (type I or fibroblastic). Less than 1% of cell populations is made up of cuboidal cells having a more abundant cytoplasm and an epithelial cuboidal shape (Fig. 2A top left asterisk). From primary amniocytes (Fig 2A top left and right), we obtained three cell lines after infection: epithelial-type (MePR-0A) (Fig. 2A middle left) and fibroblastic-type (MePR-2B and MePR-3A) (Fig. 2A middle right and bottom left, respectively). While in MePR-3A cells (Fig. 2A bottom left) both morphologies (fibroblastic/epithelial) are detectable, in MePR-2B, clone epithelial-like cells are absent (Fig. 2A middle right).
Cell cycle and population doubling analysis of MePR cells
To assess whether the three immortalized cell lines were able to grow indefinitely without activation of senescence pathways, we calculated the population doubling at each passage [61]. While the primary cells stopped growing after the tenth week of culture (10 duplications), the three MePR cell lines replicated for an extended period, with a constant doubling time (Fig. 3A). The lower duplication number (about 10 duplications) compared with the 40–50 duplications reported in the literature [18,19,21] is due to the limited number of CFCs derived from the samples.

As shown in Fig. 3A, MePR-2B cells duplicated faster with an index of duplication nearly twice that of MePR-0A. MePR-3A cells displayed an intermediate growth index. As expected, primary amniocytes were slower to duplicate than MePR cell lines.
When the cell cycle was assessed in the three MePR cell lines, the percentage of G1, S, and G2 phases did not undergo major changes at the various passages, unlike primary amniocytes in which G1 phase progressively increased approximately 100% at the tenth week (Fig. 3B). Thus, MePR cell lines are able to duplicate in culture for an extended period.
MePR karyotype analysis through G-banding and CGH array
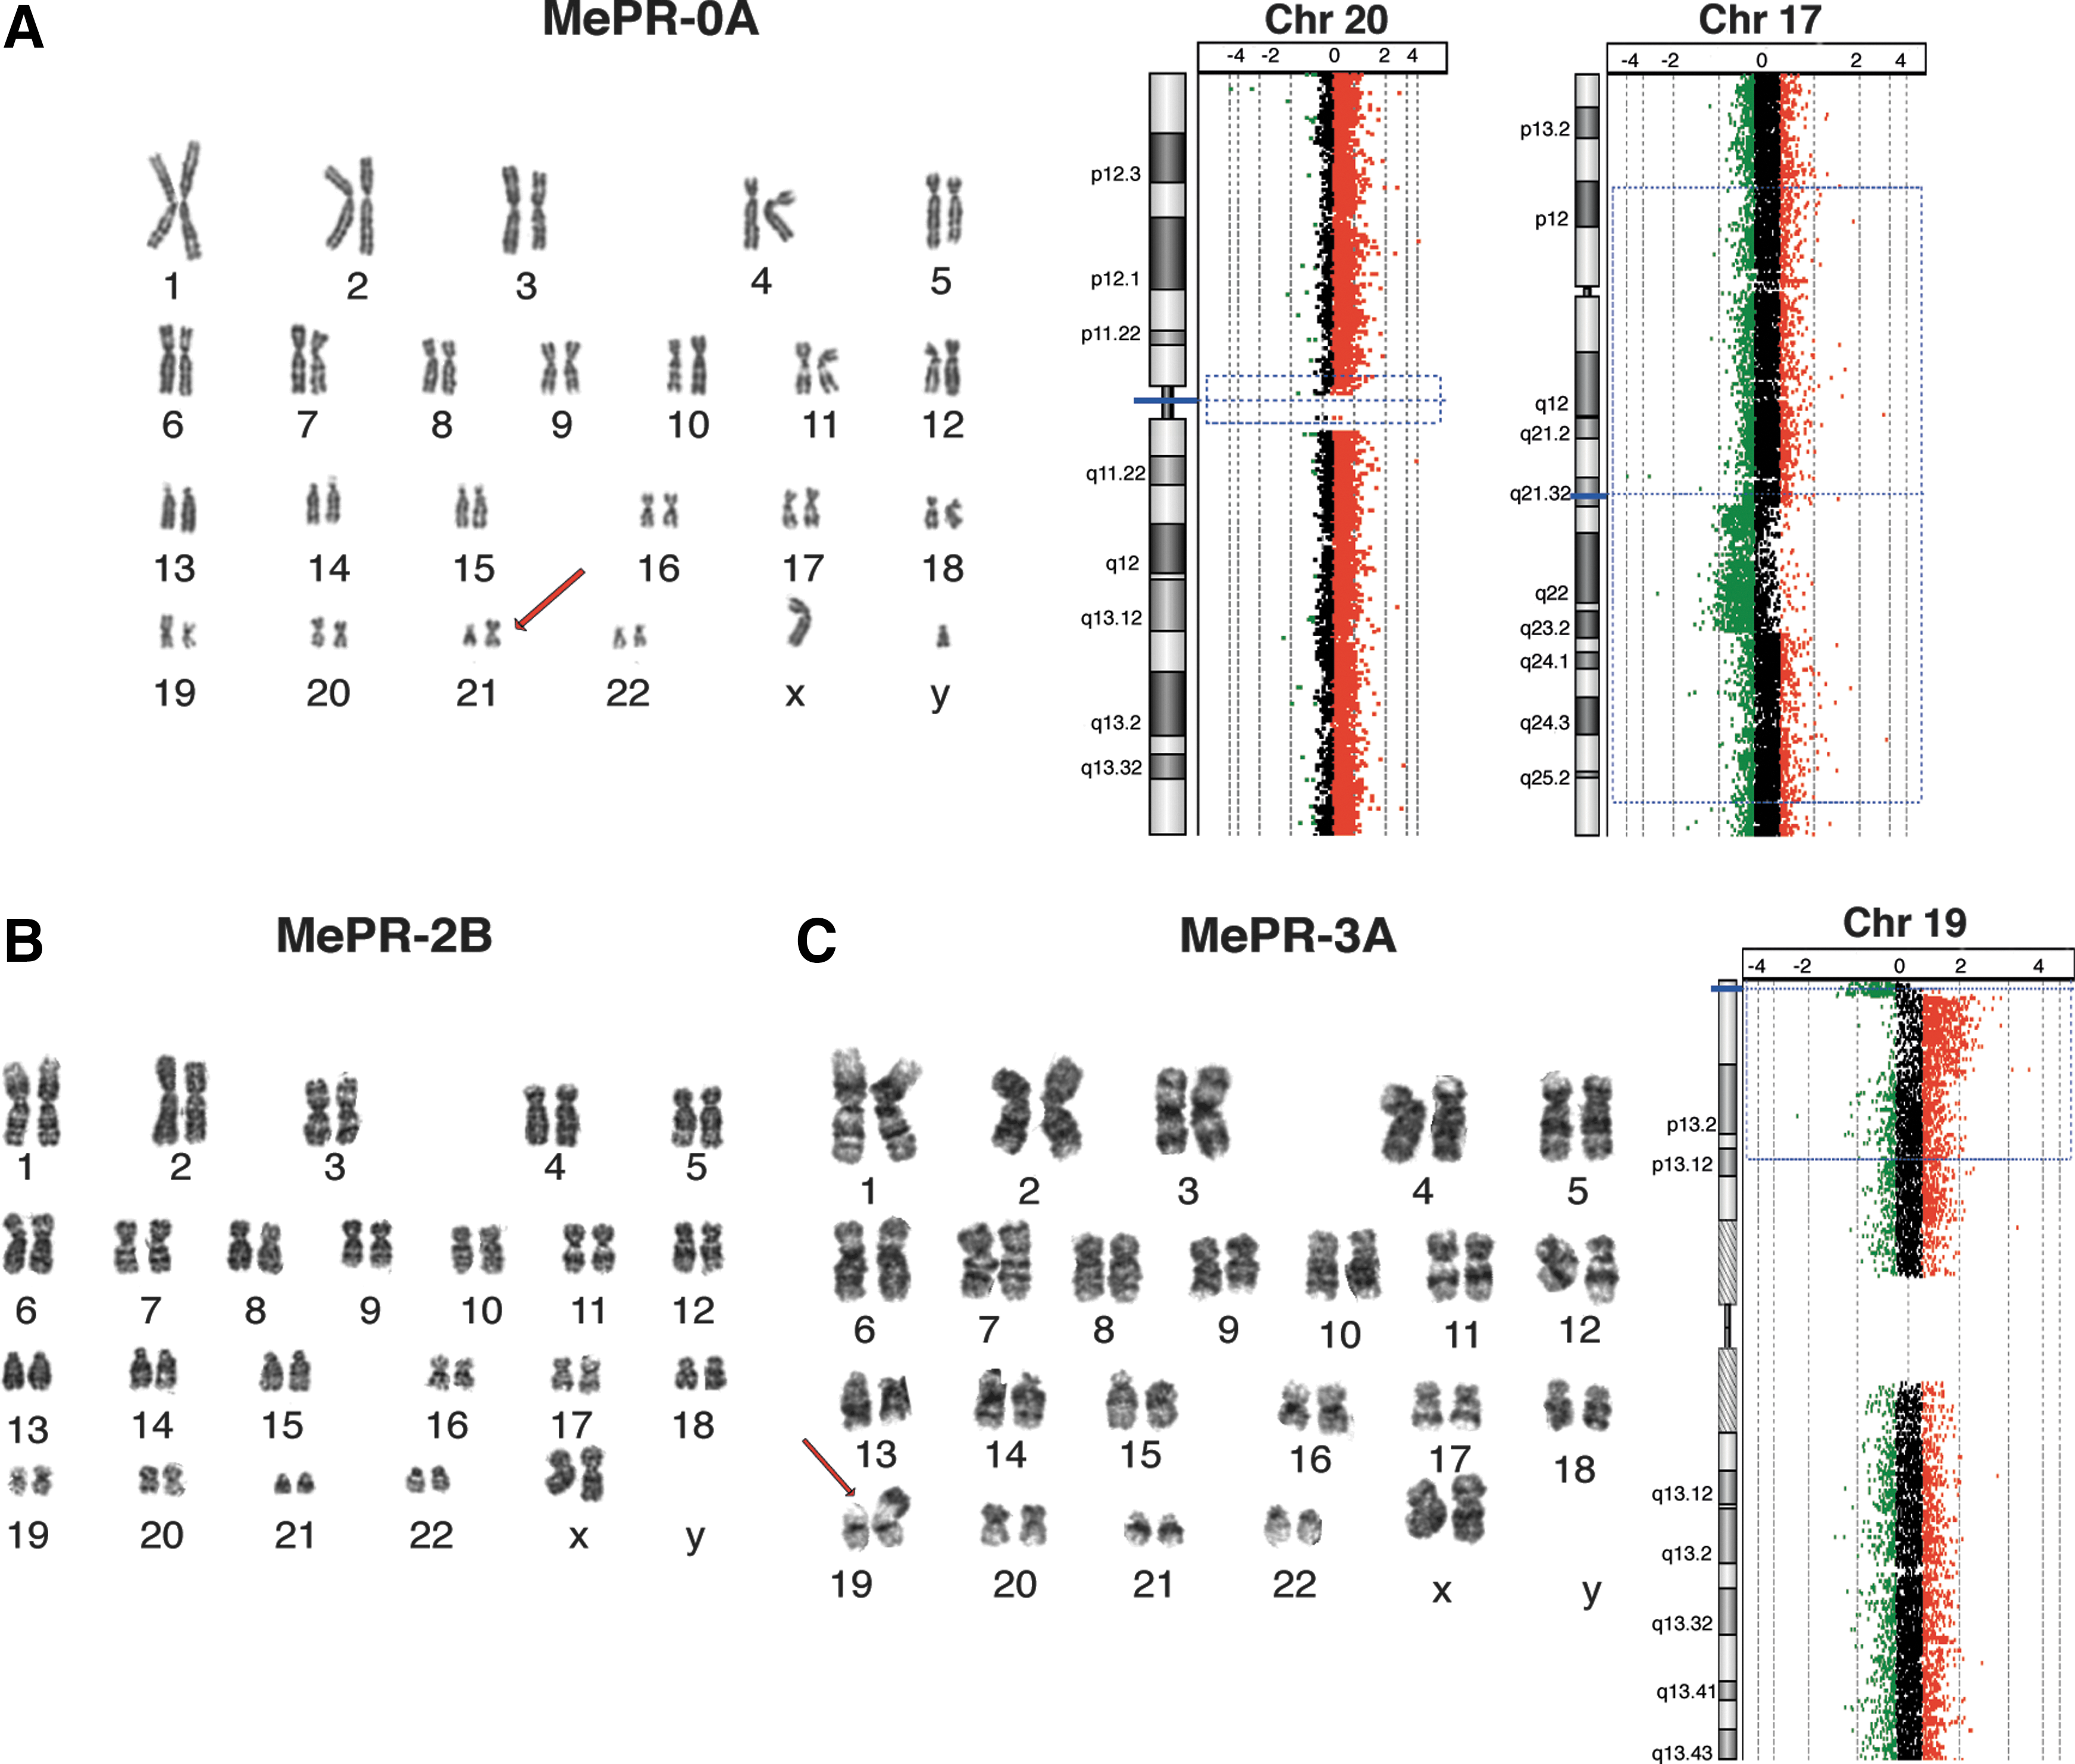
The immortalization of cultured cells frequently induces an abnormal number of chromosomes (aneuploidy) or chromosome aberrations [78,82,83], especially in long-term cell cultures. MePR-0A, MePR-2B, and MePR-3A cells were, therefore, analyzed for their chromosomal content and stability. None of the MePR cell lines observed in a PDL of 80 duplications (excluding the number of duplications before immortalization) displayed changes in chromosome number. In particular, G-banding showed that MePR-2B cell line has a normal karyotype (Fig. 4B). In contrast, MePR-3A displayed 100% metaphases carrying karyotype 46, XX, add [19] (p13.3) (Fig. 4C, see arrow). One chromosomal aberration was detected in MePR-0A: 100% of the cells carried karyotype 46, XY, add [21], (Fig. 4A, see arrow). Comparative Genomic Hybridization (CGH Array) showed results similar to those obtained with G-banding. While MePR-2B did not display chromosomal abnormalities (Supplementary Fig. S1), MePR-3A cells carried a deletion in the short arm telomeric region of chromosome 19 and duplication in the sub-telomeric region of the same chromosome (p13.3-p.13.2) (Fig. 4C). MePR-0A showed a duplication of the full chromosome 20 (about 4,000 duplicated probes) (Fig. 4A), suggesting that the whole duplicated chromosome 20 is translocated on chromosome 21. A deletion of the short arm telomeric region of chromosome 17 (q21.3–q23.2) of about 13 Mb (797 deleted probes) (not shown in the G-banging experiment, Fig. 4A) was also detected.
Chromosomal analysis. G-banding and CGH array experiments:
Gene expression patterns in MePR cell lines
To determine whether immortalization of MePR cells altered their gene expression profile, we generated an array profile of each of the three MePR cell lines and compared them with the gene expression profile of primary amniocytes [78,82,83], using Agilent Chip Two-color MicroArray-Based Gene Expression Analysis. Patterson correlation was used on normalized data for each of the three MePR cell lines (Fig. 5A). The correlation was similar for both MePR-2B (0.80) and MePR-3A (0.81), but was lower for MePR-0A (0.55) (Fig. 5A).

Gene expression patterns.
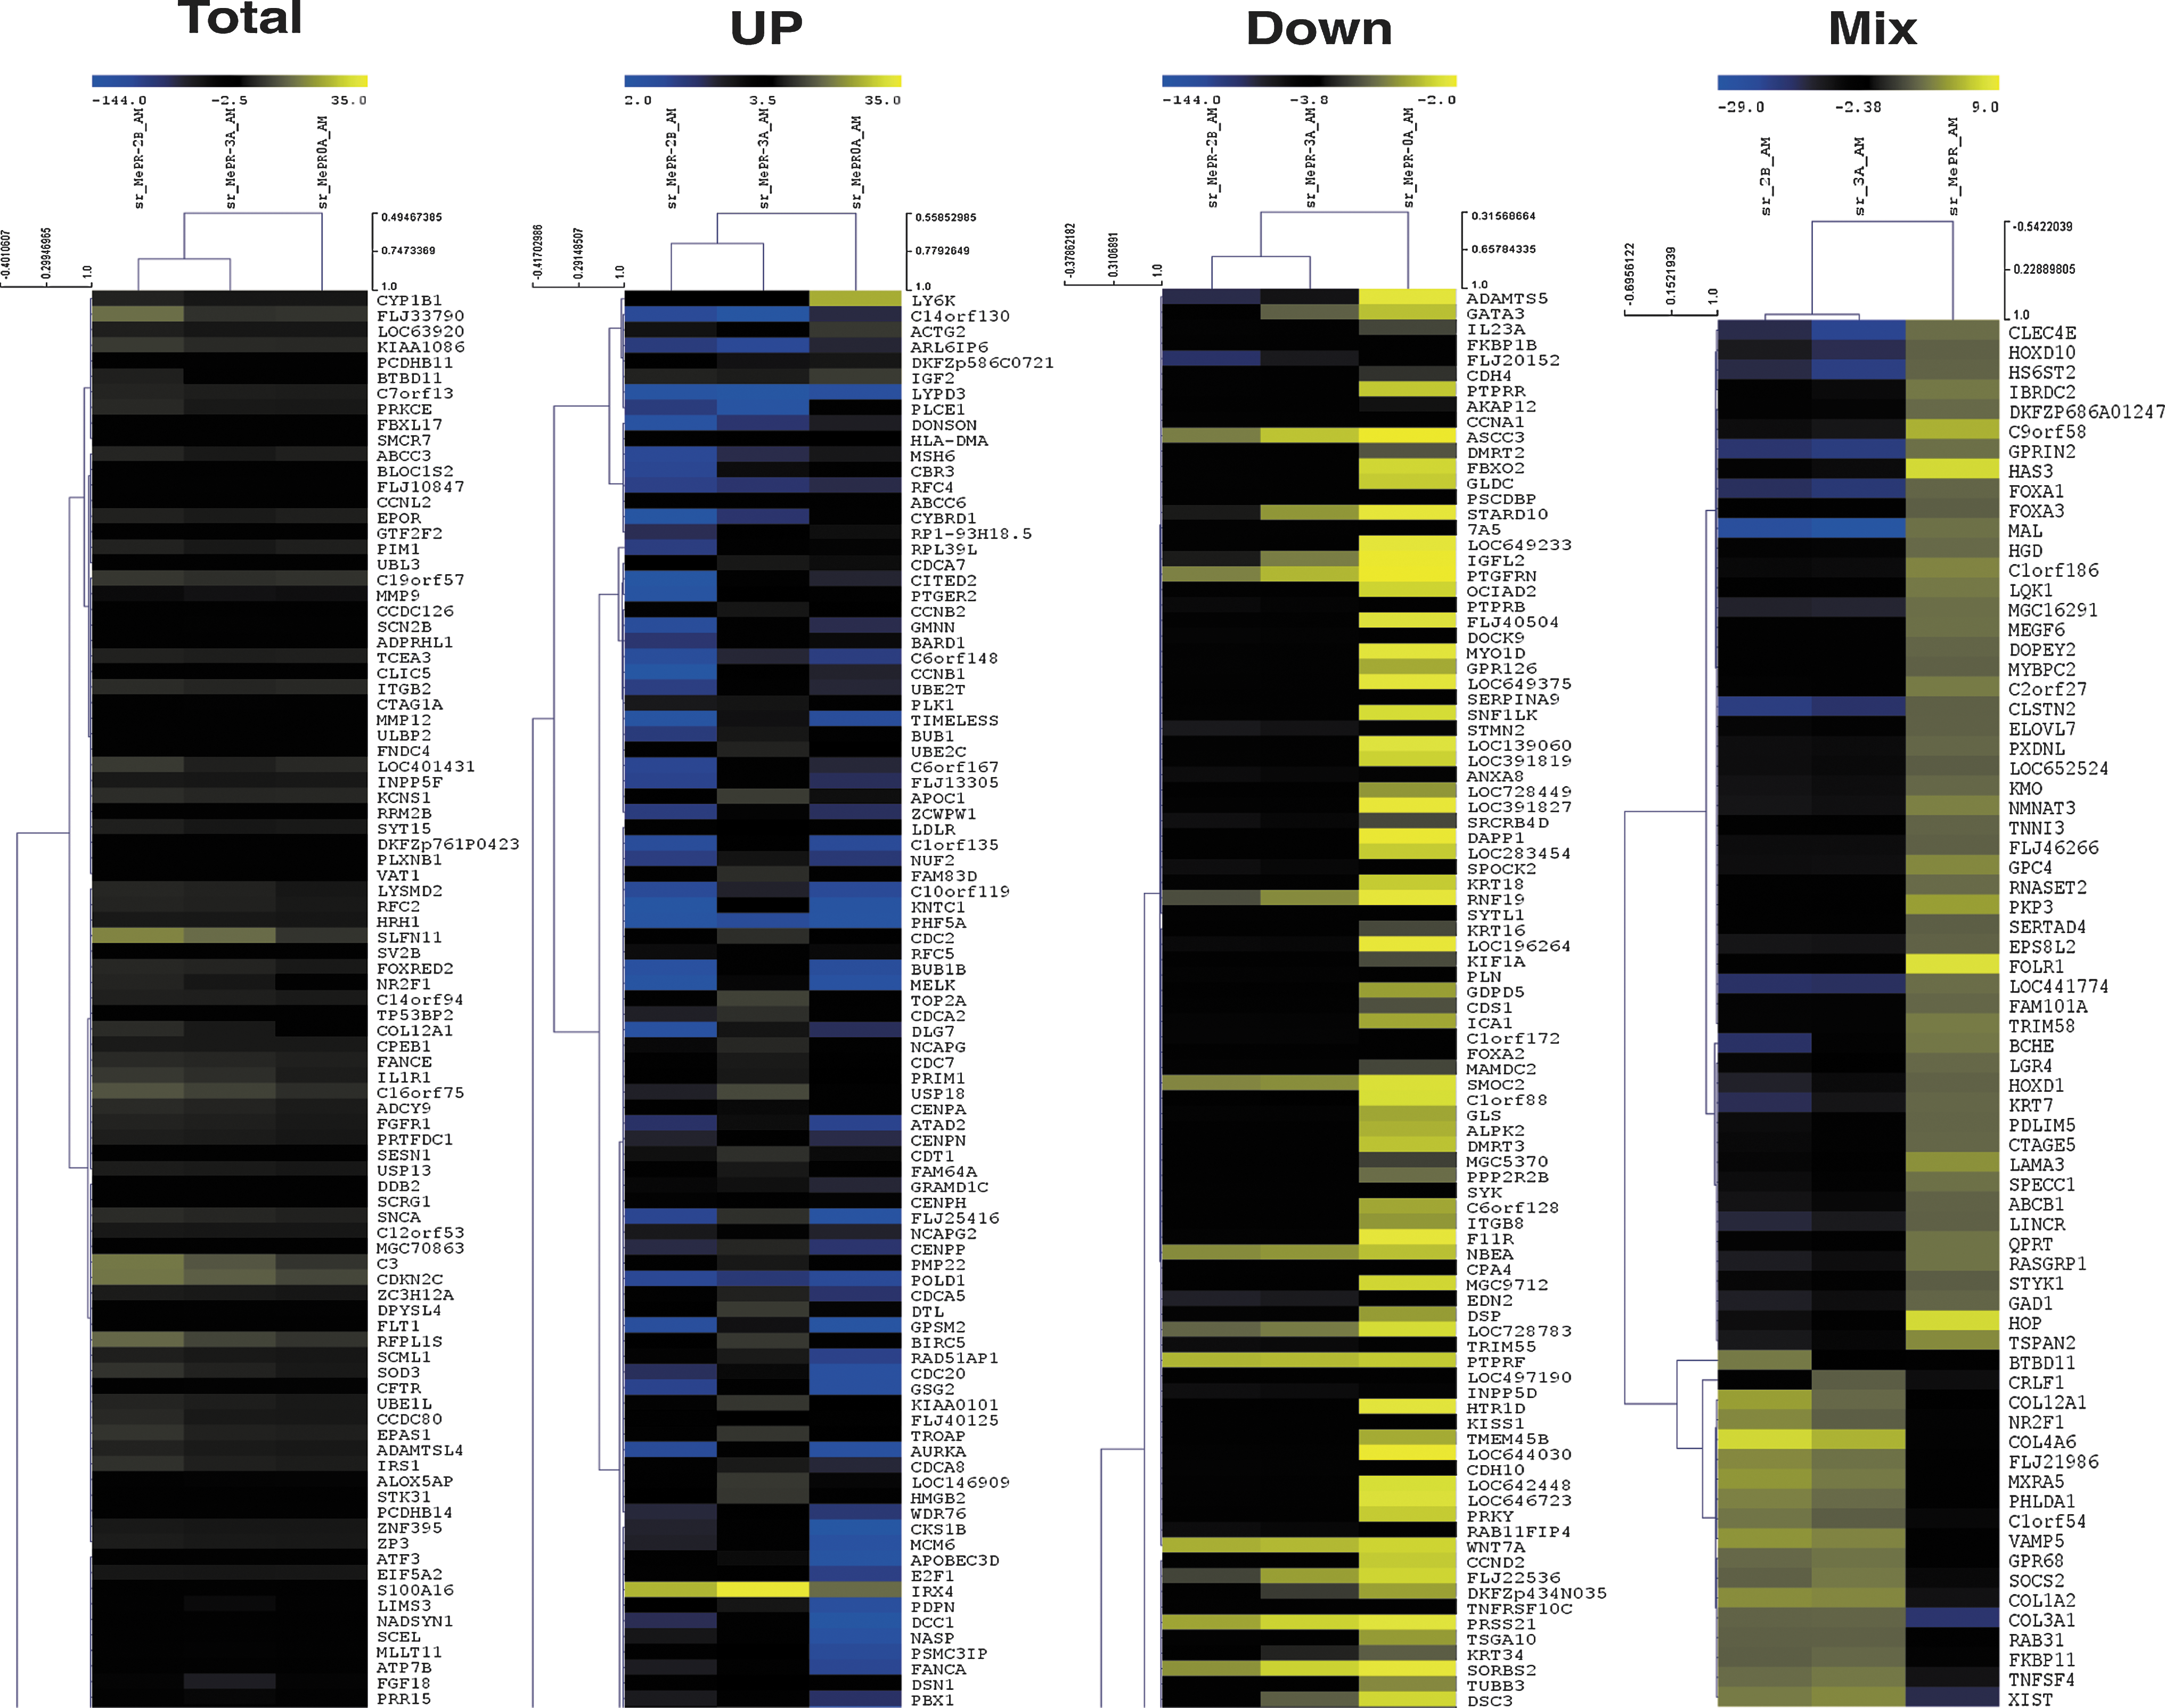
By applying a fold change of Log2 ±2 to 41,000 genes, derived from array experiments, 1,000 genes are regulated (up-down regulated) in all three immortalized cell lines (Supplementary Table S3). Of these genes, 804 are common to all three MePR cell lines (234 up-regulated, 487 down-regulated) (Fig. 5C), while 83 genes belong to the so-called list of mixed genes, common to only two of the three MePR cell lines (Supplementary Table S4). Gene Ontology analysis of the 804 genes led to the identification of 12 clusters (divided into subgroups) (Fig. 5B and Supplementary Table S5). Only two clusters were statistically significant with 9.11×10⁻¹⁷ P value for cell cycle and 3.54×10⁻¹⁰ P value for multicellular organismal development (Supplementary Table S5). The free MeV platform (Multiple Array Viewer) was used to obtain hierarchical clustering of the three MePR cell lines compared with primary amniocytes. When heat maps were generated, MePR-2B genes always cluster with MePR-3A. Conversely, MePR-0A forms a separate cluster (Fig. 6). These data have been deposited in NCBI's Gene Expression Omnibus (GEO) [84] and are accessible through GEO Series accession number GSE37615 (
Hierarchical clustering. Hierarchical cluster of MePR cell lines compared with primary amniocytes, using the MEV platform. Color images available online at
Differentiative potential of MePR cell lines
To investigate whether the MePR cell lines retain multipotency, we assessed the differentiation potential for the two germ layers: mesoderm and ectoderm. MePR cells were induced to form myocytes, osteocytes, chondrocytes, and adipocytes (mesoderm) as well as neural cells (ectoderm).
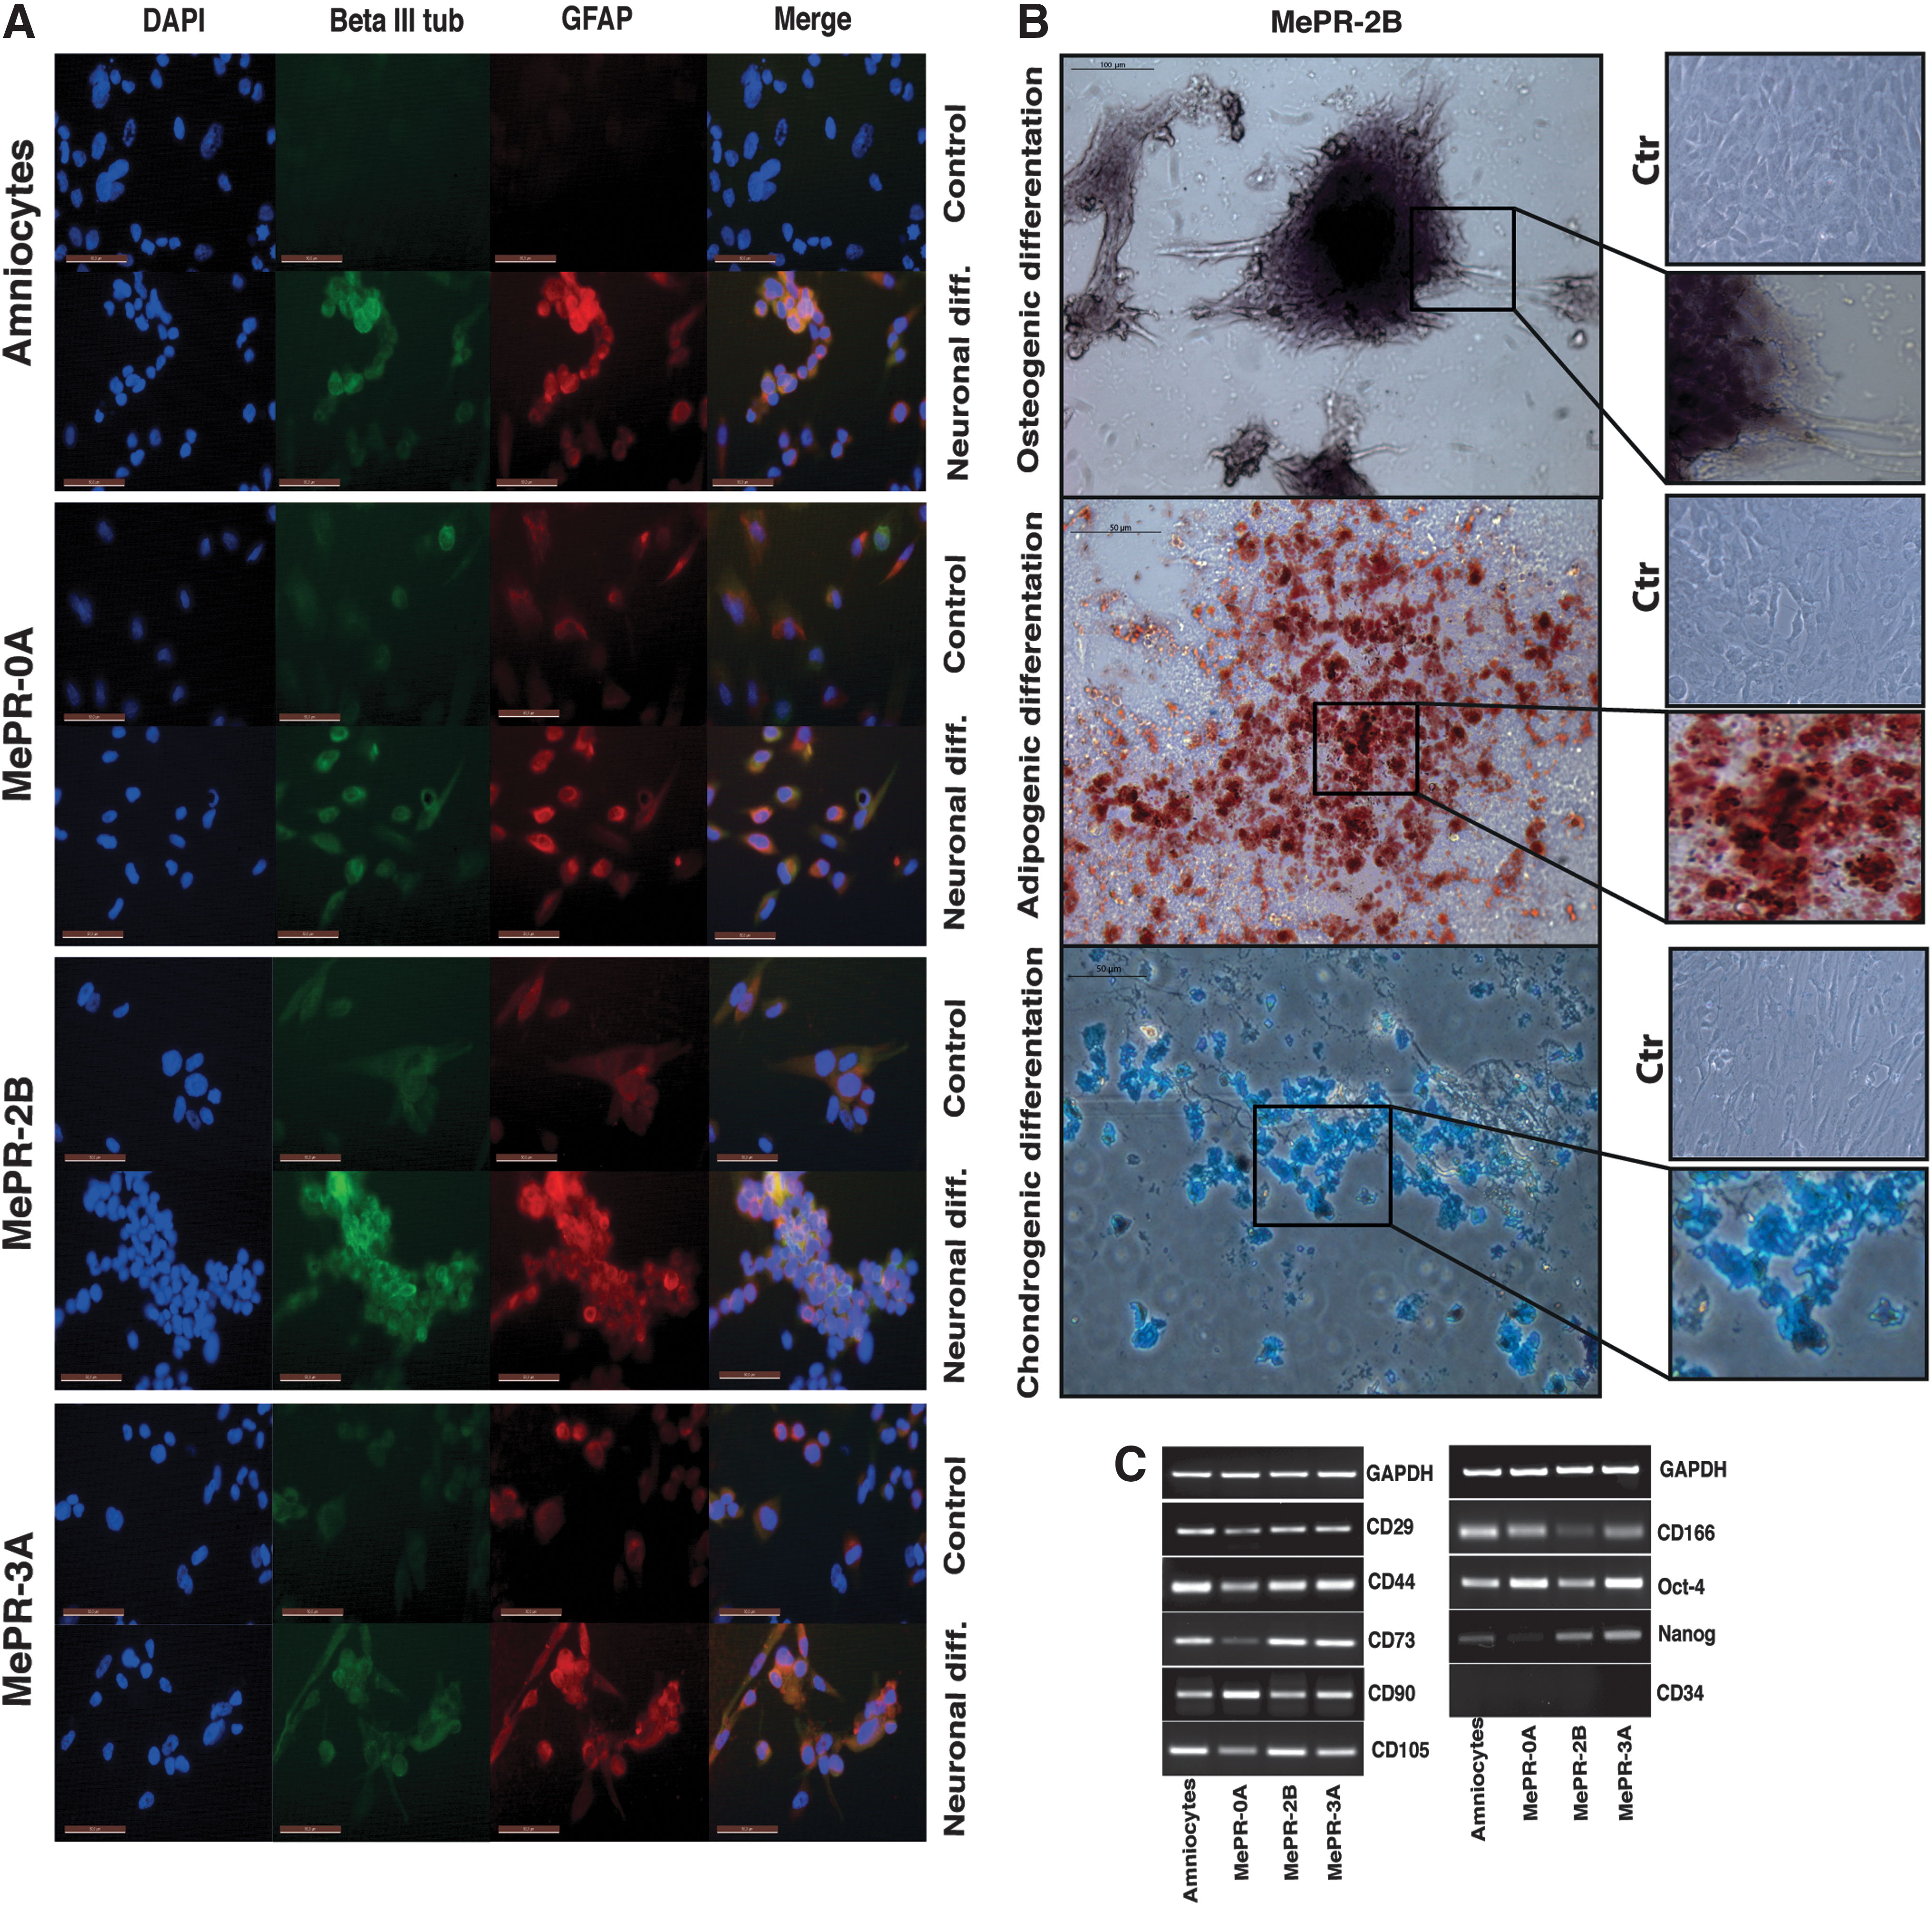
To assess neural differentiation, MePR cells were incubated in differentiation medium [63,64]. Primary amniocytes were used as a control. Real-Time PCR and immunohistochemical assays for βIII Tubulin (neuronal marker) and GFAP (glial marker) [52,63] were used to analyze differentiation. In these settings, all three MePR cell lines were able to differentiate into neural fate, with a clear increase in the expression of βIII Tubulin and GFAP, which is consistent with the modulation observed in primary amniocytes (Figs. 7 and 8A).
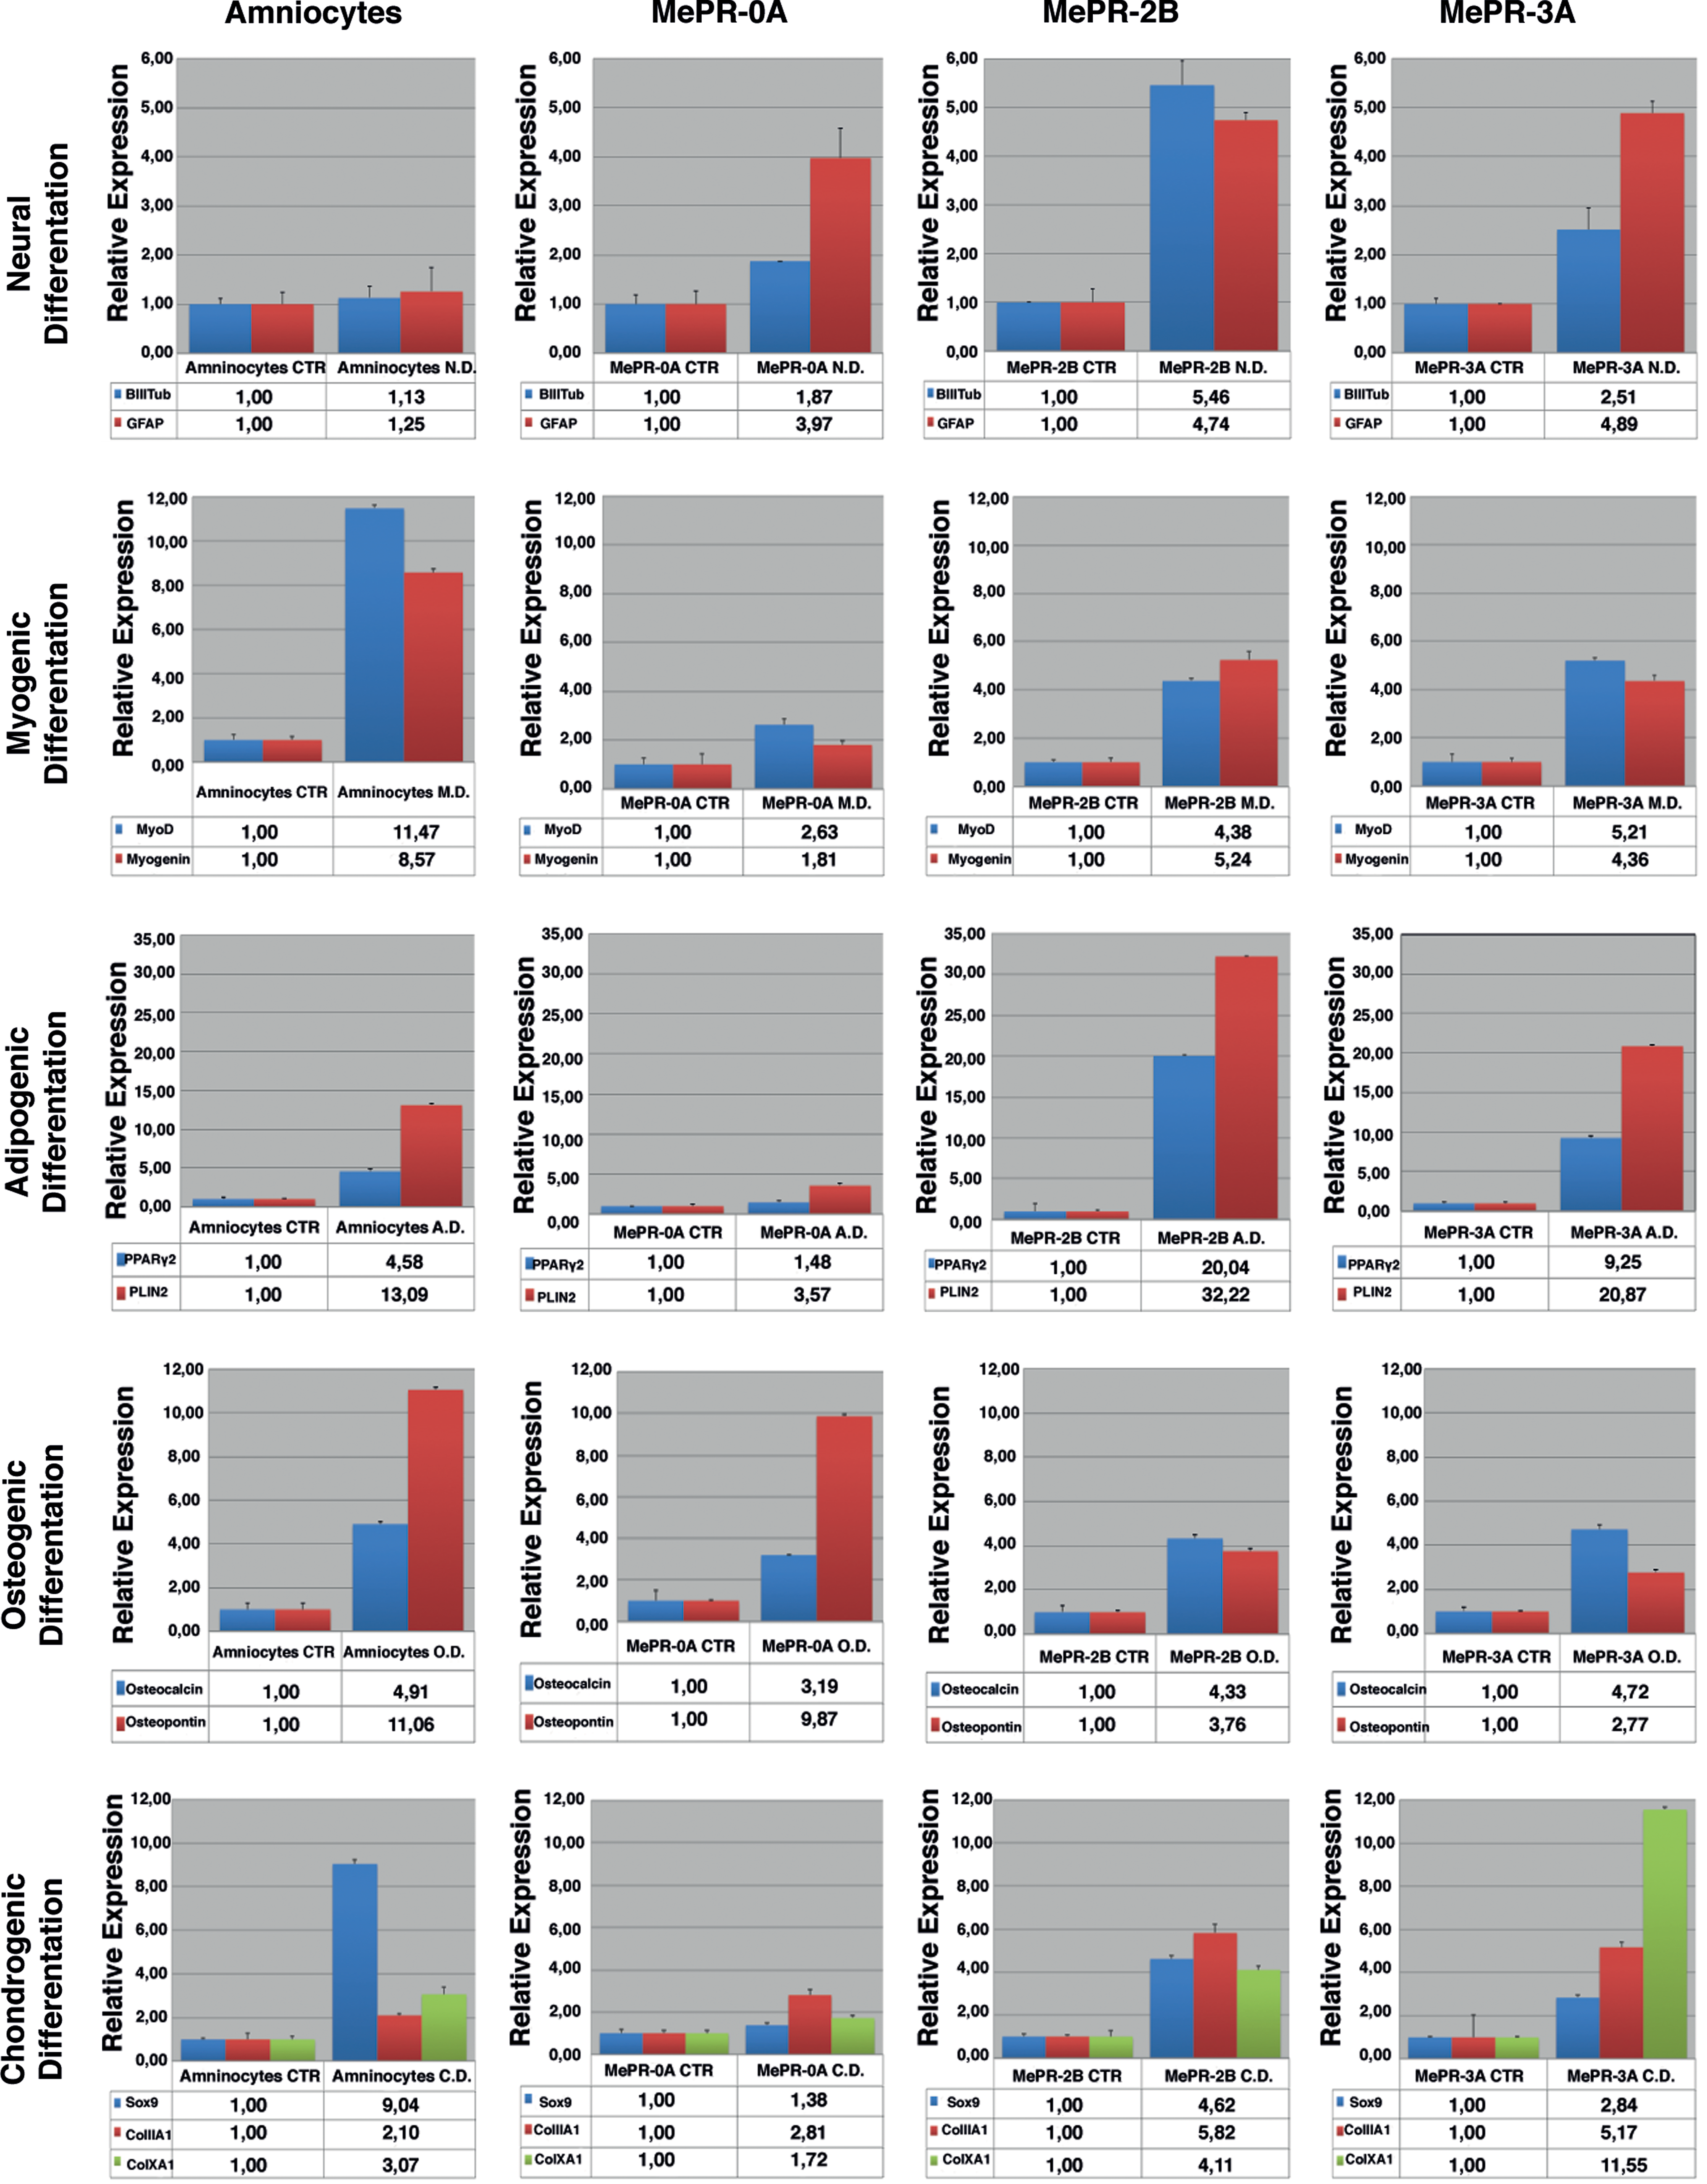
Analysis of differentiation markers. Real-Time PCR for neural, myogenic, adipogenic, osteogenic, and chondrogenic differentiation markers. Color images available online at
Differentiative potential and analysis of specific markers.
To test whether MePR cells were also able to differentiate into adipocytes, the cells were incubated for 3 weeks in differentiating medium [63,64]. The presence of PPARγ2, marker of mature adipocytes, and PLIN2, marker of lipid accumulation [63,85], was tested by RT-PCR, showing the potential of MePR-2B and MePR-3A cell lines to undergo adipocytic differentiation (Fig. 7). Moreover, Oil Red O staining assays for intracellular lipid vesicles performed in MePR-2B cells fully confirmed qPCR results, as shown in Fig. 8B.
To verify the ability of MePR cells to differentiate into myocytes (mesoderm), cells were incubated for 3 weeks with myogenic differentiating media [63,64]. MyoD and Myogenin [86 –89] expression was analyzed by RT-PCR (Fig. 7). A higher increase of MyoD and Myogenin was detectable in primary amniocytes, whereas a lower expression level was observed for all MePR cell lines (Fig. 7). Furthermore, we tested the ability of MePR cells and primary amniocytes to differentiate into osteoblasts and chondrocytes (mesoderm). To test osteogenic differentiation, cells were incubated for 3 weeks with osteogenic differentiating media [63,64]. Osteocalcin and osteopontin [63] were used as markers for differentiation. While all MePR cells and primary amniocytes were able to undergo osteogenic differentiation, primary amniocytes and MePR-0A showed slightly stronger expression of osteopontin compared with MePR-2B and MePR-3A (Fig. 7). Alizarin Red staining assay confirmed the ability of MePR-2B to differentiate into osteocytes, showing extracellular phosphate calcium deposits (Fig. 8B).
Finally, to demonstrate chondrogenic differentiation, cells were incubated for 2 weeks with specific medium [67]. Sox9, ColIIa1, ColXa1 (by Real-Time PCR), and Col2A1 (by western blot) were used as markers for differentiation (Fig. 7 and Supplementary Fig. S2). Data shown confirm that the ability of MePR-2B/MePR-3A to differentiate is greater than that of MePR-0A, compared with primary amniocytes (Fig. 7 and Supplementary Fig. S2). Alcian blue staining assay corroborated the capability of MePR-2B to differentiate into chondrocytes by revealing extracellular collagen fibers (Fig. 8B).
Analysis of hMSC- specific markers
To evaluate the multipotency potential of the novel MePR cell lines at the molecular level, the expression level of typical hMSC markers was assessed by RT-PCR. In addition, two important markers of pluripotent stem cells, Oct-4 and Nanog [1,90,91], were tested to show the pluripotency of MePR cells.
As shown in Fig. 8C, all three MePR cell lines express the main markers of hMSCs (CD29, CD44, CD73, CD90, CD105, and CD166) at a level comparable to that of primary amniocytes [28 –32]. Furthermore, MePR cells do not express markers of hematopoietic cells such as CD34+ [22]. These results clearly suggest that MePR cells are similar to hMSCs. In addition, Oct-4 and Nanog [1,90,91] were expressed in MePR-2B and MePR-3A as in primary amniocytes (Fig. 8C). MePR-0A cells express Oct-4 in the same way as primary amniocytes, but are not positive to Nanog (Fig. 8C).
Discussion
Currently, BM is the main source of hMSCs. However, BM aspiration is a painful and invasive procedure. Moreover, the frequency and differentiation potential of BM-derived hMSCs decreases significantly with age [92,93] and disease [38]. The search for alternative sources of hMSCs is, therefore, of paramount importance. Various tissues [94,95] have been reported as potential sources for hMSC isolation. Among these, amniotic fluid, umbilical cord, or placenta cells offer key advantages for their accessibility, painless acquisition, and low risk of viral contamination. Furthermore, their “young” biological age makes them particularly appealing.
The embryonic cells of three germ layers were identified in amniotic fluid many years ago [44,45,96]. Though speculated for decades [97,98], the presence of mesenchymal cells in amniotic fluid has only recently been demonstrated [42,99,100].
Amniotic fluid is known to contain a heterogeneous population of progenitor cells, including mesenchymal, epithelial, hematopoietic, and trophoblast cells as well as embryonic-like stem cells [46]. However, the relatively low number of donations, the limited number of cell duplications before senescence, and the variability of amniotic fluid cells have made it difficult to analyze and compare data from different laboratories.
To standardize and obtain comparable data, we established three different cell lines from amniotic fluid cells: MePR-0A (epithelial-like), MePR-2B (fibroblastic-like), and MePR-3A, which contains both fibroblastic and epithelial cell types in a proportion similar to that of primary cultures (>99:1, respectively). These novel MePR cell lines replicate exponentially without an obvious alteration of cell cycle progression, unlike primary amniocytes, which enter senescence after 10 weeks (about 10 duplications) (Fig. 3A).
Genetic alterations such as translocation and inversion [7,78,82,83] frequently occur during immortalization. The analysis of MePR cell line karyotypes shows similar results, using both G-banding and CGH Array: no chromosomal aberrations in MePR-2B cells, a single aberration in MePR-3A cells, and two aberrations in MePR-0A cells (Fig.4A–C). Thus, our results indicate that MePR cell lines (and MePR-2B in particular) can be used in the place of primary cells in different research settings.
Likewise, expression profile analysis shows that the majority of genes are not modified compared with primary cells, suggesting that any modification in gene expression is mainly due to the reactivation of cell cycle progression. In accordance with this hypothesis, GeneOntology evaluation shows 12 principal clusters (Fig. 5B and Supplementary Table S5), only two of which (cell cycle and multicellular organismal development, Supplementary Table S5) are statistically significant. The fact that the “cell cycle” cluster is the most significant strongly corroborates the impact of the immortalization process in conformity with the data shown in Fig. 3A–B. When analyzing the Heat Map image of all MePR cell lines, unlike primary amniocytes, MePR-2B always clusters with MePR-3A (fibroblastic-like cells), (Fig.6). Particularly, the Heat Map of mixed genes suggests that some of the regulated genes (84 genes) may be linked to the different morphology of all three cell lines. For example, four members of the collagen family (COL12A1, COL1A2, COL3A1, and COL4A6, Supplementary Table S4) are down-regulated in MePR-0A and up-regulated in MePR-2B/MePR-3A. Although these mixed regulations remain to be better mined, it is tempting to speculate on their correlation with morphological differences characterizing the different MePR cell lines.
MePR (0A-2B-3A) cell positivity to typical hMSC markers (CD29, CD44. CD73, CD90, CD105, and CD166) (Fig. 8C), together with the expression of Oct-4 and Nanog, suggests that MePR cells represent a novel human MePR model (Multipotent Stem Cells) with characteristics of pluripotency.
Of key importance is the ability of MePR cells to differentiate into tissues derived from embryonic layers (endoderm, mesoderm, and ectoderm). Although MePR-0A cells show a weaker potential to differentiate (Fig. 7) and do not express Nanog (Fig. 8C), all MePR cell lines display significant differentiation potential. The fact that MePR-0A cells carry two different chromosome abnormalities might influence and account for their minor (but observed) differentiation potential. While MePR-2B and MePR-3A display similar neural, osteogenic, chondrogenic, and adipogenic differentiation potential compared with primary amniocytes, myogenic differentiation is slightly reduced (Fig. 7). Myogenic differentiation requires cell cycle block in G0, and this may account for the lower (but observed) capability of MePR cell lines to differentiate as a result of the reactivation of cell cycle progression [101 –104]. Moreover, given that primary amniocytes are a nonhomogenous cell population, some of the differences observed in the transcriptome experiments (Fig. 5B and Supplementary Table S5) might also be due to intrinsic differences between the primary cells from patient samples.
In summary, our data indicate that MePR cells display the multipotency potential and differentiation rates of hMSCs, and, thus, represent a useful model to study both mechanisms of differentiation and possible pharmacological approaches to induce selective differentiation. In particular, despite not for clinical use, MePR-2B cells, which carry a bona fide normal karyotype, might be used in basic stem cell research, leading to the development of new approaches for stem cell therapy and tissue engineering.
Footnotes
Acknowledgments
The authors thank the “Cell Culture and Cytogenetics” TIGEM Core, and the “Integrated Microscopy Facilities” of IGB-CNR, Naples, Italy, for support. This work was supported by EU: APO-SYS (contract no. 200767), Blueprint (contract no. 282510), ATLAS (contract no. 221952); Epigenomics Flagship Project “EPIGEN” (MIUR-CNR); the Italian Association for Cancer Research (AIRC no. 11812); Italian Ministry of University and Research (PRIN_2009PX2T2E_004); and PON002782; PON0101227. They thank C. Fisher for editing the article and G. Minchiotti for helpful suggestions.
Author Disclosure Statement
The authors declare that there is no conflict of interest.
References
Supplementary Material
Please find the following supplemental material available below.
For Open Access articles published under a Creative Commons License, all supplemental material carries the same license as the article it is associated with.
For non-Open Access articles published, all supplemental material carries a non-exclusive license, and permission requests for re-use of supplemental material or any part of supplemental material shall be sent directly to the copyright owner as specified in the copyright notice associated with the article.