
Abstract
The transcription factors Sox2, Oct4, and Nanog regulate within a narrow dose-range embryonic stem (ES) cell pluripotency and cell lineage commitment. Excess of Oct4 relative to Sox2 guides cells to mesoendoderm (ME), while abundance of Sox2 promotes neuroectoderm (NE) formation. Literature does not address whether ethanol interferes with these regulatory interactions during neural development. We hypothesized that ethanol exposure of ES cells in early differentiation causes an imbalance of Oct4 and Sox2 that diverts cells away from NE to ME lineage, consistent with the teratogenesis effects caused by prenatal alcohol exposure. Mouse ES cells were exposed to ethanol (0, 25, 50, and 100 mM) during retinoic acid (10 nM)-directed differentiation to NE for 0–6 days, and the expression of Sox2, Oct4, and Nanog was measured in single live cells by multiparametric flow cytometry, and the cellular phenotype was characterized by immunocytochemistry. Our data showed an ethanol dose- and time-dependent asymmetric modulation of Oct4 and Sox2 expression, as early as after 2 days of exposure. Single-cell analysis of the correlated expression of Sox2, Oct4, and Nanog revealed that ethanol promoted distinct subpopulations with a high Oct4/Sox2 ratio. Ethanol-exposed cells differentiated to fewer β-III tubulin-immunoreactive cells with an immature neuronal phenotype by 4 days. We interpret these data as suggesting that ethanol diverted cells in early differentiation from the NE fate toward the ME lineage. Our results provide a novel insight into the mode of ethanol action and opportunities for discovery of prenatal biomarkers at early stages.
Introduction
E
The transcription factors sex-determining region Y-box containing gene 2 (Sox2), octamer-binding protein 4 (Oct4), also known as POU domain class 5 transcription factor 1 (Pou5f1), and Nanog Q50 homeobox constitute the core of a 239-member network [18] that controls pluripotency in ES cells [19]. An emerging concept is that the pluripotent ES cell state is innately unstable and poised for differentiation [20]. Accordingly, in a reorganized network, the same transcription factors Sox2, Oct4, and Nanog direct ES cells to differentiate into embryonic lineages. For example, overexpression of Sox2 triggers ES cell differentiation preferentially to neuroectoderm (NE) [21], and overexpression of Oct4 guides ES cells to the mesoderm [22,23]. Competition between the lineage-specifying actions of Oct4 and Sox2 results in opposing each other and maintaining a self-renewal pluripotency ES cell state. Upon ES cell differentiation, Sox2 and Oct4 upregulate the expression of Fgf4, which signals the downregulation of Nanog [24]. Besides the level of each of these transcription factors, the relative expression of Oct4 and Sox2 is critical for cell fate decisions in differentiating ES cells. Excess of Sox2 promotes the NE fate, and a surplus of Oct4 favors mesoendoderm (ME) development [25]. Therefore, Sox2, Oct4, and Nanog are considered ES core transcription factors that control pluripotency in self-renewing cells and first-order lineage specifiers in differentiating cells.
A considerable body of literature has addressed the effects of ethanol in mouse and human ES and neural stem cells [26 –36]. Long-term in vitro ethanol exposure as a model of binge drinking has been used to study the molecular aspects of FAS. For example, human ES (WA01 and WA09) cells were exposed to 0.1% or 0.3% ethanol for 4 days during formation of embryoid bodies (EBs) (0–4 days), neural precursors (17–21 days), and neurons (28–32 days) to identify the potential FAS biomarkers in the metabolome [35]. In an another study, human ES (H9)-derived EBs were treated with 0.5%, 1.5%, and 2% ethanol for 7 days, and gene profiling was carried out [31]. In this paradigm, 0.5% ethanol had no significant effects, while 1.5% and 2% ethanol caused major global expression changes, and, notably, an upregulation of early endodermal markers. However, the earlier developmental stages and interference of ethanol with regulation of core transcription factors have not been elucidated. In our earlier study [5], we investigated the changes of Sox2, Oct4, and Nanog with ethanol during mouse ES cell spontaneous differentiation in suspension to the EBs. We demonstrated that downregulation of these transcription factors was not completed within 6 days in the presence of 100 mM ethanol. Instead, the protein level of Oct4 and Sox2 remained fourfold to sixfold higher, respectively, in ethanol-exposed cells in comparison with the untreated control. The Sox2 level in ethanol-exposed cells was similar to that of 3-day differentiated untreated cells, while that of the Oct4 level corresponded to that of an earlier differentiation stage. Since the relative Sox2 and Oct4 level determines differentiation to either NE or ME, the asymmetric high expression of Sox2 and Oct4 during EB differentiation suggested that ethanol may affect lineage formation. The timing of these ethanol-induced changes of Sox2 and Oct4 within the window of embryonic day (E) E3.5–E9.5 (=3.5+6) corresponds to the transition to gastrulation during embryonic development [17].
In the present study, we focused on the effects of ethanol (25–100 mM) on the dynamical interactions of Sox2, Oct4, and Nanog during early retinoic acid (RA)-directed differentiation of ES cells to the NE lineage. The ethanol dose used in our experiments is in the range of blood alcohol level determined in alcoholics [37]. This differentiation system is driven by a physiologically relevant RA concentration (10 nM) [38], and leads to formation of neural progenitors and neuronal cells [39]. Mouse ES cells express RA-metabolizing enzymes (Cyp26a1 and Raldh2) and RA nuclear receptors (RARα, RXRβ, and RARγ). Because of widespread heterogeneities in the expression of Sox2, Oct4, and Nanog among cells [40 –43], we measured their protein level simultaneously in single cells. We assessed the effects of ethanol on cell subpopulations during 4 days of ES cell differentiation, a period that is important for lineage specification and FAS susceptibility. Here, we report that (i) the expression of Oct4 was elevated in an ethanol dose- and exposure-dependent manner during early ES cell differentiation; (ii) Oct4-positive cell subpopulations were promoted by ethanol; and (iii) the overall Oct4/Sox2 ratio was elevated, and traced back to distinct upregulated sectors of differentiated cells exposed to ethanol, resulting in iv) fewer neuronal β-III-tubulin-positive cells that exhibited an immature phenotype. The observed imbalance of transcription factors and redistribution of cell subpopulations and cell fates were not accompanied by changes in population-wide cell proliferation, cell cycle, or apoptosis. These results show for the first time the changes in the stoichiometry of Oct4 and Sox2 in ES cells exposed to physiological-relevant ethanol concentrations during differentiation, and suggest that ethanol may reprogram lineage specification.
Materials and Methods
Maintenance and differentiation of ES cells and ethanol treatment
The mouse ES cell line E14Tg2a was obtained from BayGenomics (MMRRC at University of California, Davis). The ES cells were grown on 0.1% gelatin-coated tissue culture plates in DMEM (Invitrogen, Grand Island, NY). The medium was supplemented with 15% ES-qualified fetal bovine serum (Hyclone, Rockford, IL), 0.1 mM nonessential amino acids, 2.0 mM glutamine, 10 mM HEPES buffer, 100 μg/mL penicillin/streptomycin (Invitrogen), 0.1 mM β-mercaptoethanol (Sigma, St. Louis, MO), and 1000 units/mL leukemia inhibitory factor (LIF; Millipore, Billerica, MA). The cells were maintained at 37°C and 5% CO2 in a humidified atmosphere with daily changes of the complete medium. The cells were detached using TrypLE Express (Invitrogen) and passaged every two days before reaching confluency.
For differentiation to NE, the ES culture medium was supplemented with 10 nM all-trans-RA dissolved in ethanol, and the cells were cultured in an adherent monolayer [44]. The RA-containing medium was changed on alternate days. The differentiation media containing 25, 50, or 100 mM ethanol were prepared freshly. Culture plates were placed in dedicated incubators that contained an open dish at the bottom with a solution of 25, 50, or 100 mM ethanol, or alternatively wrapped with a parafilm to prevent ethanol evaporation. The ethanol concentration in the medium was measured by NADH colorimetry [45].
Cell proliferation, cell cycle, and apoptosis assays
Cell cycle kinetics were determined by incorporation of a fluorescent uridine analog conjugated to Alexa Fluor 647, using a Click-iT EdU flow cytometry assay kit (Invitrogen) [46 –48]. Briefly, cells were incubated with 10 μM EdU (5-ethynyl-2′-deoxyuridine) at 37°C for 1 h. At the end of the incubation period, cells were disaggregated into a single-cell suspension, fixed, permeabilized, and incubated with the Click-iT reaction cocktail for 30 min in the dark. For measurement of DNA content, cells were incubated with propidium iodide (PI; Sigma). The stained cells were analyzed using an LSR II flow cytometer (Becton Dickinson, San Jose, CA) and analyzed with FACS Diva and FlowJo software (Tree Star, Ashland, OR).
For the measurement of cell cycle, cells exposed were fixed and stained with 2.5 μg/mL PI in the presence of 0.5 mg/mL RNase A (Sigma) [49], immediately before measurement on a Beckman Coulter flow cytometer (Indianapolis, IN). DNA-ploidy histogram analysis was performed with FlowJo using the Dean-Jett-Fox algorithm model that fits Gaussian curves to the G0/G1 and G2/M and a polynomial curve to the S phase [50].
Apoptosis was detected by flow cytometry in cells stained with fluorescein isothiocyanate (FITC)-conjugated annexin V and PI [51]. Measurements were performed immediately after PI addition on a BD LSR II flow cytometer, and data were analyzed with FlowJo software.
Multiparametric flow cytometry measurements of transcription factors and cell size in live cells
Expression of Sox2, Oct4, and Nanog was determined simultaneously by multiparametric flow cytometry. Transcription factors were detected in fixed and permeabilized cells with a cocktail of fluorescent-tagged anti-mouse monoclonal antibodies Alexa Fluor 647–Sox2, PerCP/Cy5.5-Oct4, PE-Nanog, and corresponding isotype controls using a mouse pluripotency kit (Becton Dickinson). The cells were stained before permeabilization with a fixable Live/Dead Near-Infra Red (APC-Cy7) viability dye (Invitrogen) to distinguish live from dead cells and debris (as shown in Fig. 1A viability panel). Measurements were performed on a BD LSRII flow cytometer. For each sample tube, 100,000 events were recorded. The acquired data were processed using FlowJo software before single-cell level analysis to obtain multivariate distribution and expression.
Multivariate distribution and expression sector analysis
A total of 50,000 live cells were sorted in eight sectors based on positive or negative expression of Sox2, Oct4, and Nanog (as described in Fig. 2A Table inset) using a threshold of 99 percentile of the corresponding isotype for each experimental group. Data analysis was performed in R program (
Redistribution of transcription factors Sox2, Oct4, and Nanog in 3-day differentiated cells as a function of ethanol.
The x- and y-axes of the bivariate plots of Sox2 and Oct4 (shown in Figs. 2E and 4C) were transformed from the exported multiparametric flow cytometry data to logical scale using the following parameters: w=0.7, m=4.5, a=0, t=218, where w is the linearization width in asymptotic decades that determines the slope of the transformation at zero; m is the full width of the transformed display in asymptotic decades; a has a default value 0 and corresponds to standard logical function; and t is the top of the scale data value set to 218=262,144 for 18-bit data [52 –54]. Data were transformed using R program, and data were analyzed and visualized with MATLAB (MathWorks, Natick, MA).
Alkaline phosphatase staining
Pluripotent undifferentiated colonies were identified by staining of cells for alkaline phosphatase (ALP) as per the manufacturer's protocol (Millipore). ES cells were plated at low density (3×10³ cells in a 60-mm plate), and differentiation was driven by RA (50 nM). Images were obtained with a bright-field Olympus IX2-SL microscope equipped with a Q-color-3 digital camera and processed with cellSens program. A composite image for each sample was prepared using ICE program (
Immunocytochemical detection of transcription factors and lineage markers
Immunocytochemistry was performed with standard techniques. For immunofluorescent detection of the Sox2, Oct4, Nanog, and SSEA-1 ES cells were plated onto gelatinized (0.1%) glass slides (twowell chambers; Nunc Lab-Tek II) at a density of 6,000 or 9,000 cells/well. The following primary antibodies were used: goat anti-Sox2 (sc-17320; 1:50), mouse anti-Oct4 (sc-5279; 1:250), rabbit anti-Nanog (sc-33760; 1:250), and mouse SSEA-1 (sc-21702; 1:250) from Santa Cruz Biotechnology (Dallas, TX). The secondary antibodies (Invitrogen; 1:250) were Alexa Fluor 546 donkey anti-goat (A-11056), Alexa Fluor 488 chicken anti-mouse (A-21200), and Alexa Fluor 555 goat anti-rabbit (A-11010). The nuclei were visualized with DAPI (Vector Laboratories, Burlingame, CA).
The lineage markers were detected in cells differentiated with RA (10 nM). Cells were plated onto glass slides (eightwell chambers; Nunc BD Falcon) at a density of 1,000 cells/well. The slides were treated with 0.1% gelatin/0.1% chromium potassium sulfate for improved cell attachment. Rabbit anti-nestin (PRB-315C; 1: 500) was purchased from Covance (Denver, PA), and mouse β-III tubulin (ab7751, 1:500) was from Abcam (Cambridge, MA). Secondary antibodies were used as described above. Cells were counterstained with DAPI for visualization of nuclei.
Images were taken with an Arcturus PixCell II LCM microscope using ISCapture software (Arcturus Engineering, Mountain View, CA).
Statistical analysis
We performed one- or two-way ANOVA as appropriate in each statistical comparison (aov function in R), followed by statistical significance testing of relevant comparisons using Tukey's honest significant difference method based on the Studentized range statistics at a familywise confidence interval of 95% (TukeyHSD function in R), and post hoc adjusted P-values are reported. A P-value of <0.05 was considered statistically significant. Data were obtained from n=3 biological replicates. Figures are representative of two experiments.
Results
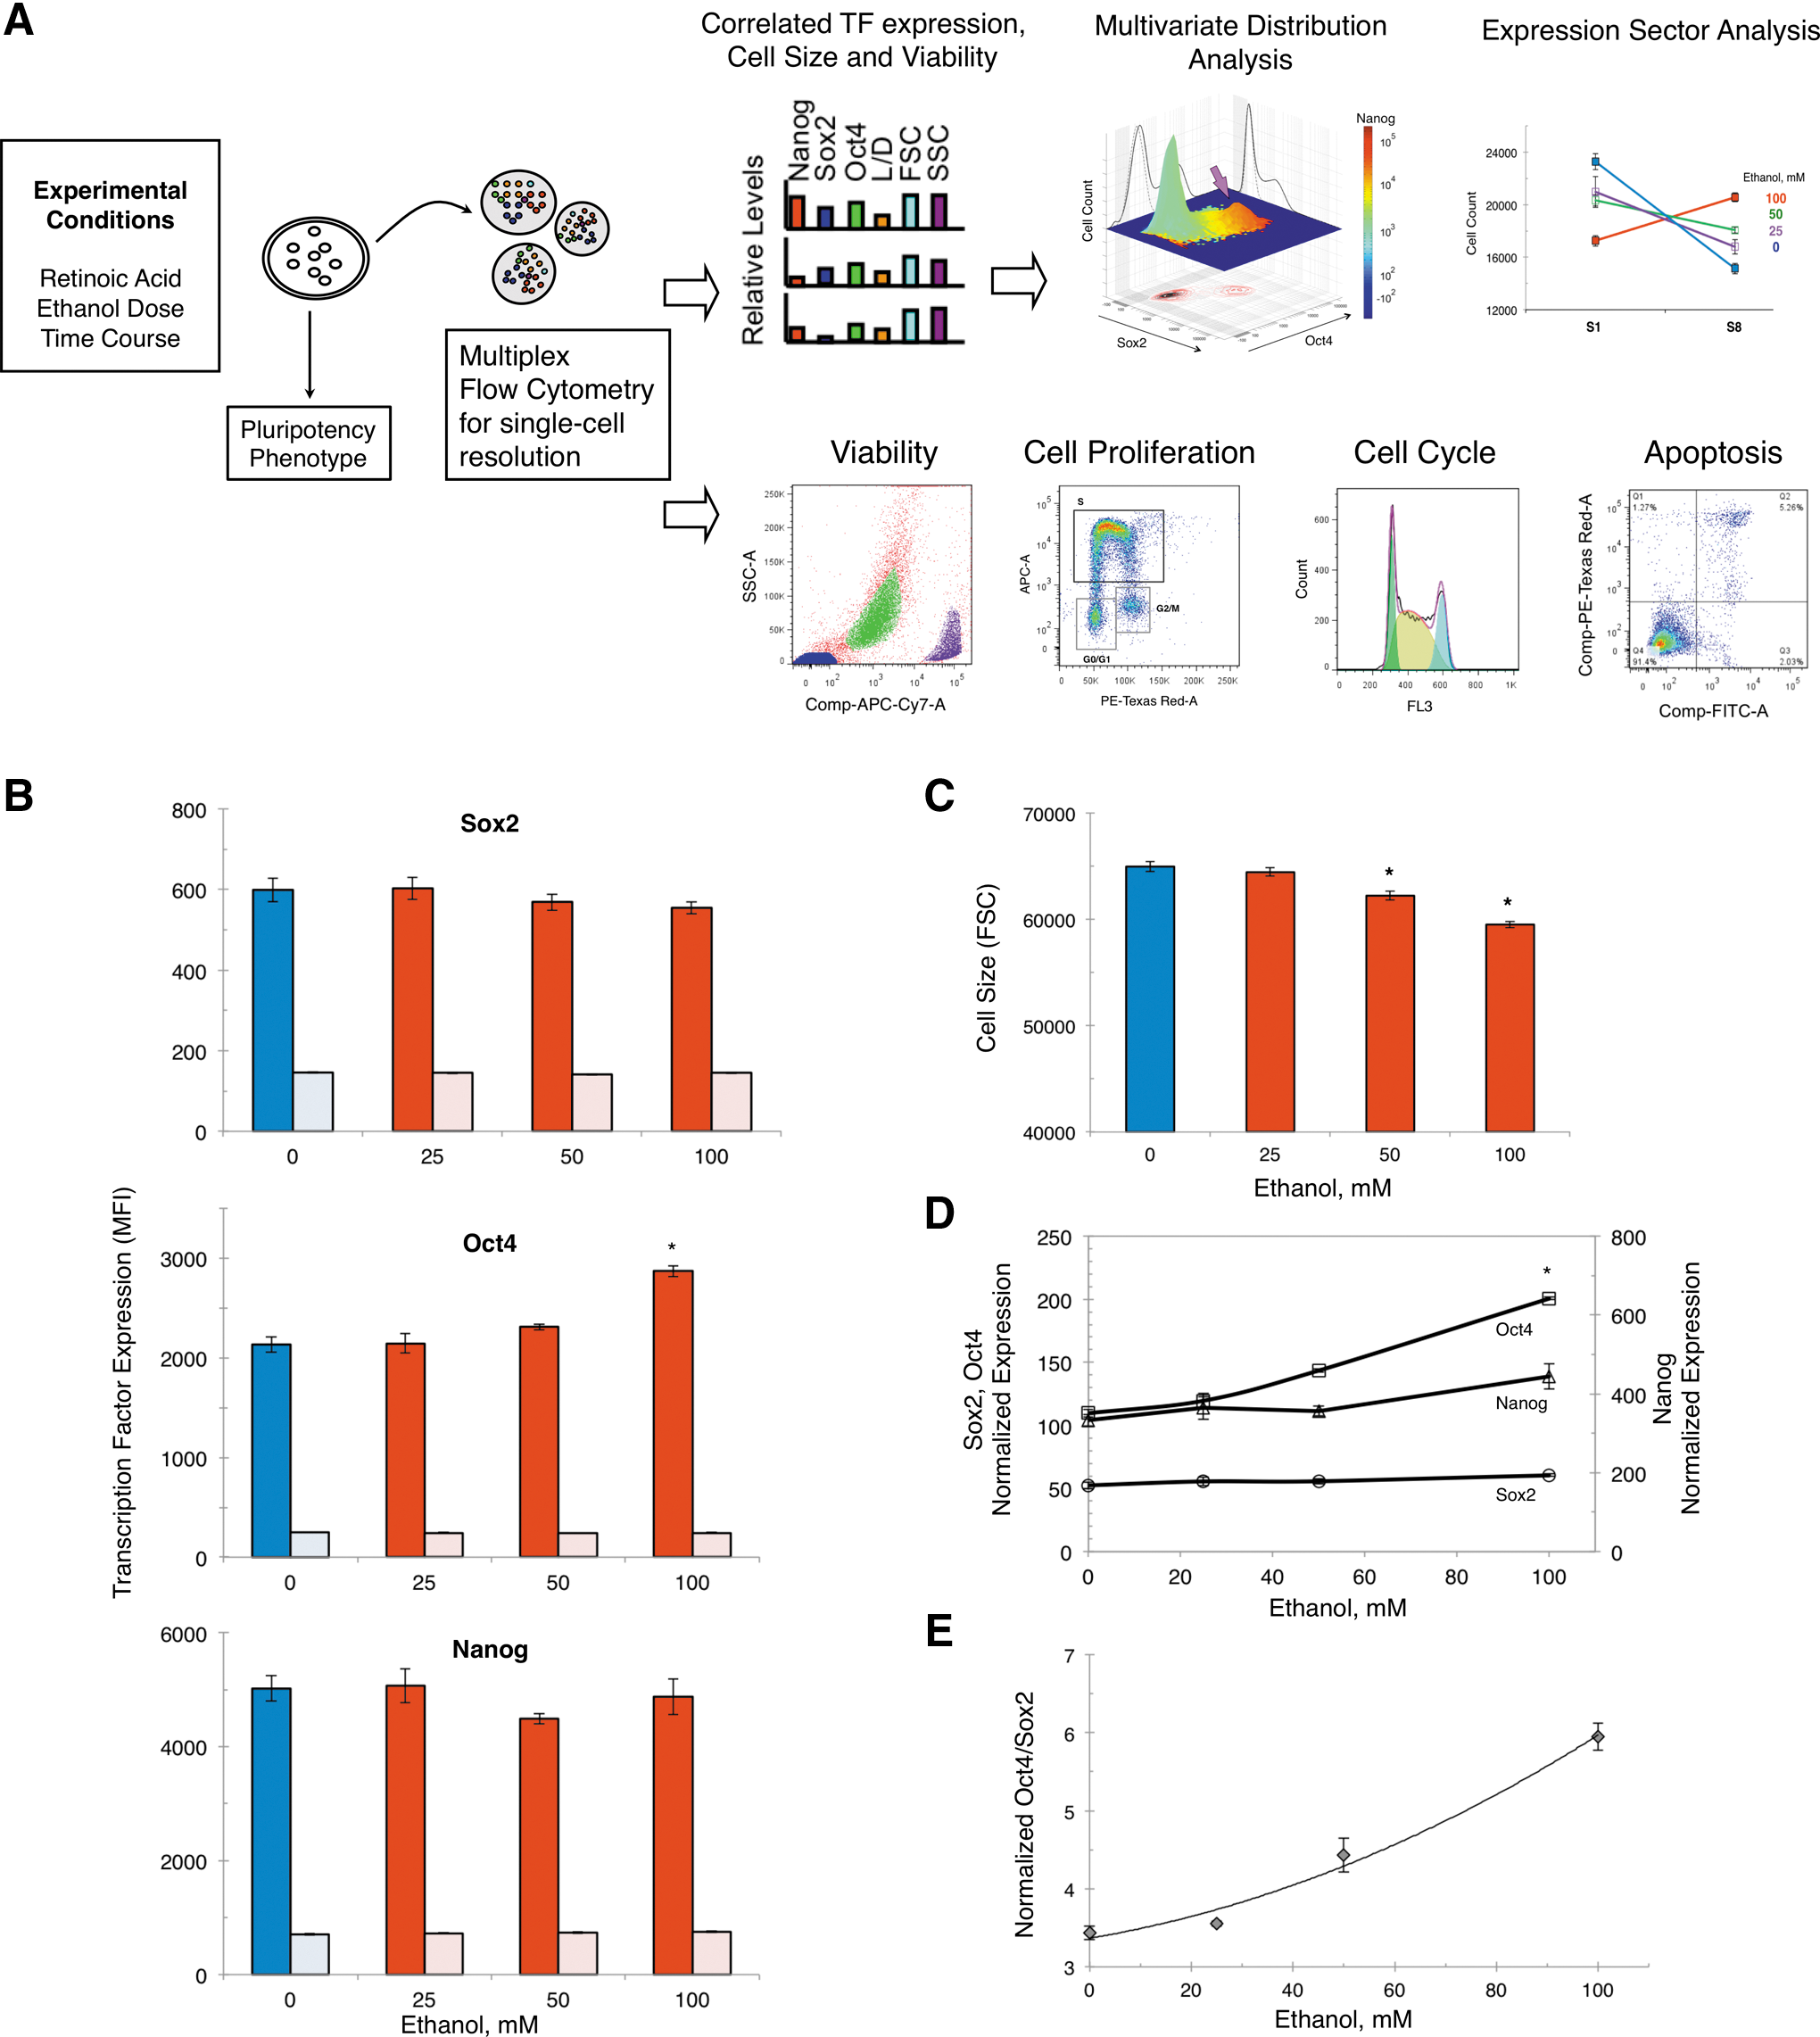
Figure 1A depicts the experimental design of the study. ES cells were differentiated toward NE with RA. Progression of differentiation was followed along two dimensions: ethanol dose (0–100 mM) and exposure time (0–6 days). We evaluated the expression of the transcription factors Sox2, Oct4, and Nanog, cell size, viability, cell proliferation, cell cycle, and apoptosis in ES and differentiated cells in the presence or absence of ethanol by flow cytometry. Simultaneous measurements by multiparametric flow cytometry of the level of transcription factors and cell characteristics (cell viability and size) in 100,000 single cells provided the capability for elimination dead cells and data normalization, based on in silico sorting of cells according to live/dead staining and size, respectively. Therefore, reported data refer to live cells. Scaled data of correlated protein expression of Sox2, Oct4, and Nanog in 50,000 individual cells were subjected to multivariate distribution and expression sector analysis. The ethanol dose dependence and temporal profile of correlated expression of Sox2, Oct4, and Nanog in single live cells are valuable in uncovering the effects of ethanol on distinct cell subpopulations. In parallel, analysis of pluripotency and cell fate markers was monitored by immunocytochemistry to link the effects of ethanol on Sox2, Oct4, and Nanog expression to phenotypic outcomes.
Ethanol regulates the expression of Oct4 in early ES cell differentiation
We demonstrated earlier that the expression of Sox2, Oct4, and Nanog in the EB cell lysates was elevated with ethanol (100 mM) exposure [5]. However, the complexity of the multilineage EB cell aggregates and their interactions [55] does not facilitate a systematic analysis of the role of ethanol in the regulation of transcription factors along a single lineage. Here, we measured by flow cytometry the simultaneous expression of Sox2, Oct4, and Nanog in cells exposed to different ethanol doses (0, 25, 50, and 100 mM) under RA-directed differentiation conditions promoting NE formation. The low NE differentiation RA signal (10 nM) avoids potentially over-riding the action of Oct4 and Sox2 (unpublished data), and the use of established in vitro ES cell differentiation model toward a select lineage fate provided a means of studying processes of early germ layer specification. Figure 1B shows the mean expression of Sox2, Oct4, and Nanog after exposure for 3 days to different ethanol doses (0–100 mM), along with corresponding isotypes. Exposure of cells in this early stage of differentiation to 100 mM ethanol resulted in a higher level of Oct4, compared to the control, without affecting the expression of Sox2 or Nanog. Ethanol caused also a concomitant decrease of cell size (Fig. 1C). Accordingly, in cell size-normalized data, the expression of Oct4 was higher with exposure to 100 mM ethanol in comparison to control (Fig. 1D). As a result of this altered expression pattern, the Oct4/Sox2 ratio was elevated with increasing ethanol concentrations (Fig. 1E). The level of Oct4 was twofold higher in cells exposed to 100 mM ethanol compared to untreated control. Taken together, data show that ethanol modulated selectively and in a dose-dependent manner the expression of Oct4 that resulted in excess of Oct4 over Sox2 in early differentiation.
Distinct subpopulations of Oct4-expressing cells are promoted with ethanol
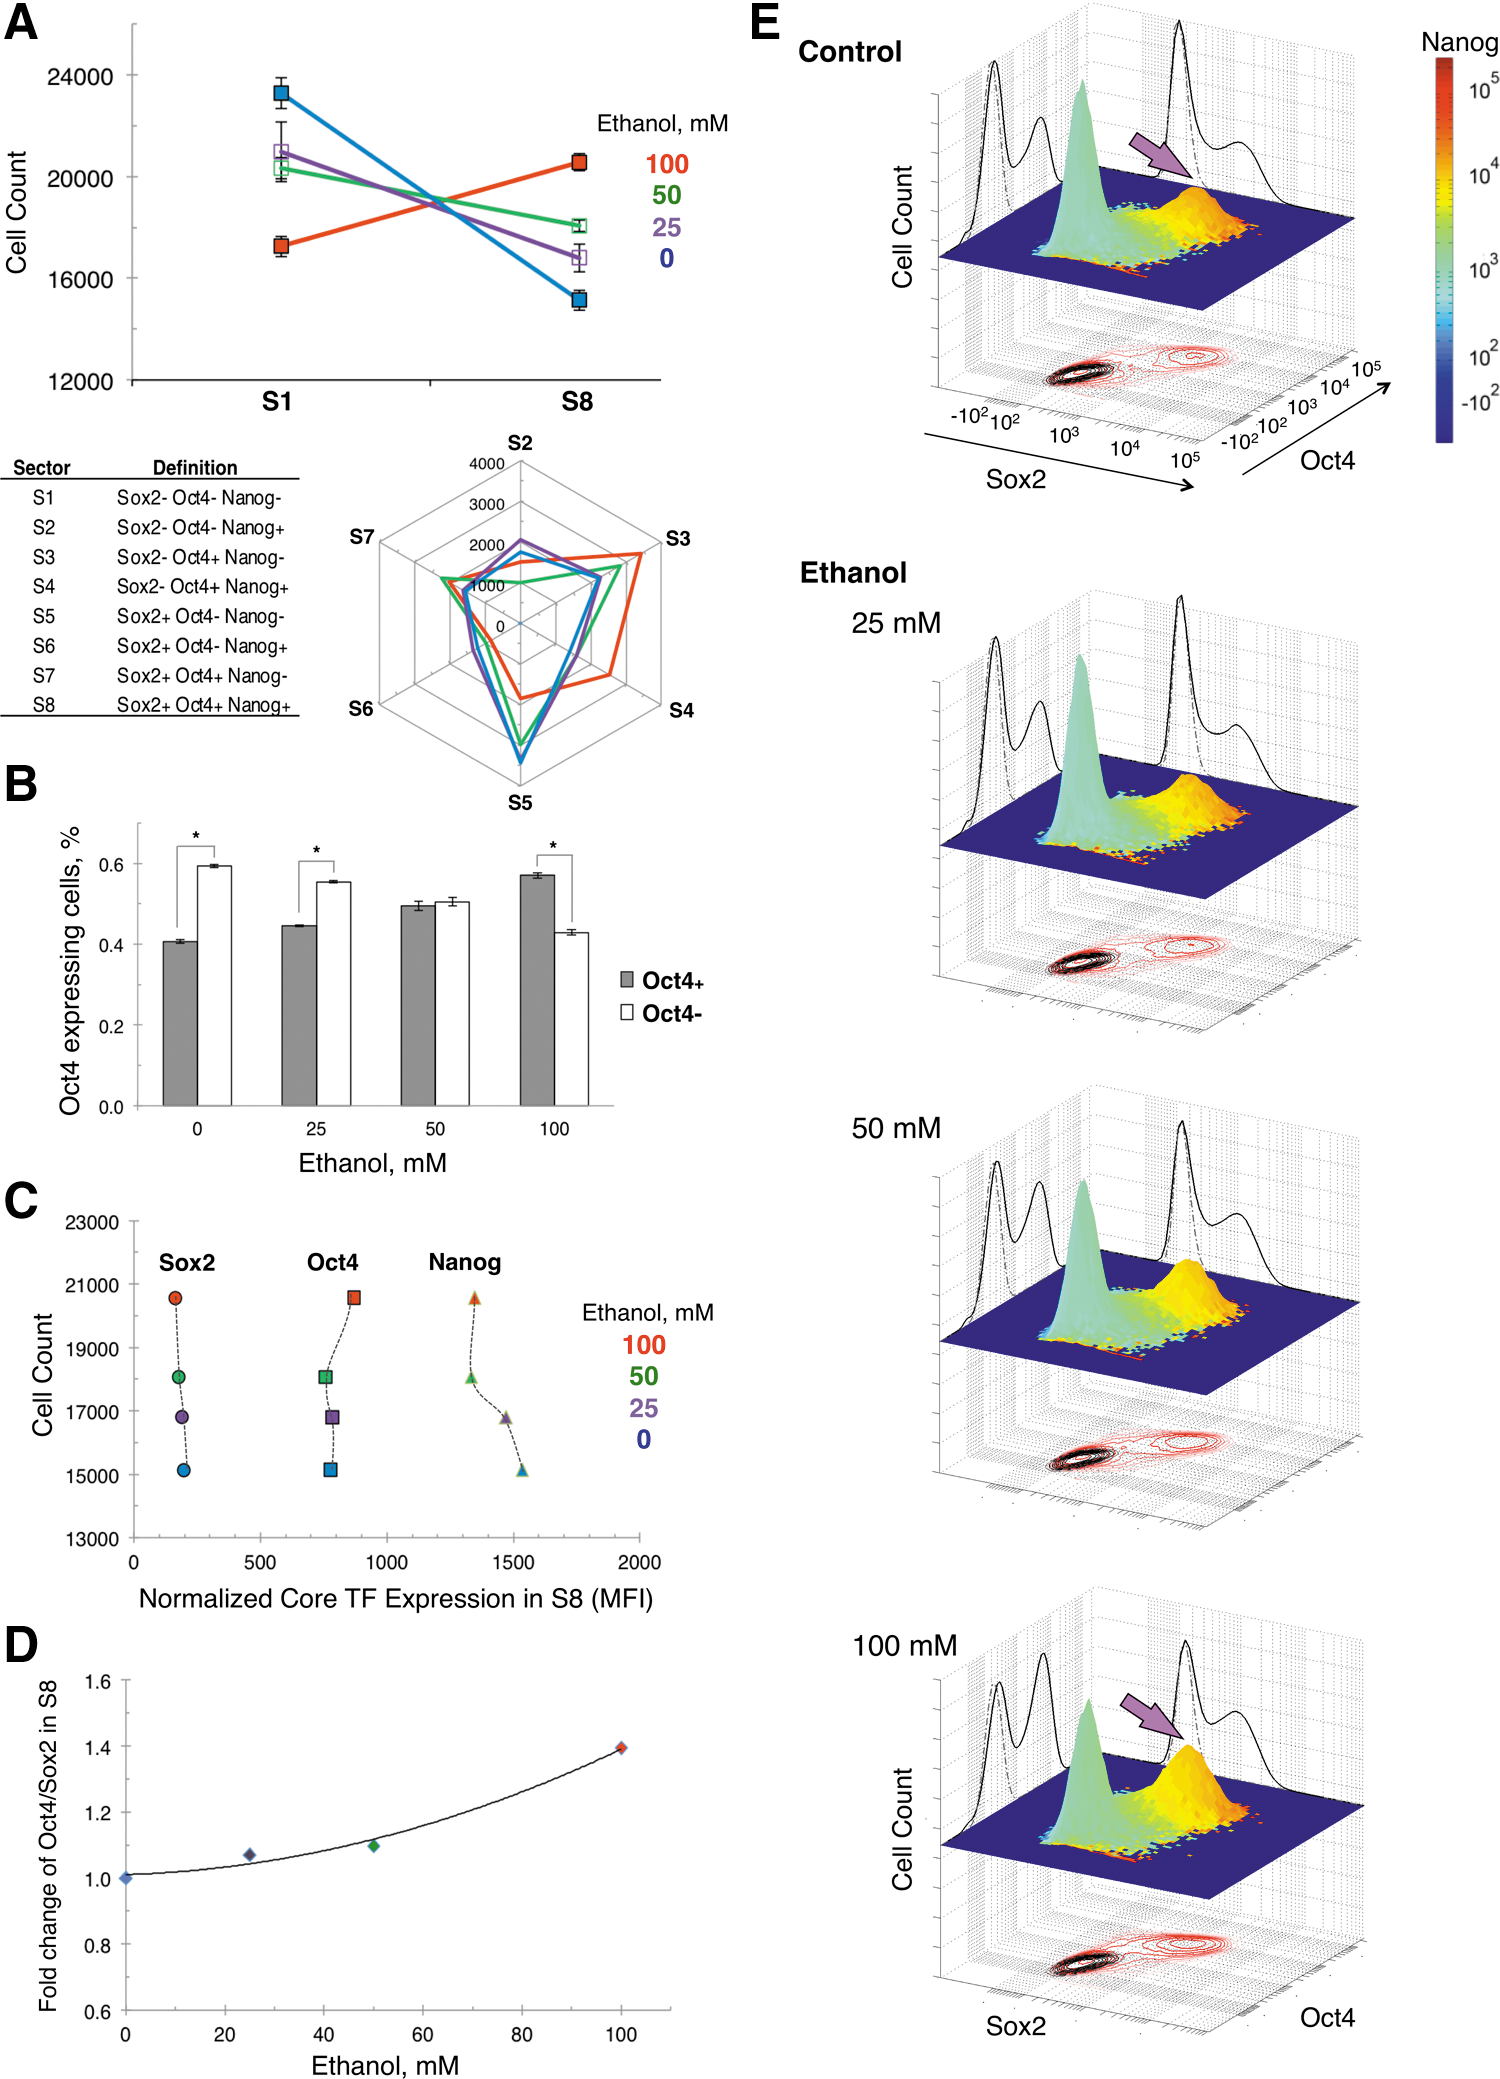
Multiplex measurements of the expression of Sox2, Oct4, and Nanog in single cells made feasible multivariate distribution and expression sector analysis to determine if a higher level of Oct4 in ethanol-exposed cells seen in average expression data (in Fig. 1B, D) stemmed from a particular cell subpopulation. To dissect the different subpopulations, we stratified 50,000 single cells per condition and biological replicate into eight sectors, S1–S8. Cells were grouped into sectors according to positive or negative expression of each of the transcription factors Oct4, Sox2, and Nanog, as defined in Fig. 2A Table inset. Sector analysis showed that the majority of 3-day differentiated cells fell in either S1 or S8, where S1 cells have negative expression and S8 cells have positive expression of Sox2, Oct4, and Nanog (Fig. 2A upper panel). Note that by day 3 of differentiation, the number of S8 cells has significantly declined, and by day 6, S8 cells are not detected (data not shown). Importantly, S8-positive cells progressively replaced S1-negative cells with increasing ethanol doses to become the most prevalent subpopulation. Therefore, ethanol-induced elevation of the Oct4 protein level found in average data originated from a higher number of S8 cells. Although S8 cells were the most prominent Oct4-positive cells, representing ∼40% of all cells exposed to ethanol (100 mM), the number of other Oct4-expressing cells such as S3, S4, and S7 cells also was enlarged, though their numbers were lower (Fig. 2A bottom panel). Overall, the redistribution of cell subpopulations with an increasing ethanol dose produced a linear increase of all Oct4-positive cells, S3+S4+S7+S8 (Fig. 2B).
Besides the increased number of S8, the Oct4 expression in this subpopulation was elevated as a function of ethanol concentration (Fig. 2C). In the absence of any change of Sox2 expression in S8 cells with increasing ethanol concentrations, the Oct4/Sox2 ratio was elevated (Fig. 2D). The ethanol dose-dependent increase of Oct4 to Sox2 stoichiometry in S8 cells followed the same pattern as in the whole cell population (shown in Fig. 1E).
Single-cell analysis of the expression of Oct4 in relation to Sox2 and Nanog as a function of ethanol dose can be visualized in Fig. 2E, where cell subpopulations are resolved and shown as individual peaks. The clustered cells indicated by arrow (red peak) in the trivariate plot correspond to the high Oct4-expressing S8 subpopulation that was gradually enlarged with increasing ethanol doses (25–100 mM) at the expense of S1 cells (green peak). Bivariate plots of Sox2 and Oct4, shown at the bottom of the graphs, point out to the asymmetric regulation of the two transcription factors as a function of the ethanol dose. Histograms on the side walls of the graphs indicate the ethanol-dose dependent increase of Oct4, but not of Sox2, where solid lines represent samples and dotted lines the corresponding isotype controls.
Ethanol modulation of Oct4 is not correlated to overall cell proliferation, cell cycle, or apoptosis
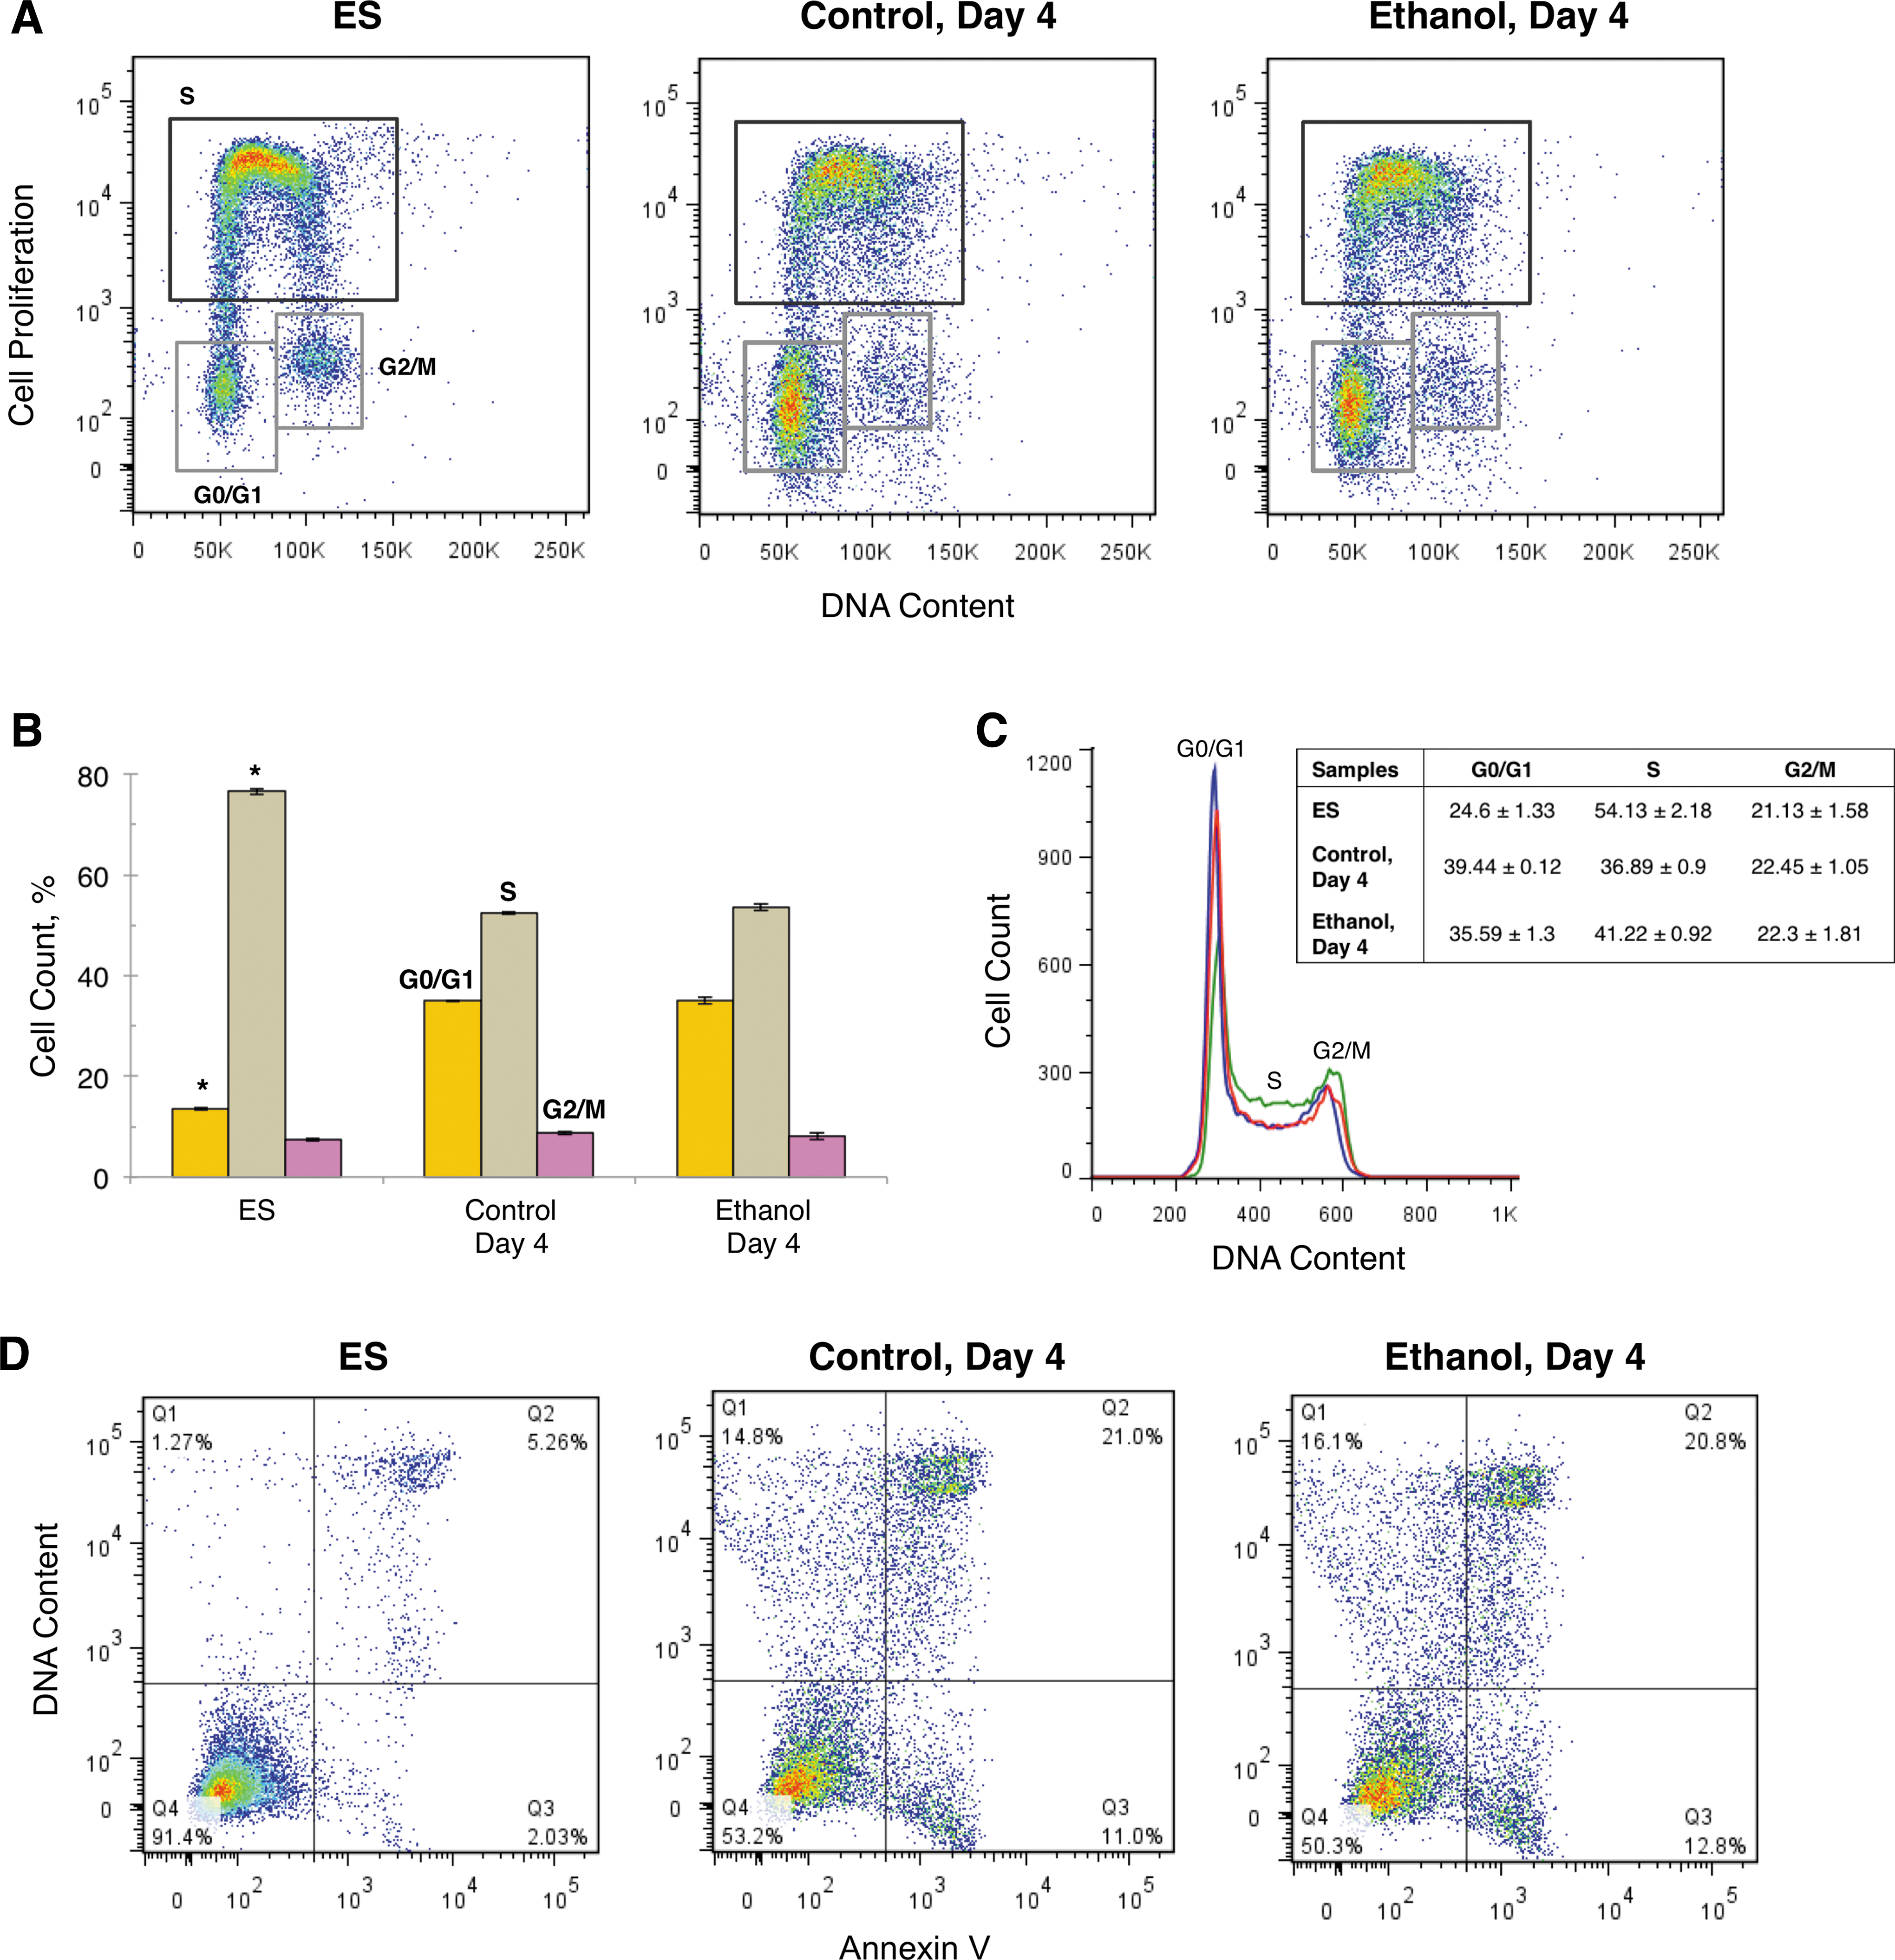
Gene expression of Oct4 has been associated with several cell cycle and apoptosis genes in ES and differentiated cells [56]. Because our data demonstrated that Oct4 was modulated by ethanol (Figs. 1 and 2), we examined how exposure of differentiated cells to ethanol affected cell proliferation, cell cycle, and apoptosis. Based on its maximum effect on Oct4 expression in dose–response studies, the ethanol concentration selected was 100 mM.
The cell proliferation rate of ethanol-exposed cells at the population level was indistinguishable from that of control cells (54.4% vs. 52.4% cells in the S phase), and as expected lower than in ES cells (76.6%) (Fig. 3A). Data quantification of cell proliferation is presented in Fig. 3B, and points out to the lack of changes in the average cell cycle phase distribution with ethanol exposure. We have reconfirmed with an immunocytochemistry-based assay for a Ki67 marker [57] that the overall cell proliferation was unchanged by ethanol exposure during differentiation. Likewise, the cell cycle profile of ethanol-exposed and control cells overlapped at the population level, with observed differences below 5% (Fig. 3C Table inset). The cell cycle of ES cells had a structure consisting largely of an S phase to sustain self-renewal, and a truncated G0/G1 phase, consistent with earlier observations [58 –62].
Cell proliferation, cell cycle, and apoptosis in differentiated cells exposed to ethanol (100 mM) for 4 days.
The number of apoptotic cells (shown in Q3) increased sixfold upon ES cell differentiation from 1.88%±0.17% in ES cells to 11.73%±0.34% (Fig. 3D), in agreement with data obtained earlier with cells differentiated in the absence of LIF and without addition of RA [63]. However, differences were not detected between control and ethanol-exposed differentiated cells; 11.73%±0.34% (Control) versus 12.43%±0.21% (Ethanol). Alternatively, apoptosis measurements with immunocytochemistry-based assays for PARP [57] did not reveal ethanol-induced apoptosis in the whole cell population during differentiation. Increased cell apoptosis with ethanol was detected during EB differentiation in the absence of β-mercaptoethanol [5], suggesting that an antioxidant-free environment may be more conducive to ethanol-mediated apoptosis. Removal of β-mercaptoethanol from the differentiation medium in our adherent monolayer culture increased dramatically apoptosis that was synergized by ethanol [unpublished data].
It will be necessary to examine cell proliferation, cell cycle, and apoptosis in the context of Oct4-positive and Oct4-negative cells and individual sectors to determine if ethanol-induced upregulation of Oct4 in select subpopulations affected their cell numbers and viability.
Dynamic expression of Sox2, Oct4, and Nanog during differentiation of ethanol-exposed cells
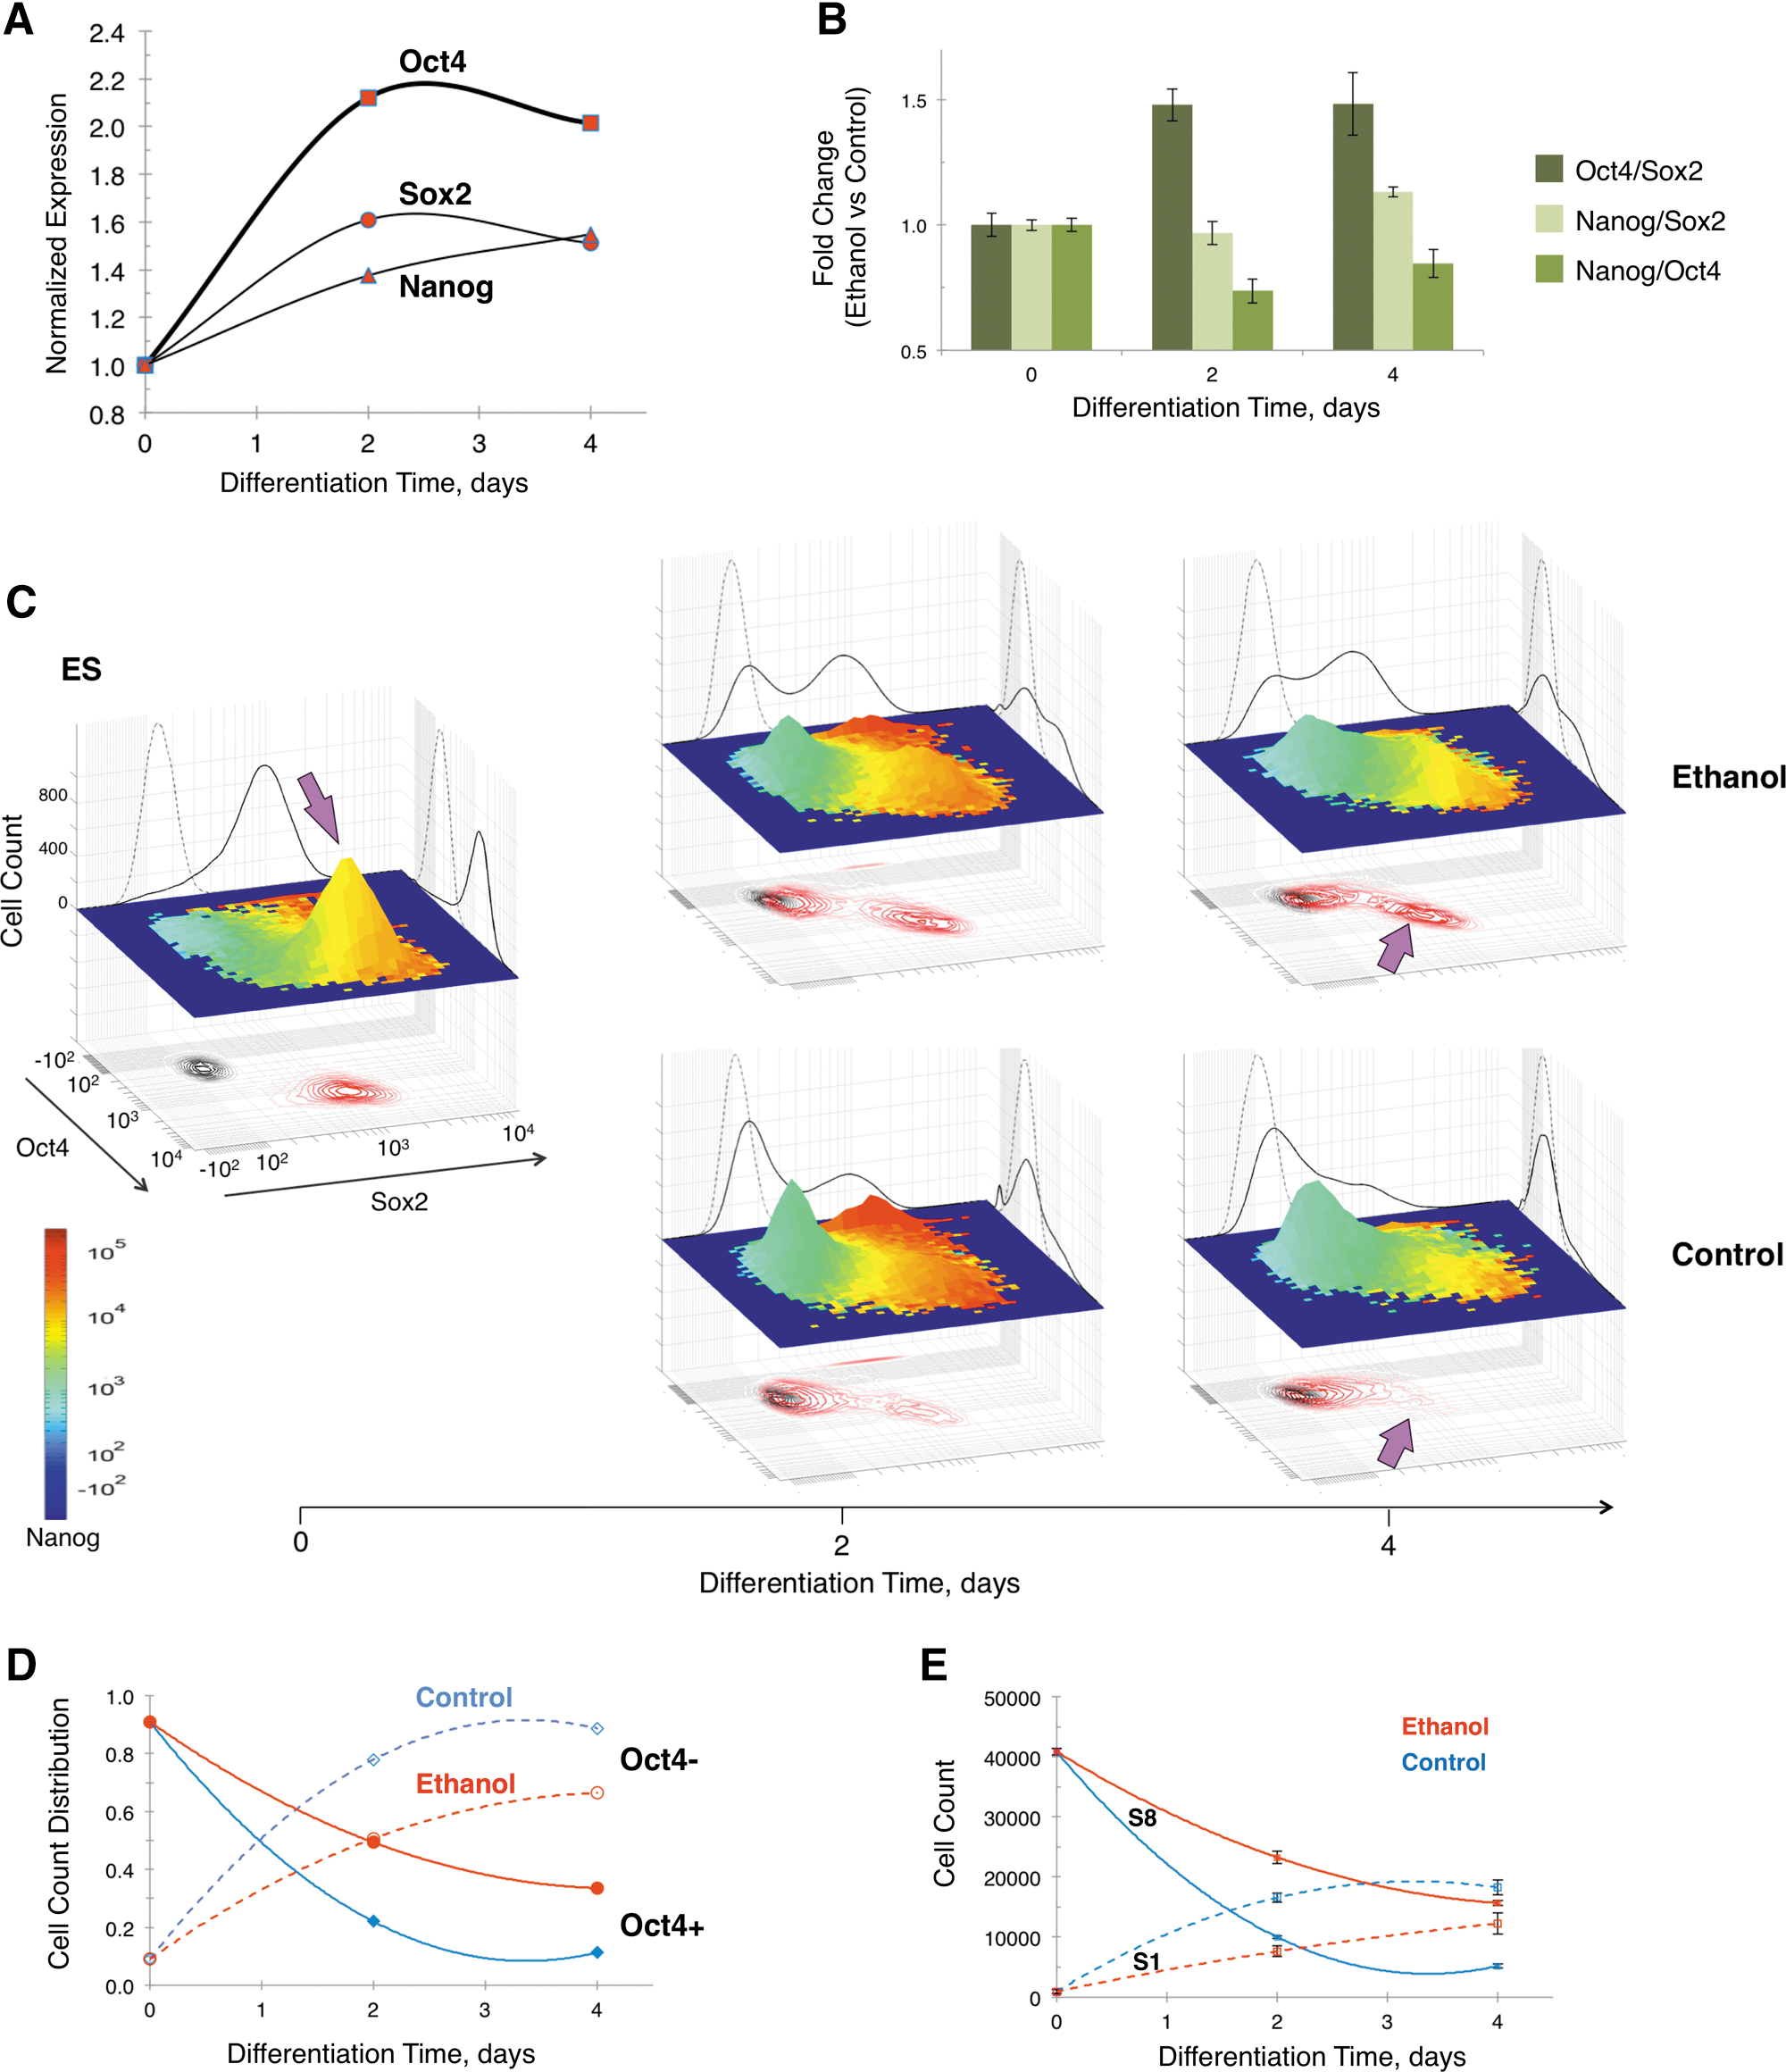
To investigate the dynamics of ethanol interference with ES cell differentiation, we profiled the expression of Sox2, Oct4, and Nanog as a function of exposure time to ethanol. An ethanol concentration of 100 mM was employed for these studies based on the dose–response data (Figs. 1 and 2). We found that ethanol inhibited the downregulation of Sox2, Oct4, and Nanog during differentiation, while it promoted a further decrease of cell size in comparison with the untreated control (data not shown). As a result, the cell size-normalized expression of Sox2, Oct4, and Nanog increased as a function of exposure time to ethanol (Fig. 4A). The Oct4 level was twofold higher in cells exposed to ethanol for 2 days than in control. The increase in the expression of Sox2 and Nanog with ethanol exposure was less prominent than that of Oct4. Consequently, the Oct4-to-Sox2 stoichiometry was modified by ethanol (Fig. 4B). Two days of ethanol exposure brought about a 50% increase of the Oct4/Sox2 ratio, and this stoichiometry was sustained in cells exposed to ethanol for 4 days. Note that the Nanog/Oct4 ratio was slightly decreased, while the Nanog/Sox2 ratio was unchanged with an increased duration of ethanol exposure.
Time course of Sox2, Oct4, and Nanog expression during ES cell differentiation (0–4 days) exposed to ethanol (100 mM).
Single-cell distribution of Sox2, Oct4, and Nanog expression during ES cell differentiation identified three subpopulations affected by exposure to ethanol (Fig. 4C). A subpopulation of cells prominent in ES cells indicated by arrows (yellow peak) was characterized by high levels of Oct4-Sox2-Nanog (Oct4H-Sox2H-NanogH). This subpopulation persisted in cells exposed to ethanol for 4 days, while it was barely detected in 2-day differentiated control cells. The Oct4H-Sox2H-NanogH peak decreased with a time course that correlated with that of Oct4-positive and S8 cells (Fig. 4D, E). Two additional cell subpopulations (red peaks) that differed in the Oct4 level, Oct4H-Sox2H-NanogHH, and Oct4L-Sox2H-NanogHH were transiently upregulated at 2 days of differentiation, but this spike was attenuated by ethanol. Interestingly, this transient increase of Nanog that may serve to gate cells from spurious differentiation was lost in ethanol-exposed cells.
Analysis of the correlated expression of Sox2, Oct4, and Nanog in single cells during differentiation in the presence of ethanol resulted in distinct partitioning of cells among 8 sectors and differential effect of ethanol (Fig. 5A). The distribution of cells among sectors illustrates that a progressively increasing Oct4-positive population of differentiated cells becomes prominent as a function of ethanol exposure. The expression of Oct4 and Sox2 in cells across sectors, in relation to the proportion of each sector's cells, is shown in Fig. 5B and C, and defined in this context as the Oct4 or Sox2 trajectory. Note that the expression of a transcription factor in a sector is the average of single cell-based measurements. This analysis demonstrated that Oct4 was expressed in more S8 cells and at higher level in ethanol-exposed than control, resulting in a rather parallel trajectory. Likewise, Sox2 was expressed in more S8 cells in the ethanol-exposed group, but at a lower level after 4 days of exposure. This uneven Sox2 expression led to a trajectory in the ethanol-exposed group that diverted from that of control. Contrary to the behavior of S8 cells, Sox2 expression in S6 (Sox2+-Oct4—Nanog+) cells was instead attenuated by ethanol during differentiation, while the number of cells remained unchanged. Although data on all sectors are presented, we focused mainly on the sectors where the number of cells was adequate for statistical analysis, the sector contribution to the overall population was considerable, and transcription factor expression was above isotype cutoff. For these reasons, other sectors of interest, such as sector S5 (Sox2+-Oct4—Nanog-) and S7 (Sox2+-Oct4+-Nanog-), were analyzed as part of the Oct4-negative and Oct4-positive subpopulations, respectively (see Fig. 4D). The ethanol-induced asymmetric changes of Oct4 and Sox2 during differentiation produced a higher Oct4/Sox2 ratio in the S8 cell subpopulation (Fig. 5D), which matches the response of the overall cell population (Fig. 4B).
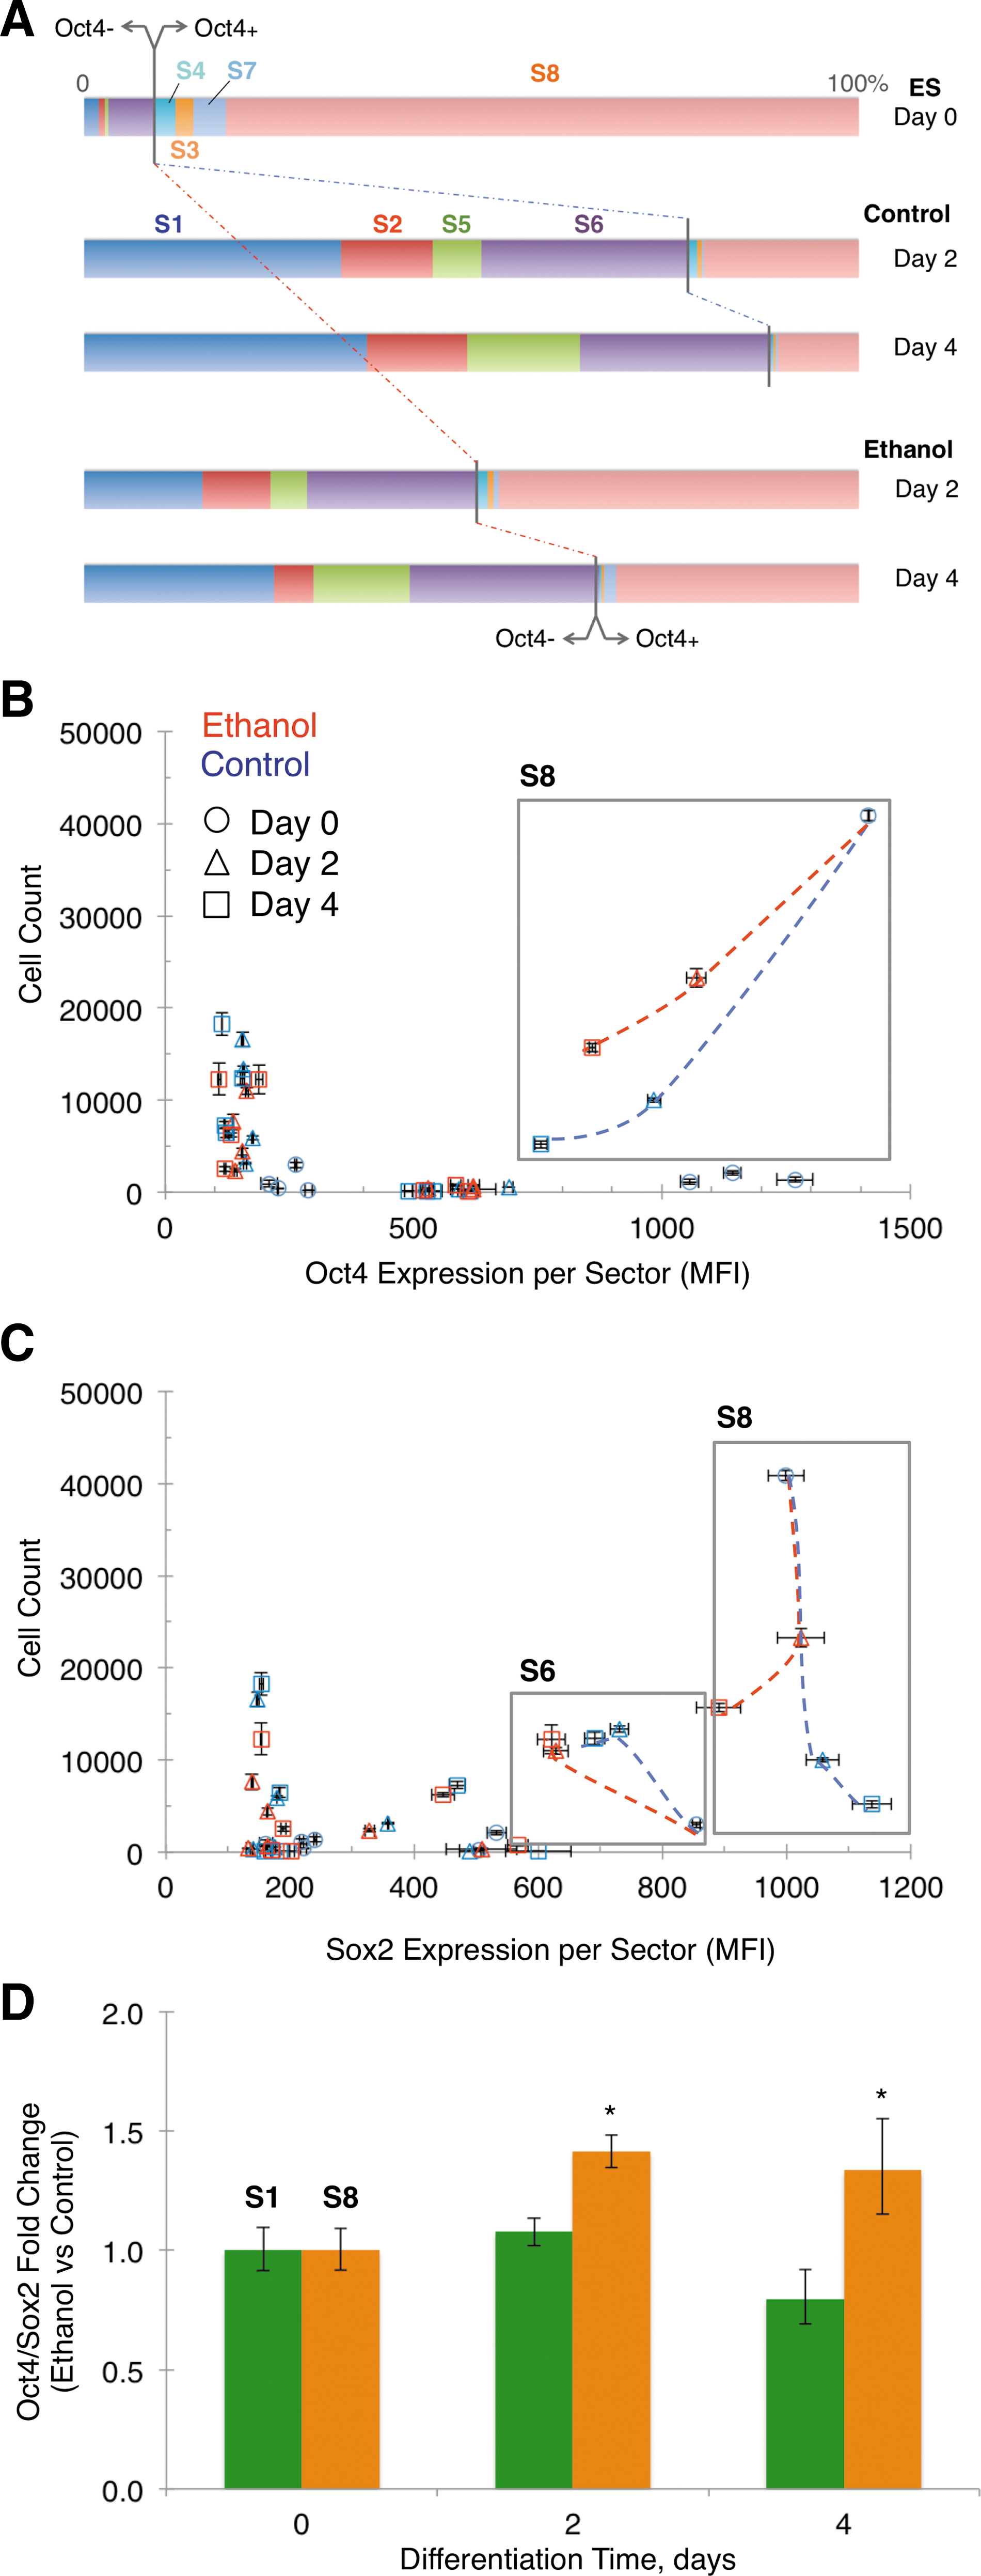
Cell count distribution and expression profiles of Sox2 and Oct4 in multivariate sectors during ES cell differentiation (2 and 4 days) in the presence or absence of ethanol (0 and 100 mM).
Decreased formation of neuronal cells with ethanol exposure
We followed phenotypically the differentiation of ES cells exposed to ethanol by immunocytochemistry. Undifferentiated ES cells were characterized by ALP-positive colonies (Fig. 6A), immunostaining for the pluripotency marker SSEA-1, and high expression of Sox2, Oct4, and Nanog (Fig. 6B). Upon ES cell differentiation, the number and size of colonies diminished, in parallel with the downregulation of the Sox2, Oct4, and Nanog levels (Fig. 4C). In the presence of ethanol, though there were twofold more residual colonies, and the decline of Sox2, Oct4, and Nanog was asymmetrically slowed down. Taken together, data imply that ethanol did not prevent exit of cells from pluripotency. To investigate if cells were delayed or held up with ethanol exposure, we studied the expression of the neural lineage markers nestin and β-III-tubulin. Immunostaining for these markers showed formation of abundant neural progenitor cells expressing nestin and the presence of few neuronal β-III tubulin positive cells in early differentiation, day 4 (Fig. 6C). By day 6 of differentiation, more neurons with long processes were formed in the control group. Conversely, a small number of immature neurons mainly with short processes were formed in ethanol-exposed cells. We deduce from these data that ethanol inhibited differentiation to the NE lineage and formation of mature neurons.
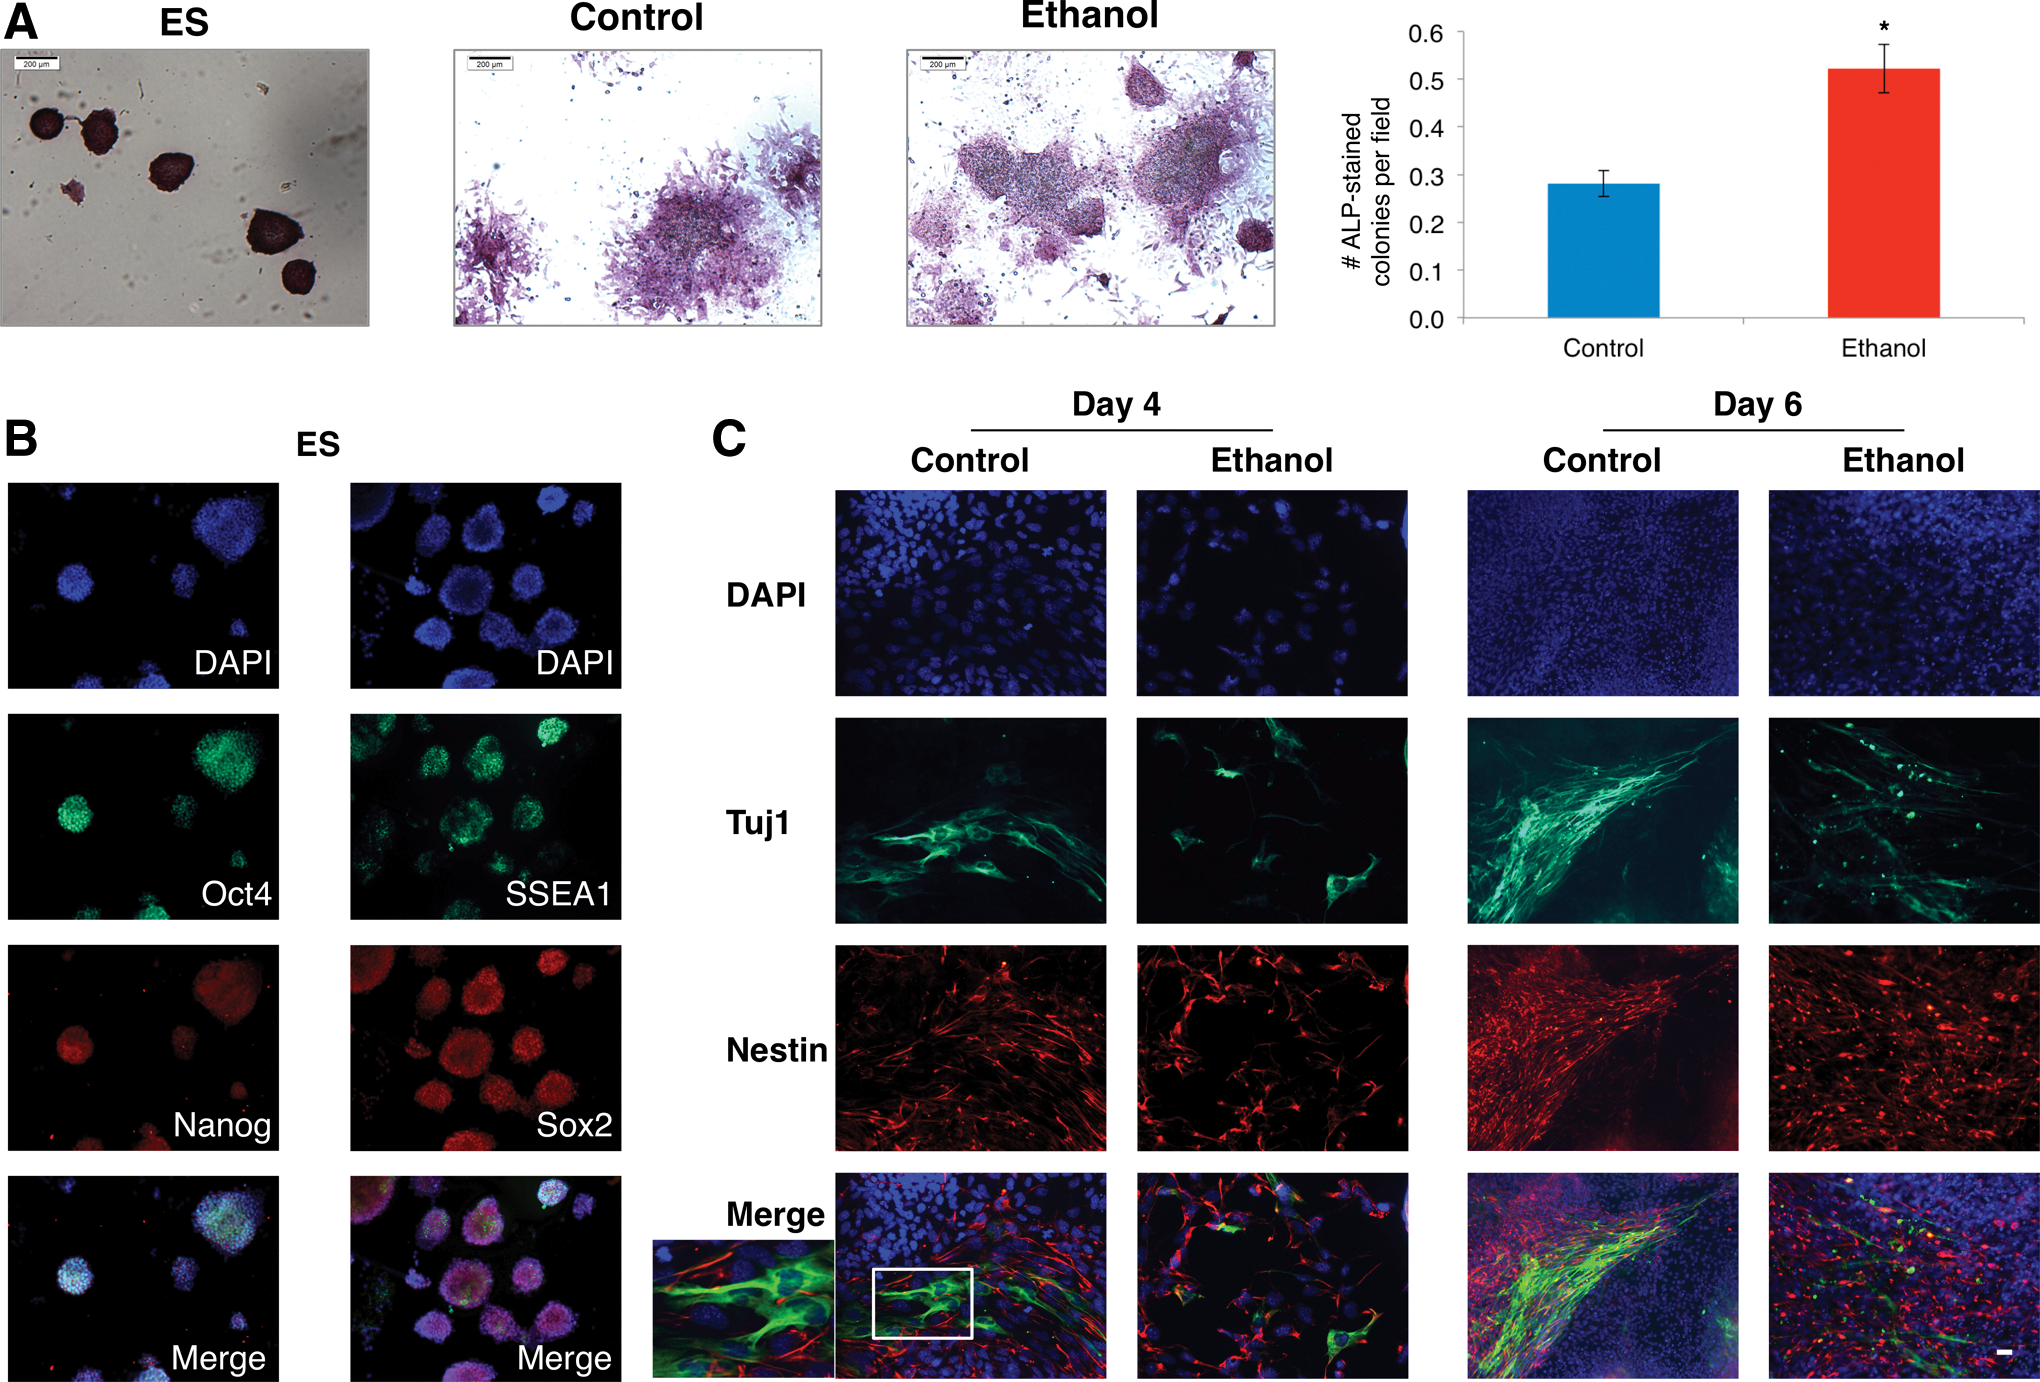
Immunocytochemical detection of transcription factors and pluripotency and neural lineage markers during differentiation in the presence of ethanol (0 and 100 mM).
Discussion
The work extends our understanding of ethanol interference with differentiation of mouse ES cells [5], and defines transcriptional changes as a function of ethanol dose, duration of exposure, and cell subpopulations. The earlier studies of undirected differentiation of ES cells to EB showed higher protein levels of transcription factors Sox2, Oct4, and Nanog with exposure to 100 mM ethanol for 6 days that was attributed to a delayed differentiation phenotype. Although the concentration of Sox2, Oct4, and Nanog is high in comparison to other transcription factors [64], the range required to sustain ES cell self-renewal and induce divergent developmental programs is critical. Specifically, when the protein level of Oct4 is upregulated relative to Sox2, its binding pattern to the genome is altered, and the ME genes are transcribed [25]. By contrast, transcription of the NE genes is activated by upregulated Sox2, which represses Oct4. Jointly Oct4, Sox2, and Nanog regulate more than 1000 genes, including their own [65], with most of their downstream targets been activated [66,67]. We therefore speculated that ethanol sustained a high Oct4 protein level in relation to Sox2, which likely suppressed NE, and promoted instead ME differentiation. In the present study, we asked how the ethanol's signal interfered with regulation of Sox2, Oct4, and Nanog at the single-cell level during RA-directed differentiation to NE.
We carried out single-cell measurements by multiplex flow cytometry to correlate the expression of Sox2, Oct4, and Nanog at the protein level, and uncover cellular heterogeneity. Such heterogeneity was found in the embryos and ES cells [68], but may be undetected in the ensemble average data, and even masked or biased by the relative amounts of cells in various subpopulations. We assessed the response of Sox2, Oct4, and Nanog to ethanol (dose and duration of exposure/differentiation time) in 100,000 single cells and report data on live single cells and clusters after in silico sorting. We also evaluated the closely related to differentiation processes of cell proliferation, cell cycle, apoptosis, and cell death. Pluripotency (ALP/SSEA-1) and neuronal phenotypes (nestin/β-III tubulin) were determined in the immunocytochemistry assays.
Our data showed that the expression of Oct4 remained higher in ethanol-exposed differentiated cells compared to the control (Fig. 1B, D), and in twofold excess over Sox2 (Fig. 1E). A less-than twofold increase of Oct4 in ES cells was sufficient to cause differentiation into ME [22], and an increased Oct4/Sox2 ratio during ES cell differentiation corroborated ME lineage specification [25]. Thus, our findings established an ethanol-mediated twofold Oct4 variation, which is sufficient to direct the ME cell fate.
To figure out if ethanol exposure favored higher Oct4 expression in specific cell subsets, we performed an 8-sector analysis in 50,000 single cells (Fig. 2A), and visualized expression of Sox2, Oct4, and Nanog at a single-cell level in trivariate graphs (Fig. 2E). In 3-day differentiated cells, negative S1 and positive S8 cell subpopulations represented ∼80% of all counts, and corresponded to the two major peaks in trivariate plots. With increasing ethanol concentrations, cells were redistributed to the S8 and other Oct4-positive subpopulations (Fig. 2A–C), indicating a switch in cell populations underlying the increase of Oct4 expression seen in average data (Fig. 1B, D). The population of S8 cells exhibited an elevated Oct4/Sox2 ratio as a function of ethanol dose, which matched the trend of the overall cell population (Figs. 1E and 2D), Although Oct4 expression was higher in S8 cells after ethanol exposure, the Nanog level was lowered (Fig. 2C). As cells with low Nanog expression lose their pluripotency earlier than cells with higher Nanog levels [69], the expression pattern of Sox2, Oct4, and Nanog in S8 cells suggests that ethanol-exposed cells were differentiated beyond the Nanog gatekeeper barrier.
Oct4 regulates several genes related to cell cycle and apoptosis, and downregulation of Oct4 during differentiation correlates positively with transcription of apoptotic genes and lineage commitment [56]. In our system, a twofold variation in the Oct4 protein level between differentiated cells exposed to ethanol and control cells did not translate into differences in the overall cell proliferation rate, cell cycle phase distribution, or apoptotic cells (Fig. 3). Oxidative stress caused by ethanol that may produce apoptosis [70] was countered by the presence of β-mercaptoethanol in our culture, and can be recapitulated in antioxidant-free conditions. Reduced cell proliferation and increased apoptosis have been found at later developmental stages, as in E8.25 cultured mouse embryos exposed to ethanol [71], and in astrocytes exposed to ethanol in culture that underwent anoikis, a form of programmed cell death whereby the contact of cells with the extracellular matrix is lost [72].
Cells exposed to ethanol followed an altered differentiation pathway compared to the control. These cells had a higher expression of Sox2, Oct4, and Nanog (Fig. 4A), and the Oct4/Sox2 ratio (Fig. 4B). At the single-cell level (Fig. 4C), we found that ethanol blunted the upregulation of the Oct4H-Sox2H-NanogHH and Oct4L-Sox2H-NanogHH subpopulations (red peaks) during the first 2 days of differentiation, and eventually retained a bigger Oct4H-Sox2H-NanogH cell subpopulation (yellow peak). These finding suggested that ethanol lowered the Nanog protective barrier that opposes spurious differentiation signals in early stages of differentiation [73], an event facilitating differentiation [74]. Note that cells in this peak included most of the Oct4-positive cells and those of the S8 subpopulation that have a similar response to ethanol (Fig 4D, E). Trajectory analysis of Oct4 and Sox2 in different sectors reflected a switching of the S1 to S8 cells that resulted in a higher Oct4/Sox2 ratio (Fig. 5).
The lineage fate as driven by a balance of Oct4 and Sox2 was proposed earlier [74] based on up- and downregulated expression experiments, and reconfirmed through directed differentiation to the NE and ME lineages [25] using the same ES cell line (E14Tg2a) as in our study. Our results implicate these mechanisms as an underlying ethanol action in diverting cells from NE. The in situ measurements of the neural lineage markers showed that the formation of neural progenitors (nestin immunoreactive) and neurons (β-III tubulin immunoreactive) was severely attenuated in ethanol-exposed cells (Fig. 6C). Moreover, ethanol-exposed cells maintained an immature neuronal phenotype even after extended differentiation for 6 days.
Our single-cell protein expression approach has the most sensitivity in identifying the affected subpopulations, which may be entirely missed or misinterpreted in population average-based methods. Nevertheless, in a complementary study [57], we performed a timeseries analysis using RT-qPCR and immunocytochemistry of transcription factors and lineage markers to further extend the single-cell-based protein expression to gene regulation, as well provide further insights into the aberrant effects of ethanol. Our pathway-scale gene expression results were consistent with protein data of ethanol-mediated imbalance of Oct4 and Sox2 in early differentiation, and indicated a diverted differentiation trajectory and an altered cell fate. Our interpretation of the single-cell scale data is building on these results to understand how ethanol alters the cell fate during differentiation. We propose a model (Fig. 7) of ethanol reprogramming of the regulatory network of Oct4, Sox2, and Nanog that may lead to an aberrant NE fate. In the schematic of the Waddington epigenetic landscape [75,76], ES cells are depicted in a dynamic state at the top of the hill together with a metastable differentiation-responsive state based on Nanog expression. The circuit of Oct4, Sox2, and Nanog mutually regulates each other's opposing fate-determining actions to keep the ES cells in an undifferentiated state. In early differentiation, allowed by a decreased Nanog level, Oct4 and Sox2 control cell fate decisions. In the presence of RA, a high Sox2 level relative to Oct4 drives cells toward the NE fate. Ethanol disturbs the balance of transcription factors favoring a higher Oct4/Sox2 ratio that pushes the cell to the ME fate in spite of the NE-inductive RA signal.
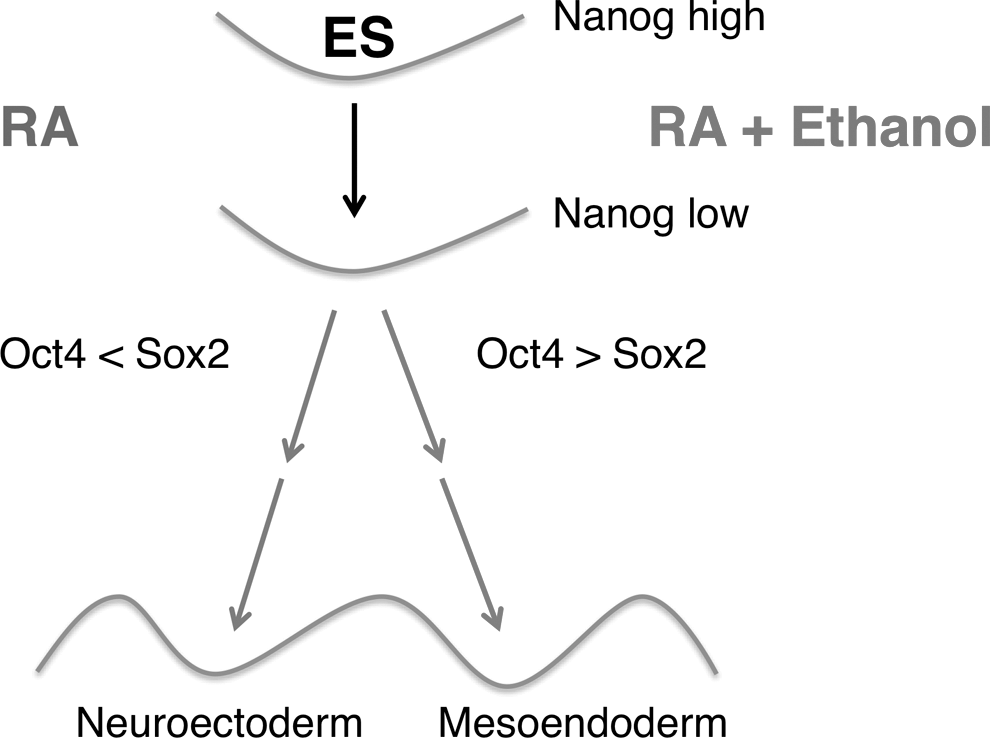
Model of the reprogrammed regulatory network of Oct4, Sox2, and Nanog that may lead to aberrant neuroectodermal fate with ethanol. The inherently heterogeneous ES cell population is able to interconvert between a fully pluripotent (high Nanog) and a metastable lineage-primed state (low Nanog). Developmental and environmental signals, such as ethanol, control Oct4, and Sox2 levels and cell fate decisions. In the presence of NE-inductive RA signal, the high Sox2 level relative to Oct4 induces cells to the NE fate. Ethanol favors a higher Oct4/Sox2 ratio that diverts cells to the ME fate. The wavy line indicates lineage valleys and in-between barriers that do not permit spontaneous interconversion from one lineage to another.
A differential distribution of Sox2, Oct4 and Nanog expression among cell subpopulations, which is linked to differentiation potential to select lineages, has been observed in vivo in the epiblast before gastrulation on E6 [77]. The temporal profile of ethanol-induced changes on Sox2 and Oct4, as early as after 2 days of differentiation, corresponds to E5.5 (=E3.5+2) (Fig. 4A–C), and suggests that ethanol may have an effect on transcription factors before gastrulation. Several of the teratogenic effects of ethanol on the developing embryo have been traced back in early gastrulation [13,78,79]. Of the cell types involved in the formation of brain precursors at this stage, the cells of the mesodermal layer are probable ethanol targets. Ethanol-induced abnormalities in gastrulating mesodermal cells can account, directly or through defective formation and differentiation of neuroepithelial cells, for deficiencies in forebrain and skeletal defects observed in FAS. Therefore, our data link small variations in the levels of Oct4 and Sox2 caused by ethanol before gastrulation to profound effects on cell fate decisions.
In conclusion, our work characterized the ethanol action on the core transcriptional network at the protein level during ES cell differentiation to NE. We found that the balance of Oct4 and Sox2 was tilted toward Oct4 by ethanol. We propose that the increased Oct4 expression misguided differentiation to ME, which would have been otherwise opposed by Sox2, if the latter was available in adequate amounts. In the absence of ethanol, high Sox2 expression blocked the Oct4 differentiation drive to ME and ES cells differentiated to NE in a default program driven by endogenous RA. While changes in the concentration of the transcription factors were detected at the transcript level in a complementary article, they were further amplified at the protein level, pushing cells toward different fates. Defining the Oct4-associated proteins in its 92-membered interactome [80] affected by exposure of differentiating cells to ethanol will potentially illuminate the lineage deviation process. Moreover, ethanol promoted an elevated Oct4/Sox2 ratio in distinct cell subpopulations that served as a lineage marker, before lineage-specific determinants such as nestin and β-III tubulin were activated. Exposure of differentiating ES cells to ethanol within the E5.5–E7.5 window that misguided lineage specification coincided with the most vulnerable to the ethanol GD7 stage in the developing mouse embryo and underlying reprogramming of the genetic networks [81]. Our findings point to a critical embryonic development period for lineage selection that is susceptible to ethanol, and provide the opportunity to explore the underlying molecular determinants that influence fetal programming and the risk of FAS.
Footnotes
Acknowledgments
This work has been supported by the ABMRF (HA), Thomas Jefferson University Pilot Award (HA and RV), and the Graham Fund (HA). Joshua Ogony was supported by training grant postdoctoral fellowship (T32 AA007563). The authors would like to thank Dr. Jan Hoek for his mentoring (K05 AA017261), Sreekanth Rajagopalan for multivariate data analysis, PSTP interns Mizan Gaillard and NCrai Pittman for preliminary ethanol dose data, and Amrita Sukhavasi for help with immunocytochemistry. FACS data were obtained at Jefferson's KCC Flow Cytometry Shared Resource with assistance from Matthew Farabaugh.
Author Disclosure Statement
No competing financial interests exist.