
Abstract
Sperm abnormalities are one of the main factors responsible for male infertility; however, their pathogenesis remains unclear. The role of microRNAs in the development of sperm abnormalities in infertile men has not yet been investigated. Here, we used human induced pluripotent stem cells to investigate the influence of miR-122 expression on the differentiation of these cells into spermatozoa-like cells in vitro. After induction, mutant miR-122-transfected cells formed spermatozoa-like cells. Flow cytometry of DNA content revealed a significant increase in the haploid cell population in spermatozoa-like cells derived from mutant miR-122-transfected cells as compared to those derived from miR-122-transfected cells. During induction, TNP2 and protamine mRNA and protein levels were significantly higher in mutant miR-122-transfected cells than in miR-122-transfected cells. High-throughput isobaric tags for relative and absolute quantification were used to identify and quantify the different protein expression levels in miR-122- and mutant miR-122-transfected cells. Among all the proteins analyzed, the expression of lipoproteins, for example, APOB and APOA1, showed the most significant difference between the two groups. This study illustrates that miR-122 expression is associated with abnormal sperm development. MiR-122 may influence spermatozoa-like cells by suppressing TNP2 expression and inhibiting the expression of proteins associated with sperm development.
Introduction
Major chromatin restructuring occurs in elongating and condensing spermatids, which are in turn replaced by protamines (PRMs) [12 –15]. TNPs are arginine- and lysine-rich basic proteins that strongly bind to DNA, and are expressed exclusively in postmeiotic haploid spermatids. In mice, TNP2 mRNAs are first detected in step 7 round spermatids, and are then degraded at steps 13 and 14, respectively [12,14,15]. Furthermore, TNPs are phosphorylated by sperm-specific protein kinase A, and this phosphorylation/dephosphorylation cycle has been found to play an important role in the chromatin condensation process [9 –11]. TNPs are removed from condensing chromatin and replaced by PRMs [13], which constitute the major nuclear proteins of condensed spermatids and mature spermatozoa [12,14 –16]. Miyagawa et al. demonstrated single-nucleotide polymorphisms (SNPs) and specific variability in the TNP genes of sterile male patients [1]. Moreover, Tseden et al. used transgenic mice to confirm that premature translation of TNP2 mRNA could result in abnormal head morphogenesis, reduced sperm motility, and male infertility [7]. Furthermore, Shirley et al. suggested that each TNP fulfilled a unique function during spermiogenesis, even though the sperm phenotypes strongly indicated that the defects were largely attributable to an overall gene dosage effect [8]. They reported that TNP null mutant mice were subfertile, while mice lacking both TNP genes were infertile, indicating that the sperm of TNP-null double-mutant mice tended to have abnormalities and reduced reproductive capacity [8]. Therefore, these results clearly illustrate that strict temporal and stage-specific translation of TNP is necessary for the correct differentiation of round spermatids into mature spermatozoa and for male fertility.
Furthermore, other studies have demonstrated the importance of PRMs in the morphogenesis and function of mature spermatozoa [17,18]. PRMs are a diverse family of small arginine-rich proteins that have been found to be synthesized in the late-stage spermatids of many animals and plants. These PRMs bind to DNA, condensing the spermatid genome into a genetically inactive state [17]. They are characterized by a number of arginine residue stretches separated by neutral amino acids. Fiber-diffraction diagrams from reconstituted nucleoprotamine and whole sperm cells indicated that the DNA molecules were tightly packed in a hexagonal unit cell, and that DNA was in a B-like structure with 10 base pairs per helical turn [18]. PRM1 and PRM2, the two PRMs found in mammals, are the most widely studied. Sperm DNA is packaged by PRM1 in all mammals, whereas PRM2 is present only in the sperm of primates, several species of rodents, and a subset of other placental mammals. Both PRMs are phosphorylated soon after their synthesis; however, after binding to DNA, most phosphate groups are removed and cysteine residues are oxidized, forming disulfide bridges linking the PRMs [17]. PRM2 (but not PRM1) is synthesized as a precursor that undergoes proteolytic processing after binding to DNA. It also binds to a zinc atom, albeit its function is not yet known [17,18].
We previously determined the importance of TNPs and PRMs in sperm maturation [19]; however, very little is known about the mechanisms by which they are regulated during sperm development. MicroRNAs (miRNAs), a class of ∼22-nucleotide (nt) noncoding RNAs, participate in diverse biological functions by promoting the degradation or inhibiting the translation of their target mRNAs [19 –27]. Recent findings that individual miRNAs are expressed during spermatogenesis in a developmental stage-specific manner suggest that miRNAs participate in male germ cell development, by contributing to cell type-specific protein expression profiles during spermatogenesis [20]. Yu et al. first reported that miR-122 negatively regulates Tnp2 mRNA by endonucleolytic cleavage, due to specific base pair interactions of miR-122 with its complementary binding sequence in the 3′-untranslated region (3′-UTR) of Tnp2 mRNA [21]. Meanwhile, Dai et al. also revealed that expression of testis-specific miR-469 bound to the coding region and repressed the translation of Tnp2 and Prm2 mRNA, to regulate the development and maturation of sperm cells [20].
On the other hand, in a previous study, miRNA microarray analysis was used to identify the miRNAs that are differentially expressed in abnormal infertile semen and normal fertile semen [19]. Microarray analysis revealed significant overexpression of 21 miRNAs in abnormal semen, as compared to normal semen. Furthermore, 31 miRNAs were expressed at significantly lower levels in abnormal semen than in normal semen (Supplementary Table S1; Supplementary Data are available online at
Materials and Methods
Human iPS cells cultured, embryoid bodies formation, and induced differentiation into spermatozoa-like cells
The human iPS cells were generated as previously described [27,28]. Briefly, iPS cultures were separated from the feeder cells by treatment of 0.125% trypsin–EDTA solution and plated onto and co-cultured with MEFs. The cells were cultured in DMEM:F12 (1:1) medium supplemented with 15% KnockOut™ Serum Replacement, 1 mM sodium pyruvate, 2 mM
All steps were followed as previously described [29
–32]. Briefly, for the formation embryoid bodies (EBs), the iPS cells were dissociated with 0.125% trypsin–EDTA solution and suspended onto Petri dishes with full medium for 6 days. Then, to induce EB differentiation, day 6 EBs were cultured in induced cell-conditioned medium [DMEM: F12 (1:1) medium supplemented with 5% KnockOut™ Serum Replacement, 1 mM sodium pyruvate, 2 mM
Recombinant lentivirus generation vector construction and cell transfection
All steps of recombinant lentivirus package were according to the previously described [21,24,26,27]. The Ltv-miR-122 and Ltv-miR-122-mut lentivirus were built by Genepharma Corporation, and the methods of lentivirus transfected were according to the company's instructions. In addition, the negative control Ltv-miR-122-mut was similarly built, except that 22 nucleotides in sequences corresponding to miR-122 see sequences were mutated (change TGGAGTGTGACAATGGTGTTTG to TtcgGaGTtACAATGGcGTaaG, mutations shown in lower case). Briefly, human iPS cells were co-transfected to use 4×10⁷ PFU/mL Ltv-miR-122 or Ltv-miR-122-mut lentivirus, respectively, according to the manufacturer's protocol. The iPS cells were seeded in a six-well plate and cultured in DMEM:F12 (1:1) medium supplemented with 15% KnockOut™ Serum Replacement, 1 mM sodium pyruvate, 2 mM
Luciferase report assay
All steps of the luciferase report assay were in accordance to the previously described [24 –27]. NIH-3T3 cells were seeded at 3×10⁴/well in 48-well plates and co-transfected with 400 ng of Ltv-miR-122 or Ltv-miR-122-mut vectors, 20 ng of pGL3-TNP2-3UTR-WT or pGL3-TNP2-3UTR-Mut, and pGL-TK (Progema) using Lipofectamine 2000 Reagent according to the manufacturer's protocol. After 48 h transfection, luciferase activity was measured using the dual-luciferase reporter assay system (Progema).
RNA extraction and analysis by quantitative real-time PCR
Total RNA from each cell was isolated with Trizol Reagent (Invitrogen, Life Technologies Corporation), according to the manufacturer's protocol. Briefly, sperm samples or cells (3×10⁸/mL) were collected and added 0.8 mL Trizol Reagent. After incubating the sample for 5 min, 0.2 mL of chloroform was added, and the tubes were vigorously shook and incubated for 2 min. The samples were centrifuged 12,000 rpm for 15 min at 4°C. Then, the aqueous phases were transferred to clean tubes, and 0.4 mL of Isopropanol was added, and mixed. After centrifuging again, the total RNA could be collected. The RNA samples were treated with DNase I (Sigma-Aldrich), quantified, and reverse-transcribed into cDNA with the ReverTra Ace-First Strand cDNA Synthesis Kit [Toyobo, Toyobo (Shanghai) Biotech Co., Ltd.]. Quantitative real-time PCR was conducted with a RealPlex4 real-time PCR detection system from Eppendorf, with SyBR Green RealTime PCR Master Mix [Toyobo, Toyobo (Shanghai) Biotech Co., Ltd.] as the detection dye. Quantitative real-time PCR amplification was performed over 40 cycles with denaturation at 95°C for 15 s and annealing at 58°C for 45 s. Target cDNA was quantified with the relative quantification method. A comparative threshold cycle (Ct) was used to determine gene expression relative to a control (calibrator), and steady-state mRNA levels are reported as an n-fold difference relative to the calibrator. For each sample, the maker gene Ct values were normalized with the formula ΔCt=Ct_genes – Ct_18S RNA. To determine relative expression levels, the following formula was used: ΔΔCt=ΔCt_all_groups – ΔCt_control_group. The values used to plot relative expressions of markers were calculated with the expression 2−ΔΔCt. The mRNA levels were calibrated on the basis of levels of 18S rRNA. The cDNA of each gene was amplified with primers as Table 1 descriptions.
Northern blotting analysis
All steps of northern blotting were according to the previously described [26,27,33]. For all groups, 20 μg of good quality total RNA was analyzed on a 7.5 M ureum and 12% PAA denaturing gel and transferred to a Hybond N+ nylon membrane (Amersham). Membranes were crosslinked using UV light for 30 s at 1,200 mJ/cm2. Hybridization was performed with the miR-122 antisense starfire probe, 5′- CAAACACCATTGTCACACTCCA-3′, to detect the 22-nt miR-122 fragments according to the instruction of the manufacturer. After washing, membranes were exposed for 20–40 h to Kodak XAR-5 films (Sigma-Aldrich).
Western blotting analysis
Cells were lysed using a 2× loading lysis buffer (50 mM Tris–HCl, pH 6.8, 2% sodium dodecyl sulfate, 10% β-mercaptoethanol, 10% glycerol, and 0.002% bromophenol blue). The total amount of proteins from the cultured cells was subjected to 12% SDS-PAGE and transferred onto Hybrid-PVDF membranes (Millipore). After blocking with 5% (w/v) nonfat dried milk in TBST (Tris-buffered saline containing Tween-20) (25 mM Tris/HCl, pH 8.0, 125 mM NaCl and 0.05% Tween-20), the PVDF membranes were washed 4 times (15 min each) with TBST at room temperature and incubated with primary antibody (Table 2). Following extensive washing, membranes were incubated with HRP-conjugated goat anti-rabbit IgG secondary antibody (1:1,000; Santa Cruz Technology) for 1 h. After washing 4 times (15 min each) with TBST at room temperature, the immunoreactivity was visualized by enhanced chemiluminescence using ECL kit from Perkin-Elmer Life Science.
IF, immunofluorescence staining; WB, western blotting analysis.
Immunofluorescence staining
The cultured cells were washed 3 times with PBS and fixed with 4% paraformaldehyde (Sigma-Aldrich) for 30 min. After blocking, the cells were incubated first with primary antibodies (Table 2) overnight at 4°C, and then with Cy3-conjugated goat anti-rabbit IgG antibody (1:200; Sigma-Aldrich) and 5 μg/mL DAPI (Sigma-Aldrich) at room temperature for 30 min. Then, the cells were thoroughly washed with TBST and viewed through a fluorescence microscope (DMI3000; Leica).
Alkaline phosphatase staining
Alkaline phosphatase (AP) activity of human iPS cells, which were cultured on MEFs, was determined using the AP substrate kit (Sigma-Aldrich) according to the manufacturer's instructions [28].
Flow cytometric analysis of DNA content by PI staining
All steps were according to the previously described [29 –32]. Briefly, each group cells was washed by PBS on three times, and fixed in 70% ice-cold ethanol, and kept in a freezer more than 48 h. Before flow cytometric analysis, the fixed cells were centrifuged, washed twice with PBS, and resuspended in PI staining solution (Sigma Chemicals) containing 25 μg/mL PI and 40 μg/mL RNase A (Sigma Chemicals) and 0.3% Tween-20 (Sigma-Aldrich). The cell suspension, which was hidden from light, was incubated for 20 min at 4 C and analyzed using the FACS (Quanta SC, Beckman Coulter). A total of 10,000 events were acquired for analysis, and the relative numbers of cell types, such as spermatid-like cells (1C=haploid), somatic cells, or iPS cells (2C=diploid) and primary spermatocyte-like cells (4C=tetraploid) were calculated using CellQuest software.
Teratoma formation
All animal procedures were carried out at Shanghai Tongji University with Institutional Animal Care and Use Committee approval in accordance with institutional guidelines. The 1×10⁶ human iPS cells were inoculated into the hind leg of severe combined immunodeficient (SCID) mice. Teratomas were embedded in paraffin and histologically examined after hematoxylin and eosin staining. The procedure of teratoma formation experiment was performed as described [28].
Cell protein extraction, digestion, and labeling with iTRAQ reagents and data analysis
All steps of protein extraction and labeling were according to the previously described [34 –43]. Protein identification and quantification for iTRAQ samples were carried out using ProteinPilot software (version 3.0; Applied Biosystems, MDS-Sciex). The search was performed against IPI human database (version 3.45). The search was performed using Paragon Algorithm, which is discussed in detail elsewhere. Only those proteins identified with at least 95% confidence were taken into account. All results were then exported into Excel for manual data interpretation [34 –43].
Statistical analysis
Each experiment was performed as least three times, and data are shown as the mean±SE where applicable, and differences were evaluated using Student's t-tests. The probability of<0.05 was considered to be statistically significant.
Results
Analysis and identification of miR-122 and the 3′-UTR of TNP2 mRNA
The precursor miRNA sequences, mature miRNA sequences, chromosomal locations, and the length of miR-122 and the target gene TNP2 were analyzed in several species using the online miRBase Target database (
Pluripotency of iPS cells after differentiation into spermatozoa-like cells
We previously reported the successful generation of iPS cells from CD34+ human amniotic fluid cells (HuAFCs) by transduction with lentiviral constructs encoding only Oct4 [28]. In this study, we assayed the pluripotency of iPS cells. The AP activity of human iPS cells was very high, as represented by deep blue staining on the surface of the colonies (Fig. 1). In addition, immunofluorescence (IF) staining revealed that the expression levels of the pluripotent stem cell markers Nanog and Oct4 were increased in the iPS colonies (Fig. 1). Similar to the results of the IF staining, qRT-PCR analysis revealed that the expression levels of these stem cell markers were ∼150-fold higher in human iPS cells than in HuAFCs (Fig. 1). In addition, in the in vivo xenograft experiments, SCID mice that were injected with iPS cells developed teratomas on the legs. Meanwhile, the iPS-derived teratomas contained cellular representatives of all three germ layers (Fig. 1). Based on these results, we concluded that the human iPS cells derived from HuAFCs possessed strong pluripotency.
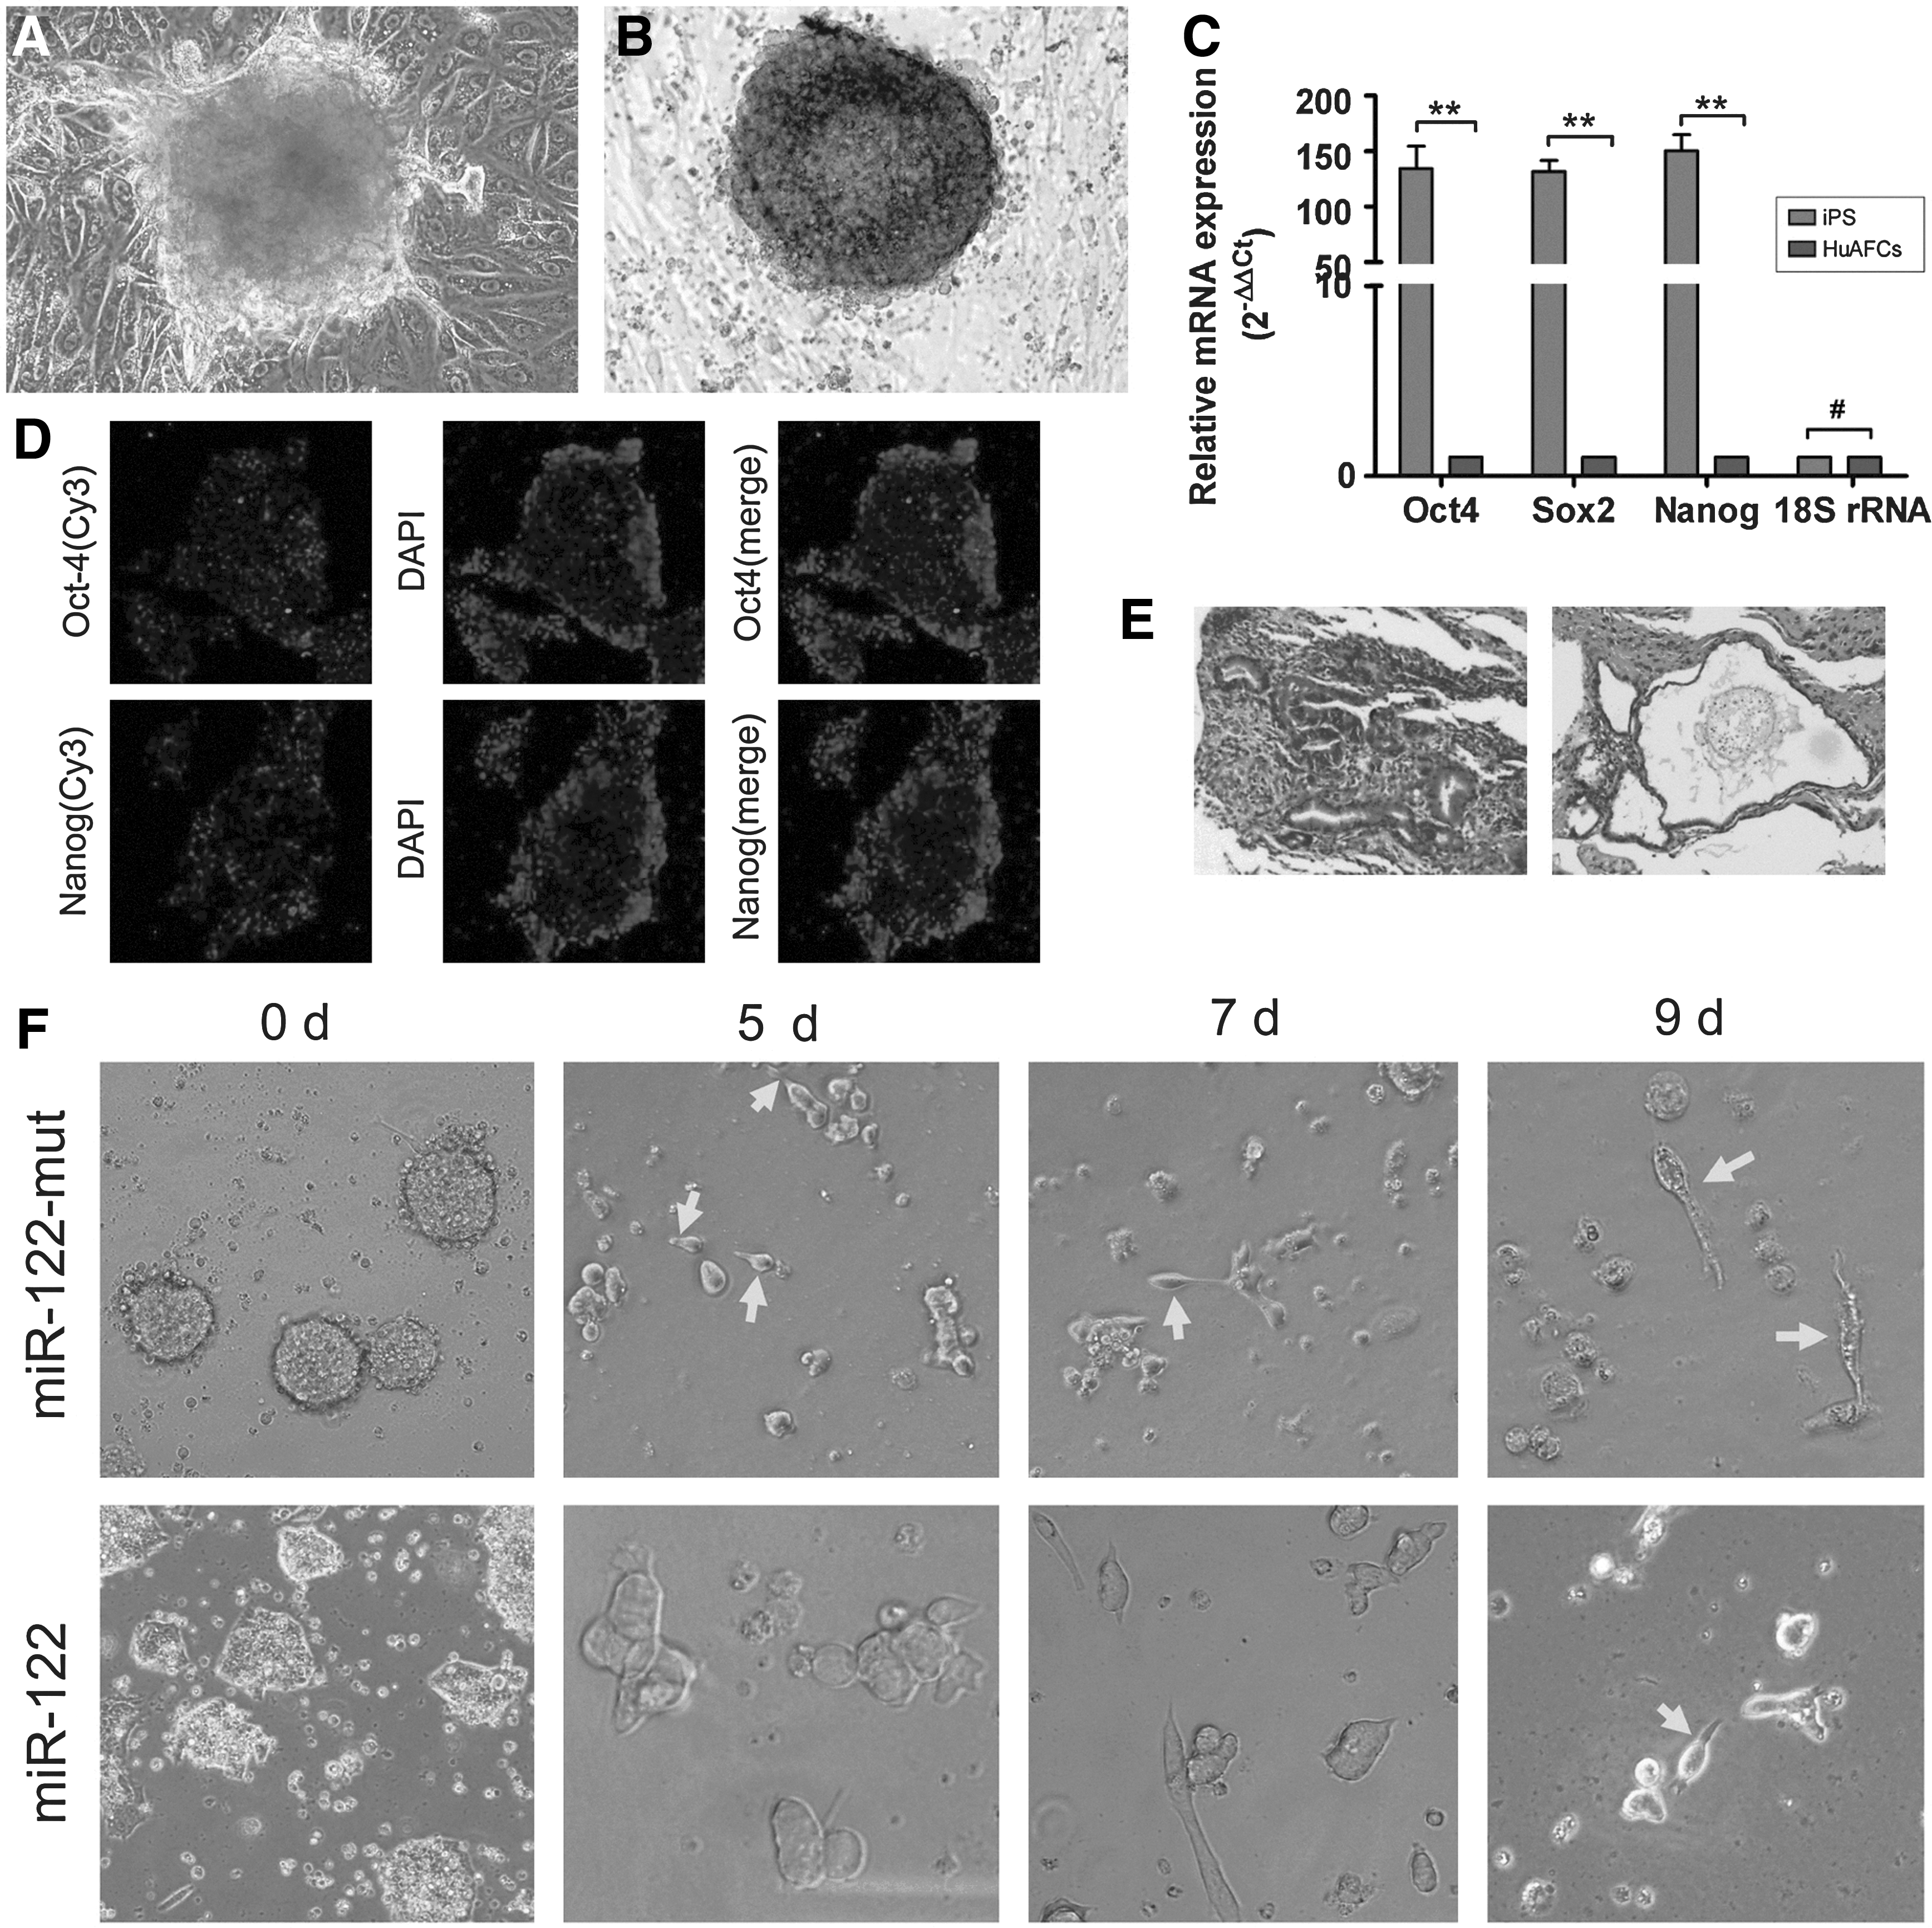
Characterization of reprogrammed human induced pluripotent stem (iPS) cells differentiated into spermatozoa-like cells.
In order to induce the in vitro differentiation of iPS cells into spermatozoa-like cells, the specific cell inducing factors were used. After defining the EB cell formation, miR-122-transfected and miR-122-mut-transfected cells were allowed to differentiate for 10 days. Five days after induction, bright-field microscopy revealed elongated unilateral projections on some miR-122-mut-transfected iPS cells. However, the miR-122-transfected cells did not show this morphology at 5 days after induction (Fig. 1). Over time, the number of cells with protrusions increased and the cell protrusions became more slender in the miR-122-mut-transfected group. At 9 days after induction, the majority of iPS cells transfected with miR-122-mut exhibited a similar morphology to human spermatozoa, with a tapering head and long tail. However, this morphology was not visible in the miR-122-transfected cells.
miR-122 reduces the ability of iPS cells to express spermatozoa markers during induction
First, we used immunofluorescent analysis of several markers of spermatozoa to determine whether the induced cells were spermatozoa-like cells. IF staining was performed 9 days after induction, to compare the expression levels of a somatic cells marker (histone 3) and male germ cell markers (PRM and TNP2) in both groups. The protein expression levels of PRM and TNP2 were elevated in the miR-122-mut-transfected iPS group, compared with the miR-122-transfected iPS group. However, after differentiation, the expression levels of histone 3 were lower in the miR-122-mut-transfected iPS cells than the miR-122-transfected iPS cells. Next, flow cytometry analysis (FCA) was used to analyze the DNA content and haploid subpopulation during the induction. On day 0, the DNA contents of the two groups showed no significant difference (Fig. 2), consisting largely of the 2C DNA population and a small population of 4C DNA cells. However, at day 9 after induction, FCA data clearly showed a typical 1C peak, followed by a 2C peak and a 4C peak in the miR-122-transfected iPS cells, suggesting that miR-122-mut-transfected iPS cells contained ∼10.2% of haploid cells (Table 3). However, although the 1C peak was consistently present in the miR-122-transfected iPS cells, these cells had a significantly lower population of haploid cells (4.08%) than the miR-122-mut-transfected group. These results suggest that reduced expression of miR-122 increased the ability of iPS cells to differentiate into spermatozoa-like cells.
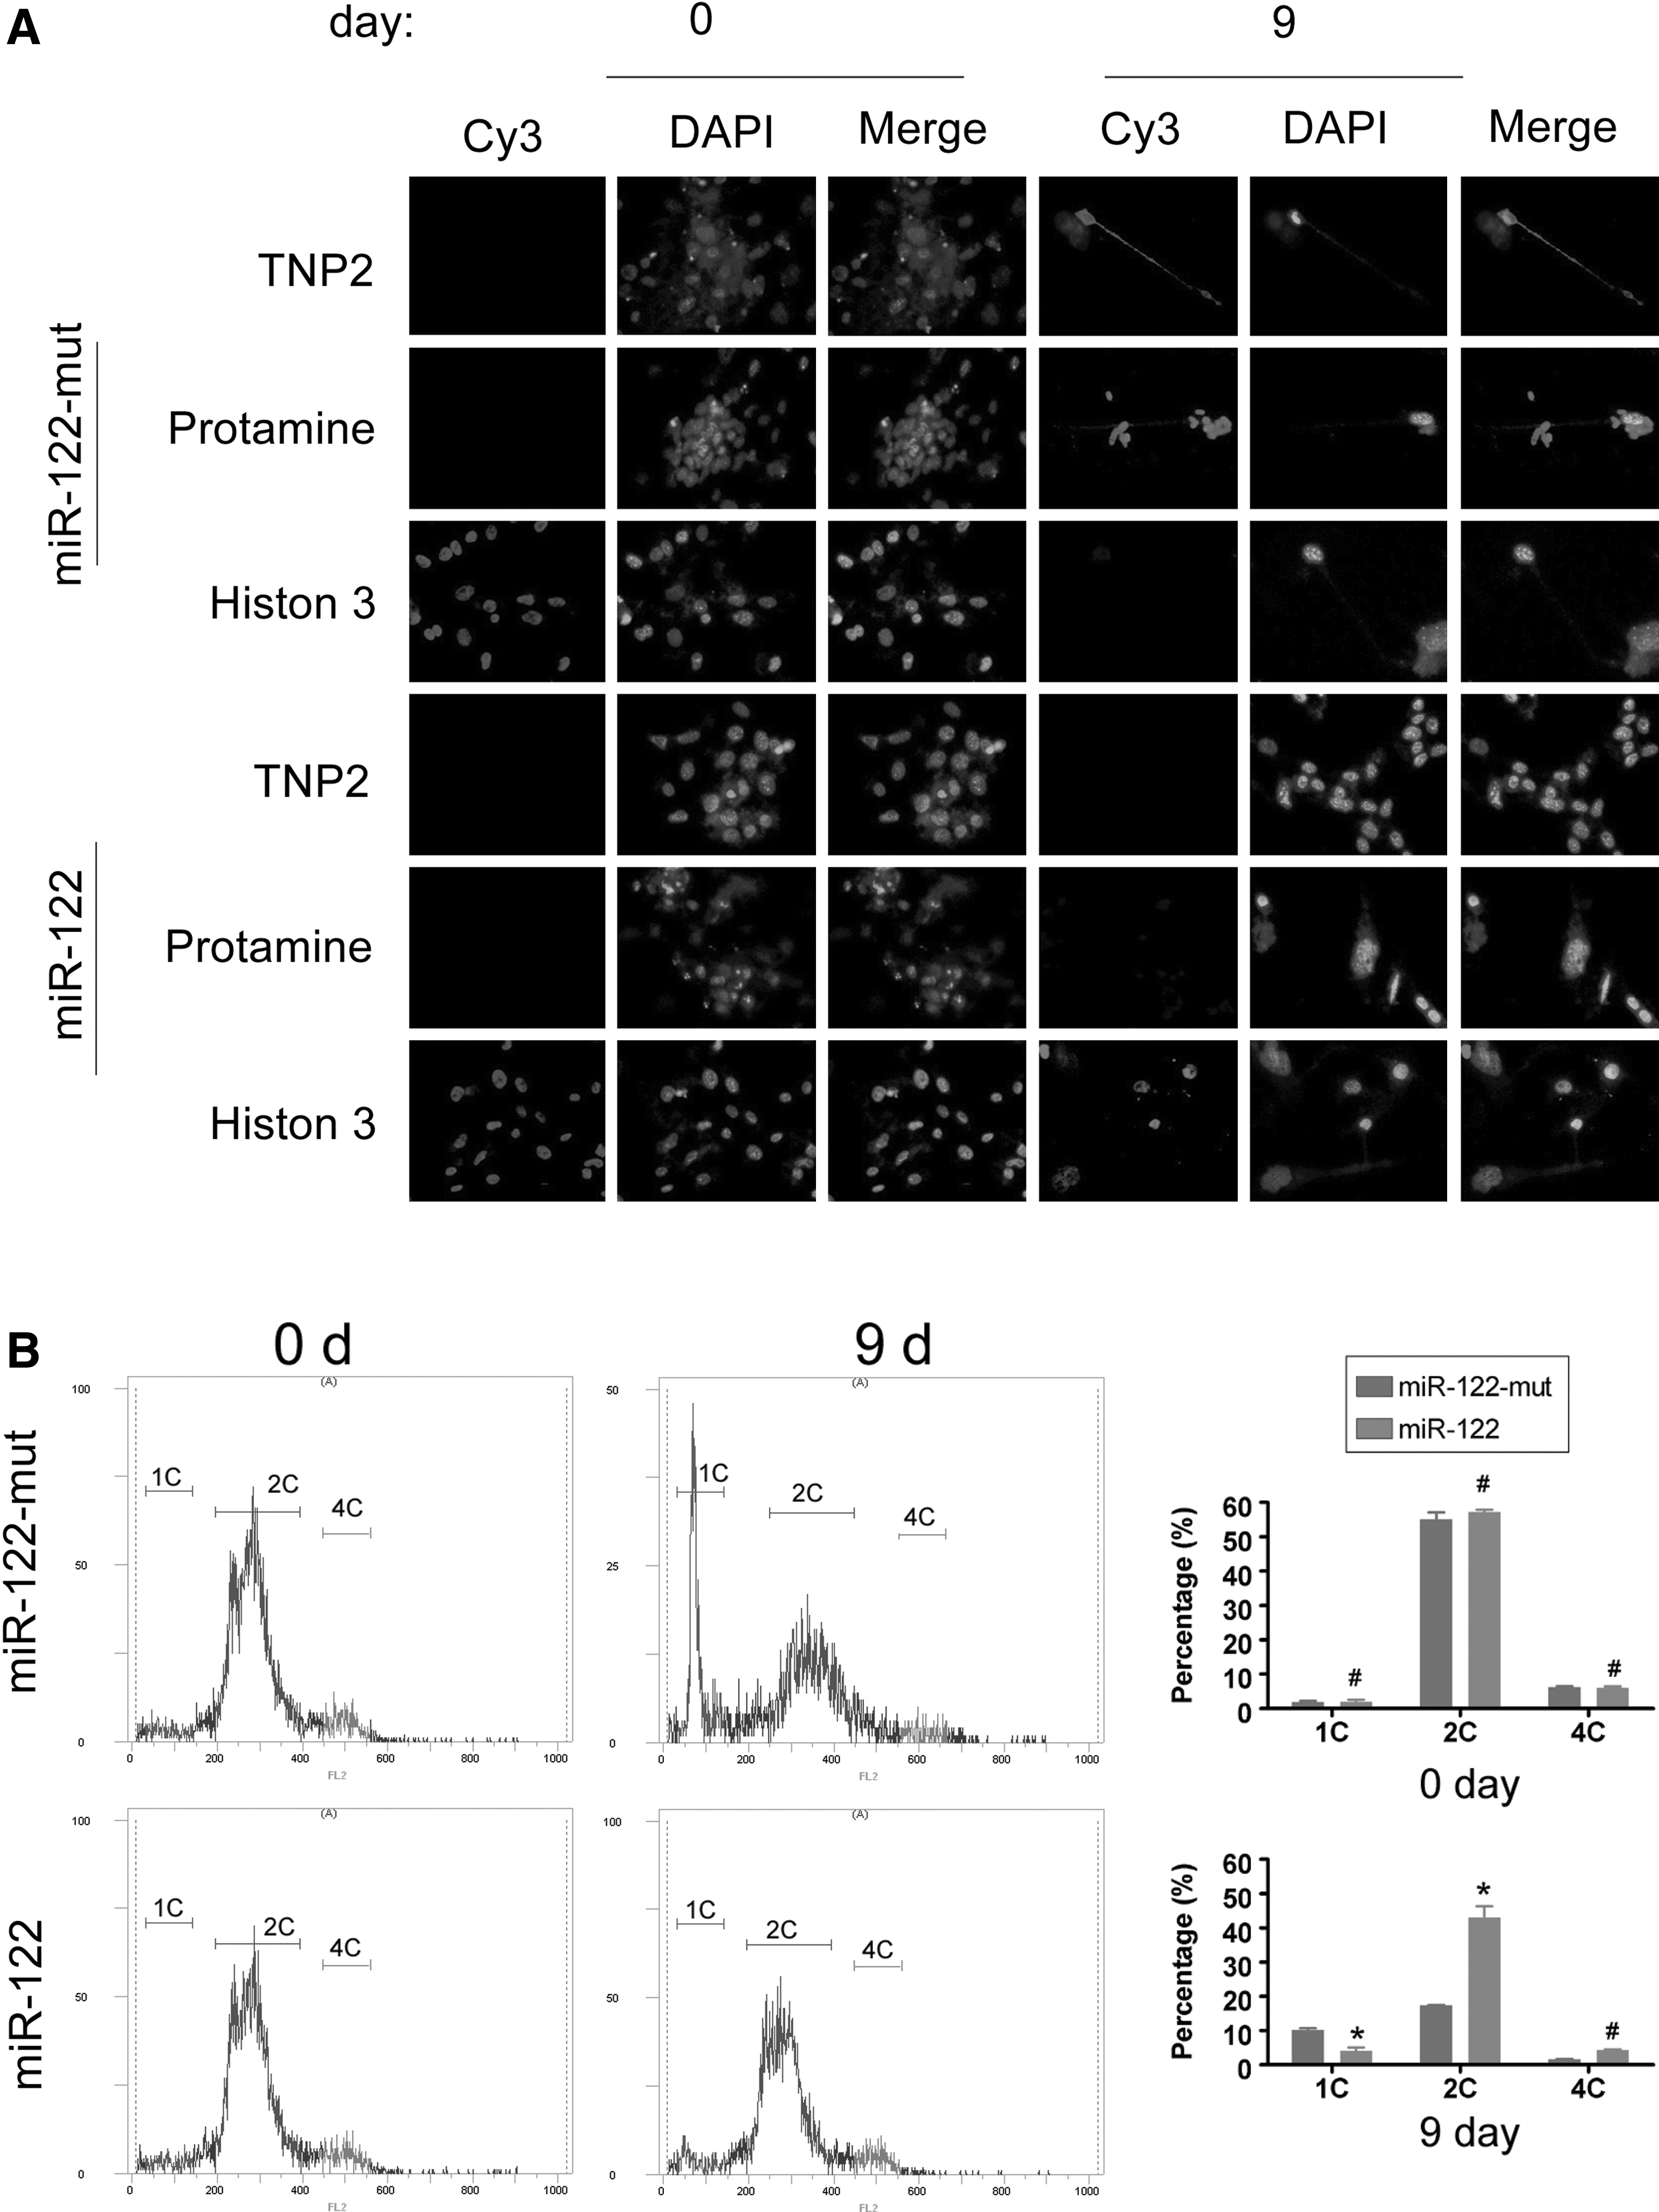
Immunofluorescence (IF) analysis and flow cytometry analysis (FCA) of the haploid subpopulation in spermatozoa after induction.
miR-122 suppresses expression of TNP2 to influence the transformation of iPS cells into spermatozoa-like cells
Northern blotting revealed that the hybridization signal for endogenous miR-122 gradually weakened with time when human iPS cells were induced to differentiate into spermatozoa-like cells in vitro (Fig. 3). Thus, we speculated that miR-122 plays an important role in the differentiation of cells into spermatozoa. Furthermore, western blotting analysis showed that TNP2 was expressed at low levels in miR-122-transfected iPS cells during induction, but not in miR-122-mut-transfected cells (Fig. 3). After induction in vitro, the expression of TNP2 steadily increased over time in miR-122-mut-transfected iPS cells. The expression levels of histone 3 and PRM were determined by western blotting at days 0 and 9 after induction. On day 9 after induction, the levels of histone 3 in the miR-122-transfected iPS cells were significantly higher than the corresponding values in miR-122-mut-transfected cells. In contrast, the levels of PRM were lower in miR-122-transfected iPS cells than in miR-122-mut-transfected cells. However, there were no significant differences in the expression levels of these proteins in both groups (Fig. 3).
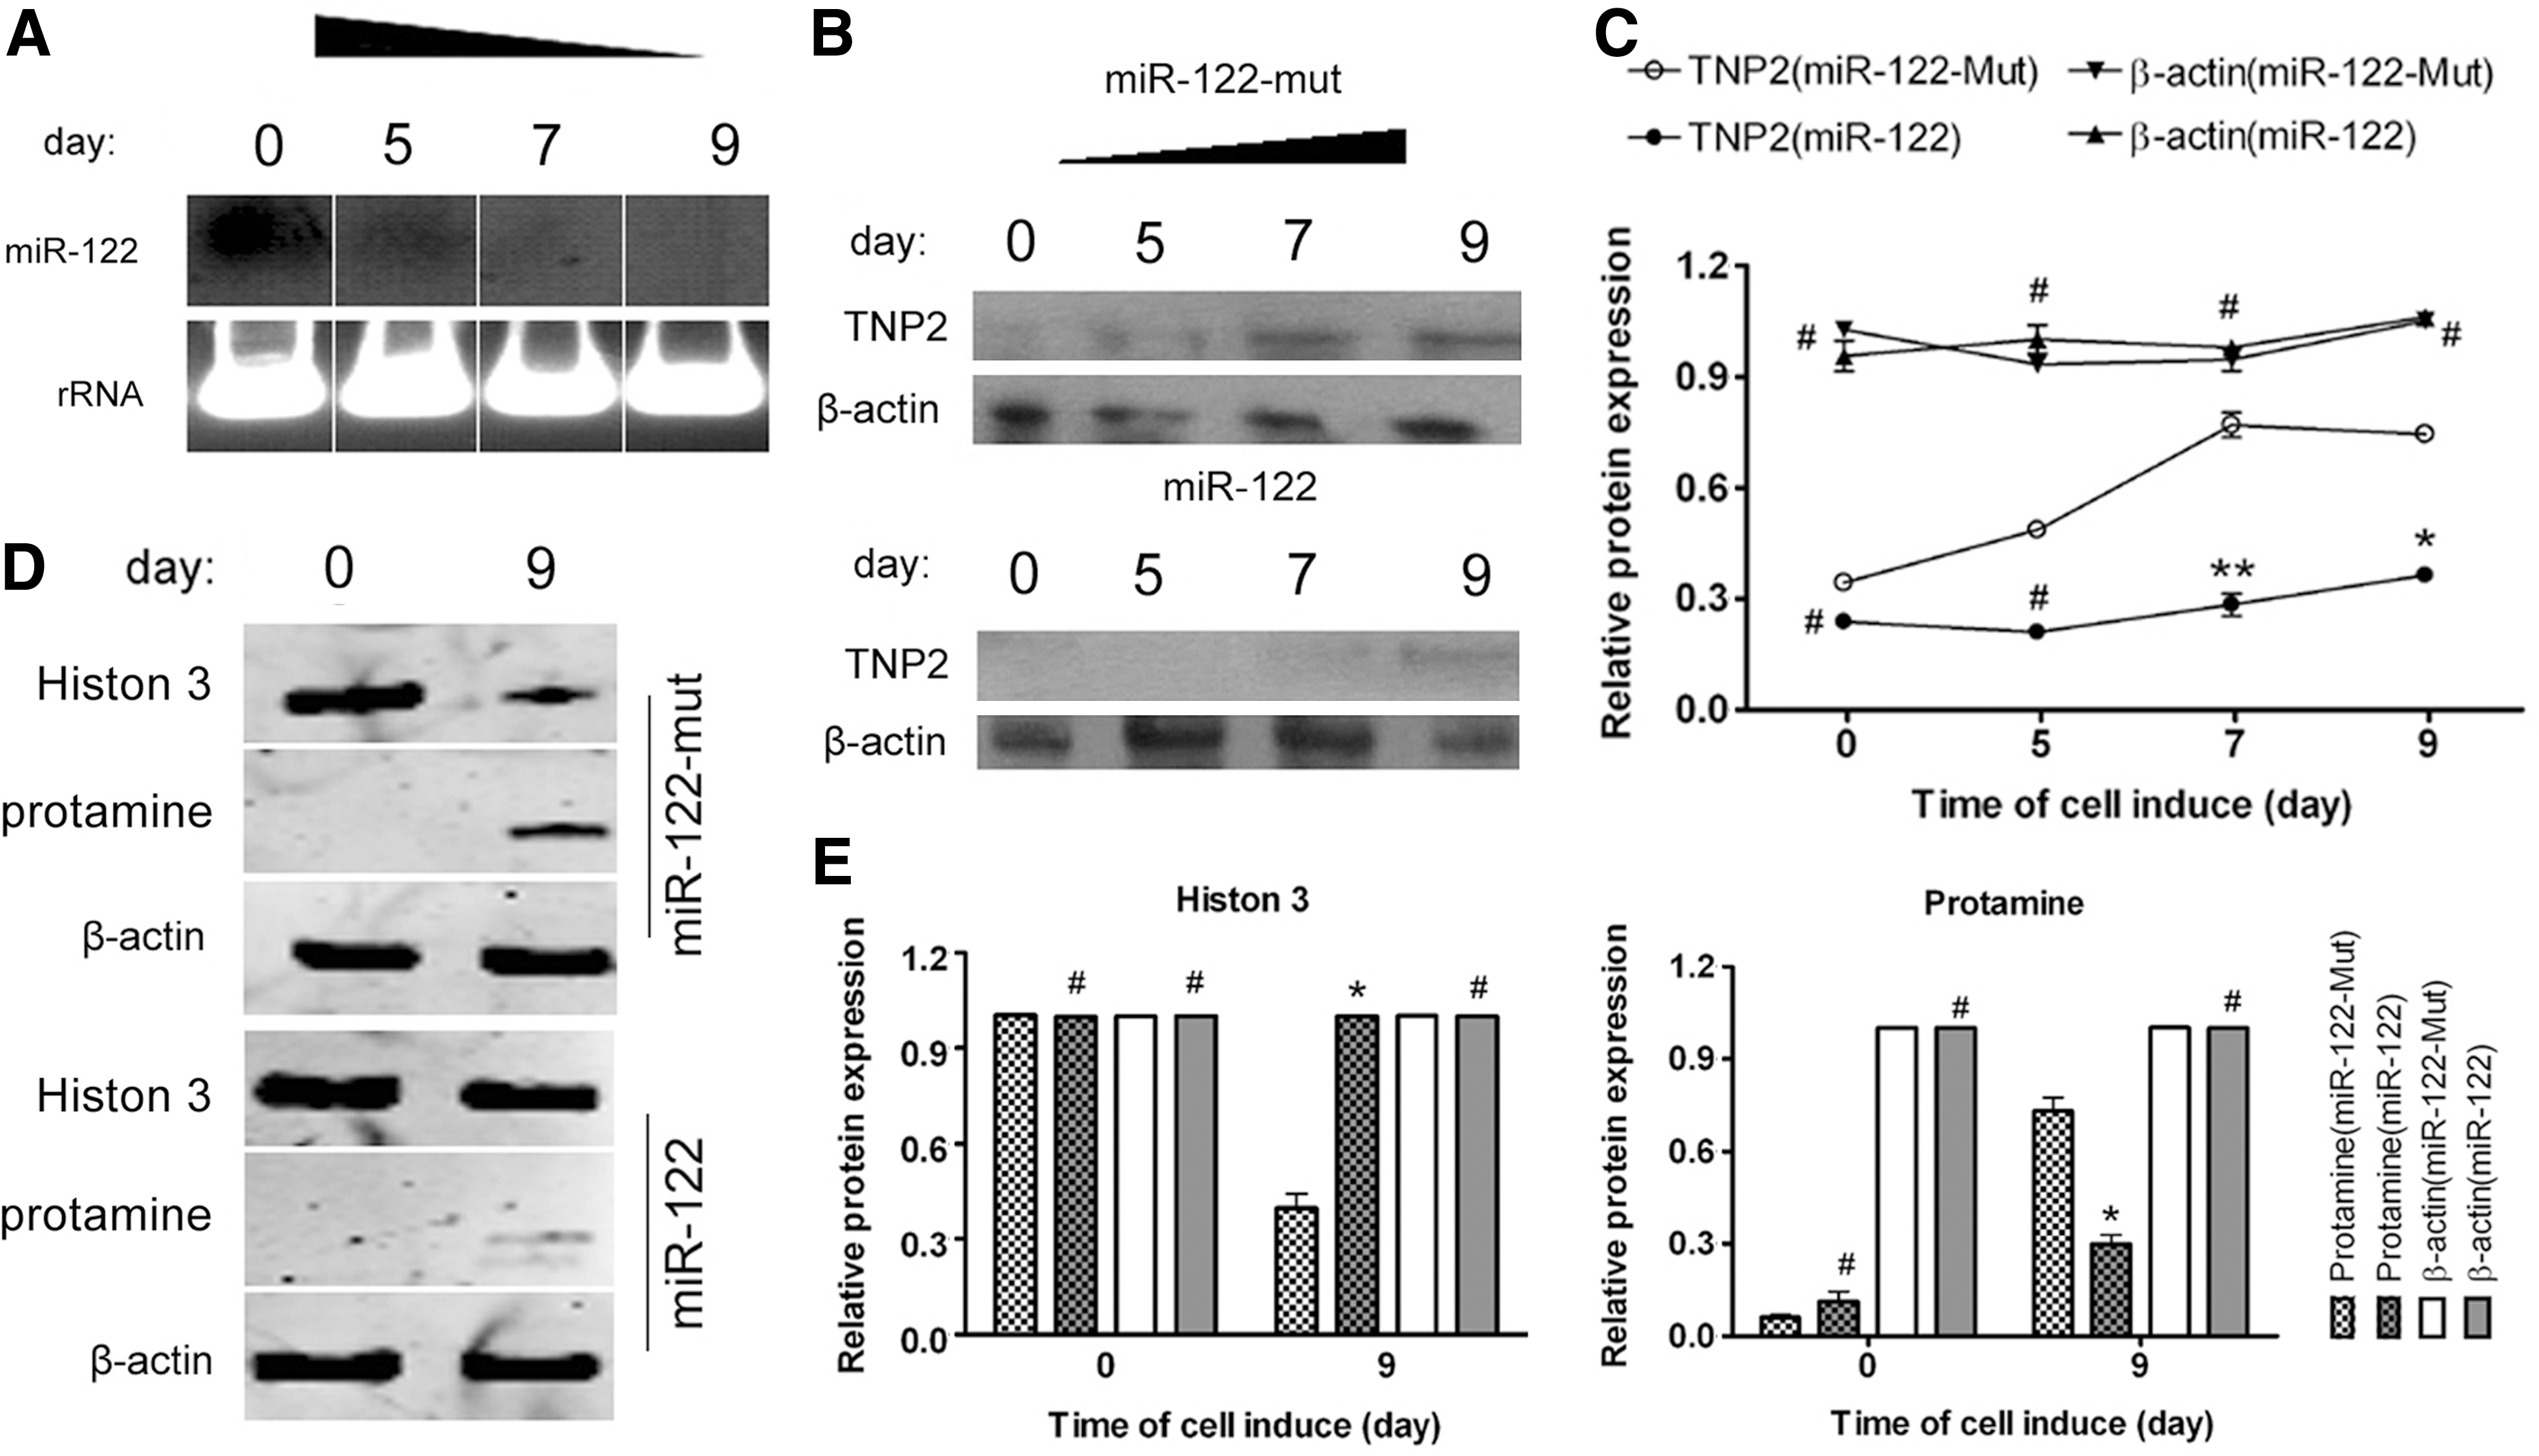
miR-122 suppresses TNP2 expression to influence the transformation of iPS cells into spermatozoa-like cells.
Relative and absolute quantification (iTRAQ) analysis and qRT-PCR to confirm differential protein expression in spermatozoa-like cells
The quantitative proteomics iTRAQ approach was employed to profile the differentially expressed proteins levels in the spermatozoa-like cells derived from iPS cells transfected with miR-122 or miR-122-mut. Spermatozoa-like cells from the miR-122-transfected iPS cells (SPC-miR-122) were used as the sample, and those from the miR-122-mut-transfected iPS cells (SPC-miR-mut) were used as the model. Proteins were considered upregulated and downregulated when their ratios were >1.5 and <0.5, respectively; these cutoffs are widely accepted and adopted. The samples were labeled with iTRAQ-121, and the model cells were labeled with iTRAQ-118. The iTRAQ ratio of 121:118 was used to identify the relative abundance of the protein. Additionally, to increase the coverage of protein identification and our confidence in the generated data, two separate preparations were made, and each was analyzed by LC/MS/MS. A total of 780 unique proteins were identified with 95% confidence by the ProteinPilot search algorithm against the IPI human protein database v3.49 (Fig. 4). After filtering, a total of 17 proteins were found to have different expression levels between the sample and model (Table 3). Six proteins were found to be significantly overexpressed in the sample group as compared to the model. Conversely, 11 proteins were expressed at significantly lower levels in the sample than in the model. Molecular function classification of the 17 proteins was achieved using the Panther Classification (
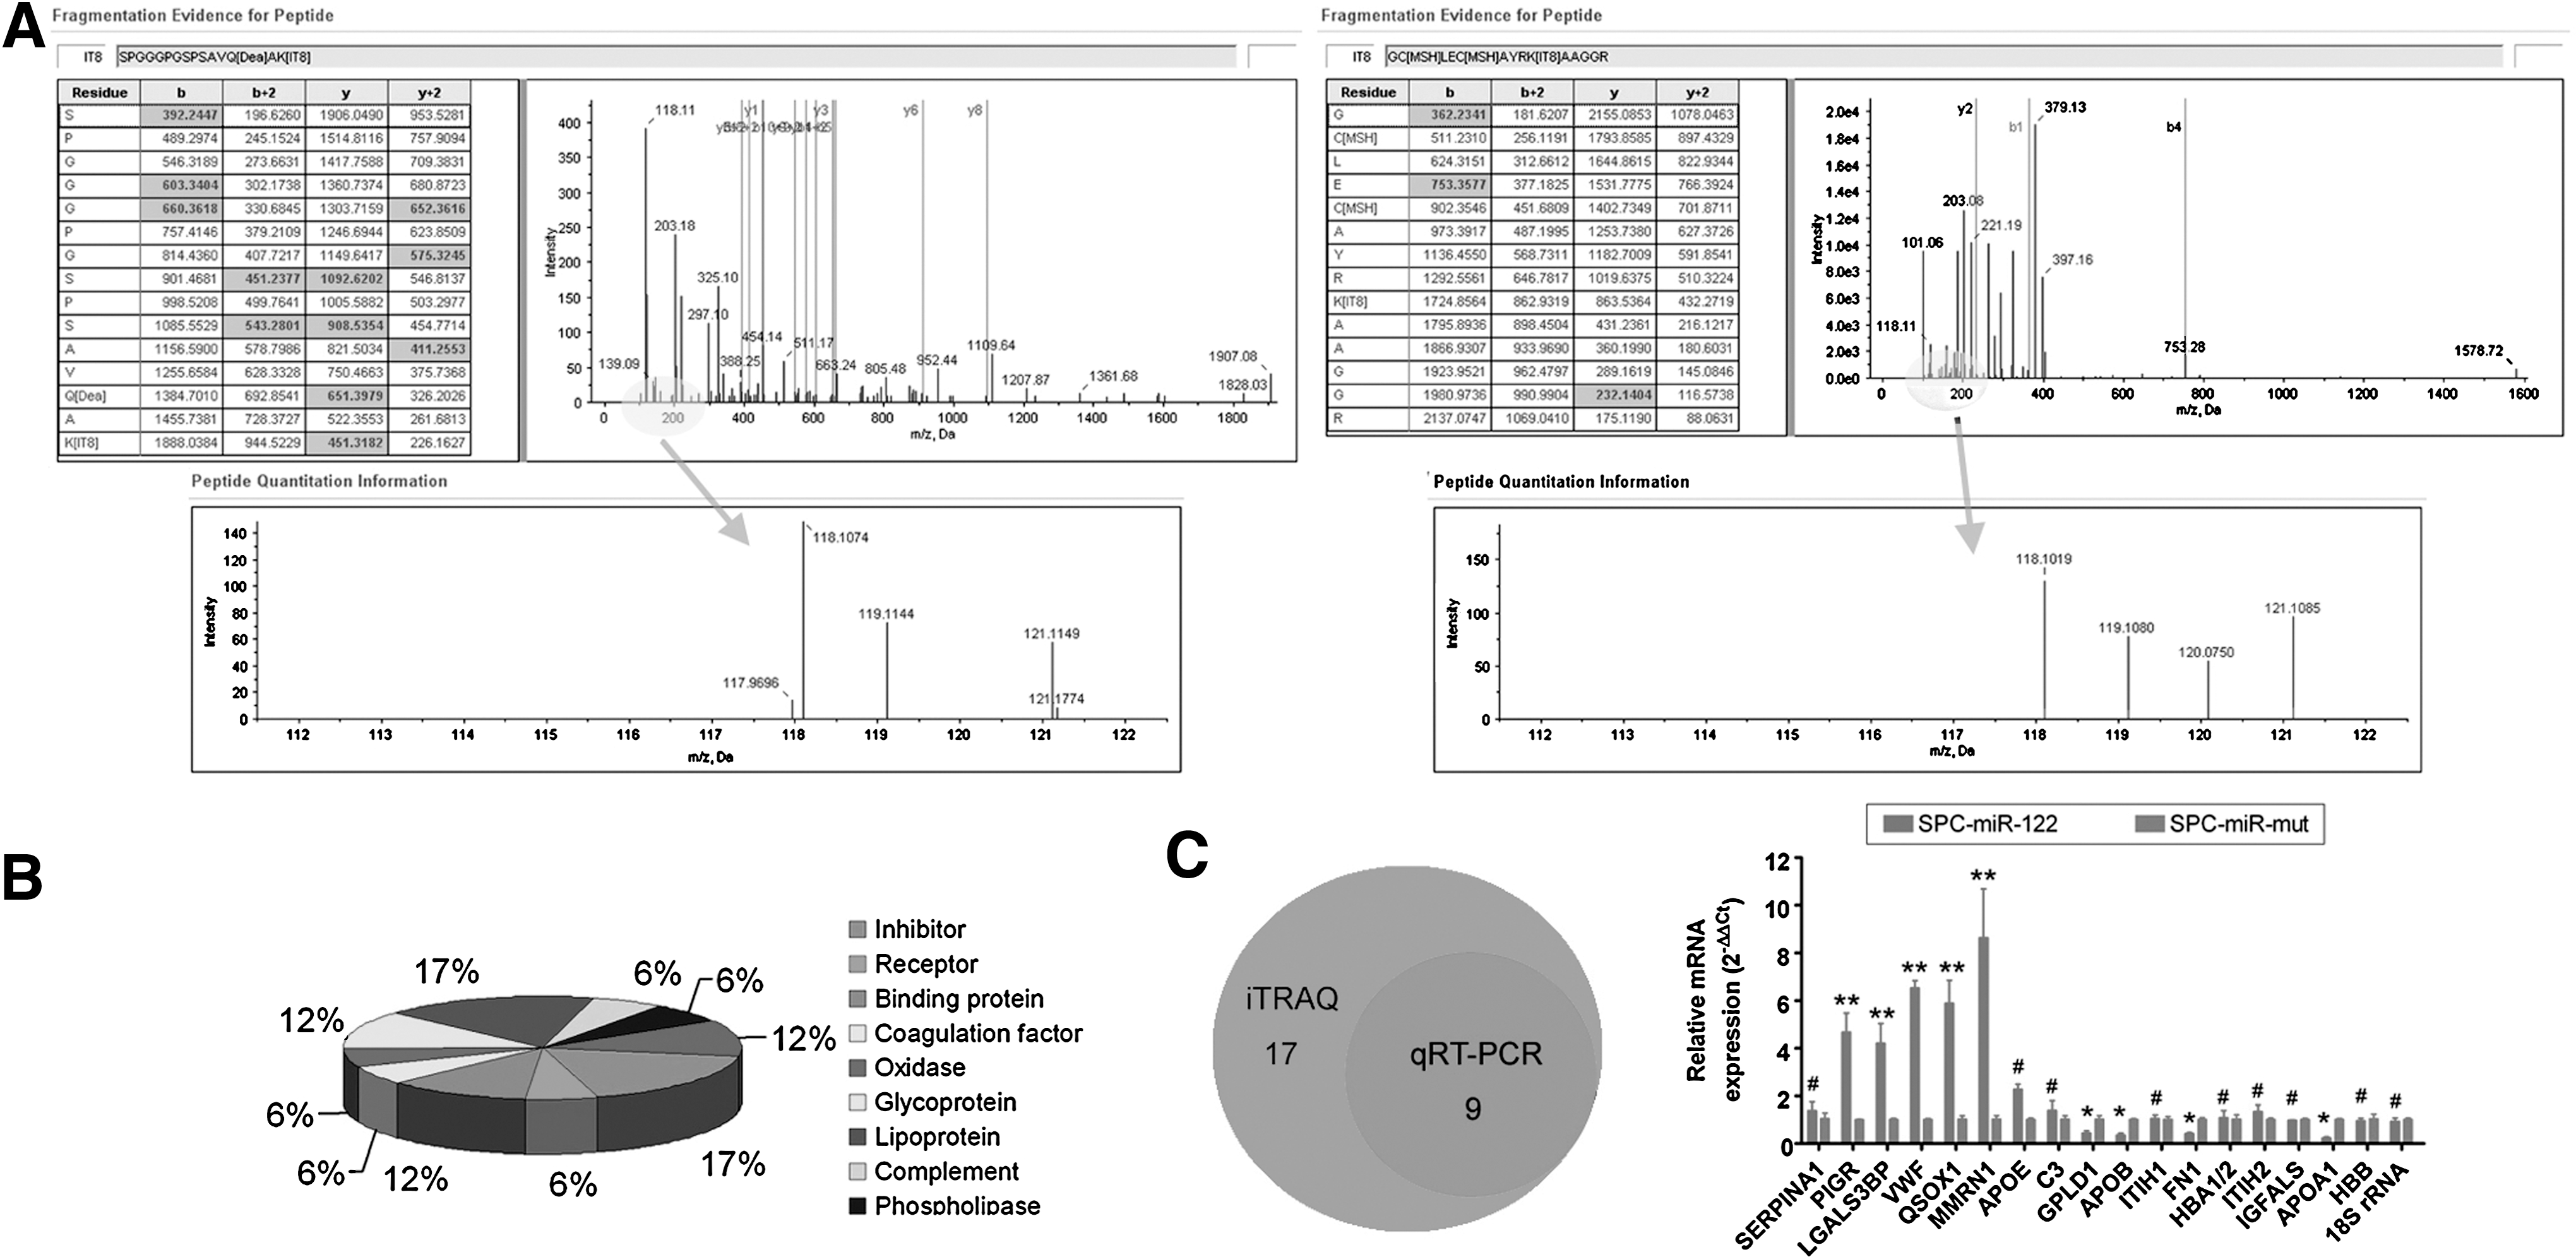
The iTRAQ analysis of differentially expressed proteins in spermatozoa-like cells.
Discussion
Approximately 40%–60% of cases of male infertility have been reported to be due to asthenospermia and abnormal sperm [31]. However, the mechanisms leading to the development of asthenospermia and abnormal sperm are not yet fully understood. Spermatogenesis is a long and complex process that occurs in the seminiferous tubule of the testis [29], which is regulated by multiple interactions between developing germ cells and the surrounding environment [29]. Spermiogenesis is the final stage of spermatogenesis, during which spermatids mature into motile spermatozoa. During this process, the nucleosomal structure undergoes major changes to condense the genome [9 –11,44]. At this stage, several testis-specific subtypes of histone are synthesized and replace their somatic counterparts during the premeiotic, meiotic, and postmeiotic stages of the differentiation of germ cells [9 –11]. Therefore, developing a suitable in vitro model would be helpful for studying the development of spermatozoa and the formation of sperm abnormalities. Although human embryonic stem cells (hESCs) and mouse spermatogonial stem cells (mSSCs) have been proposed as useful models for the study of the development of spermatozoa, and several studies have reported that sperm-like cells can be derived from hESCs or mSSCs, these cells have some shortcomings. In the case of hESCs, there are ethical restrictions for their use, the cell numbers are limited, and the culture conditions are complex. Since mSSCs are derived from mice, differences between these cells and human sperm are inevitable. Based on the results of previous studies, we developed an in vitro method and induced the direct differentiation of human iPS cells into adult-type spermatozoa-like cells in this study. Human iPS cells are highly similar to hESCs in terms of morphology, proliferation, gene expression, and the epigenetic status of pluripotency-specific genes. Moreover, the use of human iPS cells can overcome the ethical problems associated with the use of hESCs and reduce the possibility of immune rejection; thus, these cells have the potential to become an attractive source for cell therapy [27,28,45].
We started by investigating epigenetic modifications, and analyzed the differential expression of miRNAs, which may influence the occurrence of abnormalities in sperm. Microarray analysis was used to determine and compare the miRNA expression patterns in infertile sperm and normal sperm. Based on previous investigations [20 –22], we chose miR-122 as the object of study, and attempted to identify its role in the maturation and development of spermatozoa. We found that human iPS cells miR-122 with miR-122 could be induced to differentiate into human spermatozoa-like cells more efficiently than mutant miR-122-transfected cells. Furthermore, miR-122-transfected iPS cells showed increased morphogenesis of spermatozoa-like cells as well as a significant reduction in the number of haploid cells, as compared to mutant miR-122-transfected cells. Further studies showed that the TNP2 gene is one of the target genes of miR-122. The TNP2 expression level was downregulated by overexpression of miR-122. In mammals, chromatin condensation of spermatozoa development is a double-step event [12,14]: testis-specific histones are transiently replaced by TNPs and then by PRMs. Thus, both TNPs and PRMs are signs of sperm formation. However, after overexpression of miR-122 in human iPS cells during the induction of spermatozoa-like cells, the expression levels of TNP2 and PRMs were obviously lower in the miR-122-transfected group than in the mutant miR-122-transfected group. The expression levels of histone 3 showed the opposite trend. These results revealed that overexpression of miR-122 suppressed the expression of TNP2 and PRM, and influenced the development and maturation of sperm cells.
Furthermore, iTRAQ labeling was used to identify the inhibition of other proteins due to miR-122 overexpression during sperm development. Recently, iTRAQ has been adopted for high-efficacy and high-throughput proteomic analysis of a variety of biological samples [34 –43] such as cancer tissues, cells, plants, microorganisms, and sperm. In our study, we combined an easily accessible extraction buffer and a heat-induced antigen retrieval technique to retrieve the proteins from spermatozoa-like cells derived from human iPS transfected with miR-122 or mutant miR-122, followed by high-throughput proteomic iTRAQ analysis to identify and quantify proteins that are differentially expressed between the two groups. Expression of lipoproteins such as APOE, APOB, and APOA1 were most significantly different among all of the proteins analyzed in this study. Some previous reports indicated that genetic variation in the signal peptide of the ApoB gene was a risk factor for the development of male infertility [46,47]. Furthermore, male mice heterozygous for a targeted mutation of the ApoB gene exhibited male infertility due to sperm dysplasia [46,47]. Therefore, when miR-122 was overexpressed in iPS cells, the expression levels of not only TNP2 and PRM, but also other important proteins associated with sperm development, such as APOB, were inhibited.
In conclusion, differential expression of miR-122 may influence the differentiation of human iPS cells into spermatozoa-like cells, by suppressing expression of the miR-122 target gene TNP2 and inhibiting the expression of other important proteins associated with sperm development, such as lipoproteins. These findings reveal that miR-122 is an important factor associated with abnormal sperm development.
Footnotes
Acknowledgments
This work was supported by grant from Shanghai Committee Medical Science Foundation of China (no.10411967100) and National Natural Science Foundation of China (no. 81202811), and Shanghai Municipal Health Bureau Fund (no. 20124320) to Te Liu.
Author Disclosure Statement
No competing financial interests exist.
References
Supplementary Material
Please find the following supplemental material available below.
For Open Access articles published under a Creative Commons License, all supplemental material carries the same license as the article it is associated with.
For non-Open Access articles published, all supplemental material carries a non-exclusive license, and permission requests for re-use of supplemental material or any part of supplemental material shall be sent directly to the copyright owner as specified in the copyright notice associated with the article.