
Abstract
In culture, human pluripotent stem cells (PSCs) are phenotypically (for instance, the SSEA3 expression level) and functionally (capacity to survive after single-cell dissociation) heterogeneous. We report here that the side scatter (SSC) signal measured by flow cytometry, a variable correlated with membrane irregularity and cell granularity, is very high in PSCs, even higher than in blood polymorphonuclear cells, and markedly heterogeneous. Moreover, SSC intensity rapidly and strongly decreases upon PSC differentiation into any of the three germ layers. PSCs with high SSC (HSSC cells) or low SSC (LSSC cells) values both express pluripotency markers, but HSSC cells are characterized by more frequent simultaneous expression of the membrane pluripotency factors SSEA3, SSEA4, TRA-1-81, TRA-1-60, and CD24 and by a higher mitochondrial content. Functionally, HSSC cells are more likely to generate colonies upon single-cell passage than LSSC cells. SSC monitoring might provide a simple, but robust and rapid method to estimate pluripotency variations in culture and unveils a new phenotypic and functional heterogeneity in PSCs.
Introduction
Flow cytometry is a powerful, quantitative method to study PSC diversity at the single-cell level [18] and has significantly contributed to the characterization of the fluctuations of pluripotency cell surface markers in PSCs [9,11,12]. In addition to the quantification of fluorescence emission (biomarker detection), other types of information can be derived from the analysis of flow cytometry data. Specifically, as the laser beam passes through the cell, light is deflected and refracted. This scattered light is collected by the forward scatter (FSC) and by the side scatter (SSC) photodiodes. FSC intensity mainly correlates with the cell size, whereas SSC is a measure of the cell refractive index that depends on the cell granularity or internal complexity (for instance, cytoplasmic membrane wrinkling, the number and shape of vesicles and mitochondria, development of the endoplasmic reticulum and the nucleus structure).
We recently reported that polychromatic flow cytometry can provide information on the expression kinetics of the cell surface pluripotency markers SSEA3, SSEA4, TRA-1-81, and TRA-1-60 [11]. During that work, we noted that human PSCs had very heterogeneous SSC values. Here, we thoroughly investigated SSC intensity variations in different PSC lines and show that PSCs fluctuate between extreme SSC states. Moreover, PSCs with high SSC (HSSC cells) express more often many cell surface pluripotency markers simultaneously than cells with low SSC (LSSC). HSSC and LSSC cells show differences in cell cycle distribution. HSSC cells are more prone to apoptosis and display a higher mitochondrial content. However, despite their higher apoptosis rate, HSSC cells have a much higher clonogenic self-renewal capacity than LSSC cells.
Materials and Methods
Cell culture
The following hESC lines were used: HUES1, from Douglas Melton's laboratory [19] and HD83 and HD291 cells that we derived in our laboratory [11,20]; The hiPSC line, M4C7, is one of a series of clones obtained by reprogramming the human foreskin fibroblast hFF1 cell line (ATCC) by using lentiviral vectors to express human OCT4/POU5F1, SOX2, NANOG, and LIN28 [21]. M4C7 cells grow as typical PSCs and display all the features of PSCs: OCT4 and ABCG2 expression, a phosphatase alkaline activity, a typical PSC expression signature by microarray analysis, and can differentiate into cells of the three germ layers. All cell lines were routinely cultured in 35-mm wells in the KO-DMEM supplemented with 20% knockout serum replacement (KO-SR) (Invitrogen), 0.1 mM nonessential amino acids, 2 mM
For in vitro differentiation, PSCs were pretreated with 10 μM Y27632, a p160 Rho-associated kinase (ROCK) inhibitor (Sigma-Aldrich), for 1 h. Cells were then dissociated with 1 × TrypLE Select (Invitrogen) at 37°C for 10 min, seeded at 5,000 cells/cm2 in 96-well plates precoated with 1 mg/mL Matrigel (endoderm and ectoderm differentiation) or with feeder cells (mesoderm differentiation). PSCs were again incubated with 10 μM Y27632 for 24 h, and then PSC differentiation into endodermal (HUES1 cells), mesodermal (HD291 cells), or ectodermal cells (M4C7 cells) was induced as previously described [11]. Briefly, endodermal differentiation was induced by addition of activin A to a low-serum medium [22]; ectodermal differentiation was induced by adding Noggin and SB431542, two specific inhibitors of SMAD signaling [23]; and mesoderm was obtained by coculture with OP9 cells and VEGF [24]. Differentiation was accompanied by the sharp downregulation of the pluripotency-specific transcription factor OCT4 and by the induction of lineage-specific markers, such as CD45 (mesoderm), FOXA2 and CXCR4 (endoderm), and Nestin and CD56 (ectoderm). In addition, hematopoietic differentiation (the mesoderm model) was documented by the appearance of white blood cells, as indicated by May-Grünwald-Giemsa staining [11].
Quantification of stem cell markers, mitochondrial content, apoptosis rate, and cell cycle distribution by flow cytometry
For flow cytometry analyses, cells were dissociated with TrypLE at 37°C for 10 min. Cell surface pluripotency markers were quantified using a cocktail of five antibodies against CD24-PB (EXBIO), SSEA3-PE (BD Biosciences), SSEA4-PERCP (R&D), TRA-1-60-FITC (BD Biosciences), and TRA-1-81-APC (BD Biosciences) and the Sytox Blue Dead Cell Stain (Invitrogen).
The mitochondrial content was determined using MitoTRacker Red CMXRos probes (Invitrogen). The PSC culture medium was removed from the 35-mm dishes and cells were incubated with 100 nM MitoTRacker probes in a prewarmed (37°C) PSC medium without serum at 37°C for 30 min. Cells were then washed with PBS, dissociated with TrypLE, suspended in 500 μL PBS, and incubated with 6 μL of an anti-CD44-APC antibody (BD Biosciences) to exclude feeder cells.
To evaluate the cell cycle distribution, dissociated cells were fixed in cooled 70% EtOH at 4°C for 15 min, permeabilized using 0.1% Triton X-100 (v/v), and stained with 10 μg/mL propidium iodide plus 250 μg/mL RNase A for 30 min.
To quantify the apoptosis rate, TrypLE-dissociated cells were incubated with the anti-CD44 antibody for 30 min, and then stained with Annexin-V-FITC (BD Biosciences) in the Annexin-V binding buffer (BD Biosciences) for 20 min, as recommended by the manufacturer. Sytox Blue stain was added to exclude dead cells.
Flow cytometry data acquisition was carried using a CyAn instrument (Beckman Coulter) and data analyzed using the KALUZA software (Beckman Coulter).
FACS sorting of HSSC and LSCC cells
PSCs were pretreated with 10 μM Y27632 for 1 h, stained with Sytox Blue (Invitrogen), and incubated with an anti-CD44 antibody (Pharmingen) to label feeder cells. LSSC and HSSC cells were then sorted using an Astrios instrument (debris and aggregated cells were eliminated by specific gating), plated in 96-well plates precoated with irradiated hFF1 cells, and cultured in the presence of 10 μM Y27632 in the PSC culture medium for 24 h.
Teratoma formation
Animals were handled in strict accordance with the ARVO Statement for the Use of Animals in Ophthalmic and Vision Research and the EU directives (Council Directive 86/6009/EEC). NOD/SCID/IL2RG-/- mice (Charles River, France) were maintained in standard conditions (12 h 90 lux light and 12 h dark) and fed ad libitum with a standard rodent diet. About 300,000 sorted HSSC and LSSC cells were centrifuged and pellets resuspended in 30% Matrigel diluted in KO-SR in a final volume of 200 μL per injection. Before subcutaneous injection of the cell mixture, mice were lightly anesthetized with 35 mg/kg ketamine (Merial) and 14 mg/kg xylasine (Bayer Healthcare), shaved on the left flank, and disinfected with 70% ethanol. The teratoma appearance and growth were followed weekly. Approximately 8 weeks after the graft, teratomas were dissected, fixed in 3.7% formaldehyde, dehydrated, and embedded in paraffin; 4-μm sections were processed for hematoxylin–eosin–safran staining.
Transmission electron microscopy
FACS-sorted HSSC and LSSC cells were immersed in a solution of 2.5% glutaraldehyde in 0.1 M of a Sorensen's buffer (pH 7.4) at 4°C overnight. They were then rinsed in the Sorensen's buffer and postfixed in 0.5% osmic acid in the dark, at room temperature for 2 h. After two rinses in the Sorensen's buffer, cells were dehydrated in a graded series of ethanol solutions (30%–100%) and embedded in EmBed 812 using an Automated Microwave Tissue Processor for Electron Microscopy (Leica EM AMW). Thin sections (70 nm; Leica-Reichert Ultracut E) were collected at different levels of each block, counterstained with uranyl acetate, and observed using a Hitachi 7100 transmission electron microscope at the Centre de Ressources en Imagerie Cellulaire de Montpellier.
Statistical analysis
Statistical comparisons were made using the Student's t-test and P values <0.05 were considered to be significant. The SSC distribution of the different cell subpopulations was analyzed with the R software (R.2.13,
Results
SSC intensity values in PSCs are very heterogeneous
To thoroughly evaluate the variations in SSC intensity in human PSCs, we assessed SSC intensity distribution in hES (Figs. 1 and 2B–D) and hiPSC lines (Fig. 2A) by flow cytometry. In this study, to quantify the PSCs, we excluded dead cells, aggregated cells, and debris (Fig. 1A). All PSC lines showed a wide SSC distribution, including a subpopulation of cells with very HSSC intensity. Comparison with the SSC values of blood cells (assessed using the same settings) (Fig. 1C) indicated that SSC intensity in PSCs was 6.5-fold higher than in blood mononuclear cells and even higher than in granulocytes, which are known to have very HSSC values (Fig. 1D). In addition, the SSC values of PSCs were markedly heterogeneous (from very low to very HSSC intensity), suggesting that each PSC population includes cells with variable morphological features (internal and/or membrane complexity). To understand why PSCs display such a huge SSC variability, we investigated several features (morphology, expression of pluripotency markers, clonogenic self-renewal, apoptosis, and cell cycle distribution) in PSCs with either HSSC or LSSC values.
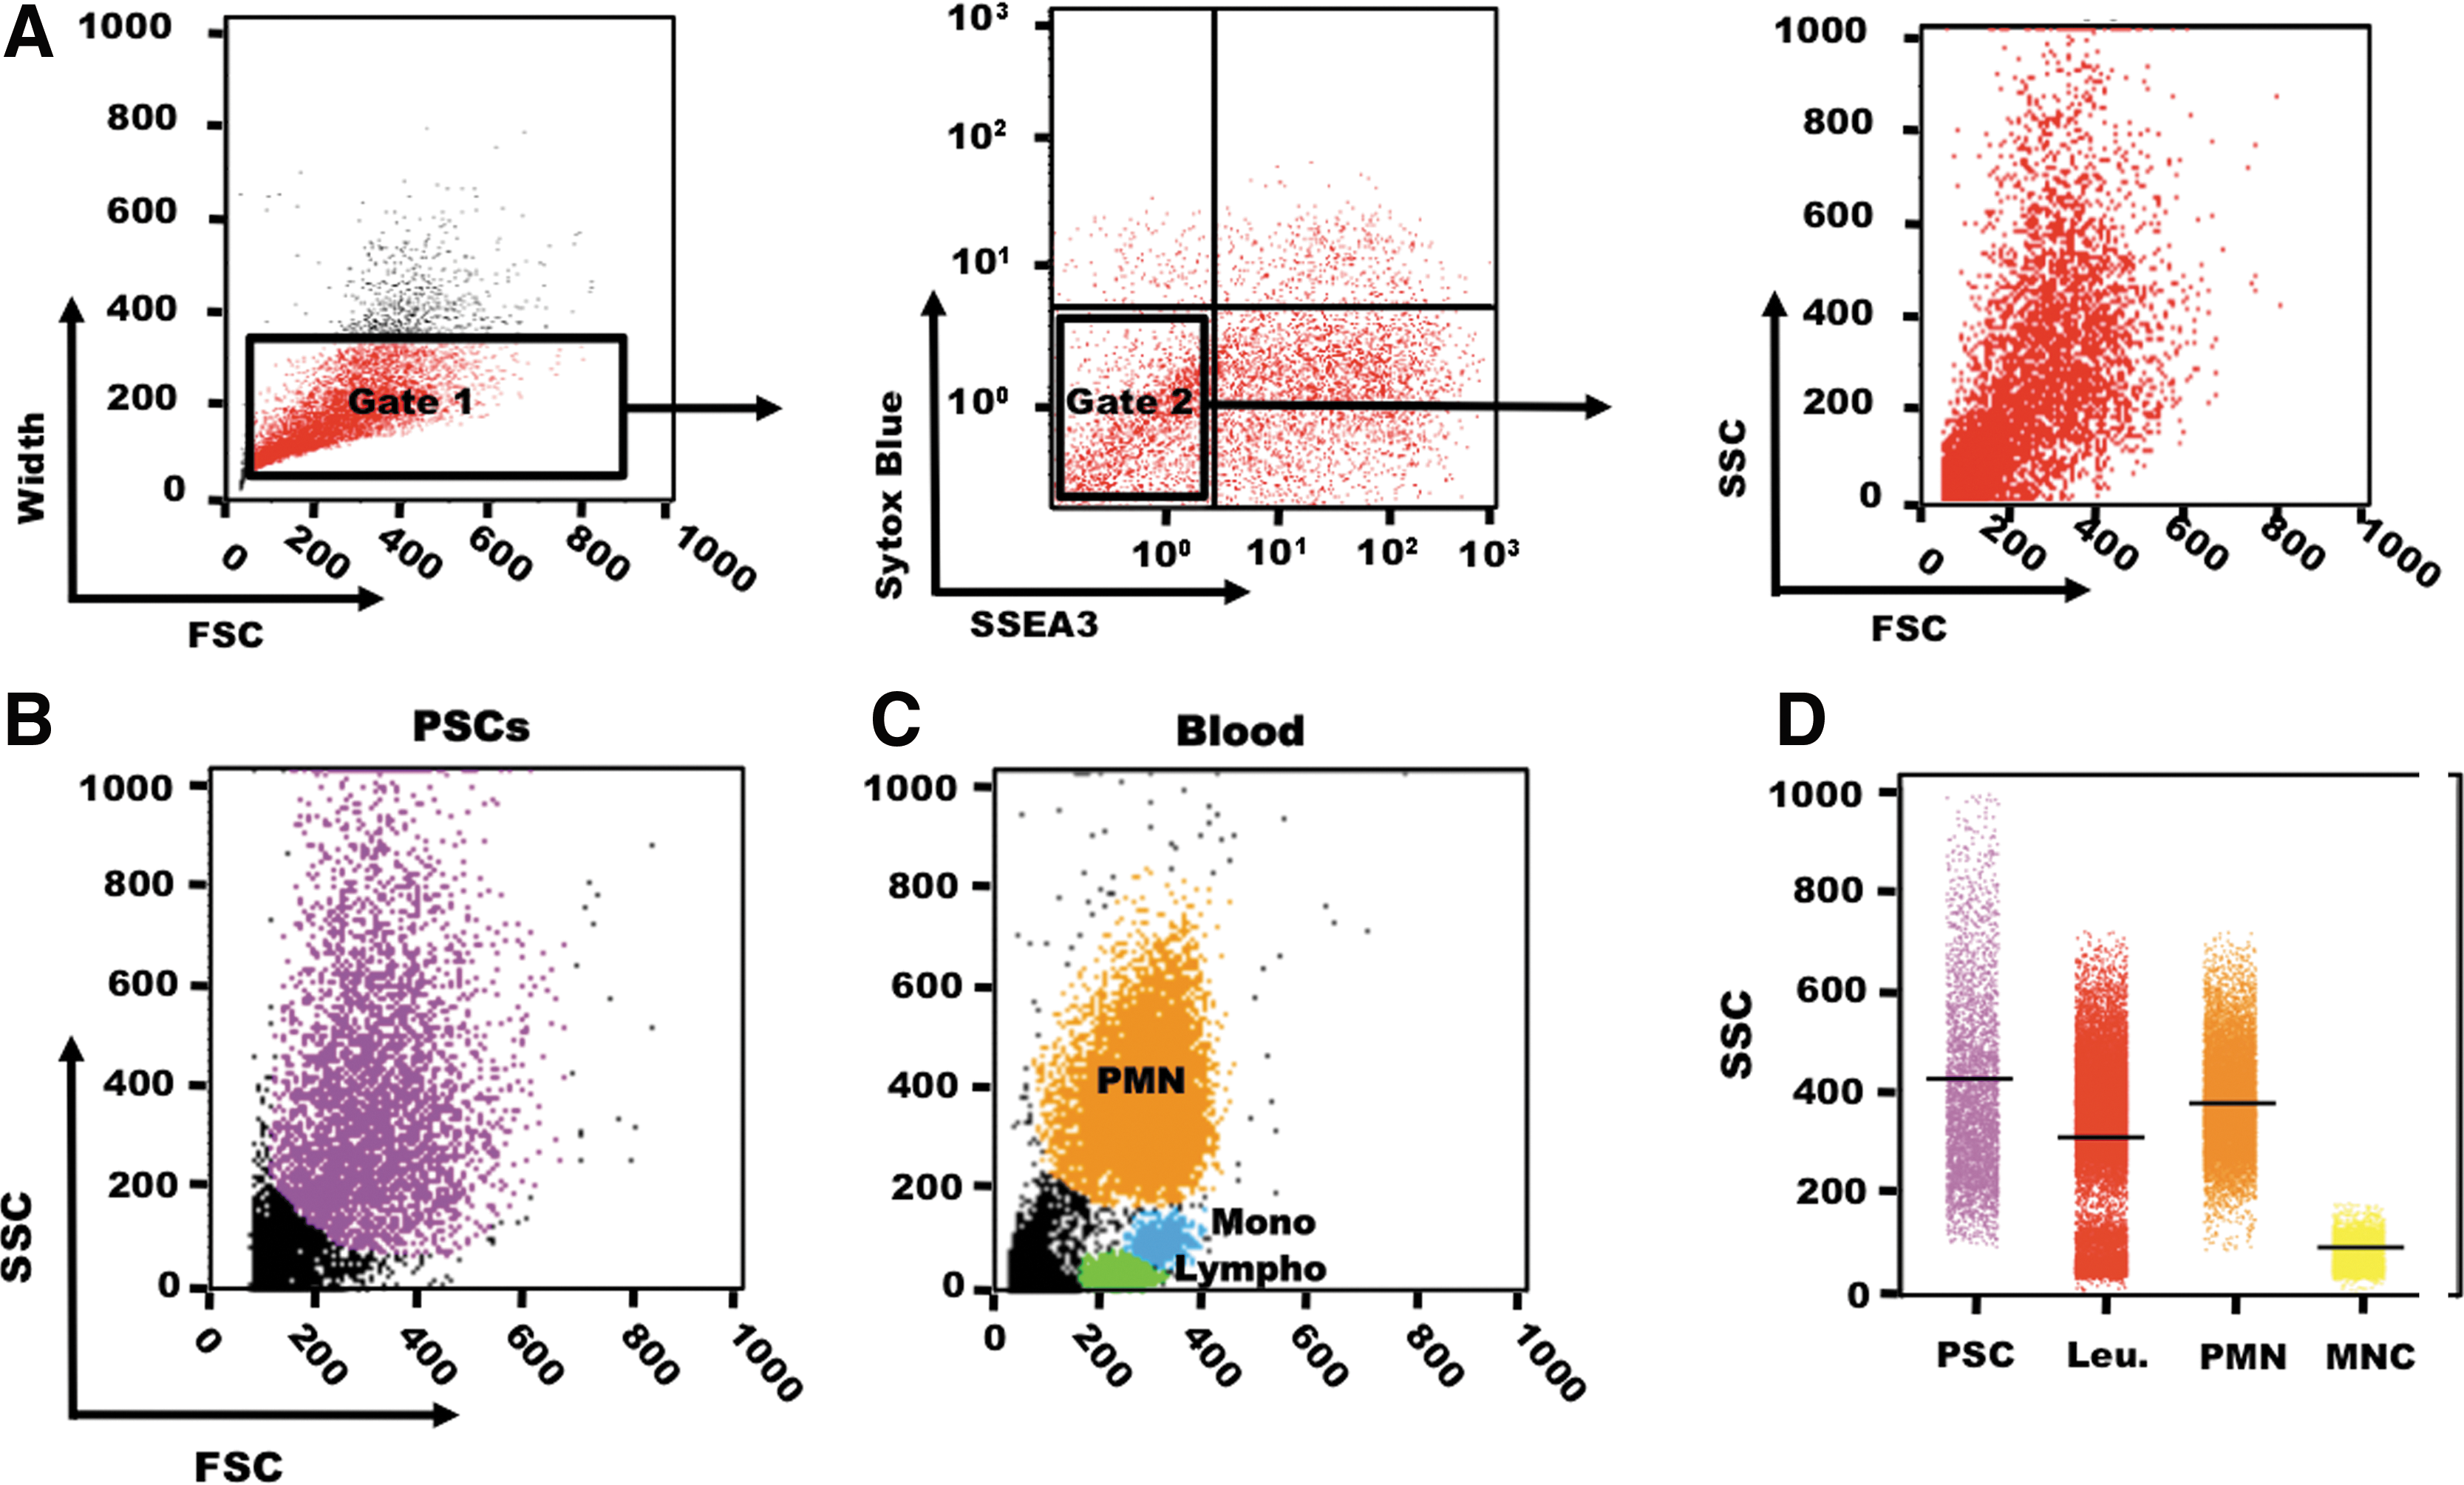
Analysis of the SSC parameter in PSCs and human blood cells. Scatter plot of SSC versus FSC values in HD83 hESCs.
SSC values are very heterogeneous within PSCs. hiPSCs (M4C7)
The size of the HSSC population is highly correlated with the pluripotency state
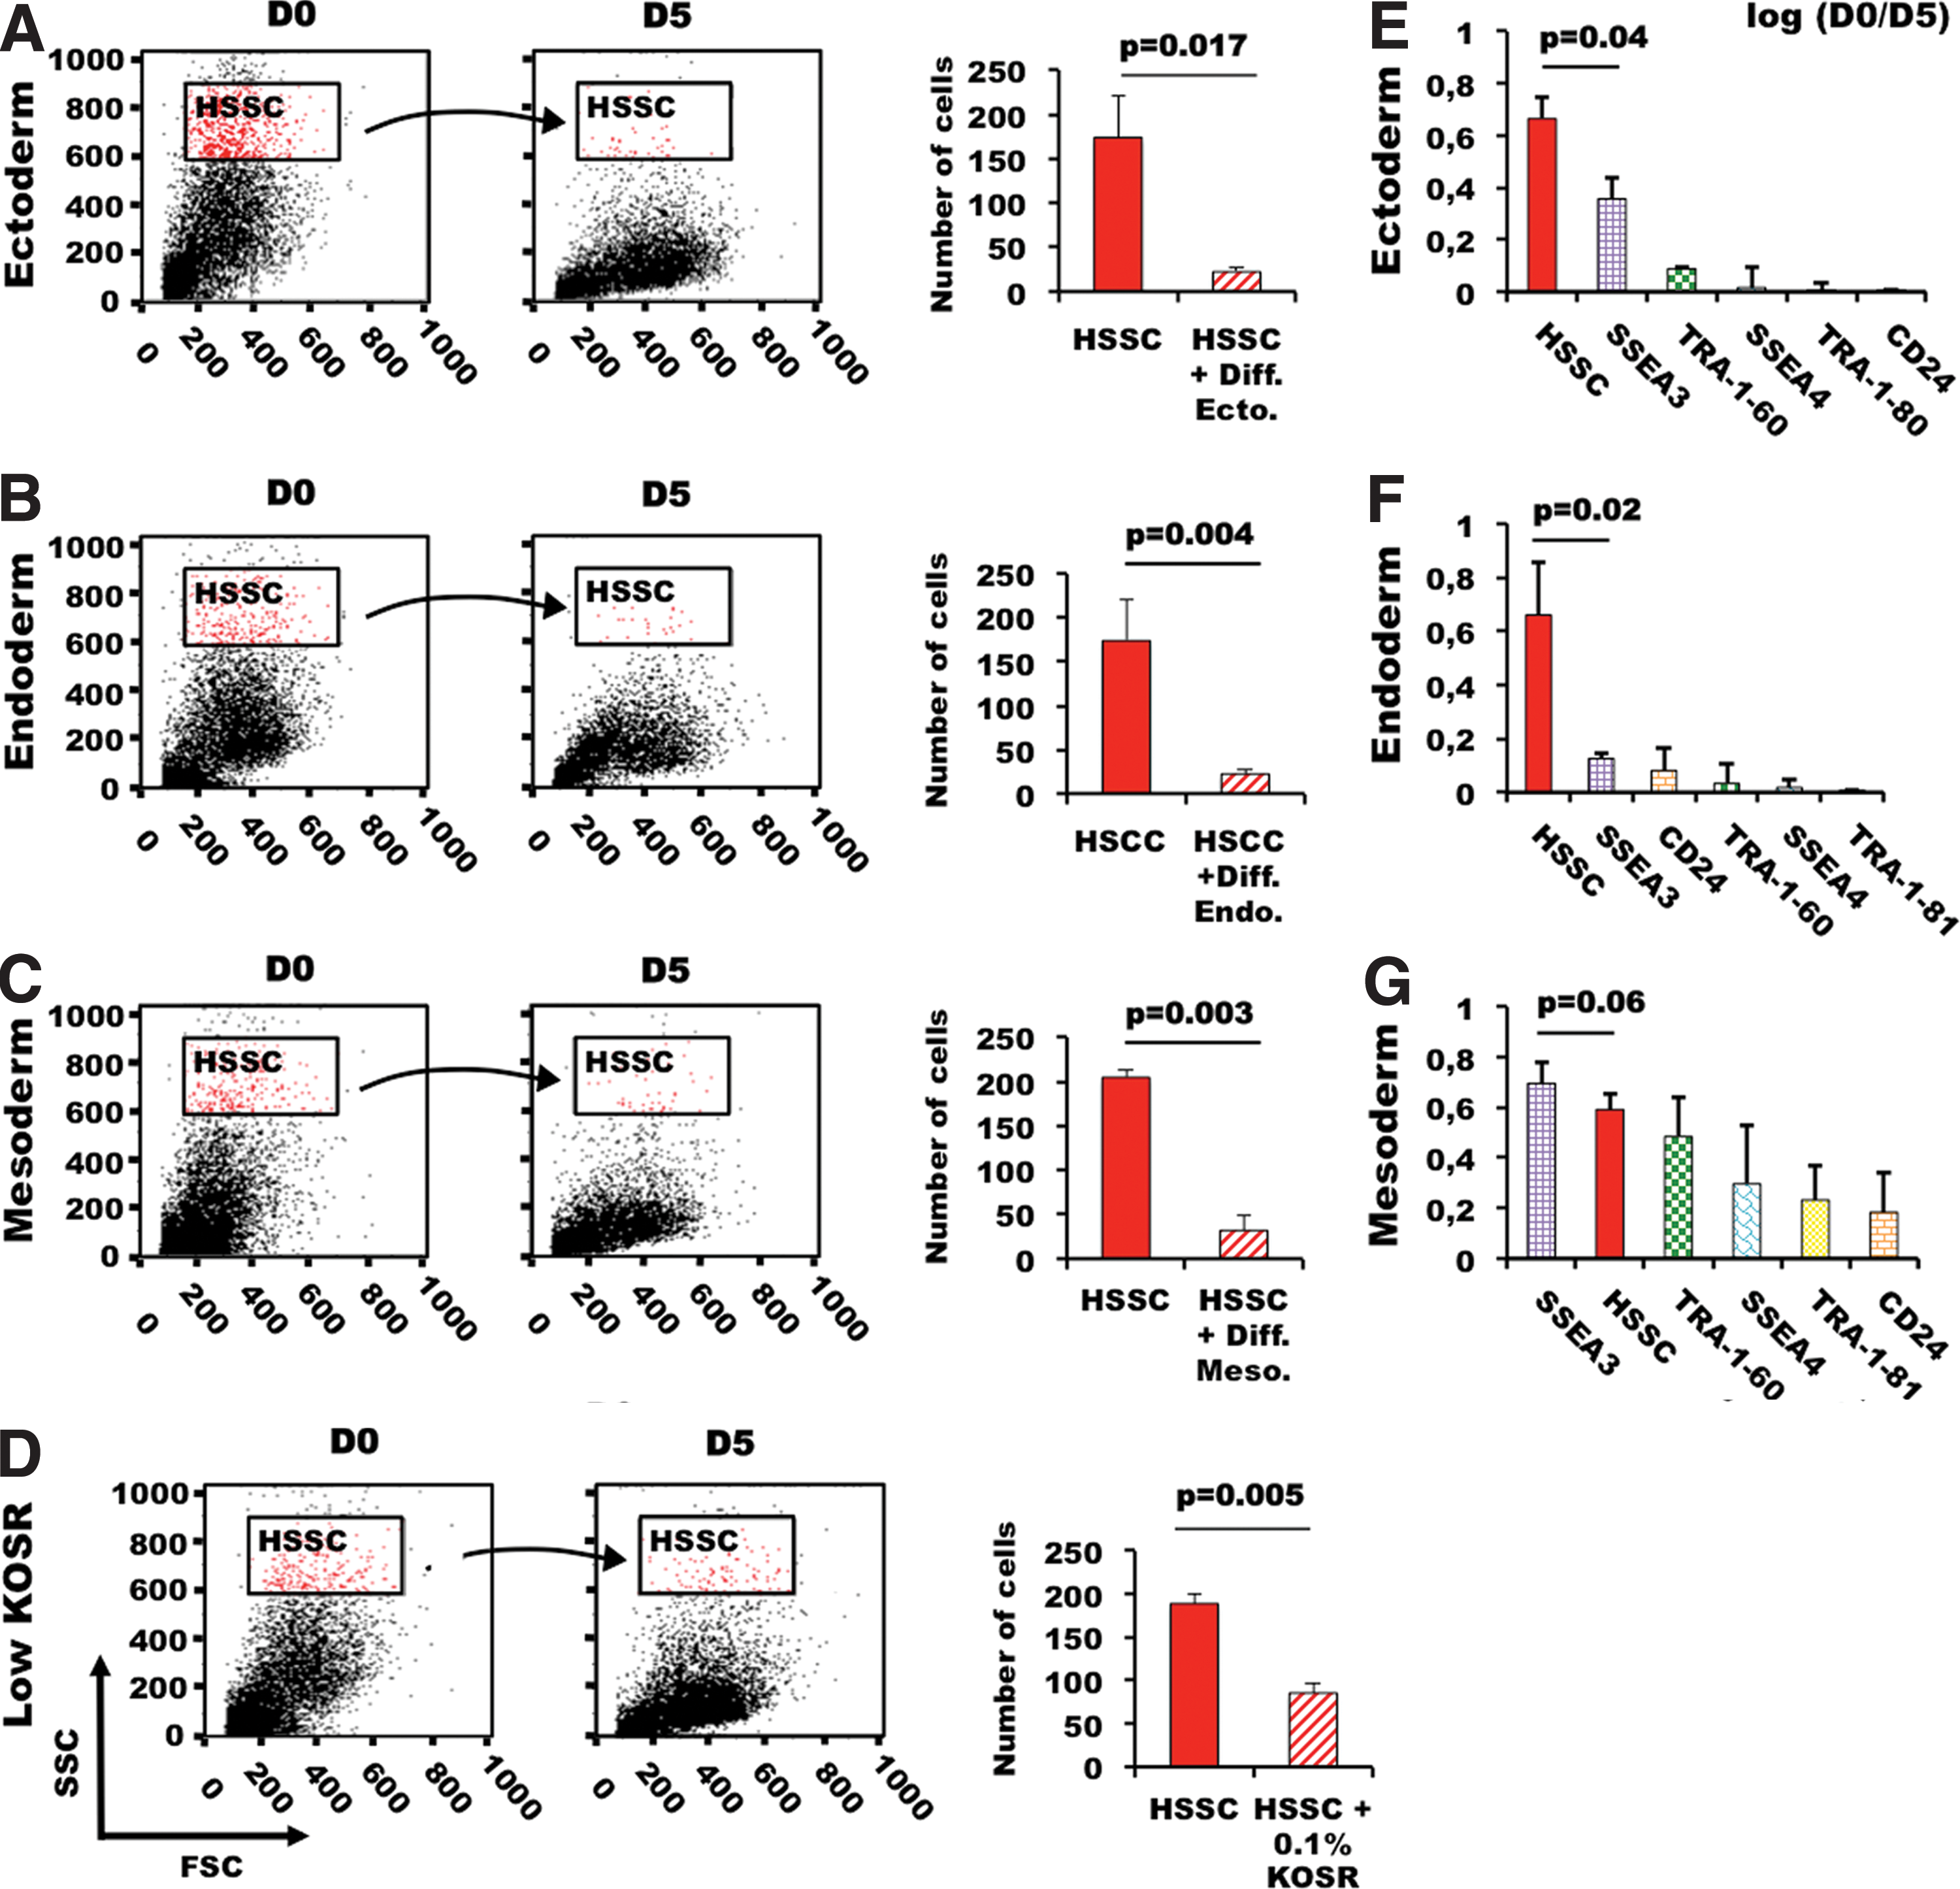
First, we tested whether loss of pluripotency and cell differentiation could be associated with a decrease in SSC intensity by measuring the size of the HSSC population in the four PSC lines following induction of differentiation [11], or culture in low-serum conditions (0.1% KO-SR). The size of the HSSC populations was drastically decreased after only 5 days of differentiation into ectodermal (M4C7 hiPSC; 6-fold reduction), endodermal (HUES1 ESCs; 7-fold decrease), or mesodermal cells (HD291 ESCs; 7.8-fold reduction) (Fig. 2A–C), and also when HD83 cells were induced to differentiate in a low-serum medium (Fig. 2D). As the decrease of the HSSC populations was a very early event during PSC differentiation, we investigated whether HSSC reduction was temporally associated with changes in the expression levels of the cell surface pluripotency markers SSEA3, SSEA4, TRA-1-60, TRA-1-81, and CD24 (Fig. 2E–G). The decrease of the HSSC cell subset was the most remarkable change between day 0 and 5 of differentiation in the ectoderm and endoderm differentiation models, whereas reduction in SSEA3 expression, one of the most sensitive pluripotency markers [9,11], came first only during mesoderm differentiation. Hence, in two of the three differentiation pathways tested, the decrease of the HSSC population significantly exceeded in magnitude loss of SSEA3 expression. Conversely, SSEA4, TRA-1-81, and CD24 expression were not changed or only slightly decreased in all the differentiation models at day 5 of differentiation. These results indicate that SSC could represent a new parameter for monitoring loss of pluripotency during PSC differentiation.
HSSC cells express simultaneously different pluripotent markers
We previously showed that expression of five common cell surface pluripotency markers (SSEA3, SSEA4, TRA-1-81, TRA-1-60, and CD24) is highly variable within a PSC population and that only a portion of these cells expresses simultaneously all five markers [11,27]. We thus asked whether HSSC and LSSC cells had distinct expression profiles of pluripotent markers. HSSC cells from the hiPSC line M4C7 contained a significantly higher percentage of SSEA3-positive cells than LSSC cells. In addition, 85%–87% of HSSC cells expressed simultaneously SSEA3, SSEA4, TRA-1-81, TRA-1-60, and CD24, whereas only 51%–54% of LSSC cells did (Fig. 3A). Similar results were obtained with the hESC lines HUES1 and HD291 (Fig. 3B, C), indicating that this finding was not limited to a specific PSC line and suggesting that HSSC may be correlated with pluripotency.
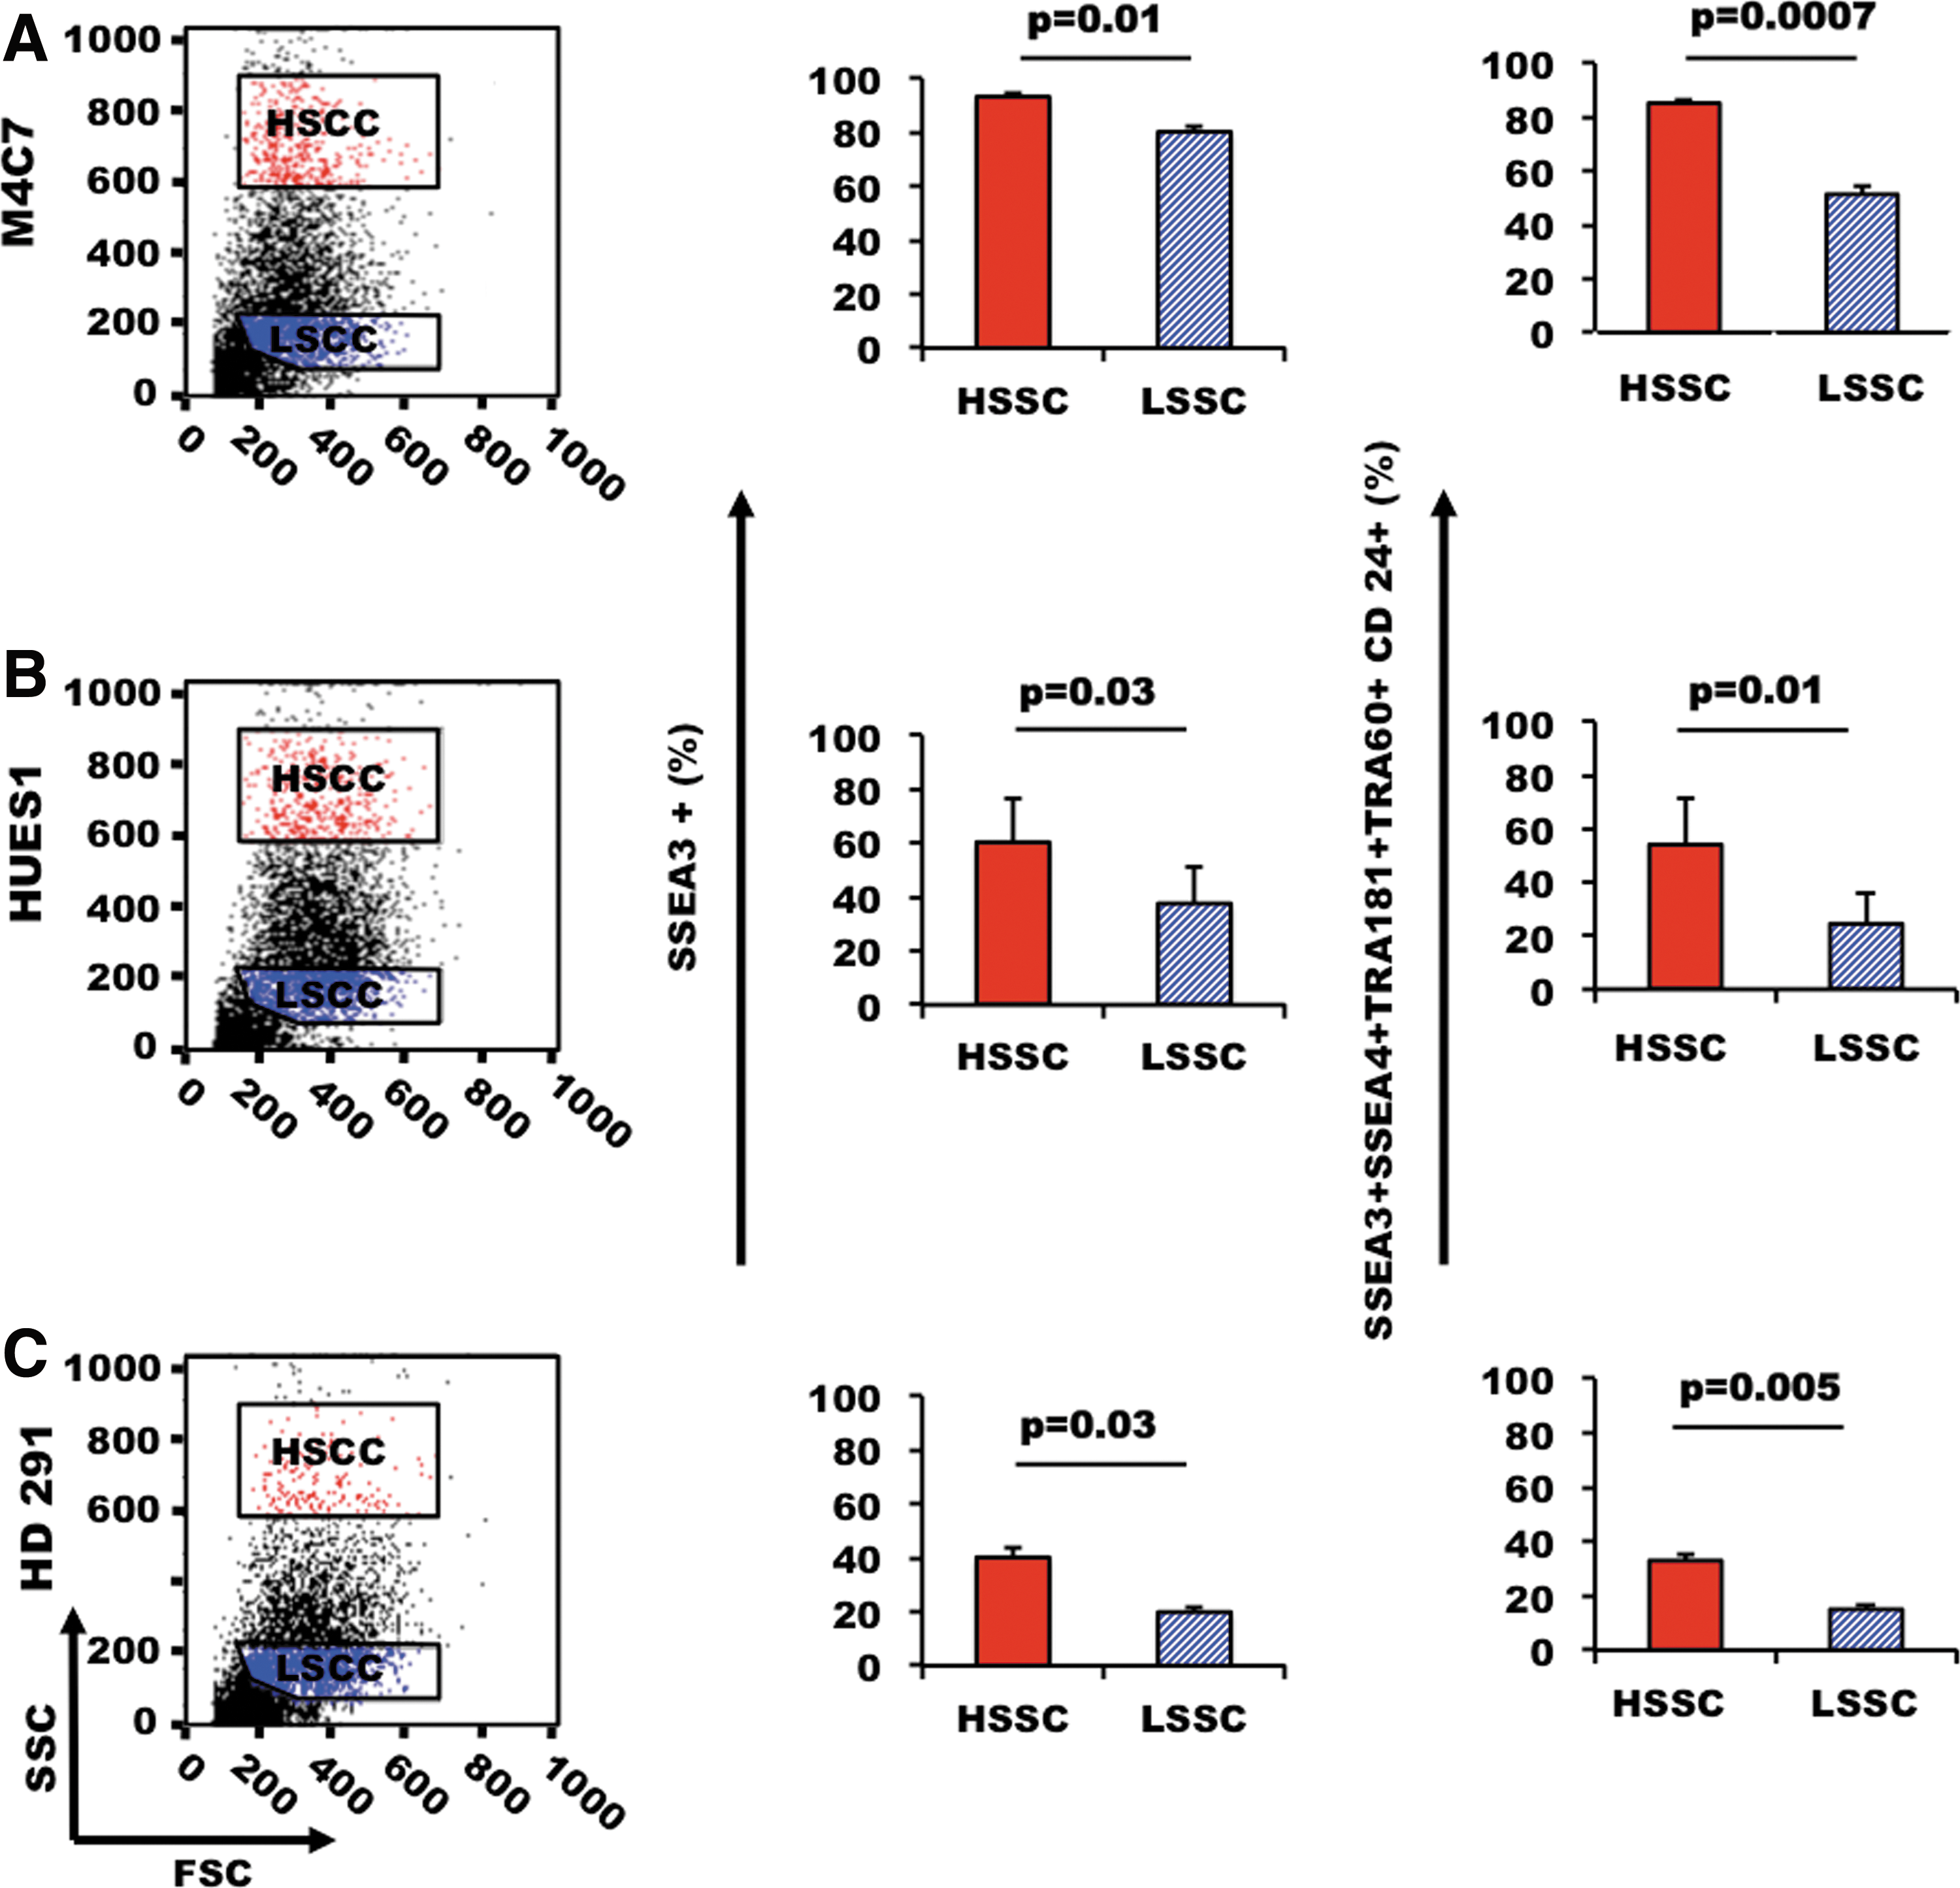
HSSC cells express high level of pluripotent markers. We compared the expression of cell surface pluripotency markers in the HSSC and LSSC populations of PSCs from three PSC lines [the hiPSC line M4C7
The clonogenic self-renewal capacity of PSCs is correlated with HSSC values
To examine more closely the link between SSC intensity and pluripotency, we compared the developmental potential of HSSC and LSSC cells. To quantitate their clonogenic self-renewal capacity, PSCs were FACS-sorted into HSSC and LSSC cells (Fig. 4A) and cultured at low density in 96-well plates precoated with irradiated hFFs for 4 days. Microscopy analysis revealed that HSSC cells had a higher self-renewal capacity and generated larger colonies than LSSC cells (49±6 and 9±5 colonies per 500 cells, respectively) (Fig. 4B, C). Moreover, the number of SSEA3-positive cells per well was higher in colonies generated from HSSC than from LSSC (Fig. 4D). Despite their lower clonogenic self-renewal capacity, LSSC cells could form bona fide PSC colonies that contained both HSSC and LSSC cells, as indicated by flow cytometry analysis of the colonies after 5 days of culture (Fig. 4E). This finding demonstrates that PSCs fluctuate between these extreme SSC states. Finally, to confirm the pluripotency status of the LSSC population, we grafted immunocompromised mice with FACS-sorted LSSC cells or with a mixture of LSSC and HSSC cells [28,29]. Both cell preparations produced teratomas of similar size that included patches of endoderm, mesoderm, and ectoderm (Fig. 4G, H), indicating that LSSC cells are nevertheless pluripotent. Taken together, these results demonstrate that HSSC cells have a higher clonogenic self-renewal capacity, but that each SSC subset contains pluripotent cells that can generate both HSSC and LSSC cells.

Clonogenic self-renewal efficiency of HSSC and LSSC PSCs.
HSSC and LSSC cells have distinct apoptosis rates and cell cycle profiles
To further characterize the biological features of HSSC and LSSC PSCs, we evaluated their apoptosis rate and cell cycle distribution. Indeed, during FACS sorting of the SSC populations, we noticed that HSSC cells were less viable than LSSC cells (data not shown). To quantify apoptosis and cell death, M4C7 cells were stained with Annexin-V and Sytox Blue, respectively, and then the percentages of early and late apoptotic cells, live cells, and dead cells were quantified in the HSSC and LSSC populations (Fig. 5A). Early and late apoptosis as well as cell death were significantly higher (2.4-, 4-, and 6.7-fold, respectively), in HSSC cells than in LSSC cells (Fig. 5B).
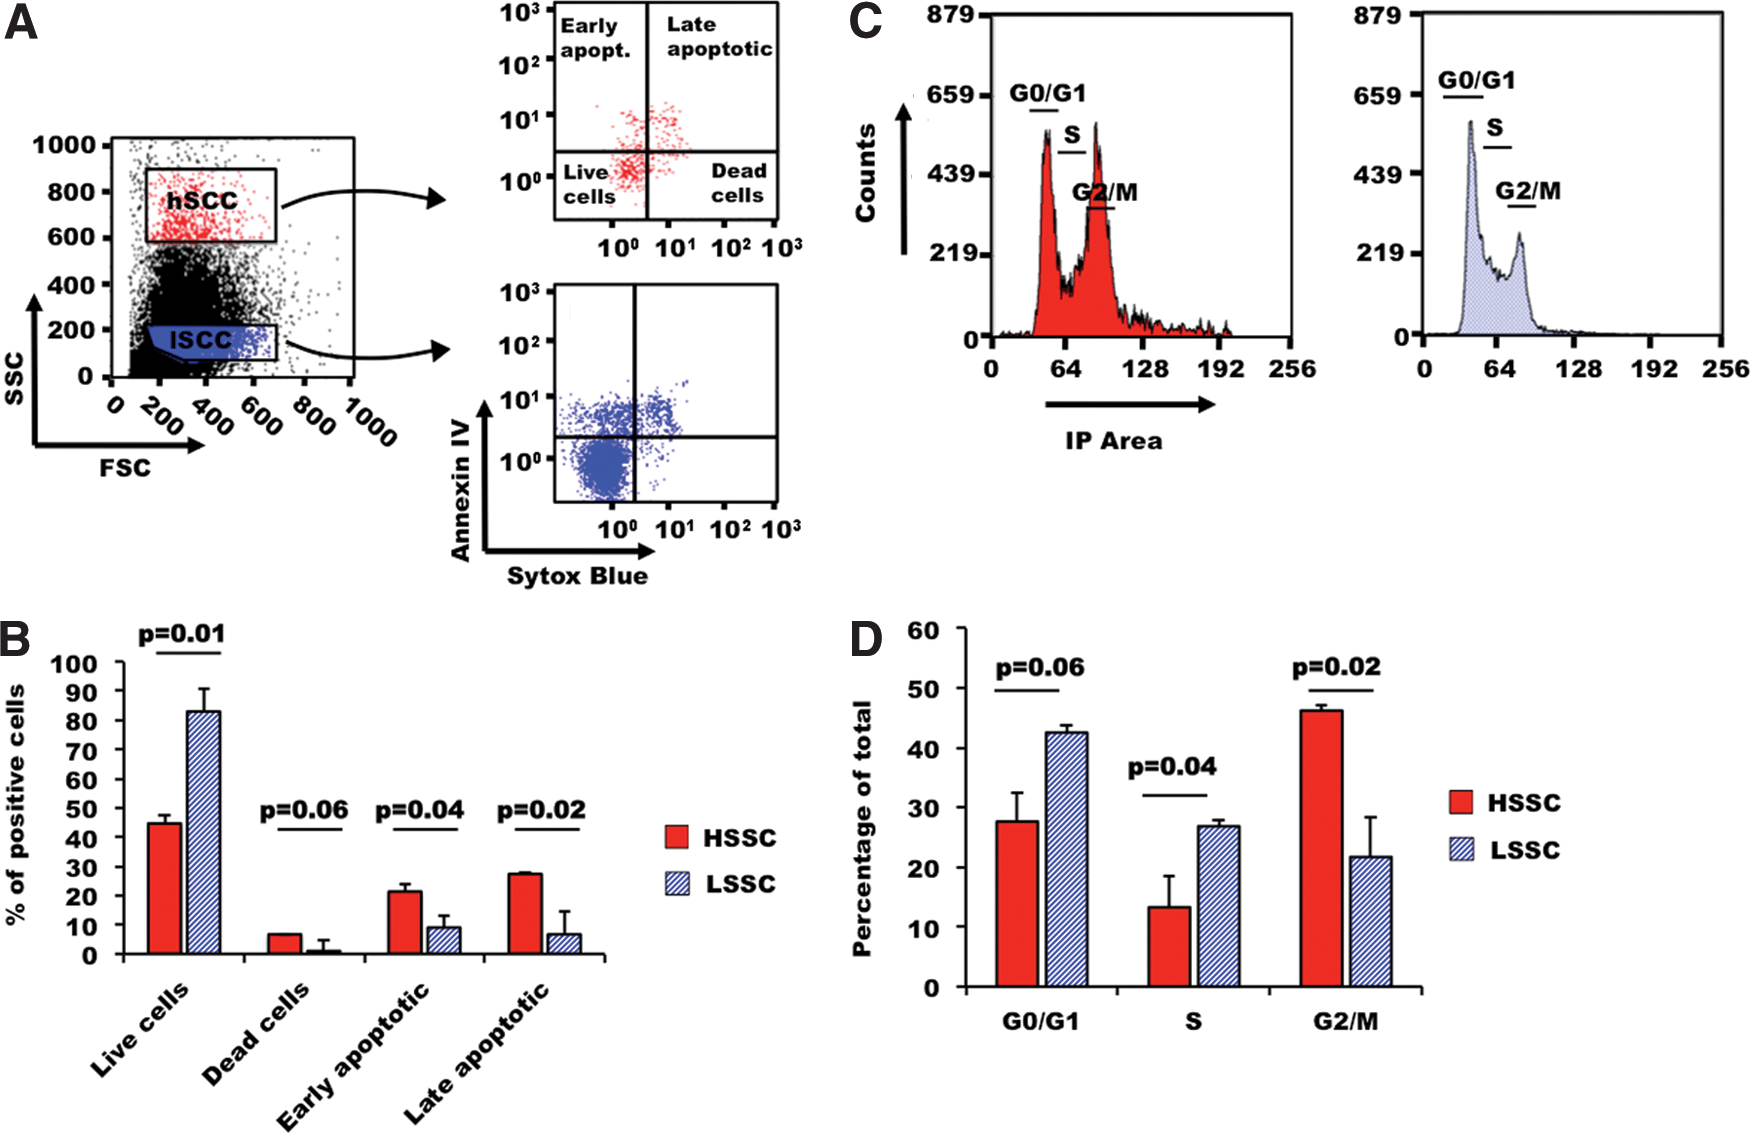
Cell cycle distribution and apoptosis rates in HSSC and LSSC cells. Apoptosis rates and cell cycle distribution were analyzed in M4C7 cells (hiPSCs).
Next, we investigated cell cycle progression in HSSC and LSSC cells. The percentage of cells in the G2/M phase was 2.1-fold higher, whereas the percentage of cells in the G0/G1 and S phase was reduced by 1.5- and 2-fold, respectively, in HSSC in comparison to LSSC cells (Fig. 5C, D).
HSSC and LSSC cells show distinct ultrastructural characteristics and mitochondrial content
As differences in SSC intensity are related to irregularities in the cell membrane, cytoplasm, or nucleus, we compared the ultrastructure of HSSC and LSSC PSCs by transmission electron microscopy (TEM). The most notable differences between the two cell populations were that HSSC cells were characterized by many rounded mitochondria that were distributed around the nucleus, whereas LSSC cells had many lipid vesicles in the cytoplasm (Fig. 6A, B). The higher mitochondrial content of HSSC cells was confirmed also by quantification of the mitochondrial-specific dye MitoTracker by flow cytometry (see Materials and Methods section). Indeed, MitoTracker accumulation was significantly higher in HSSC cells than in LSSC cells (Fig. 6C).

Ultrastructural analysis and the mitochondrial content of HSSC and LSSC cells.
Plural PSC compartments
The SSC parameter can thus delineate different PSC populations that do not overlap with the differential expression of the cell surface pluripotency marker SSEA3 (Fig. 3). Indeed, both HSSC and LSSC populations contained SSEA3-positive and -negative cells. As differential expression of SSEA3, SSEA4, TRA-1-81, TRA-1-60, and CD24 can delineate several PSC subsets that coexist in variable percentages in the different PSC lines [11], we assessed the association of these different markers and the SSC parameter (Fig. 7A–C). Like for SSEA3 alone, there was no overlap of the SSEA3, SSEA4, TRA-1-81, TRA-1-60, and CD24 compartments with the HSSC and LSSC populations, suggesting that SSC might represent another level of PSC heterogeneity. Moreover, many subpopulations expressed few pluripotency markers.
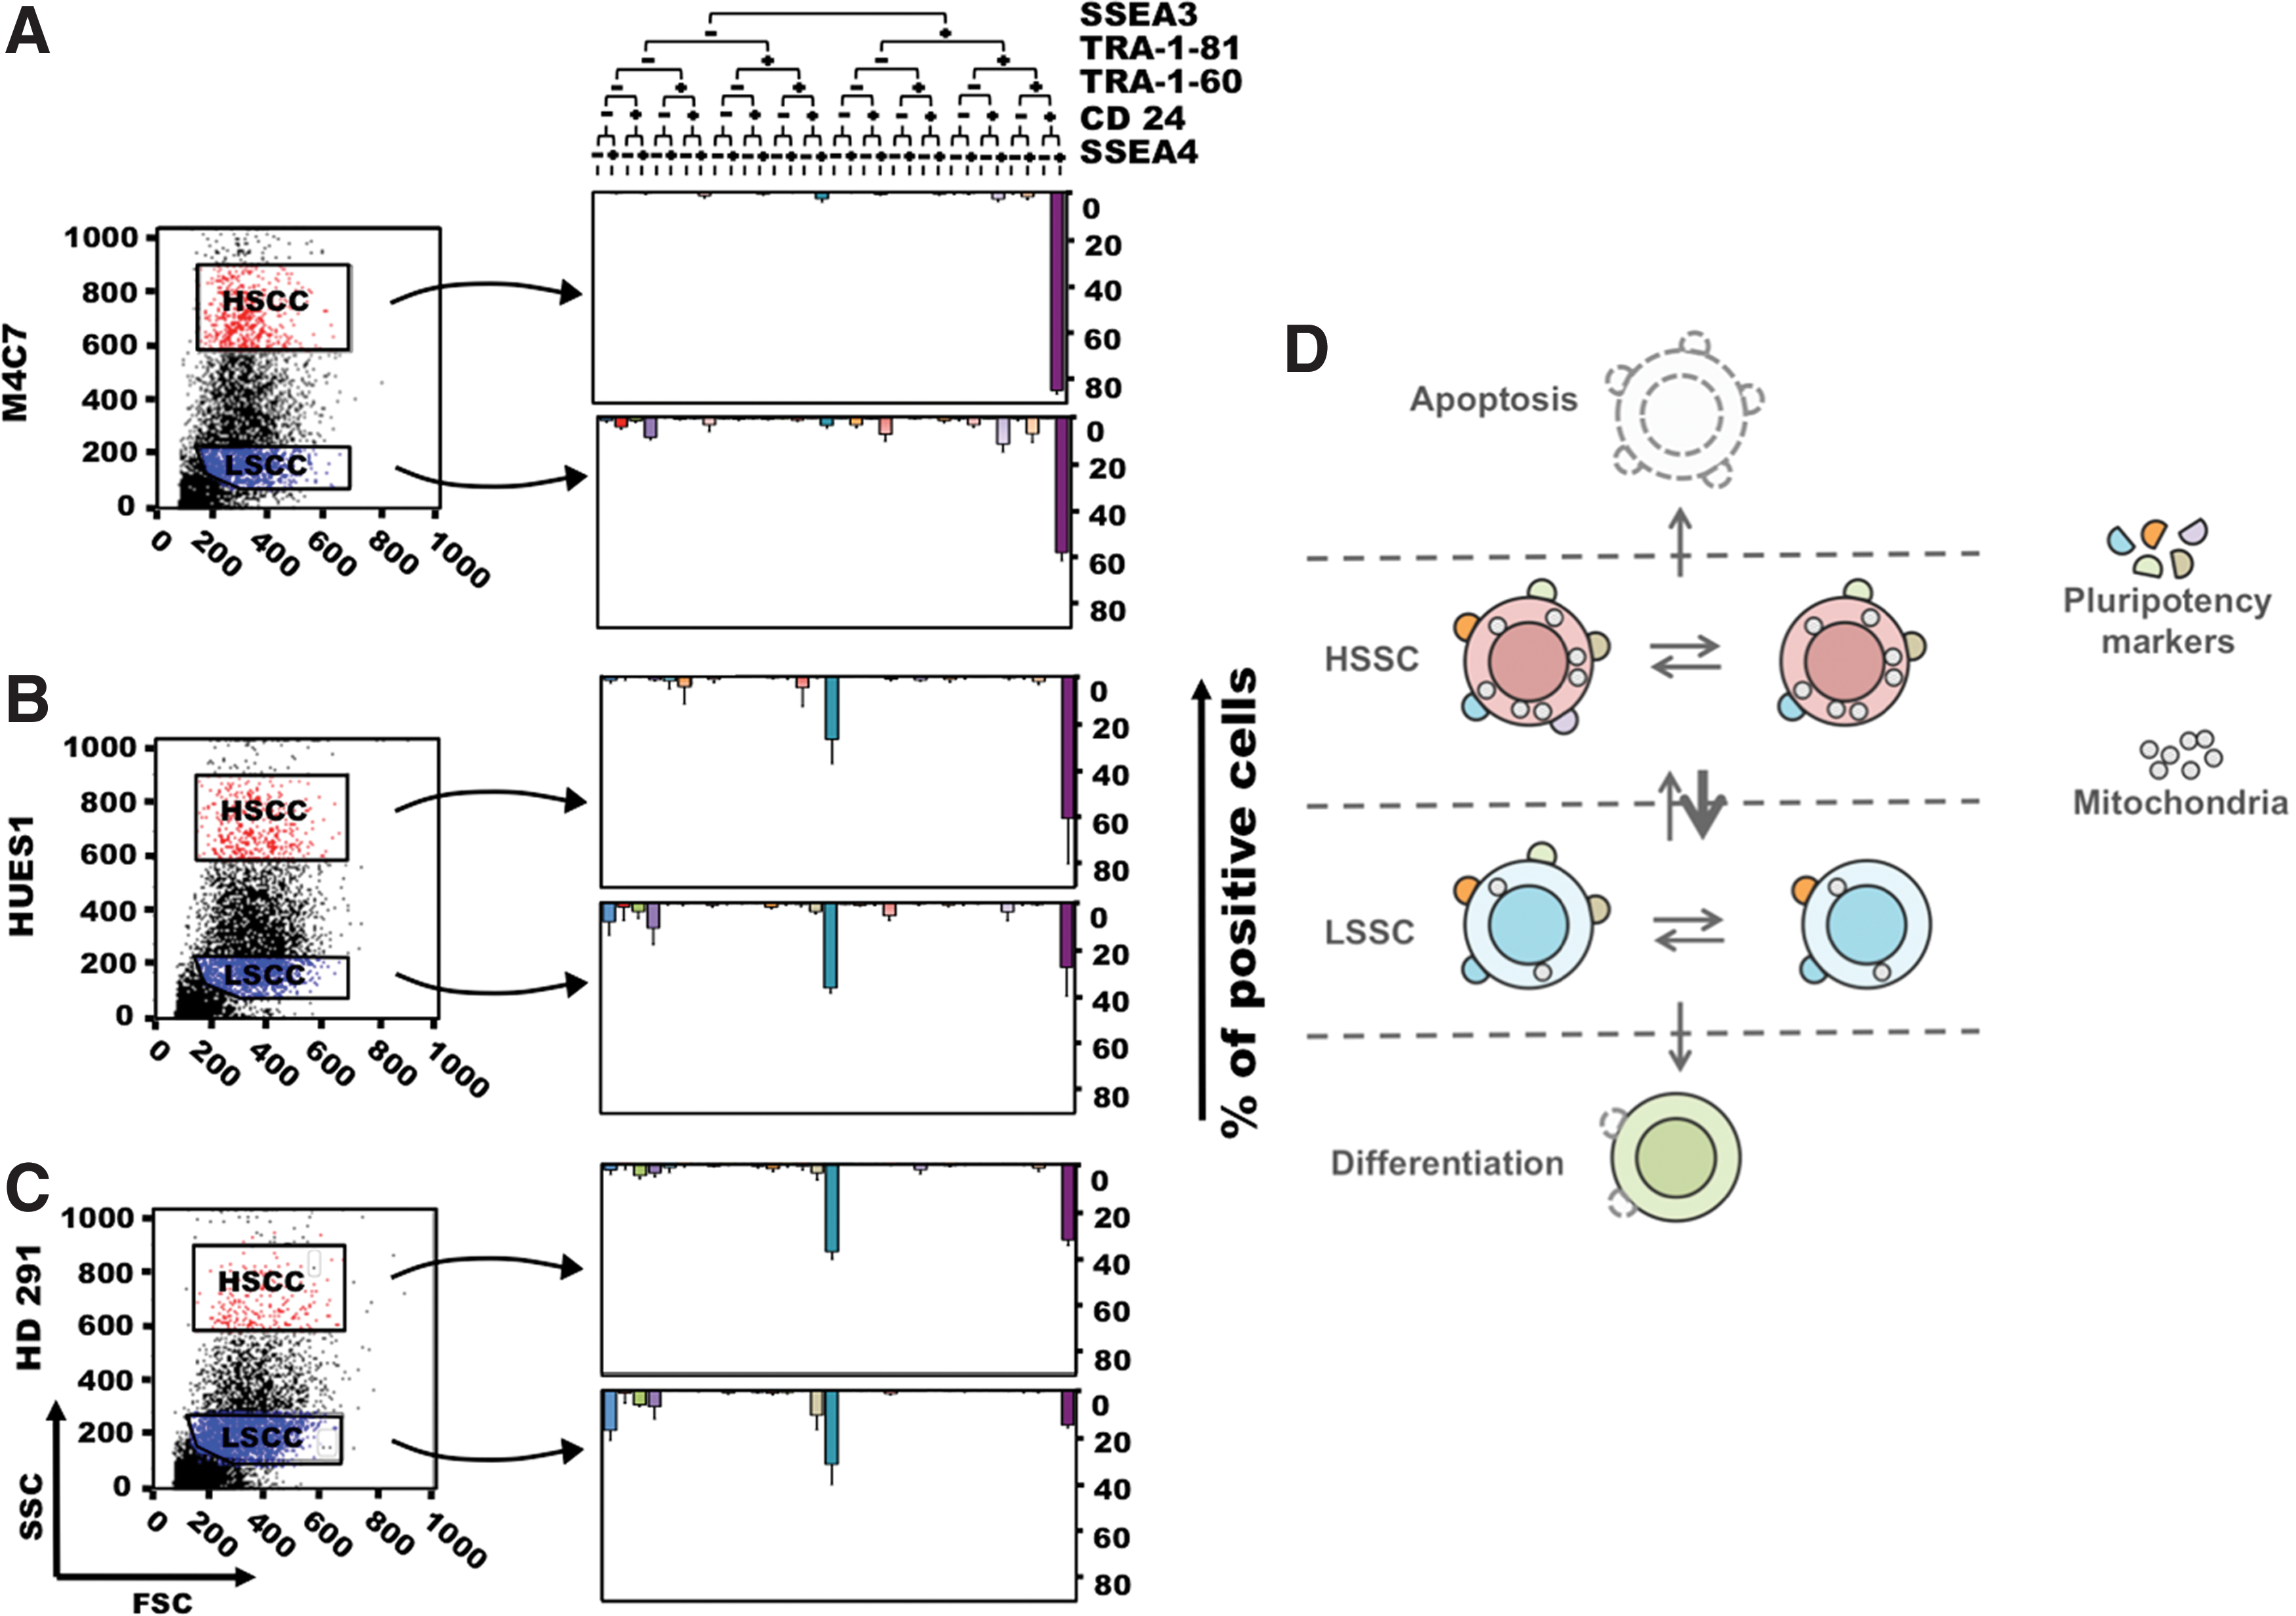
Plural PSC compartments. The cell subsets identified based on the expression of the cell surface pluripotency markers TRA-1-60, TRA-1-81, SEEA3, SEEA4, and CD24 in the in HSSC and LSSC subpopulations of M4C7 (hiPSCs)
Discussion
The molecular definition of stem cells is an old goal that has been only partially met. Single adult stem cells cannot be isolated and they can only be enriched based on specific factors the expression of which has been reported to be heterogeneous [5 –7,16]. This is also true for PSCs. For instance, SSEA3 is a cell surface marker strongly associated with pluripotency, but a PSC colony will contain both SSEA3-positive and -negative cells. Although SSEA3-negative cells are less prone to self-renewal and appear primed for differentiation, they can still generate SSEA3-positive cells in vitro and are pluripotent [9,12]. Our work reveals that also SSC, a basic parameter that is routinely monitored when cells are analyzed by flow cytometry, is very heterogeneous in human PSCs and many cells have very high or very LSSC values. SSC heterogeneity was comparable in different human PSC lines (three ESC and one hiPSC line), although hiPSCs are often thought to be more heterogeneous than ESCs and thus less stable [30]. As a matter of fact, expression of cell surface pluripotency markers in the hiPSC line M4C7 appeared to be less variable than in the three ESC lines analyzed.
The wide SSC distribution could not be explained by major morphological or phenotypically differences, as cycling and noncycling cells, apoptotic and nonapoptotic cells, SSEA3-positive and -negative cells were detected in both HSSC and LSSC populations, although some variations were observed. Neither it was explained by culture biases, such as the use of the Rock inhibitor Y27632. Indeed, cell lines that were cultured using mechanical passaging (HD83 cells) or semienzymatic passaging (HUES1cells), and thus were not exposed to this inhibitor were also highly heterogeneous (see Fig. 2D, B). The only consistent difference was the higher number of round-shaped mitochondria near the nucleus and the 2.1-fold increase in the mitochondrial content in HSSC in comparison to LSSC cells, suggesting that HSSC cells have a higher mitochondrial energy production than LSSC cells. This morphological feature could be related to random segregation of the mitochondria at cell division, as previously suggested for the cell-to-cell variability in the mitochondrial mass observed in the Hela cell line [31].
We then show that the size of the HSSC population diminishes dramatically and rapidly (day 5) following directed PSC differentiation or serum deprivation. SSC could thus be used as a simple, rapid and inexpensive tool to follow loss of pluripotency during cell culture or differentiation of PSCs, although it cannot substitute the analysis of pluripotency marker expression or functional assays, such as teratoma formation.
Although LSSC cells express lower amounts of pluripotency markers (suggesting that differentiation takes place essentially in this compartment), both HSSC and LSSC populations can form new PSC colonies, which contain HSSC and LSSC cells, and teratomas. In the model proposed by Enver et al., the SSEA3-positive ES compartment gives rise also to SSEA3-negative cells that can revert to the SSEA3-positive compartment or retain their multilineage differentiation potential, and then differentiate [9,12]. Here we show that both HSSC and LSSC compartments contain SSEA3-positive and -negative cells (Fig. 7C) and that LSSC cells can generate HSSC cells, although at a lower rate than HSSC cells. PSCs might thus fluctuate between compartments, as suggested by our findings (see Fig. 4) and similar experiments based on sorting for SSEA3 [9]. Overall, there might be a permanent shuffling between compartments, with a preferential exit toward apoptosis for cells with the highest SSC and toward differentiation for cells with the lowest SSC values (Fig. 7D).
Given the well-known PSC heterogeneity for some specific markers, it is surprising that SSC heterogeneity was never previously reported. As PSC heterogeneity may be a fundamental feature of undifferentiated cells [32] and especially of PSCs [16], their high and variable SSC values may have important biological implications, as suggested by the higher mitochondrial content and clonogenic self-renewal capacity of the HSSC population.
Footnotes
Acknowledgments
Supported by grants from the Association Française contre les Myopathies (AFM), the Région Languedoc-Roussillon (Chercheur d'Avenir 09-13198 01), and the Agence Nationale de la Recherche (ANR-07-BLAN-0076-01, ANR-08-BIOT-012-02). We thank E. Andermarcher for critical reading of this manuscript. We thank Montpellier RIO Imaging (MRI) for access to the flow cytometry department, the Centre de Ressources en Imagerie Cellulaire (CRIC) for TEM, and the Plateau Animalerie Inserm U583, Institut des Neurosciences de Montpellier (INM) for mice husbandry. The authors are grateful to Chantal Cazevieille and Cécile Sanchez for their technical assistance and interpreting TEM images. We thank the “Réseau d'Histologie Expérimentale de Montpellier (RHEM)” histology facility for processing our teratoma samples and Pascal Roger for the interpretation of the hematoxylin–eosin–safran-stained sections.
Author Disclosure Statement
No competing financial interests exist.