
Abstract
The developmental origin of a pancreatic precursor cell could provide clues to properties that may be crucial to its molecular regulation and therapeutic potential. Previously, lineage tracing experiments showed that multipotent precursors in mouse islets had a pancreatic and not a neural crest developmental origin. However, a different Cre reporter system reveals that there is, in fact, a rare population of proliferative cells in the pancreas that is descended from the Wnt1 neural crest lineage, in addition to the majority population descended from the Pdx1 pancreatic lineage. These two proliferative cell populations are distinct in their gene expression and differentiation potential. This evidence suggests that there are at least two distinct types of precursors present in adult pancreatic islets, one of pancreatic origin and one of neural crest origin.
Introduction
T
Pancreatic islets contain many cell types of multiple developmental origins. Exocrine and endocrine cells, such as β-cells, arise from a region of foregut endoderm that expresses the transcription factor, Pdx1 [5]. Islets also are innervated by neurons [6] and surrounded by Schwann cells [7], both of which are derived from the neural crest [8]. During development, neural crest-derived cells have been shown to influence the proliferation and maturation of β-cells in islets [9]. In adulthood, neural crest-derived ganglia relay signals from the parasympathetic nervous system [10]. The islet-surrounding Schwann cells ensheath incoming nerve fibers [7], but may also serve to protect endocrine cells in times of stress [11]. Islets also are highly vascularized, with β-cells being in direct contact with endothelial cells of mesodermal origin [12]. To recreate islets in vitro from PMPs, it is important to know if all precursors are equivalent in their ability to produce all cell types or whether the total PMP population is a collection of precursors of different origins and how these populations affect each other.
The multipotent nature of PMPs, especially their ability to produce both pancreatic and neural cells, suggested that they had a neural crest origin similar to proliferative cells with neural differentiation potential found in the skin [13] and small intestine [14]. These neural crest stem cells showed expression of the neural marker, p75 [14] and their developmental lineage was traced using the neural crest marker, Wnt1 [15]. Wnt1 is expressed, beginning at E8.5, in the neural plate, including the lateral tip, from which neural crest cells originate [16]. As the neural tube closes, Wnt1 continues to be expressed in delaminating dorsal midline cells, but is subsequently turned off as the cells migrate away from the neural tube [17]. Like other neural crest stem cells, PMPs can differentiate into neurons, glia, and smooth muscle actin (SMA)-expressing cells [3]. However, PMP colonies only variably expressed a subset of neural crest-related genes [3] and produced exocrine and endocrine progeny that neural crest stem cells do not. A more recent study tracked the ontogeny of PMPs by crossing Pdx1-Cre and Wnt1-Cre to the transgenic Z/EG reporter strain [4]. Fluorescence activated cell sorting (FACS) showed that 95% of PMPs came from the Pdx1 lineage and no PMPs came from the Wnt1 lineage. Taken together, these data indicated that PMPs are not derived from the neural crest and their ability to produce neural cells is a reflection of a shared toolbox of genes or common evolutionary origin [18].
The pancreatic and neural crest lineages also can be differentiated on the basis of their developmental reliance on Pax6. Pax6 is known to be critical for the formation of α-cells [19] as well as the maturation of other endocrine cells in islets [20] during pancreatic development. It also is involved in the differentiation of neurons from precursors in the adult brain [21], but has not been implicated in the formation of neurons in the peripheral nervous system [22].
In previous studies, lineage-labeled PMPs were not examined for differences in gene expression or differentiation potential, which may have provided clues to the identity of the 5% of precursors that did not come from Pdx1-expressing cells. Additionally, the transgenic Z/EG reporter line is susceptible to silencing, which can inhibit Cre-mediated recombination and GFP expression [23]. Confocal imaging of pancreatic sections from Pdx1-Cre; Z/EG mice showed incomplete GFP-labeling of both exocrine and endocrine cells. Given this information, we hypothesized that a more reliable reporter system would result in 100% of sphere-forming cells coming from the pancreatic lineage so Pdx1-Cre and Wnt1-Cre lineage tracing experiments were done using ROSA-YFP reporter mice. Although labeling of the pancreas was more uniform in Pdx1-Cre; ROSA-YFP mice, spheres were still found in the YFP-negative fraction of cells. Further experiments showed that PMPs represent a population of two different types of precursors, one of pancreatic origin that differentiates primarily into pancreatic cells and one of neural crest origin that differentiates primarily into neural cells. Additionally, the in vitro knockdown of Pax6 in PMPs resulted in reduced differentiation of endocrine cells, but not neurons, consistent with the production of neurons being primarily from neural crest precursors and not pancreatic precursors.
Materials and Methods
Animals
All animal studies were approved by the Office of Research Ethics and Animal Care Committee at the University of Toronto. Mice used in this study were Pdx1-Cre [24], Wnt1-Cre [25], and Myf5-Cre [26], ROSA-YFP [27](Jackson Labs), Z/EG [28](Jackson Labs), Z/RED [29] (Jackson Labs), NMRI (Jackson Labs, Wild-type control for Pax6 knockout—noted as Pax6wt /wt ), Pax6wt /flox and Pax6flox /flox [30] (kind gifts from Dr. Peter Gruss).
Cell culture
Pancreases from ≥8-week-old mice were perfused with Type V Collagenase (1–2 mg/mL, Sigma), removed, and digested for 15 min at 37°C. Islets were separated by Ficoll density gradient centrifugation (Ficoll Type 400-DL, Sigma, 25%, 23%, 11.5%, 10 min at 2000 rpm), rinsed, and picked to ensure purity. Islets were digested with Trypsin-EDTA for 5 min at 37°C and triturated by hand using a small borehole siliconized pipette. Following FACS, cells were counted using Trypan Blue exclusion and plated at a density of 10,000 cells per well in serum-free media (SFM; [31]) containing 1×B27 (Gibco-BRL), 10 ng/mL FGF2 (Sigma), 20 ng/mL EGF (Sigma), and 2 μg/mL heparin (Sigma) in 24-well-uncoated plates (BD Biosciences) and allowed to grow for 2 weeks with media replacement after 1 week. For differentiation, individual colonies were transferred to wells coated with the Matrigel basement membrane matrix (0.6 mg/mL, Becton-Dickinson) in SFM containing 1% fetal bovine serum and grown for an additional 2 weeks. For single sphere passaging, individual colonies were digested with Trypsin-EDTA for 5 min at 37°C, 5 min at room temperature, triturated, and plated, one sphere per well, in the same media as primary spheres, in 96-well tissue culture plates (Nunc).
Fluorescence activated cell sorting
Islet cells were isolated as described and sorted based on YFP expression with a FACSAria System (BD Biosciences). For each sort, a control sample was plated without going through the FACS machine and a control sample was run without gating.
DNA isolation, RNA isolation, reverse transcription-polymerase chain reaction
Total RNA was extracted from individual spheres using an RNeasy Micro Kit (Qiagen), including DNase treatment or DNA, and RNA were isolated using an AllPrep RNA/DNA Micro Kit (Qiagen). PCR on genomic DNA (neomycin primers: AGGATCTCCTGTCATCTCACCTTGCTCCTG, AAGAACTCGTCAAGAAGGCGATAGAAGGCG) was performed using the HotStarTaqPlus PCR Kit (Qiagen). Reverse transcription-polymerase chain reaction (RT-PCR) was performed using the OneStep RT-PCR kit (Qiagen) in a GeneAmp PCR System 9700 (Applied Biosystems). Mouse Universal Reference Total RNA (Zyagen) was used as a positive control. Forward and reverse primers were published previously [3]. N≥3 experiments.
Immunocytochemistry and immunohistochemistry
Single colonies were fixed in 4% paraformaldehyde (PFA, Sigma) for 20 min. Cells were permeabilized for 5 min with 0.3% Triton X-100 (Sigma) and blocked for 1 h with 10% normal goat serum (NGS, Jackson Immunoresearch) and 1% bovine serum albumin (BSA; Sigma). The primary antibody was incubated overnight at 4°C in 2% NGS and the secondary antibody was incubated for 50 min at 37°C in 2% NGS. Cells were incubated in 10ug/mL Hoechst nuclear stain (Sigma) for 10 min at room temperature. Images were taken using an Axiovert inverted fluorescence microscope with an AxioCam MRm camera and AxioVision v4.6 imaging software (Zeiss). Primary antibodies include anti-YFP mouse monoclonal (IgG, 1:50; abm), anti-GFP rabbit polyclonal (IgG, 1:100; Invitrogen), anti-insulin mouse monoclonal (IgG, 1:1000; Sigma), anti-C-peptide rabbit polyclonal (IgG, 1:350; Linco), anti-glucagon mouse monoclonal (IgG, 1:500; Sigma), anti-β3-tubulin mouse monoclonal (IgG, 1:500; Sigma), anti-β3-tubulin rabbit polyclonal (IgG, 1:500; Sigma), anti-SMA mouse monoclonal (IgG, 1:250; Sigma), anti-S100β mouse monoclonal (IgG, 1:1000; Sigma), anti-Pax6 mouse monoclonal (IgG, 1:50 Developmental Studies Hybridoma Bank), anti-somatostatin rabbit polyclonal (IgG, 1:200 ImmunoStar), anti-amylase rabbit polyclonal (IgG, 1:100 Sigma), anti-Pdx1 rabbit polyclonal (IgG, 1:7500; Millipore), and anti-Ngn3 rabbit polyclonal (IgG, 1:10,000 Millipore)(IgG, 1:20,000 Developmental Studies Hybridoma Bank). Pdx1 and Ngn3 antibodies were used in conjunction with TSA-Cy3 amplification (Perkin Elmer) and peroxidase goat anti-rabbit (IgG, 1:10,000 Invitrogen). Secondary antibodies used were 488 goat anti-mouse, 568 goat anti-mouse, 488 goat anti-rabbit, and 568 goat anti-rabbit (1:400, Alexa; Invitrogen). Secondary-only controls were processed in the same manner and were negative for staining.
Animals were perfused with 4% PFA before removing the pancreas. Pancreases were soaked in 4% PFA overnight followed by 30% sucrose, incubated overnight, and embedded in cryomatrix (Ted Pella) before freezing. Ten micrometer sections were obtained using a Jencons OTF5000 cryostat and mounted on Superfrost Plus slides (Fisher Scientific). Tissue slices were stained using the protocol described above for cells. Images were obtained using an Olympus FluoView1000 confocal system.
Adenovirus infections
Islets were isolated from Pax6 wt/wt, Pax6 wt/flox, and Pax6 flox/flox mice and digested as described. Adenovirus-GFP (Ad-CMV-GFP; Vector Biolabs) or Adenovirus-Cre (Ad-CMV-Cre-IRES-GFP; Vector Biolabs) was added at a multiplicity of infection of 100, and cells were plated in the conditions described above. Spheres were grown for 2 weeks before they were collected for quantitative real-time PCR (QPCR) or differentiated as described above. Control samples were plated in the same fashion without virus addition.
Quantitative real-time PCR
RNA was isolated as described above. Total RNA was quantified using a NanoDrop ND-1000 spectrophotometer. CDNA was prepared from RNA using 200 U SuperScript III RNase H–Reverse Transcriptase (Invitrogen) and 0.2 ng random hexamer primer (6-mer, Fermentas) and 0.2 ng Oligo (dT)18 primer (Fermentas). Q-PCR was performed using predesigned TaqMan gene expression assays with TaqMan universal PCR master mix (both Applied Biosystems) under universal cycling conditions (95°C for 10 min, 95°C for 15 s, 60°C for 1 min for 40 cycles) on a 7900HT Fast Real-Time PCR System (Applied Biosystems). Reactions were in triplicate and always included a negative control (no template) with HPRT as an endogenous control.
Statistics
Appropriate statistical tests were performed using GraphPad Prism version 5.01, n≥3 experiments. Data expressed as mean±S.E.M., α=0.05, *=P<α.
Results
The Pdx1 lineage does not give rise to all precursors present in pancreatic islets
Previous studies using Pdx1-Cre; Z/EG mice suggested that only the pancreatic lineage, and not the neural crest lineage, gives rise to precursors present in mammalian islets [3,4]. However, confocal sections of pancreas from Pdx1-Cre; Z/EG mice show variable expression of GFP from the Z/EG reporter (Fig. 1A). On the other hand, confocal sections from Pdx1-Cre; ROSA-YFP mice show stable expression of YFP throughout the pancreas (Fig. 1B), while sections from ROSA-YFP mice alone show no aberrant expression of the YFP protein (Fig. 1C). Furthermore, YFP expression overlaps completely with expression of the endocrine markers, insulin (Fig. 1D) and glucagon (Fig. 1E), but not the Schwann cell marker, S100β (Fig. 1F), indicating that Pdx1-Cre; ROSA-YFP faithfully recapitulates the expected developmental pattern of the pancreas with endocrine and exocrine cells coming from Pdx1-expressing precursors.
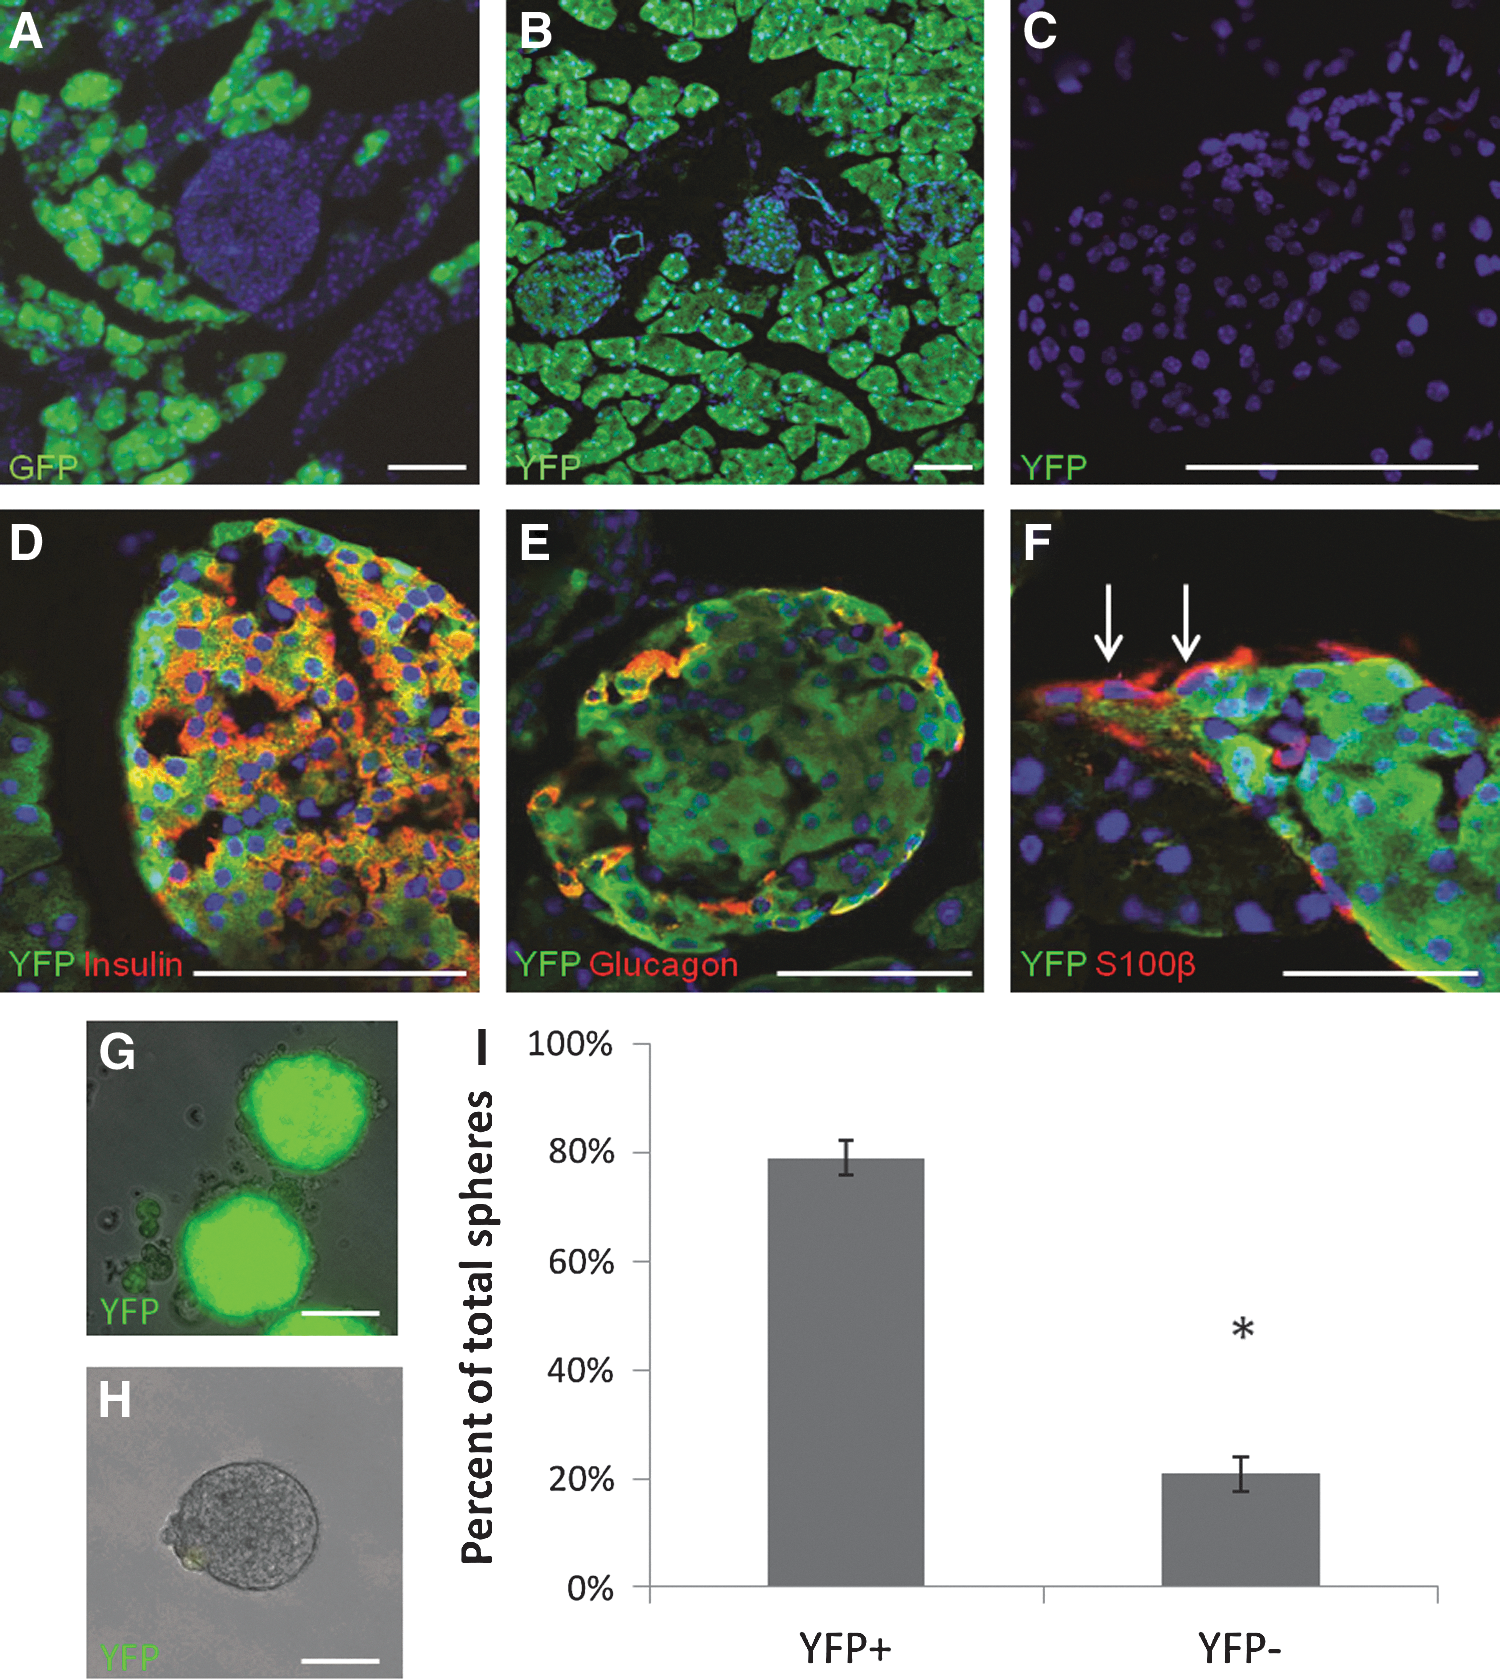
In Pdx1-Cre; ROSA-YFP mice, the pancreatic lineage is labeled with YFP, but not all sphere-forming cells are found in the YFP-positive fraction.
To test the hypothesis that all PMPs come from the Pdx1-positive pancreatic lineage, islets from Pdx1-Cre; ROSA-YFP were digested to a single-cell suspension and separated into YFP-positive and YFP-negative fractions using FACS (Supplementary Fig. S1A; Supplementary Data are available online at
Pdx1pos precursors have a pancreatic phenotype, while Pdx1neg precursors have neural crest characteristics
To test whether Pdx1pos and Pdx1neg spheres represent distinct populations, RT-PCR was performed on single clonal spheres from each population (Supplementary Fig. S2). Pdx1pos spheres express the pancreatic markers Pdx1 (16/16 spheres), Pax6 (13/15 spheres), insulin-1 (18/18 spheres), insulin-2 (13/13 spheres), and glucagon (12/12 spheres). They also expressed the neural marker, β3-tubulin (16/18 spheres) and variably expressed nestin (3/15 spheres), but did not express the neural crest marker, p75 (0/15 spheres) and rarely expressed snail (1/15 spheres). Pdx1neg spheres did not express Pdx1 (0/13 spheres), Pax6 (0/12 spheres), or insulin-1 (0/15 spheres), but they did express insulin-2 (13/13 spheres) and glucagon (11/12 spheres) as well as β3-tubulin (15/15 spheres), nestin (12/12 spheres), p75 (10/12 spheres), and snail (12/12 spheres). Although the presence of insulin-2 and glucagon suggests pancreatic potential, the expression of p75 and snail support a neural crest origin of these precursors. Overall, these data show that precursor spheres of pancreatic origin express a distinct pancreatic profile, while spheres of a nonpancreatic origin express more neural crest characteristics.
Pdx1pos and Pdx1neg sphere-forming populations were examined for their differentiation potential. Single spheres were plated in individual wells coated with Matrigel in 1% serum for 2 weeks and stained for multiple pancreatic and neural markers. Differentiated Pdx1pos spheres gave rise to significantly more cells expressing the β-cell markers, insulin (Fig. 2A) and C-peptide (Fig. 2B) and the α-cell marker, glucagon (Fig. 2C), as compared to Pdx1neg spheres. Differentiated spheres from both populations expressed the neuronal marker β3-tubulin. However, in the Pdx1pos population, this expression was restricted mostly to small rounded cells, a non-neuronal morphology (Fig. 2D - arrowhead). Interestingly, a small number of β3-tubulin-expressing cells from Pdx1pos spheres did seem to have elongated processes, a neuronal morphology (Fig. 2D–arrow), suggesting that pancreatic cells are capable of generating neurons, as previously reported [3,4]. In the Pdx1neg population, β3-tubulin expression was seen in cells having a neuronal morphology (Fig. 2E). A similar staining pattern was observed with another neuronal marker, MAP2 (Supplementary Fig. S3A). Pdx1pos spheres also differentiated into significantly fewer SMA-expressing cells than Pdx1neg spheres (Fig. 2F). Pdx1pos and Pdx1neg spheres gave rise to similar proportions of cells expressing the Schwann cell marker, S100β (Supplementary Fig. S3B). All together, these data are consistent with the idea that Pdx1pos precursors are mainly pancreatic in nature, while Pdx1neg precursors are neural crest in nature.
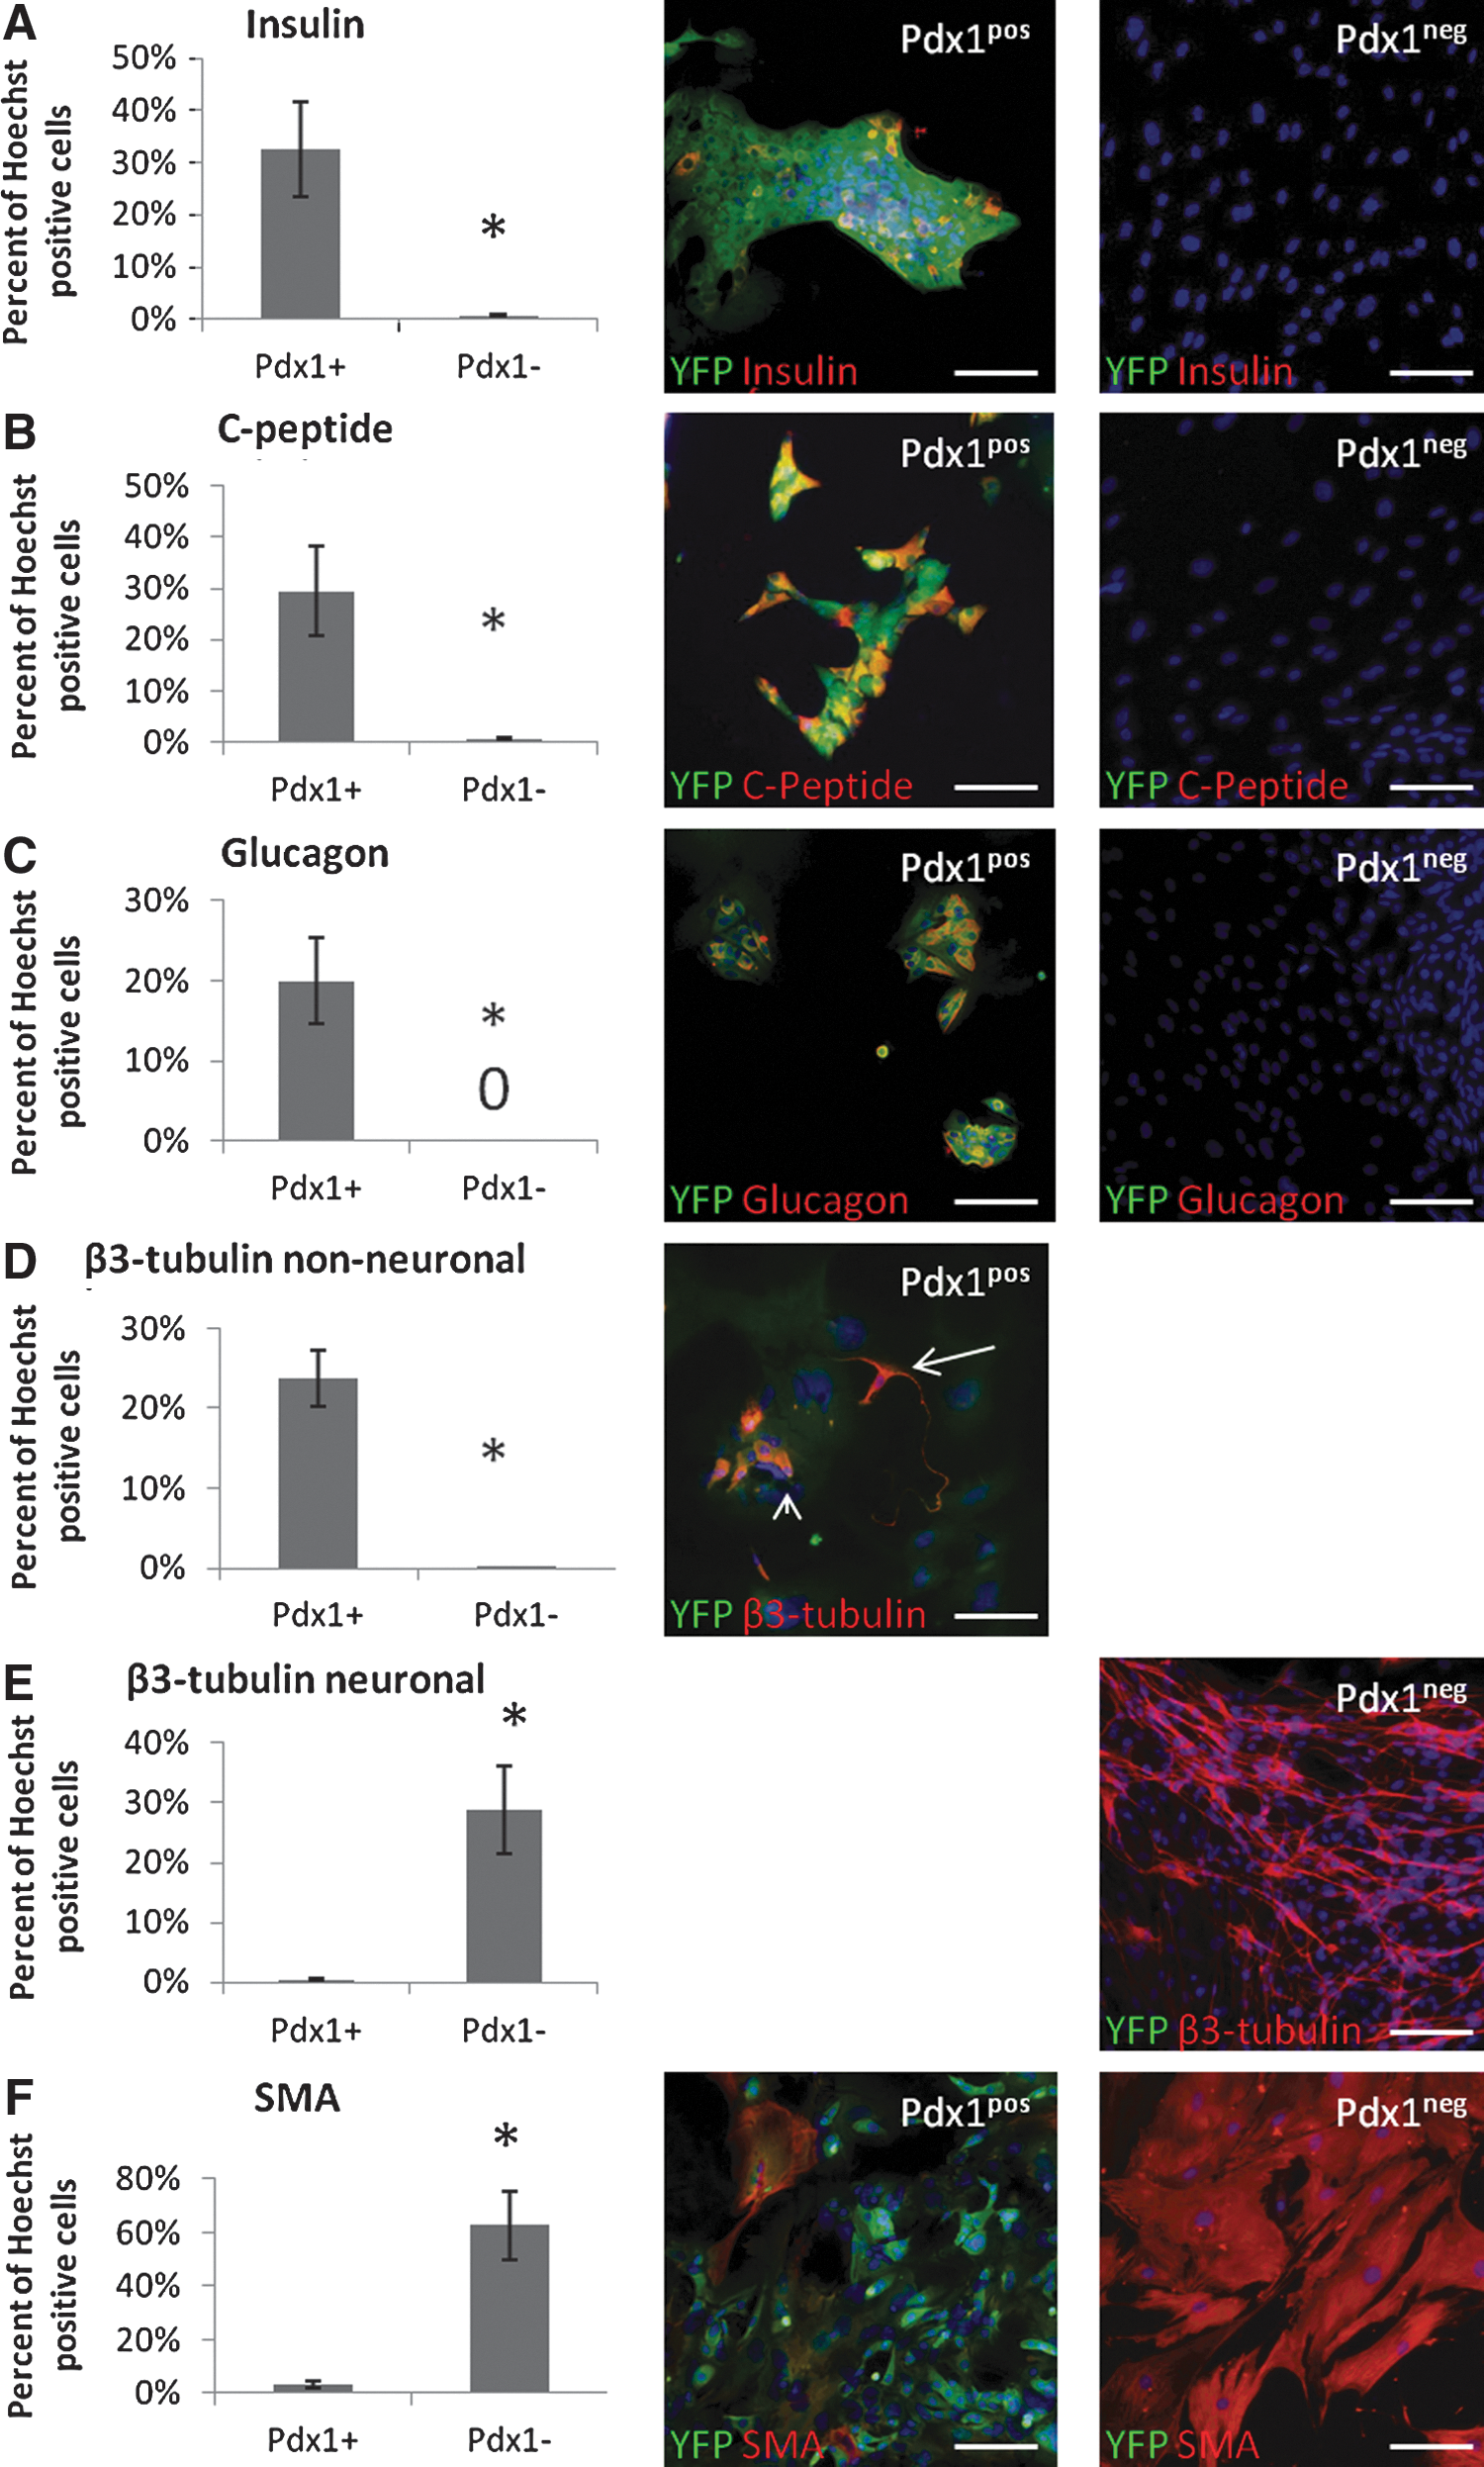
Upon differentiation, Pdx1pos spheres generate pancreatic cells, while Pdx1neg spheres generate neural cells.
The self-renewal capacity of these distinct precursor populations also was tested. Single spheres were dissociated, plated in individual wells, and grown for 3 weeks after which secondary spheres were quantified. There was no significant difference between Pdx1pos and Pdx1neg populations in terms of their ability to give rise to secondary spheres (Supplementary Fig. S3C) and neither precursor type demonstrated robust self-renewal. The limited passaging of both Pdx1pos and Pdx1neg fractions of the PMP population is consistent with the low PMP self-renewal previously described [3,4].
The neural crest gives rise to a rare population of precursors in pancreatic islets
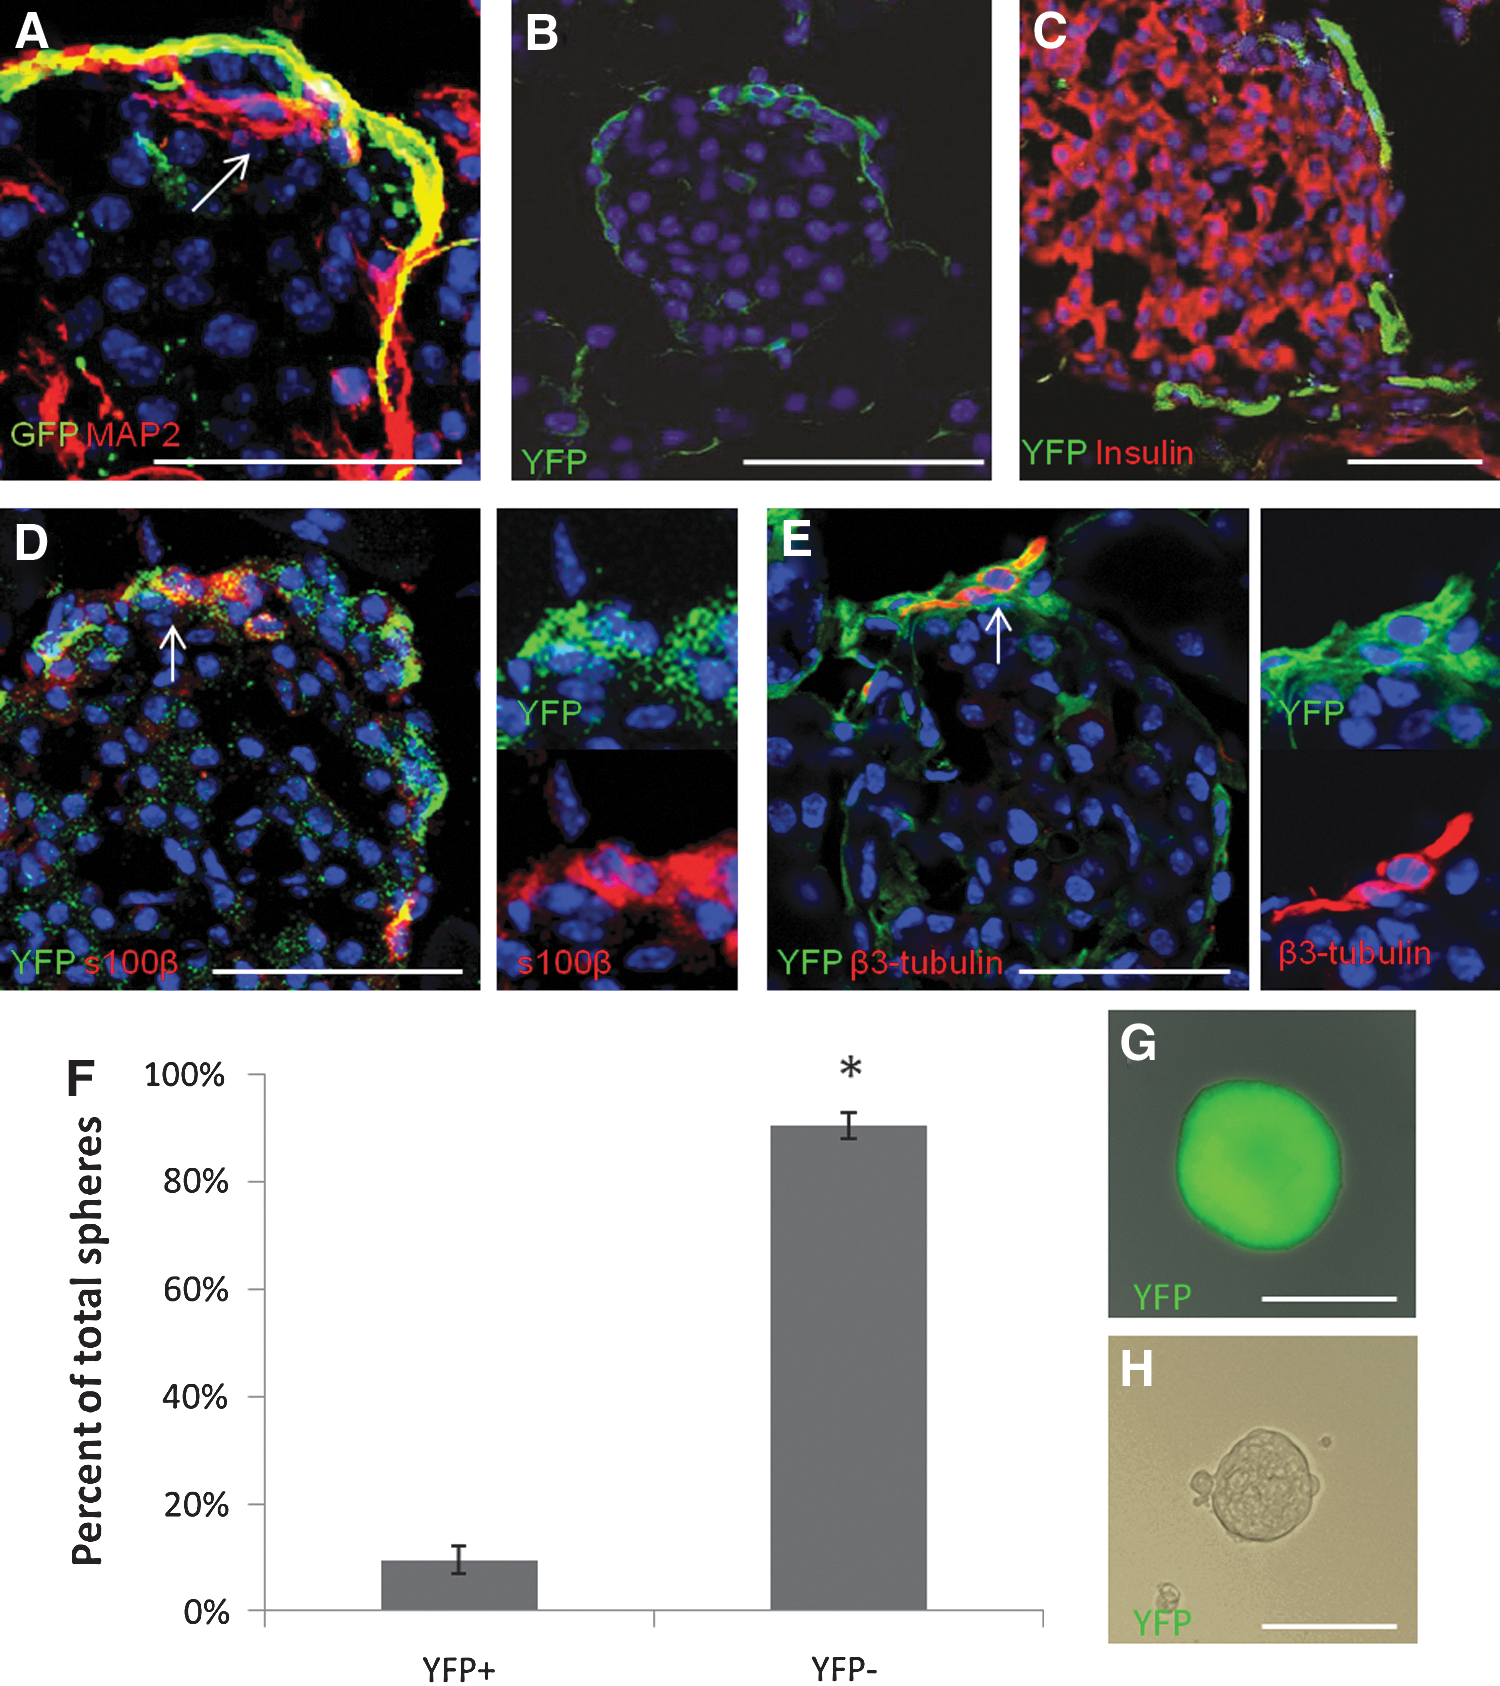
RT-PCR and immunocytochemistry on Pdx1neg spheres indicated that they may represent a neural crest-derived population. Wnt1 has previously been used to track the neural crest lineage and its progeny in vivo [32,15]. The Wnt1-Cre construct used in this study closely mimics the expected pattern of Wnt1 expression and is restricted to the developing neural tube [25]. Lineage tracing using Wnt1-Cre; Z/EG mice indicated that the neural crest lineage did not give rise to any islet cells with sphere-formation capabilities [4]. Confocal sections of pancreas from Wnt1-Cre; Z/EG mice show expression of GFP in expected locations, namely, in cells surrounding islets, with neuronal or Schwann cell morphology, but not all neural cells in the pancreas expressed GFP (Fig. 3A). Smukler et al. (2011) suggested that these GFP-negative neuronal cells were derived from the pancreatic lineage [4]; however, this also could be an indication that the reporter is not expressed in all cells from the Wnt1 lineage or Wnt1-Cre does not label all neural crest cells that migrate to the pancreas. Confocal sections of pancreas from Wnt1-Cre; ROSA-YFP mice show expression of the YFP marker in cells surrounding islets that resemble neuronal and Schwann cells (Fig. 3B). YFP expression does not overlap with the pancreatic marker, insulin (Fig. 3C), but it does overlap with S100β (Fig. 3D–arrows) and β3-tubulin (Fig. 3E–arrow). This indicates that the Wnt1-Cre; ROSA-YFP system labels the expected neural crest lineage and does not overlap with the Pdx1 lineage.
In Wnt1-Cre; ROSA-YFP mice, the neural crest lineage is labeled with YFP and sphere-forming cells are found in the YPF-positive fraction.
Islets from Wnt1-Cre; ROSA-YFP mice were dissociated and sorted by FACS into YFP-positive and -negative populations (Supplementary Fig. S4A). As expected, a significant majority of the cells were in the YFP-negative fraction (Supplementary Fig. S4B), indicating that most islet cells are of non-neural crest origin. Single cells from both fractions were plated in the clonal sphere-formation assay. Spheres were formed in both the YFP-positive (Wnt1pos) and YFP-negative (Wnt1neg) fractions, with significantly more spheres appearing in the YFP-negative fraction (90.5%±2.5%, Fig. 3F). Spheres were formed at similar frequencies in both populations (Supplementary Fig. S3C) and grew to similar sizes (Fig. 3G, H). The difference in the absolute numbers of clonal spheres from pancreatic and neural crest origins appears to be due to the fact that there are far fewer neural crest cells in islets than there are endocrine cells. This suggests that, contrary to previous findings [3,4], the neural crest does give rise to precursors in adult mouse islets.
Neural crest-derived precursors from the pancreas exhibit neural crest characteristics
To test whether Wnt1pos precursors in the pancreas expressed neural crest properties, single sphere RT-PCR was performed on spheres from both the Wnt1pos and Wnt1neg populations (Supplementary Fig. S5). Previously, single PMP spheres were shown to occasionally express the neural crest markers p75, slug, and snail, but not Pax3, Twist, Sox10, or Wnt1 [3]. Wnt1pos spheres expressed β3-tubulin (3/3 spheres) and nestin (6/6 spheres), as well as p75 (3/3 spheres). However, they only variably expressed snail (2/5 spheres). Wnt1pos spheres did not express Pdx1 (0/7 spheres), Pax6 (1/6 spheres), insulin-1 (0/7 spheres), or glucagon (0/4 spheres), but they did variably express insulin-2 (3/7 spheres). Wnt1neg spheres expressed Pdx1 (9/9 spheres), Pax6 (5/6 spheres), insulin-1 (9/9 spheres), insulin-2 (9/9 spheres), and glucagon (6/6 spheres) as well as nestin (8/9 spheres) and snail (5/6 spheres), but not p75 (0/6 spheres) and only rarely β3-tubulin (1/6 spheres). These RT-PCR data support the hypothesis that Wnt1pos spheres are derived from the neural crest, while Wnt1neg spheres represent pancreatic precursors. In both the Pdx1 lineage tracing experiment and the Wnt1 lineage tracing experiment, glucagon and snail expression were found in the YFP-negative populations, suggesting there still may be a rare, unaccounted for, precursor population.
Wnt1pos and Wnt1neg sphere populations also were tested for their differentiation potentials. Wnt1neg sphere progeny produced significantly more cells that were positive for the β-cell markers, insulin (Fig. 4A) and C-peptide (Fig. 4B) and the α-cell marker, glucagon (Fig. 4C) than Wnt1pos spheres, which showed no expression of these proteins. Wnt1pos spheres had a significantly higher proportion of β3-tubulin-positive cells with a neuronal morphology (Fig. 4E), while Wnt1neg spheres had a significantly higher proportion of round β3-tubulin-positive cells (Fig. 4D). Interestingly, 76.5%±7.8% of insulin-positive cells from Wnt1neg spheres also expressed β3-tubulin (Fig. 4D). This could represent nonspecific staining of the β3-tubulin antibody, however, the effect was similar with two different antibodies and overlap of β3-tubulin and glucagon was never observed (data not shown), suggesting this effect is at least specific to insulin-expressing cells. As with Pdx1 lineage tracing experiments, both Wnt1pos and Wnt1neg spheres produced a small number of S100β-positive cells (5.6%±2.7% and 2.5%±1.3%, respectively). Together, these data suggest that Wnt1pos precursors have neural crest potential, while Wnt1neg precursors have mainly pancreatic potential. Neural crest-derived cells in the skin produce SMA-expressing cells [13], so we also predicted that SMA-expressing cells would be formed from neural crest precursors in the pancreas. However, we found that the Wnt1neg population formed the majority of the SMA-expressing cells (Fig. 4F). Together with glucagon and snail expression, the fact that SMA-expressing cells were produced from spheres in the negative fraction in both Pdx1 and Wnt1 lineage tracing experiments may suggest that there is a third precursor population in the pancreas. In confirmation of RT-PCR results, Wnt1neg spheres produced significantly more Pax6-positive cells than Wnt1pos spheres (Supplementary Fig. S6A). These findings support our hypothesis that sphere-forming cells from the Wnt1-positive lineage are genuine neural crest precursors.
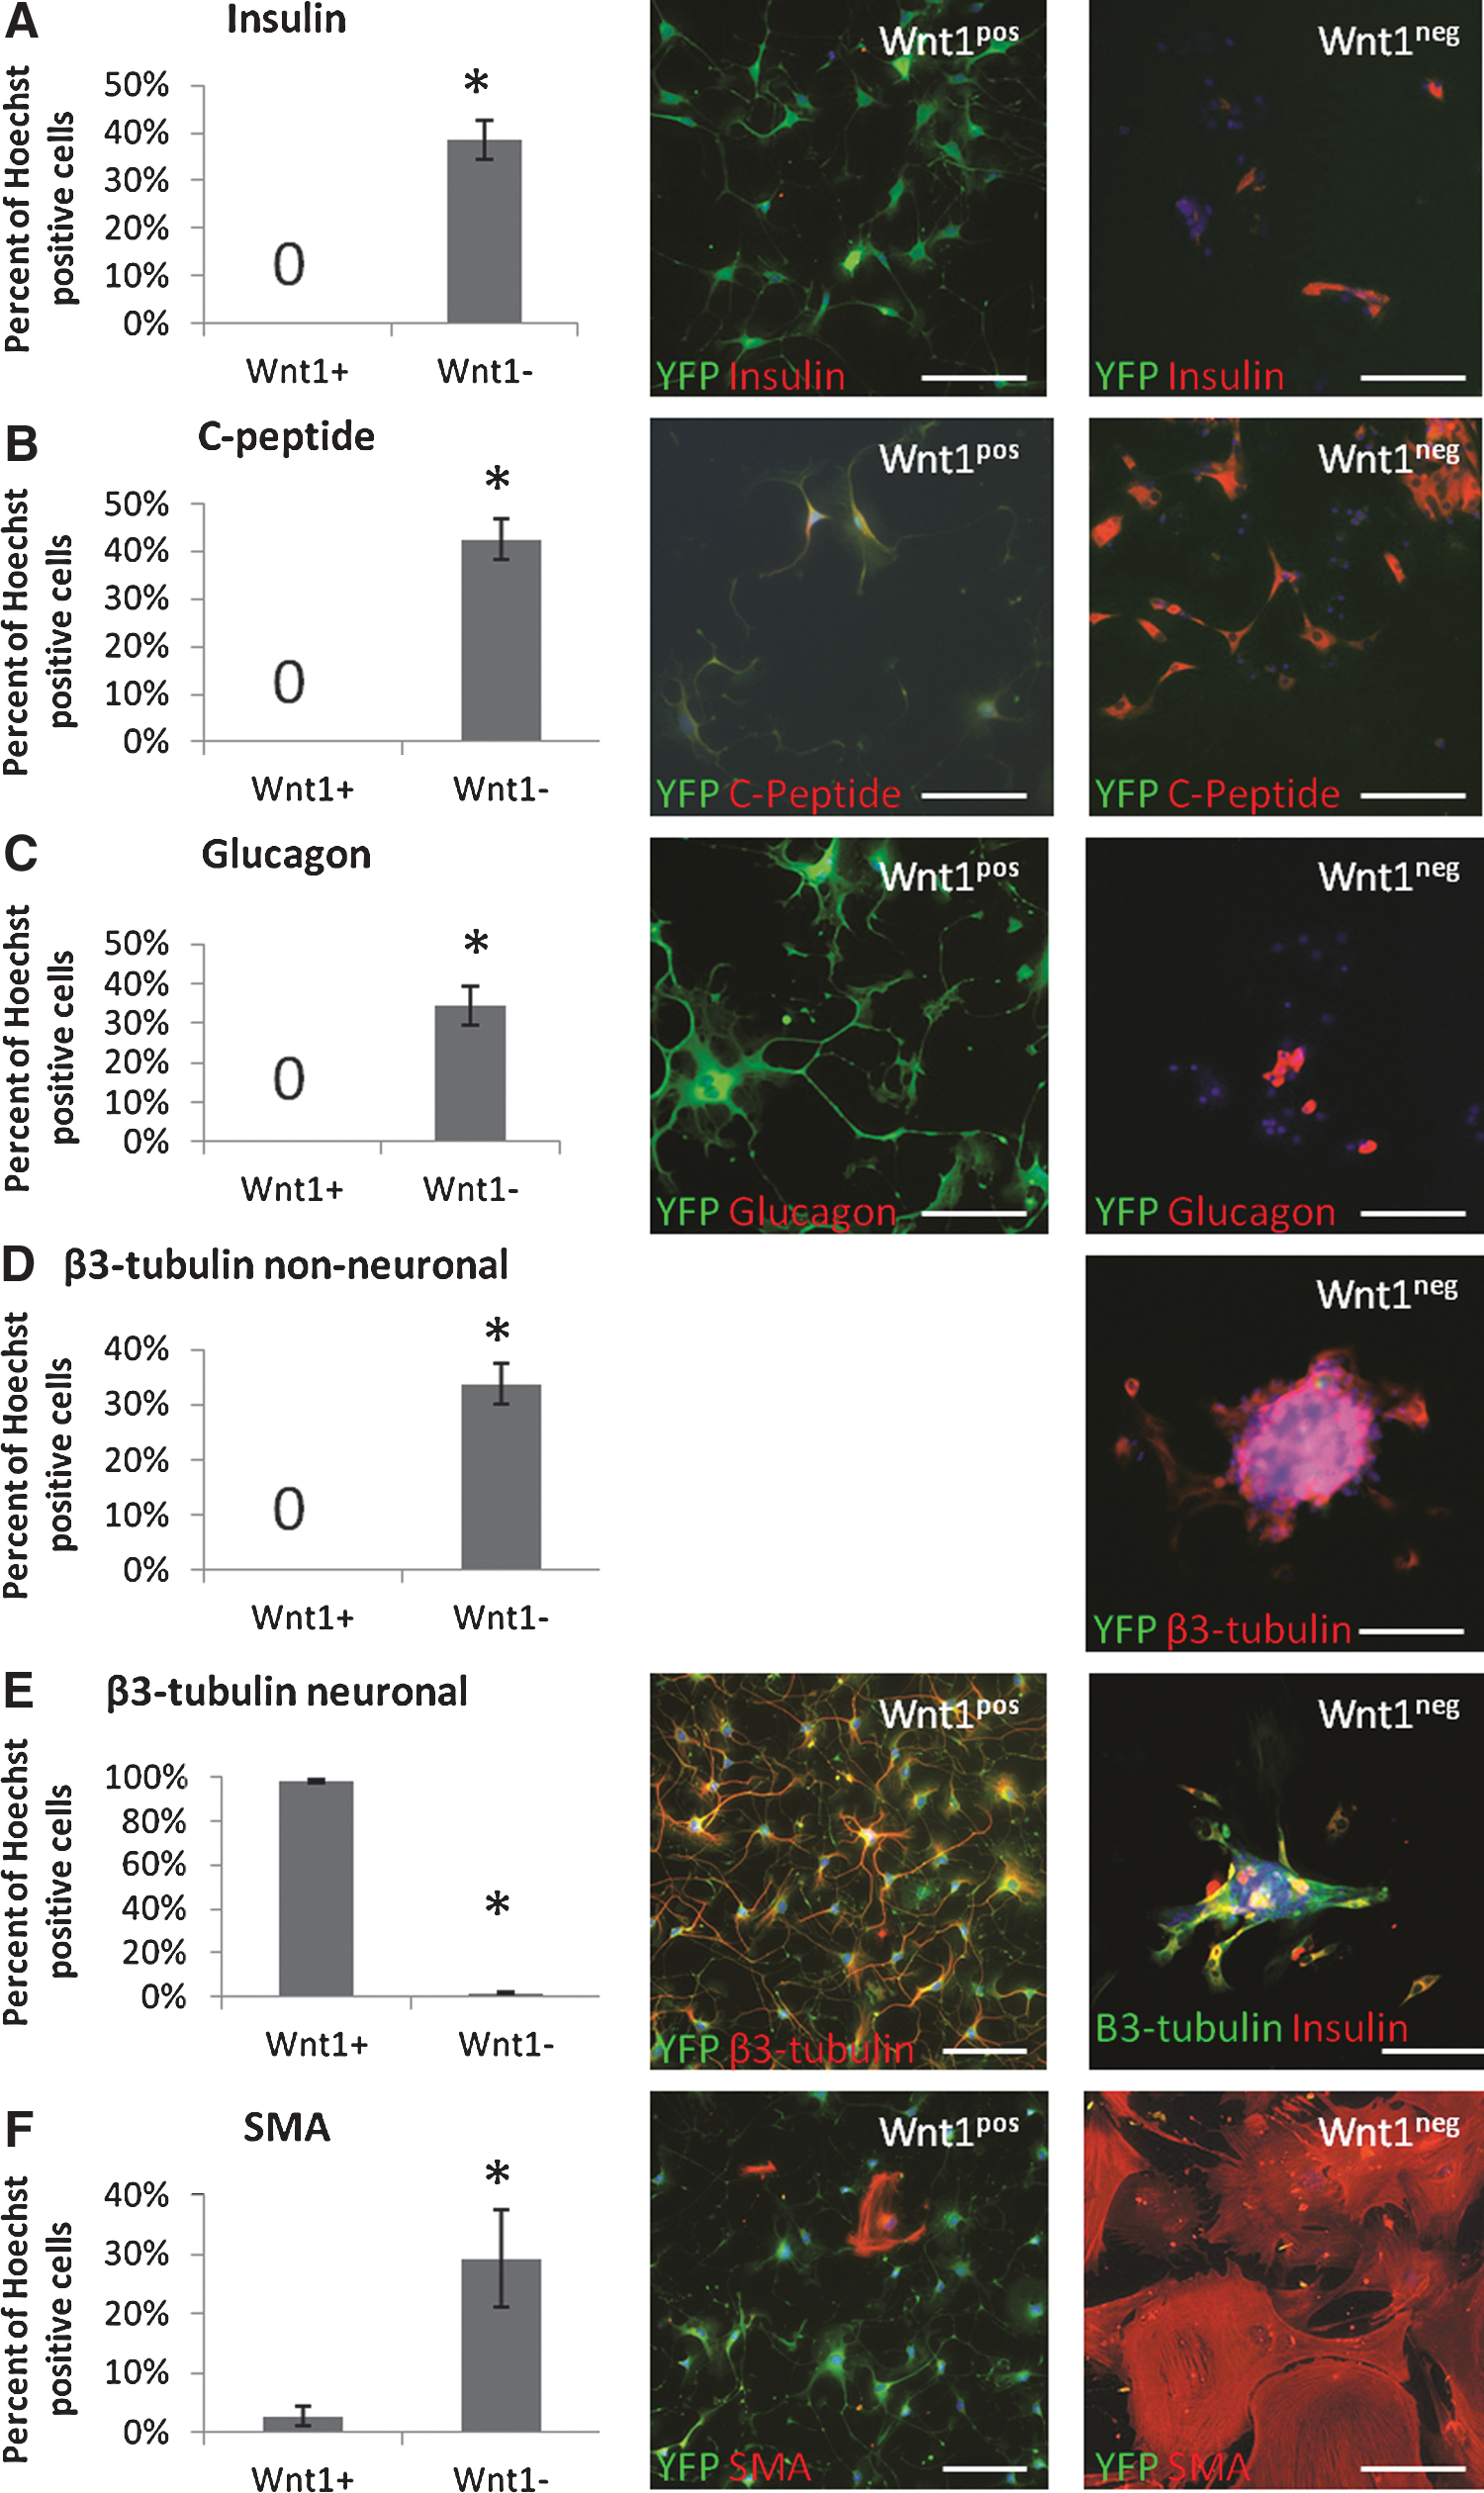
Upon differentiation, Wnt1pos spheres generate neurons, while Wnt1neg spheres generate pancreatic cells.
To test whether neural crest precursors in the pancreas had a larger potential for self-renewal than pancreatic precursors, single sphere passaging was performed as described for the Pdx1 lineage experiments. Although Wnt1pos spheres had a significantly higher secondary sphere formation than Wnt1neg spheres (Supplementary Fig. S6B), they did not exhibit robust passaging as described for other neural crest stem cell populations [14,13]. This may represent different growth requirements for this particular neural crest population or reflect their specific role in pancreatic islets.
The finding that the majority of stem cell-derived and morphologically defined neurons come from neural crest precursors, seemed to contradict the previous report that PMPs uniformly give rise to both pancreatic cells and neurons [3]. To test whether pancreatic precursors can produce neurons in a mixed population, islets from Wnt1-Cre; ROSA-YFP mice were dissociated and plated at the normal density of 10,000 cells per well without FACS sorting. We observed that, under these conditions, most of the spheres were not clonal with 8.2%±0.2% of resulting spheres having mainly YFP-positive cells (Supplementary Fig. S7A), 37.1%±2.4% of spheres having a mix of YFP-positive and YFP-negative cells (Supplementary Fig. S7B), 26.9%±3.2% of spheres containing mainly YFP-negative cells with one or two YFP-positive cells attached to the outside (Supplementary Fig. S7C) and only 27.9%±0.6% of spheres being completely YFP-negative (Supplementary Fig. S7D). If cells were plated at a lower density of 1,000 cells per well or grown for only 1 week instead of two, there was a much higher proportion of completely Wnt1-lineage YFP-negative spheres (67.6%±2.6% and 75%, respectively), although there was still some degree of mixing with 21.6%±0.9% and 24.9% of spheres having some combination of YFP-positive and YFP-negative cells. This suggested that the plating density of 10,000 cells per well does not lead to clonal sphere formation. When spheres were differentiated, the majority of β3-tubulin-positive neurons also were positive for Wnt1-lineage YFP (Supplementary Fig. S7E), indicating that they were of neural crest origin. There were YFP-negative cells that expressed β3-tubulin (Supplementary Fig. S7E, arrow), which indicates that pancreatic precursors do give rise to neurons, but this is rare. These data indicate that the vast majority of neurons derived from precursors in the pancreas are of neural crest origin.
Pax6 knockdown prevents differentiation of pancreatic, but not neural crest, cells
Precursors of Pdx1-lineage origin produced progeny that expressed the transcription factor Pax6, while precursors of Wnt1-lineage origin and their progeny did not. Confocal sections of spheres from unsorted cultures also showed that, while some spheres express Pax6 and the endocrine marker, C-peptide (Supplementary Fig. S8A), others express neither marker (Supplementary Fig. S8B), further indicating that PMP cultures are a mixed population of pancreatic- and neural crest-derived precursors. If the precursors in the pancreas are recapitulating their developmental gene expression during in vitro differentiation, then Pdx1 lineage-derived α- and β-cells should show Pax6 dependence, while Wnt1 lineage-derived neurons should not be affected by the knockdown of Pax6.
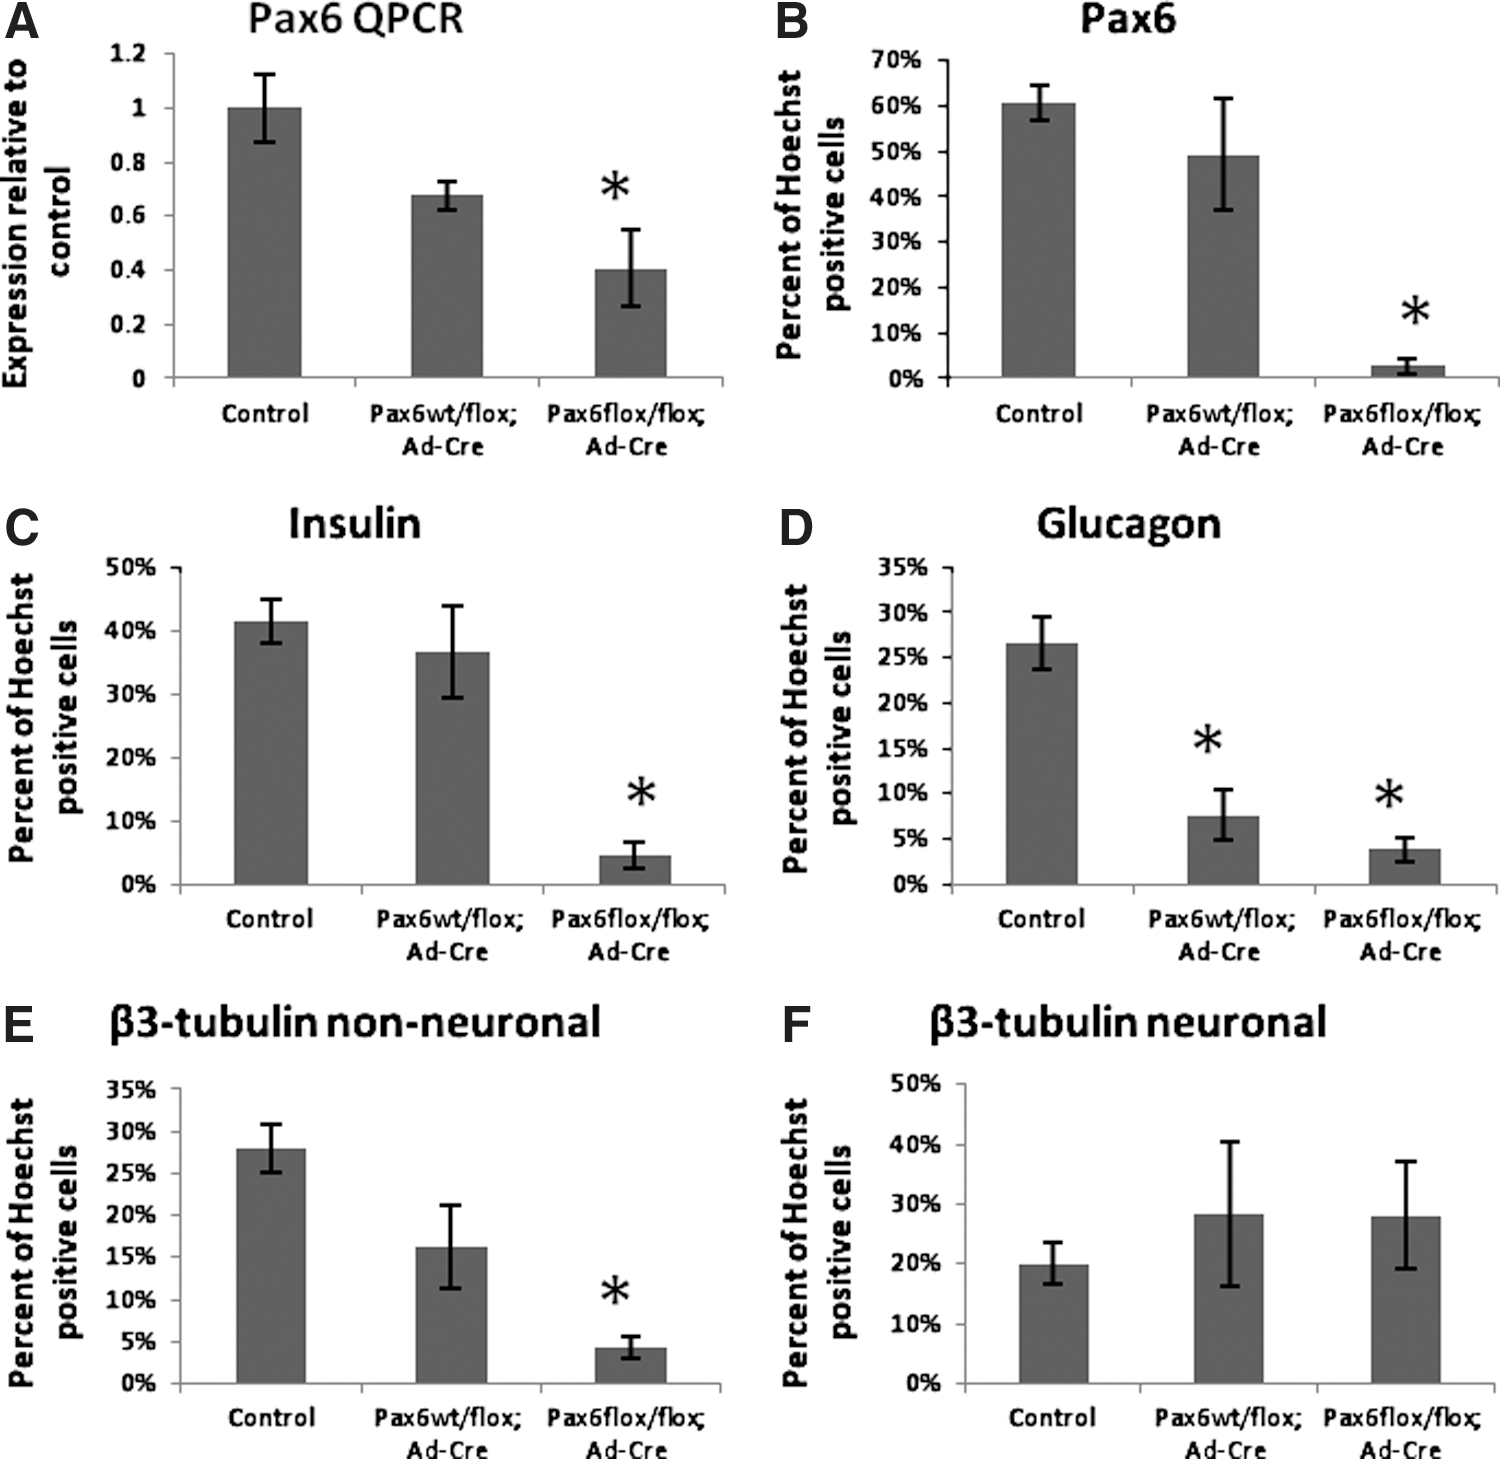
In vivo knockout of Pax6 is lethal at birth due to a lack of functional β-cells [33], therefore Pax6 was knocked down in precursors in vitro by introducing adenoviral Cre recombinase into PMPs from Pax6flox/fox mice. Islets were isolated from Pax6wt/wt , Pax6wt/flox , and Pax6flox/fox mice and dissociated to a single-cell suspension. Cells of each type were infected with either Ad-GFP, Ad-Cre, or were not infected and allowed to grow for 2 weeks in a sphere-formation assay. Spheres that arose from cells infected with either virus were selected based on their expression of GFP. QPCR was performed to test for Pax6 knockdown. Pax6wt/wt , Pax6wt/wt ; Ad-GFP, Pax6wt/wt ; Ad-Cre, Pax6wt/flox , Pax6wt/flox ; Ad-GFP, Pax6flox/flox and Pax6flox/flox ; Ad-GFP cells contained the same amount of Pax6 relative to the endogenous control by QPCR (One way ANOVA F6, 28=1.032, P=0.4258, grouped as control). Pax6wt/flox ; Ad-Cre had slightly lower expression (68%) compared to control and Pax6flox/flox ; Ad-Cre had significantly less Pax6 expression (41%) as compared to control (Fig. 5A). Knockdown of Pax6 using this flox, Ad-Cre system results in a reduction, but not a complete elimination, of Pax6 expression.
The in vitro knockdown of Pax6 decreases differentiation of insulin- and glucagon-expressing cells.
To test whether Pax6 knockdown affects PMP fate, individual spheres were differentiated for 2 weeks and stained for pancreatic and neural markers. The Pax6 protein was knocked down significantly in Pax6flox/flox ; Ad-Cre, but not in Pax6wt/flox ; Ad-Cre spheres as compared to control (Fig. 5B). Even though the amount of Pax6 transcript is reduced in Pax6wt/flox ; Ad-Cre cells, one wild-type allele appears to be sufficient for detection by immunocytochemistry. The β-cell markers insulin (Fig. 5C) and C-peptide (Supplementary Fig. S8C) also were reduced significantly in Pax6flox/flox ; Ad-Cre cells, but not Pax6wt/flox ; Ad-Cre cells as compared to control, suggesting a reduced ability to form β-cells. Expression of the α-cell marker glucagon was reduced in both Pax6wt/flox ; Ad-Cre and Pax6flox/flox ; Ad-Cre samples as compared to control (Fig. 5D), indicating a reduced ability to form α-cells and, perhaps, a dosage requirement of Pax6 during α-cell formation. As with the β-cell markers, β3-tubulin expression in cells with a non-neuronal morphology was reduced in Pax6flox/flox ; Ad-Cre, but not Pax6wt/flox ; Ad-Cre samples as compared to control (Fig. 5E). This is consistent with the finding that β3-tubulin expression overlapped partially with insulin expression. In contrast, β3-tubulin-positive cells with a neuronal morphology were unaffected by the knockdown of Pax6 (Fig. 5F). This is to be expected if these neurons are of neural crest origin, not pancreatic origin. Expression of the δ-cell marker, somatostatin (Supplementary Fig. S8D) was not significantly different between samples. Expression of the exocrine marker, amylase (Supplementary Fig. S8E) and the Schwann cell marker, S100β (Supplementary Fig. S8F) also were not affected by knockdown of Pax6. This was expected as Pax6 has not been implicated in the development of these cell types [22]. Genes that are expressed early in pancreatic development (i.e., upstream of Pax6), such as Pdx1 and Ngn3, should not be affected by Pax6 knockdown. Indeed, expression of Ngn3 was not changed (Supplementary Fig. S8G), however, Pdx1 expression was decreased significantly in Pax6flox/flox ; Ad-Cre cells, but not Pax6wt/flox ; Ad-Cre cells as compared to control (Supplementary Fig. S8H). All together, these data indicate that PMPs grown in vitro have similar requirements for Pax6 in the development of α- and β-cells as precursors in the developing pancreas. As well, neuronal cells produced from PMP colonies do not require Pax6 for their differentiation, supporting the hypothesis that most of them are of neural crest origin and only a minority originate from the Pdx1 pancreatic lineage.
Discussion
This study sought to determine the developmental origin of precursors in the adult pancreas and their dependence on Pax6 for differentiation. Contrary to previous findings, precursors in the adult pancreas arise from separate pancreatic and neural crest origins and these precursors are distinct in their gene expression and differentiation potentials.
Many studies of precursor cells in the adult pancreas have investigated the origin of these cells. For example, labeled ductal cells were found to proliferate following pancreatic injury and give rise to β-cells [1]. Proliferative ductal cells were also found to upregulate Ngn3, an endocrine marker [2]. These studies suggest a pancreatic origin of pancreatic precursors. Other groups, including our laboratory, have reported proliferative pancreatic cells giving rise to neurons in vitro [3,34,35]. As well, the neural marker, nestin, has been used to isolate pancreatic precursors from adult mouse islets [36]. These findings were not necessarily surprising, given the similarities between neurons and pancreatic endocrine cells [18]; however, these studies did not explore the possibility that proliferative neural cells in the pancreas have a neural crest origin.
A previous study from our laboratory using Pdx1-Cre; Z/EG and Wnt1-Cre; Z/EG mice to track the developmental lineage of PMPs showed that they do not arise from a neural crest population [4]. However, using the ROSA-YFP reporter, we found a rare population of precursors in the pancreas that does arise from the neural crest lineage. One explanation for these contradictory findings may be technical such as different plates or variation between batches of serum or growth factors. Another explanation may lie in the differences between the reporter lines. The Z/EG reporter strain was made by transgenic insertion rather than a homologous recombination into a specific site [28] and, as a result, the Z/EG locus is susceptible to silencing and may not faithfully represent the pattern of Cre expression from a tissue-specific promoter [23]. Indeed, confocal sections from Pdx1-Cre; Z/EG pancreas showed a lack of GFP expression in pancreatic cells (Fig. 1A), even though it has been shown that pancreatic endocrine and exocrine cells are all derived from tissue that expresses Pdx1 early in development [5]. Additionally, when Smukler et al. (2011) examined confocal sections from Wnt1-Cre; Z/EG pancreas, they observed that not all neuronal cells near islets, which would be expected to have a neural crest origin, were labeled with GFP [4]. They interpreted this as evidence that PMPs are capable of giving rise to neural cells in vivo, but this may have simply been another example of variable expression from the Z/EG reporter. The ROSA-YFP reporter system has a major advantage over Z/EG because it was generated by homologous recombination into the ROSA26 locus, which is expressed in all tissues through all stages of development into adulthood [27]. Sections of Pdx1-Cre; ROSA-YFP pancreas showed YFP expression in expected exocrine and endocrine cell types. As well, sections from Wnt1-Cre; ROSA-YFP pancreas showed YFP expression in the neuronal and glial cells surrounding islets. The ROSA-YFP reporter system more faithfully represents expression of Cre-recombinase from both the Pdx1 and Wnt1 promoters and therefore, supports the finding that both the pancreatic and neural crest lineages give rise to precursors in islets. It was interesting to note that even though YFP expression in Pdx1-Cre; ROSA-YFP pancreas was more uniform, after FACS, the GFP-positive fraction from Pdx1-Cre; Z/EG islets gave rise to more spheres than the YFP-positive fraction from Pdx1-Cre; ROSA-YFP islets (95.2%±0.6% [4] vs 79.1%±3.2%). This may be an effect of the different background strains of the Z/EG and ROSA-YFP reporters. It could also reflect a bias in expression from the Z/EG locus; perhaps, GFP is preferentially expressed in precursors, thereby increasing their frequency in a sorted population.
Seaberg et al. (2004) reported that clonal PMPs give rise to a large proportion (26% of the differentiated cell population) of neurons [3]. In the present study, Pdx1pos precursors did not differentiate into many neurons, although, occasionally, we saw cells with a neuronal morphology expressing β3-tubulin (Fig. 2D). Cells from the Pdx1pos spheres in our study had limited migration away from the plated sphere during differentiation and this may be part of the reason why they failed to form larger numbers of morphologically defined neurons. Additionally, in Seaberg et al. (2004) [3], all β3-tubulin-expressing cells were counted as neurons, regardless of morphology (personal communication), which may partially explain the large number of neurons reported. Furthermore, when spheres were grown from Wnt1-Cre; ROSA-YFP mice without sorting, we found that the majority were formed from a mixture of YFP-positive and YFP-negative cells. Even a small amount of mixing of the pancreatic and neural crest populations could explain the codifferentiation of neurons and β-cells reported by Seaberg et al. (2004) [3]. When our unsorted spheres were differentiated, the majority of neurons were YFP-positive, indicating they were derived from the neural crest lineage, and only rarely did YFP-negative cells form neurons.
Although neurons were defined in this study as having both neuronal marker expression and morphology, the nature of the small, round β3-tubulin-expressing cells is unclear. β-cells have occasionally been found to extend processes when cultured in vitro [37], which could explain why a pancreatic precursor would produce neuron-like cells. Double labeling of β3-tubulin and insulin (Fig. 4E) only showed an overlap between these markers in cells lacking neuronal morphology. However, a study of neonatal pancreatic cells cultured in vitro also found an overlap of β3-tubulin and C-peptide and interpreted these cells as dual pancreatic and neural precursors [35]. These cells may represent endocrine cells and their expression of neuronal markers is another example of the relationship between β-cells and neurons [18] or they might represent immature neurons that have not yet extended processes. This does not change our interpretation that there are at least two distinct precursors in the adult pancreas although it could suggest that pancreatic precursors require a different environment to produce morphologically defined neurons.
Wnt1pos precursors, on the other hand, gave rise to many neurons with characteristic processes, consistent with previous findings that neural cells in the pancreas are descended from the neural crest [8]. It was interesting that Wnt1pos spheres occasionally expressed insulin-2. Transcripts from the insulin-2 gene have been found in the brain [38,39]. In RIP-Cre; Z/EG mice, where Cre-recombinase is under control of the rat insulin-2 promoter, expression of the GFP reporter also was seen in the brain [40], indicating that transcription from the insulin-2 promoter had been initiated in neural cells. This may explain the previous finding that insulin-expressing cells tracked in the RIP-CreER; Z/EG mice gave rise to neural cells in vivo [4]. Perhaps, this represents the differentiation of an insulin-expressing neural crest precursor.
In both the Pdx1 and Wnt1 lineage tracing experiments, the glucagon and snail expression, as well as SMA-expressing cells, were predominant in the YFP-negative populations, suggesting they are produced independently of the pancreatic and neural crest lineages. Seaberg et al. (2004) reported that 57.4%±7.0% of differentiated cells expressed SMA [3], which seems to contradict the small number of precursors (11.4%) that give rise to these cells. However, in both the Pdx1 and Wnt1 lineage tracing experiments, differentiated negative fraction spheres gave rise to large proportions of SMA-expressing cells (62.7%±12.7% and 29.2%±8.1%, respectively), suggesting these cells have a large proliferation potential. Recently, a population of multipotent stem cells in the skin, capable of giving rise to smooth muscle cells, has been traced using the mesodermal marker, Myf5 [41]. In the pancreas of Myf5-Cre; ROSA-YFP mice, YFP expression overlapped with both endocrine and glial markers in pancreatic islets (Supplementary Fig. S9A, B). However, Myf5 did not label a specific population of smooth muscle-generating precursors, but labeled a subset of both pancreatic and neural crest precursors (Supplementary Fig. S9C). It is possible that this missing precursor population could be traced using a more specific mesodermal marker.
Precursor differentiation in vitro was tested for its reliance on Pax6. Pax6 is required for the formation of α-cells [19] and the maturation of other endocrine cell types [20] in the pancreas. It was hypothesized that knocking out Pax6 would inhibit the differentiation of endocrine cells from pancreatic precursors. Although this study has shown that PMPs represent a mixed population, the use of the Cre/LoxP system to knockout Pax6 prohibited its use in combination with lineage tracing. However, given the distinct differentiation patterns for Pdx1 and Wnt1 precursors, it is reasonable to assume that spheres that produce β- and α-cells are differentiated from Pdx1pos precursors and spheres that produce neurons are differentiated from Wnt1pos precursors. Interestingly, the 32% knockdown achieved with Pax6wt/flox ; Ad-Cre reduced differentiation of α-cells, while 59% knockdown (Pax6flox/flox ; Ad-Cre) reduced β-cell differentiation and neither was sufficient to affect δ-cell differentiation, suggesting a difference in Pax6 dosage requirements for each of these cell types. Partial deletion of Pax6 has been shown to reduce formation of α- and β-cells in the developing pancreas [42]. Pax6 knockdown also decreased expression of Pdx1 which, in addition to its role in early pancreatic development, is expressed in mature β-cells [43], perhaps, reflecting a requirement of Pax6 for the maintenance or re-expression of Pdx1 during β-cell maturation. Pax6 also is involved in the differentiation of neurons during brain development [21], but has not been implicated in the differentiation of peripheral neurons from neural crest precursors [22]. While expression of β3-tubulin in cells with a non-neuronal morphology (i.e. the cells in which expression overlapped with insulin) was reduced by Pax6 knockdown, the expression of β3-tubulin in cells with a neuronal morphology was unaffected by Pax6 knockdown. This further indicates that, while pancreatic precursors share many characteristics with neural precursors, the majority of neuronal cells in the pancreas are derived from the neural crest.
In conclusion, this study shows that there are at least two different types of precursor cells in mammalian islets, one of pancreatic descent, one of neural crest descent, and each of these precursors has its own pattern of differentiation. As well, pancreatic precursors, but not neural crest precursors, showed a dependence on Pax6 to produce their specific differentiation pattern, recapitulating developmental requirements. As neural crest cells are known to affect pancreatic development [9], it will be important to learn how these neural crest precursors affect pancreatic precursors in vitro and in vivo. Additionally, neural cells may have a protective influence on β-cells in times of stress [11], such as during transplantation into a patient. Studying these effects could identify factors that specifically enhance the propagation of pancreas-specific precursors and their survival and differentiation toward β-cells for the treatment of diabetes.
Footnotes
Acknowledgments
The authors would like to thank S. Smukler, S. Runciman, and B. Takabe for cell culture assistance, D. White for FACS assistance, D. Melton for Pdx1-Cre mice, F. Miller for Wnt1-Cre and Myf5-Cre mice, and members of the D.v.d.K. lab for discussion and critique of the manuscript. The Pax6 antibody was obtained from the Developmental Studies Hybridoma Bank developed under the auspices of the NICHD and maintained by the University of Iowa, Department of Biology, Iowa City, IA 52242. Funding for this study was provided by the Canadian Institutes of Health Research, the Juvenile Diabetes Research Foundation, the Stem Cell Network, and the McEwen Centre for Regenerative Medicine.
Author Disclosure Statement
No competing financial interests exist.
References
Supplementary Material
Please find the following supplemental material available below.
For Open Access articles published under a Creative Commons License, all supplemental material carries the same license as the article it is associated with.
For non-Open Access articles published, all supplemental material carries a non-exclusive license, and permission requests for re-use of supplemental material or any part of supplemental material shall be sent directly to the copyright owner as specified in the copyright notice associated with the article.