
Abstract
In vitro endogenous erythroid colony (EEC) formation is a common finding in BCR-ABL-negative myeloproliferative neoplasms. The aim of the present study was to determine the prevalence and the clinical significance of EEC growth in chronic myeloid leukemia (CML). Results of clonogeneic progenitor cell assays from 52 patients with newly diagnosed CML were correlated with disease characteristics at presentation and molecular response to imatinib. EECs (median 7 per dish, range 1–39) were detectable in 16 patients (31%). The proportion of patients with a high-risk Sokal score was lower in the EEC group (7% vs. 30%, respectively). The cumulative incidence of achieving a major molecular response after 2 years of imatinib was similar for both groups. However, patients with EECs were less likely to achieve a more profound decline of BCR-ABL transcripts. After 6 years of imatinib, the cumulative probability [95% CI] of reaching a ≥4 log reduction of BCR-ABL was 48% [16%; 92%] for patients of the EEC group and 84% [63%; 97%] for patients of the No EEC group. The probability [95% CI] of achieving a >4.5 log reduction of BCR-ABL after 7 years was 13% [2%; 61%] for patients with EECs and 52% [30%; 78%] for patients without EECs. In vitro EECs disappeared after achievement of a major molecular response in all evaluable patients. The data indicate that EEC formation is a recurrent finding in patients with CML which deserves further attention as a possible biomarker predicting the degree of molecular response to imatinib.
Introduction
The discovery of tyrosine kinase inhibitors (TKIs) has dramatically improved the treatment options of CML. Currently, three drugs are FDA approved for front-line use. Imatinib, the first TKI, has been the preferred initial therapy for the past 10 years [12,13]. The recently licenced second-generation TKIs dasatinib and nilotinib have been shown to be superior to imatinib in terms of antileukemic potency [14 –17]. However, observation periods for these drugs are short, and long-term outcomes have to be awaited. Moreover, both drugs are significantly more expensive than imatinib. Thus, there is not yet sufficient evidence to make specific recommendations on which TKI should be used first line, and the challenge is to individually select the front-line strategy that can be expected to achieve the best possible outcome [18 –21]. Identification of baseline prognostic markers in addition to the currently used Sokal score may facilitate this decision process.
In the present study, we show that EEC formation is found in a substantial proportion of patients with untreated CML. Patients with and without EECs are compared with regard to disease characteristics at presentation as well as their molecular response to imatinib.
Methods
This retrospective study includes 52 consecutive patients with newly diagnosed CML, who received imatinib as front-line therapy between May 2003 and December 2009. Patients were essentially treated according to European LeukemiaNet (ELN) guidelines [12]. In case of intolerance or imatinib resistance, treatment was switched to a second-line TKI (nilotinib 2×400 mg daily or dasatinib 1×100 mg daily).
Results of pretreatment peripheral blood progenitor cell assays were reviewed and, based on the presence or absence of EECs, patients were split into two groups (“EEC” vs. “No EEC”). The study was approved by the ethics committee of the Medical University of Vienna (EK 383/2011).
Colony assay
For evaluation of endogenous colony growth, 50 to 100×103/mL peripheral blood mononuclear cells were cultured in 0.8% methylcellulose (Sigma), 30% fetal calf serum (Linaris), 10% bovine serum albumin (Sigma), α-thioglycerol (10−4 M) (Fluka Chemie AG), and Iscove's-modified Dulbecco's medium (Gibco-Invitrogen). Simultaneously, stimulated colony growth was assessed by adding 5 ng/mL recombinant human (rh) interleukin-3 (R&D Systems), 10 ng/mL rh GM-CSF (R&D Systems), and 2 U/mL rh EPO (Roche) to the cultures. All cultures were plated in duplicate. After a culture period of 14 days at 37°C in 5% CO2 and full humidity, cultures were examined under an inverted microscope. Aggregates of at least 50 hemoglobinized cells, easily recognizable by their red color, were classified as burst-forming units—erythroid (BFU-E). Aggregates with more than 40 translucent, compact, or dispersed cells were identified as colony-forming units—granulocyte/macrophage (CFU-GM). Pluripotent progenitors (CFU-GEMM) were identified by their heterogenous composition of translucent and hemoglobinized cells. The presence of at least two BFU-E in duplicate endogenous cultures was reported as being EEC positive.
Molecular disease monitoring
Molecular disease response was evaluated at 3- to 6 month intervals. Quantification of BCR-ABL transcripts was performed by real-time polymerase chain reaction (PCR) using the BCR-ABL Mbcr FusionQuant ® Mega Kit (Ipsogen) and the LightCycler® 2.0-System (Roche). Results were expressed according to the International Scale [12,22]. BCR-ABL negativity in real-time PCR was confirmed by a two-step PCR with nested primers, which allows the detection of 1 BCR-ABL positive cell in 104.5 normal cells [23]. Three levels of BCR-ABL transcript reduction from the standardized baseline were applied to assess molecular response: a ≥3-log reduction persisting for at least 6 months, defined as major molecular response (MMR) [12]; a ≥4-log reduction persisting for at least 6 months, defined as MR4 [24]; and undetectable BCR-ABL persisting for at least 6 months, defined as MR4.5 [24]. Screening for mutations in the BCR-ABL TK domain was carried out by bidirectional direct sequencing of amplicons generated by semi-nested PCR amplification [25].
The Janus kinase 2 (JAK2) MutaScreen™ and the MutaQuant ® Kit (Ipsogen) were used for the detection/quantification of the JAK2V617F mutation from DNA samples frozen at diagnosis. These kits show a cut-off limit for positivity at 2% and 0.1% JAK2V617F, respectively. JAK2 exon 12 mutation screening was performed by direct sequencing of PCR products containing JAK2 exon 12 sequences in both directions [26].
Immunohistochemistry
Immunohistochemistry was performed on Schaffer's solution fixed, ethylendiaminetetraacetic acid-decalcified, and paraffin-embedded diagnostic bone marrow biopsies on an automated Leica BOND-III stainer (Leica Biosystems). Anti-phosphorylated (p)-signal transducer and activator of transcription (STAT) 5 (Tyr694) rabbit monoclonal antibody (No. 9359; Cell Signaling Technology) was applied at a dilution of 1:100 after appropriate antigen retrieval. To assess specific staining, positive and negative controls were run simultaneously with the cases. For double staining procedures, pSTAT5 staining, which provided a nuclear brown signal developed with DAB chromogen, was followed by immunostaining with anti-CD71 mouse monoclonal antibody (171M-95; Cell Marque) at a dilution of 1:1,000, exhibiting a bright red membranous staining developed with Fast Red chromogen. Due to the different expression patterns of pSTAT5 and CD71, colabeling could, hence, easily be discerned in the erythroid cells.
Gene expression profiling and real-time PCR
Total RNA was extracted from bone marrow MNCs preserved at diagnosis using an RNeasy kit (Quiagen). Preparation of terminal-labeled cDNA, hybridization to genome-wide human Gene Level 1.0 ST GeneChips (Affymetrix), and scanning of the arrays were carried out according to the manufacturer's protocols (
Validation of microarray data was performed by RT-PCR on a Biorad CFx96™ Real Time System using iQ SYBR Green Supermix (Bio-Rad). cDNA was prepared using the Taqman reverse trascriptase kit (Applied Biosystems). The housekeeping gene β-actin (ACTB forward:gatcaagatcattgctcctcctg; ACTB reverse: ctgcttgctgatccacatctg) was used as an endogenous control. All primers were designed with Primer3Plus (
Statistical analysis
Statistical analysis was performed using SAS 9.1 for Windows and R 2.14.0 (library cmprsk). Continuous variables were compared between groups using the two-sided two-sample t-test if normally distributed or the Mann–Whitney U test if not normally distributed. Normal distribution was then checked by looking at histograms. For categorical variables, differences between groups were analyzed by chi-square tests or Fisher's exact tests, if appropriate. The correlation between baseline BCR-ABL transcript level and number of EECs within the EEC group was analyzed by Spearman correlation. To compare the groups EEC versus No EEC with regard to the endpoint MMR, a competing risk analysis was applied with “MMR” as the event of interest and “switch to second-generation TK inhibitors” as the competing event. Cumulative incidence curves were plotted, and differences between groups were analyzed using the Gray's test. For the endpoints “MR4” and “MR4.5,” differences between survival curves of the two groups were analyzed using log rank tests, and Kaplan–Meier curves were plotted. For all analyses, the significance level has been set to 0.05.
Results
Sixteen (31%) patients exhibited spontaneous growth of erythroid blood progenitors. The median number of EECs per dish was 7 (range 1–39). Parallel colony assays from bone marrow were available in 24 patients. EECs were reported in 5 out of 6 patients of the EEC group and in none of 18 patients of the No EEC group. EECs were not observed in 30 control blood samples of patients with nonmalignant reactive leukocytosis who had also been referred for a colony assay during the study period.
Baseline disease characteristics
Pretreatment patient characteristics are listed in Table 1. All patients of the EEC group were in chronic phase of the disease. The No EEC group included four patients in advanced CML phase. Accordingly, the proportion of patients with high-risk Sokal and Hasford scores was lower in the EEC group. Both groups contained similar proportions of patients with low risk scores. Metaphase cytogenetics at diagnosis were available in 12 patients with EECs and in 35 patients without EECs. Additional cytogenetic changes accompanying the translocation t(9;22) were present in two patients of the EEC group [1× loss of Y and 1× t(9;10;22)(q34;q22;q11), 100% of metaphases, each] and in three patients of the No EEC group [1× del(11)(q23), 33% of metaphases; 1× t(2;10)(p12;q25), 25% of metaphases; 1× (8;17)(q13;q23), 40% of metaphases]. Hemoglobin levels were higher in patients with EECs, but this did not reach statistical significance. No difference was observed for WBC parameters and platelet counts as well as cytokine-stimulated colony growth of blood progenitors. Baseline BCR-ABL transcript levels were similar for both groups. Furthermore, within the EEC group, no significant correlation was found between BCR-ABL transcripts and numbers of EECs (P=0.28). One patient of the EEC group exhibited the JAK2V617F mutation. The frequency of mutated alleles was 46% in the bone marrow and 44% in the peripheral blood; the corresponding BCR-ABL:ABL ratios were 84% and 81%, respectively. The trephine biopsy showed a polycythemia vera-like morphology with minimal signs of concomitant fibrosis. None of the investigated patients exhibited a mutation of JAK2 exon 12.
BFU-E, burst forming units-erythroid; CFU-GM, colony forming units-granulocyte/macrophage; CFU-GEMM, colony forming units-granulocyte/erythrocyte/macrophage/megakaryocyte; JAK2, Janus kinase 2; LDH, lactate dehydrogenase; NA, not applicable; ND, not determined;
Molecular response to imatinib
The cumulative incidence of being in MMR after 2 years was 54% (95% CI [22%; 77%]) for the EEC group and 57% (95% CI [38%; 72%]) for the No EEC group (Fig. 1A). Patients with MMR were further evaluated with regard to a more profound decline of BCR-ABL. After 6 years of treatment, the cumulative probabilities of MR4 were 48% (95% CI [16%; 92%]) for the EEC group and 84% (95% CI [63%; 97%]) for the No EEC group, respectively (Fig. 1B). The cumulative risk of reaching MR4.5 after 7 years of treatment was 13% (95% CI [2%; 61%]) for patients with EECs and 52% (95% CI [30%; 78%]) for patients without EECs (Fig. 1C). BCR-ABL kinase domain mutations occurred in two patients of the No EEC group (6%). None of the patients of the EEC group developed a mutation under imatinib.
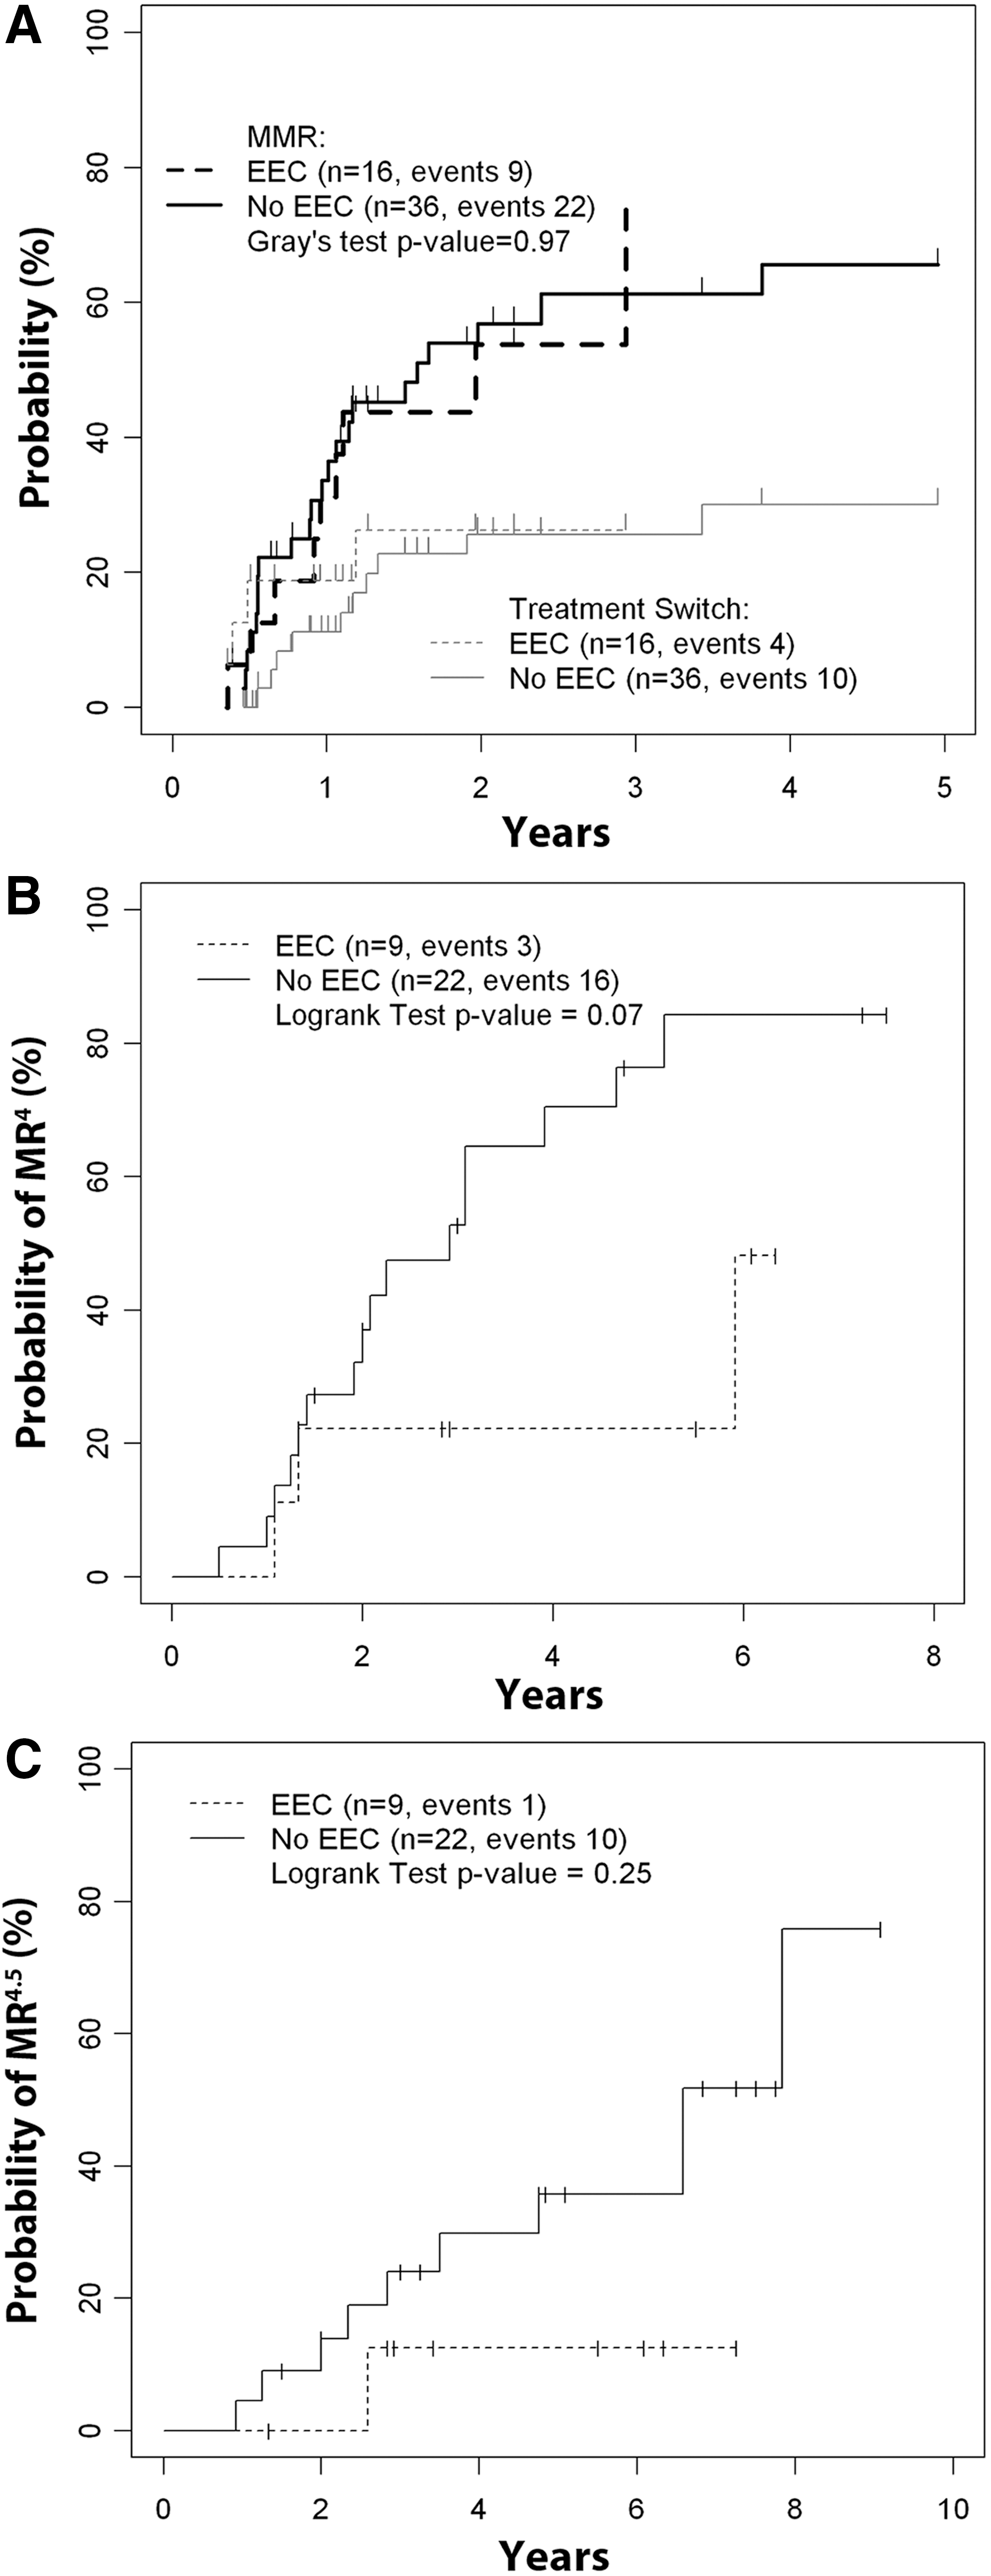
Molecular response of patients with and without endogenous erythroid colony (EEC) growth to imatinib.
Molecular response after treatment switch
Four patients of the EEC group (25%) were switched to a second-generation TKI. One of them achieved an MMR after 6 months of treatment with nilotinib. The patient with the additional JAK2V617F mutation was switched to dasatinib and also obtained an MMR after 3 months. Concomitantly, the JAK2V617F mutation disappeared from peripheral blood and bone marrow. One year later, the patient achieved an MR4.5. The other two patients failed to achieve an MMR to second-generation TKIs. Ten patients of the No EEC group (28%) were switched to either dasatinib or nilotinib, and two of them achieved an MMR after 4 and 14 months of nilotinib.
Follow up of EECs
In 10 patients of the EEC group, at least three follow-up investigations of colony growth were available. EECs completely disappeared in seven patients who achieved an MMR to imatinib. In the two patients with an MMR to second-generation TKIs, EECs permanently disappeared after treatment switch. In one patient who never achieved an MMR, EECs remained intermittently detectable.
Expression of pSTAT5 in diagnostic bone marrow biopsies
Expression patterns of pSTAT5 were examined by immunohistochemistry in 10 bone marrow specimens of patients with and without EEC growth, respectively. In both groups, pSTAT5 expression was detected in variable amounts of CD71-positive erythroid precursors, megakaryocytes, and cells of the myeloid lineage. No differences in terms of cellular distribution or intensity of staining were recognized between groups (Fig. 2).
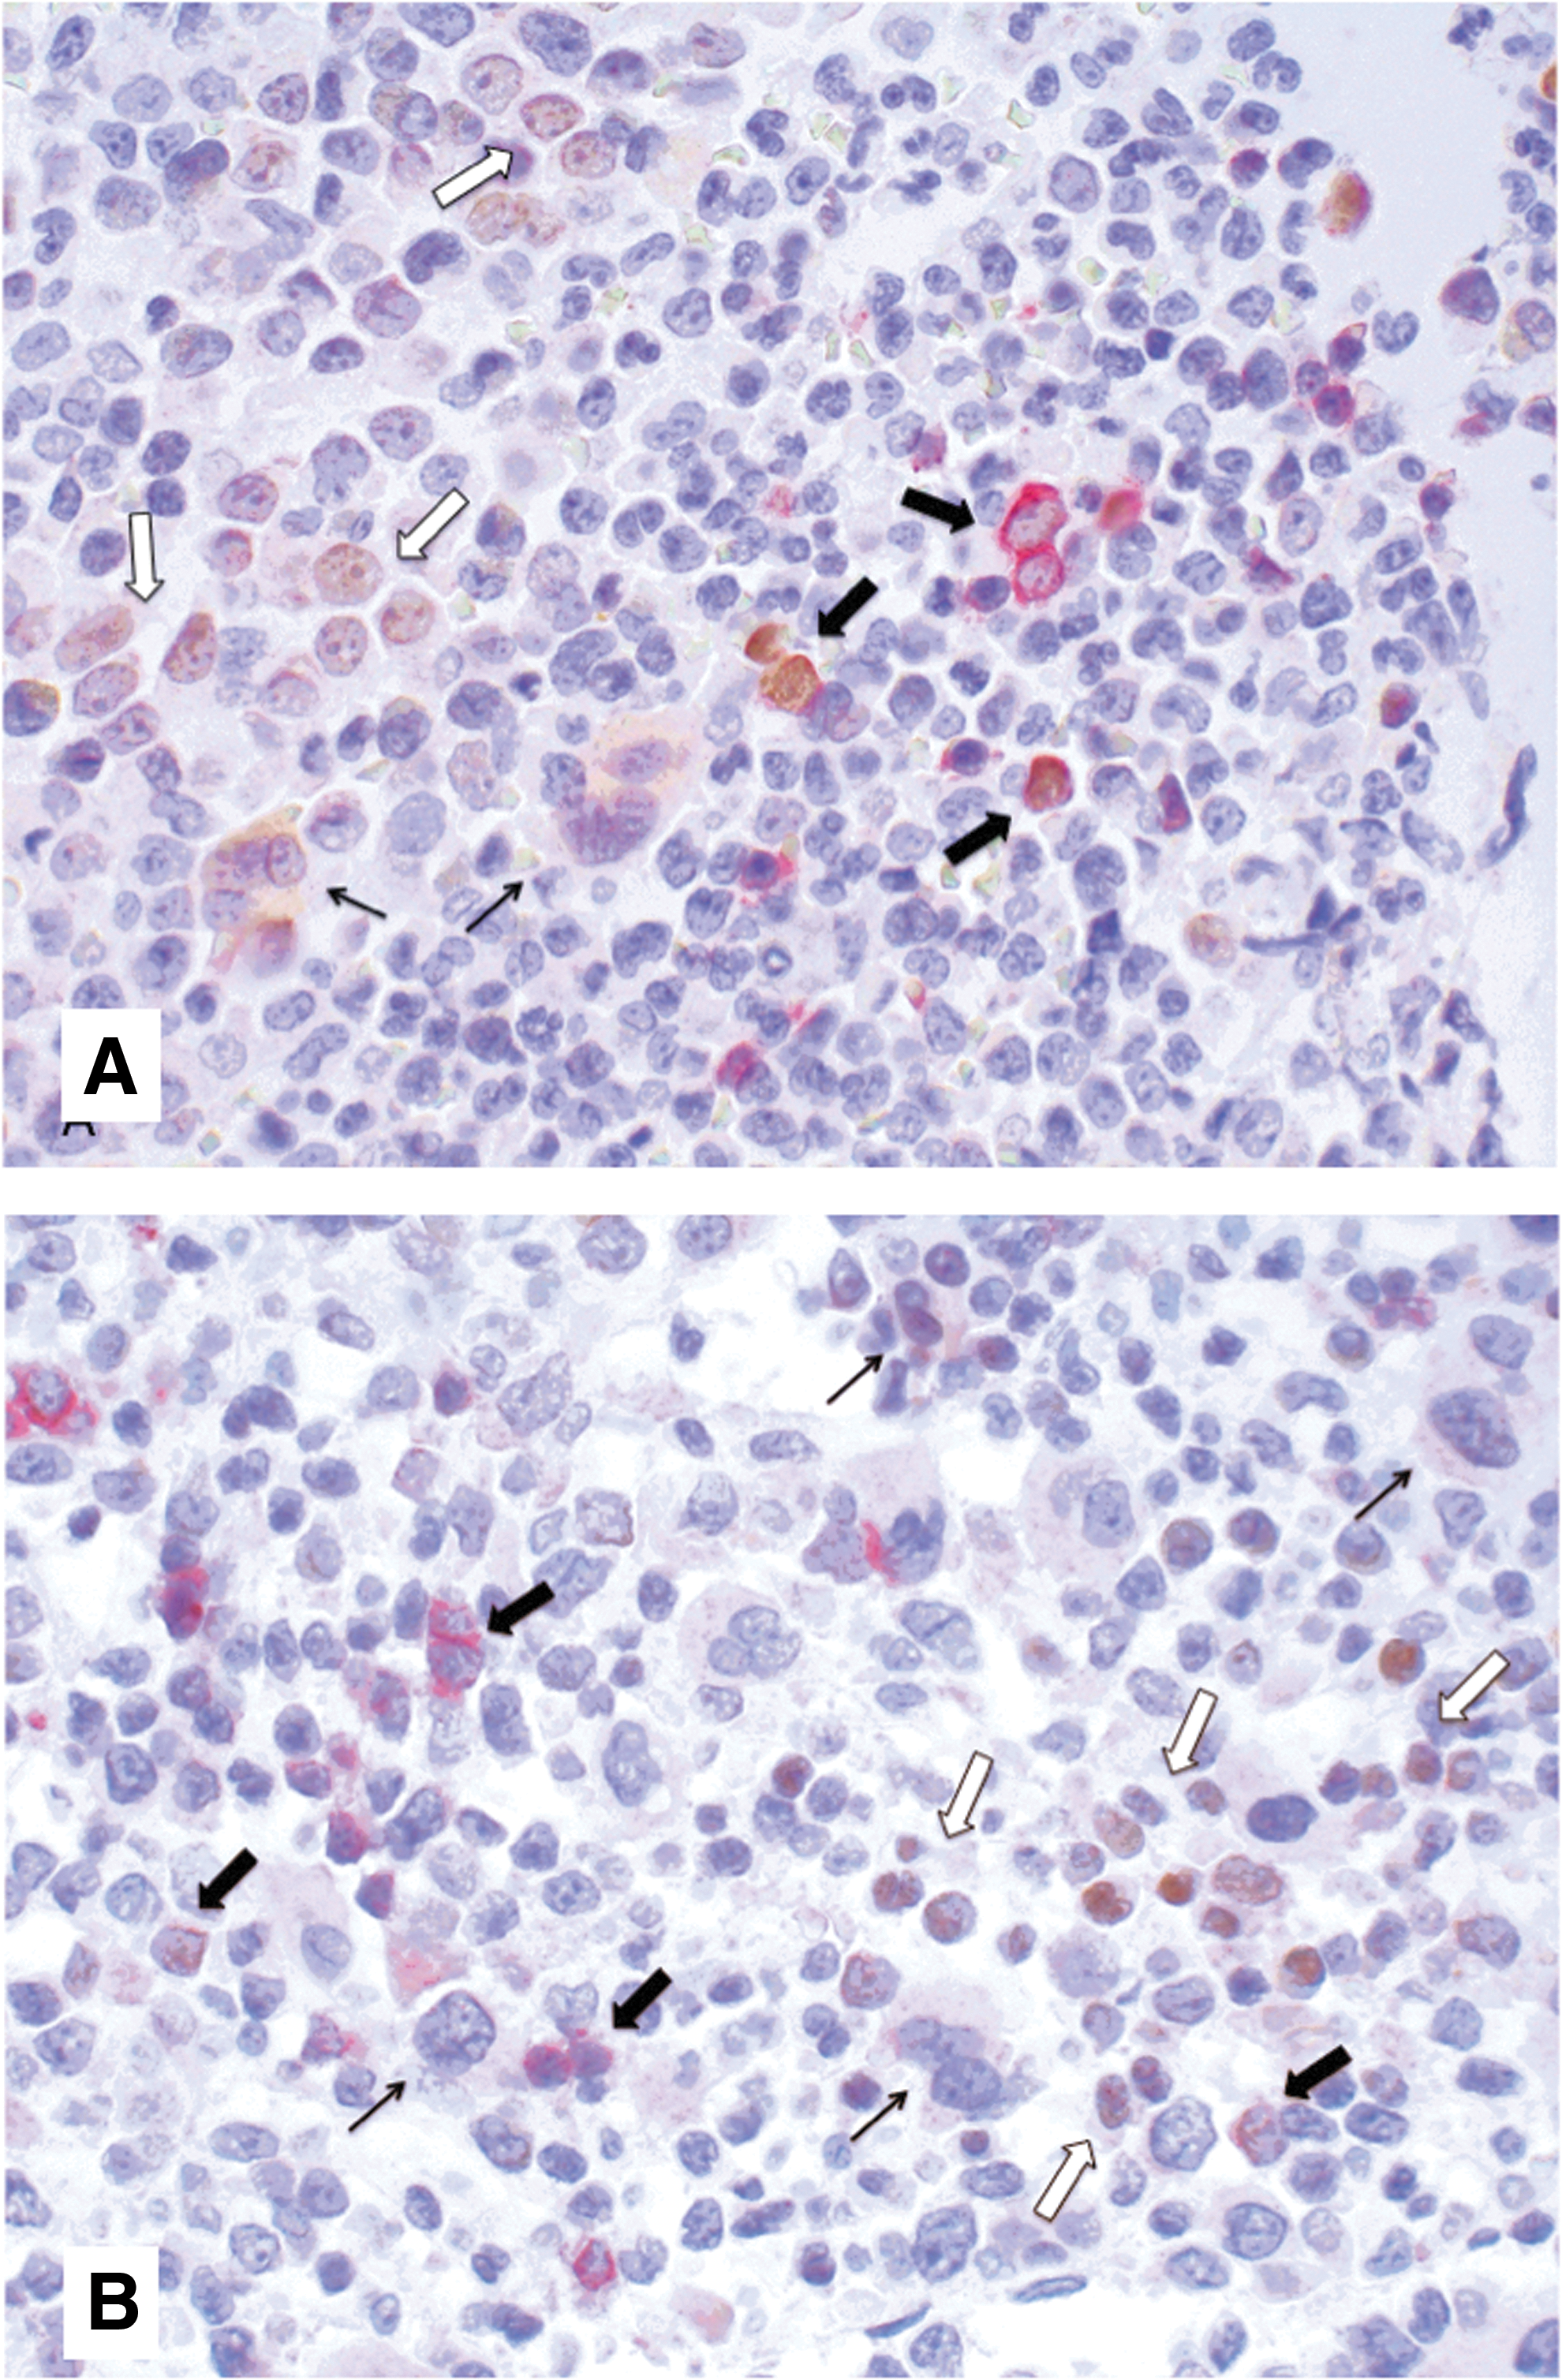
Representative bone marrow biopsies of a patient with EECs
Genes associated with EEC growth
Microarray analysis was performed to screen for potential genes involved with EEC growth. Twelve patients with EECs and 12 patients without EECs were matched for age, sex, and Sokal score, and a total of four Gene Chips per group was prepared by pooling three patients, respectively. The top differentially expressed genes (greater than fourfold change assessed by SAM software) are listed in Table 2. Interestingly, they were invariably expressed at lower levels in samples from patients with EEC growth when compared with samples from the No EEC group. To validate the results of GeneChip experiments, we performed RT-PCR using RNA samples from 15 patients of the EEC group and from 35 patients of the No EEC group. Two further genes, histamin receptor H4 (HRH4) and histidin decarboxylase (HDC), with a greater than threefold (but less than fourfold) expression difference in microarrays were additionally included, as they were topically related to genes FCER1A (Fc fragment of IgE, high affinity I, receptor for; alpha polypeptide), MS4A2 (membrane-spanning 4-domains, subfamily A, member 2 [Fc fragment of IgE, high affinity I, receptor for; beta polypeptide]), and CPA3 (carboxypeptidase A3, mast cell) of the top group. CML with EEC growth was significantly associated with lower mRNA levels of FCER1A, CPA3, HDC, and HRH4 when compared with CML without EEC growth. We next determined mRNA levels of these four genes in 16 unaffected bone marrows of patients with either Hodgkin's or Non-Hodgkin's lymphomas. As illustrated in Fig. 3, gene expression levels in EEC-positive CML were similar or even lower than in controls without CML.
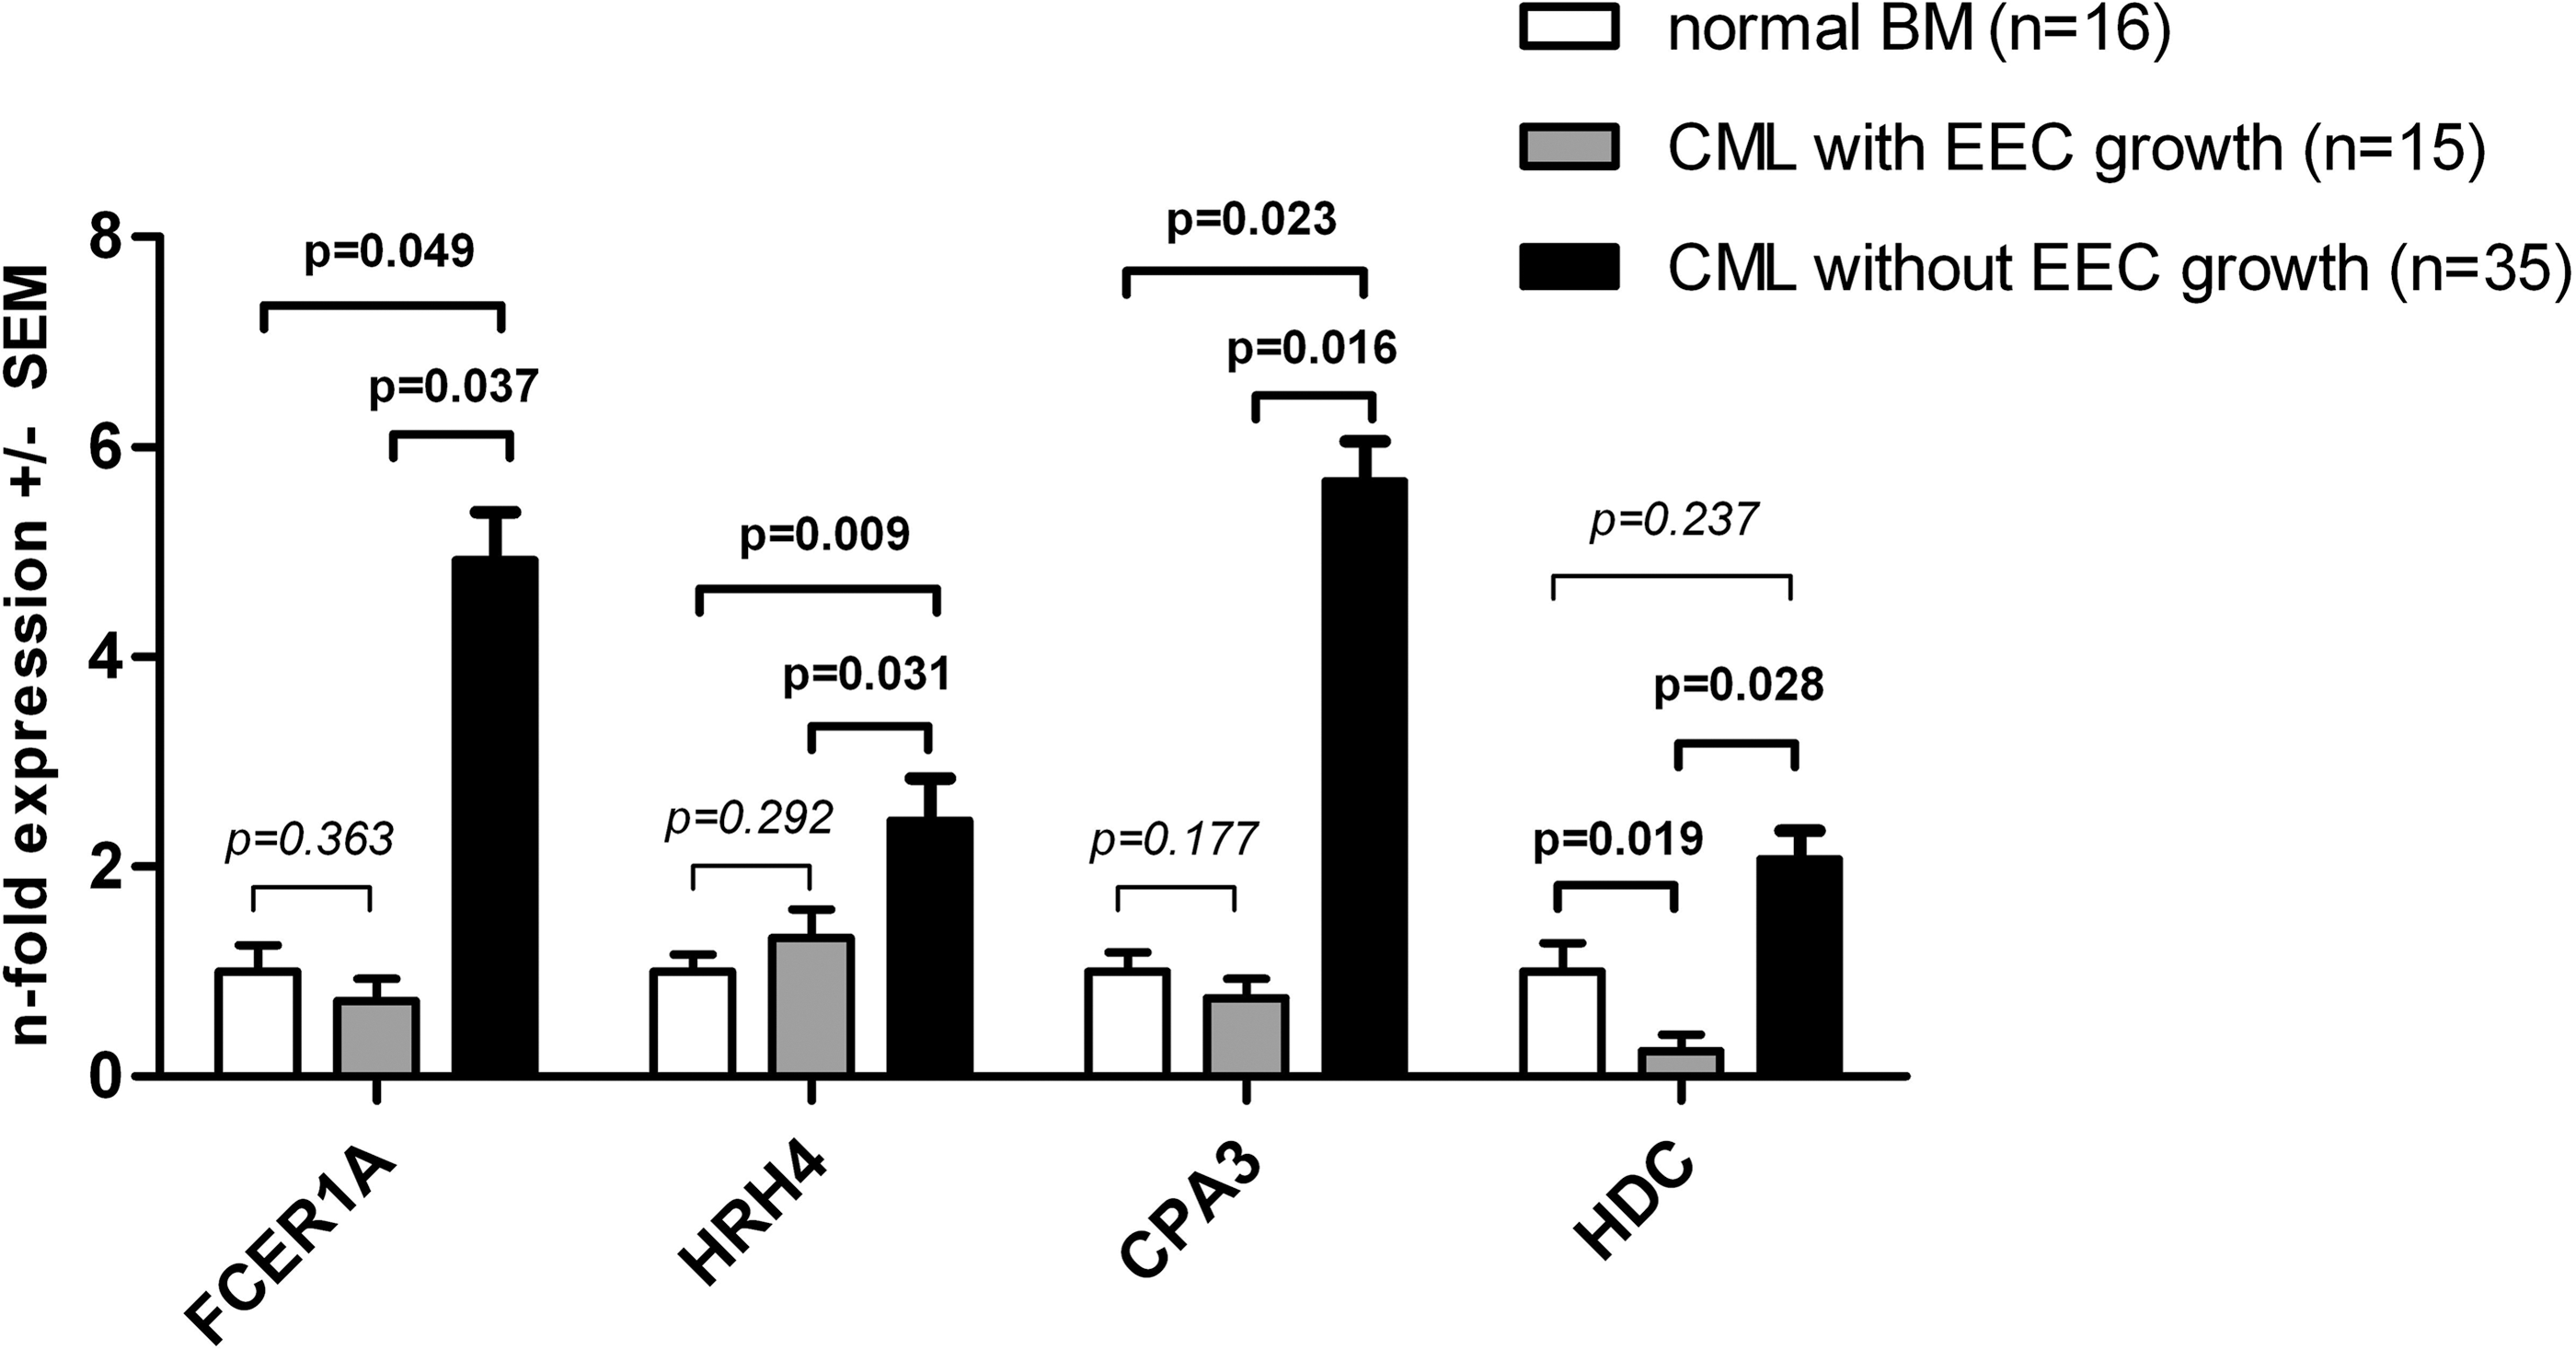
Relation of RT-PCR data to normal controls. Data are expressed as fold expression (mean±SEM) of genes FCER1A, HRH4, CPA3, and HDC in chronic myeloid leukemia (CML) groups (gray and black bars) versus normal controls (white bars). BM, bone marrow.
Values are means±SEM.
Bold numbers indicate significant p-values (<0.05).
EEC, endogenous erythroid colony growth; SEM, standard error of mean; PCR, polymerase chain reaction.
Discussion
The present study clearly indicates that in vitro growth of EECs is a recurrent phenomenon in BCR-ABL-positive CML. EECs in semisolid cultures are typically found in myeloproliferative neoplasms with mutations of the JAK2 gene that lead to constitutive activation of the erythropoesis triggering JAK2-STAT5 pathway [31]. Patients with BCR-ABL-positive CML usually lack mutations of the JAK2 gene except rare cases that have been reported to harbor both, the BCR-ABL translocation and the JAK2V617F mutation [32 –35]. In our series of EEC-positive cases, a JAK2V617F mutation was detected in 1 patient. The JAK2V617F and the BCR-ABL burden overlapped at diagnosis and simultaneously decreased on BCR-ABL-targeted therapy, indicating that the JAK2V617F mutant was harbored by the BCR-ABL-positive clone. EECs disappeared on TKI treatment in all evaluable patients and returned only in one patient who failed to achieve an MMR. Together, these results suggest that EEC growth in CML indicates a disease subtype with different biological properties rather than the presence of a second malignancy. It has also been previously shown that EECs cultured from bone marrow of patients with CML carry the Philadelphia chromosome [5].
Constitutive activation of STAT5 has been shown to induce EEC formation in human primary cells as well as to be critical for the maintenance of CML [36,37]. We, therefore, hypothesized that EEC growth in CML might be associated with increased levels of pSTAT5. Our immunohistochemistry studies, however, gave no evidence that pSTAT5 is differentially expressed in bone marrows of patients with and without EEC growth. Moreover, the results of gene expression screening do not suggest that genes associated with erythroid proliferation/differentiation are differently regulated in CMLs with and without EECs (see also Supplementary Table S1; Supplementary Data are available online at
The few reports on EEC growth in CML date from the time before BCR-ABL targeted therapy. Therefore, we were particularly interested to evaluate whether patients with EECs exhibit different sensitivity to imatinib. In the present cohort, the cumulative incidence of achieving an MMR within 2 years was similar for both groups. However, patients with EECs had a lower probability to reach more profound reduction of BCR-ABL transcript levels. So far, reduction of BCR-ABL transcripts beyond the level of MMR has not been reported to translate into better survival. However, several studies have demonstrated that patients with undetectable BCR-ABL transcripts are most likely to maintain optimal treatment response [38 –42]. Furthermore, it has been shown that around 40%–50% of patients, who achieve a stable complete molecular response on imatinib, can stop therapy for at least several years without recurrence of molecular disease [43]. Thus, maximal disease reduction is a preferable goal of TKI treatment of CML [44,45].
In conclusion, our data suggest that EEC formation in CML deserves attention as a potential biomarker predicting the degree of molecular response to imatinib. Further prospective studies are questioned to strengthen the presented observations. If EEC growth actually turns out to indicate patients with inferior response to imatinib, the endogenous colony assay may become a valuable tool in the decision-making process for first-line therapy in CML.
Author Disclosure Statement
P.V. received consultant fee from Novartis and grants and payment for lectures from Novartis and BMS.
References
Supplementary Material
Please find the following supplemental material available below.
For Open Access articles published under a Creative Commons License, all supplemental material carries the same license as the article it is associated with.
For non-Open Access articles published, all supplemental material carries a non-exclusive license, and permission requests for re-use of supplemental material or any part of supplemental material shall be sent directly to the copyright owner as specified in the copyright notice associated with the article.