
Abstract
Dye-effluxing side population (SP) cells can be resistant to chemotherapy and are thought to resemble cancer stem cells. We characterized the relevance of the SP subpopulation in esophageal cancer cell lines and their relation to chemotherapy resistance and metastasis. The SP subpopulation was detected using Hoechst 33342 staining in five esophageal cancer cell lines OE19, OE21, OE33, PT1590, and LN1590. CTx-resistant cell lines were developed after long-term exposure to 5-fluorouracil (5-FU) and cisplatin and validated by analysis of resistance markers, thymidylate synthase and ERCC1. While neither LN1590 nor PT1590 had detectable SP cells, OE19, OE21, and OE33 cells were found to contain varying levels of SP cells. With increasing duration of 5-FU or cisplatin therapy, the SP subpopulation substantially emerged in PT1590 and LN1590. OE19-SP cells displayed significant higher tumorigenicity than OE19- non-SP (NSP) cells after subcutaneous tumor cell injection in vivo. SP cells isolated from OE19 and OE19/5-FUres were subsequently analyzed by an epithelial-to-mesenchymal transition (EMT) polymerase chain reaction array. Interestingly, the SP fraction of OE19/5-FUres showed a dramatic upregulation of EMT-related genes compared to the SP fraction of OE19. Our results provide evidence that (1) the proportion of SP cells is different in esophageal cancer, (2) SP cells exhibit stem cell properties and are associated to chemotherapy resistance, and (3) long-term CTx selects for SP cells with an upregulated EMT gene profile, which might be the source of systemic disease relapse. Further investigations are necessary to ideally target these EMT-associated SP cells in esophageal cancer.
Introduction
E
In this study, we examined the biology of SP cells derived from a series of esophageal cancer cell lines. SP cells were isolated by Hoechst dye staining due to the high expression of cell membrane pumps, such as ATP-binding cassette (ABC) transporters, which participate in tumor resistance by actively transporting drugs out of cells [17]. Previously, in leukemia [22] and breast cancer [23] induced resistance to chemo- or radiotherapy was utilized to enrich for SP cells. Comparably, we isolated the SP subpopulation in both sensitive and chemotherapy resistant esophageal cancer cell lines and investigated the capacity of self-renewal, differentiation, and tumorigenicity, as well as the role of SP cells with respect to chemotherapy resistance and metastasis in vitro and in vivo.
Materials and Methods
Esophageal cancer cell lines and resistant subtypes
The human esophageal cancer cells lines OE19, OE21, and OE33 were purchased from the European Collection of Cell Cultures (ECACC; HPA Culture Collections) and originally derived from patients with esophageal squamous cell carcinomas (ESCC: OE21), Barrett's adenocarcinoma (BAC: OE33 or an esophageal junctional adenocarcinoma: OE19), [24] and cultured in RPMI-1640 plus GlutaMAXTM-I media supplemented with 10% fetal bovine serum (FBS) (Biochrom AG), and 1% penicillin–streptomycin (PAN Biotech GmbH) at 37°C in 95% air and 5% CO2. PT1590 and LN1590 was a pair of esophageal cancer cell lines established from a primary tumor and a lymph node with mircometastasis of a patient who had undergone radical esophagectomy for a poorly differentiated AC of the esophagus at the University Medical Center of Hamburg-Eppendorf. Both cell lines were cultured in vitro using the above mentioned culturing conditions supplemented with growth factors as described previously [25,26]. Resistant cells were cultured in medium with increasing concentrations of 5-FU or cisplatin according to the 50% inhibitory concentration (IC50) values.
Flow cytometry analysis and sorting
Single-cell suspensions of esophageal cancer cell lines were stained with 2.5 μg/mL Hoechst 33342 (Sigma-Aldrich GmbH) for 60 min at 37°C; 225 μM verapamilhydrochloride (Sigma-Aldrich GmbH) was used to block the ABC transporters as control. Propidium iodide was used to discriminate viable and nonviable cells. Cells were analyzed with a LSR II flow cytometer (BD Bioscience) equipped with 20-mW, 355 nm UV laser. Hoechst fluorescent blue was measured with a 450/50BP and Hoechst fluorescent red with a 670/30BP filter. The accordant SP subpopulation of each cell line was sorted with a MoFlo High Speed Sorter (DAKO-Cytomation). Sorted cells were then used for in vitro experiments.
For further analysis cells were kept in the dark and cold blocked with FcR blocking reagent (Miltenyi Biotec GmbH) 15 min and stained with FITC anti-CD44, APC anti-CD133 (Miltenyi Biotec GmbH), APC anti-ABCG2 (R&D Systems) or active-β-catenin (Millipore) further stained with FITC conjugated second antibodies (Abcam) 45 min on ice. FITC and PE were excited at 488 nm by an octagon blue laser, and fluorescence was detected using 530/30 and 675/20 filters, respectively. FL4 excitation of APC was at 633 nm, emission was at 660 nm. All the FACs data were analyzed by FlowJo.
Cell cytotoxic assay
Cell growth curves or inhibition rates after treatment with chemotherapy were determined by the Cell Counting kit-8 (CCK-8; Dojindo Laboratories) and were expressed as percentage of control absorbance. For sorting SP and NSP cells were plated in 96-well plates at a density of 3,000 cells per well and allowed to grow for additional 48 h in either drug-free medium or under treatment with 5-FU or cisplatin. The IC50 of cell growth for each cell line was then analyzed using VersaMax tunable microplate reader and Softmaxpro 5.2 (Molecular Devices).
Colony formation assay and soft agar assay
Five hundred or 1,000 sorted SP and NSP cells were seeded in 500 μL 10% FCS RPMI 1640 on 24-well plates. Media were changed once weekly, after 3–5 weeks colonies (>50 cells) were counted. Colonies were fixed in 100% cold methanol and stained with 0.1% crystal violet. For soft agar assays, a six-well culture plate was coated with 2 mL bottom agar mixture (DMEM/F12 with 10% FBS, 0.6% agar). After the bottom layer was solidified, 2 mL top agar-medium mixture (DMEM/F12 with 10% FBS, 0.3% agar) containing 2,000 sorted cells was added, and the plate was incubated at 37°C for 3–5 weeks. Plates were then stained with 0.05% crystal violet and the colonies were counted.
In vivo assay of tumorigenicity
Ten to twelve-week-old male BALB/c nu/nu mice were purchased from Charles River, Inc. Animals were exposed to 12-h-light/12-h-darkness cycles, and standard food and water was provided on request. Freshly isolated SP and NSP cells from OE19 by Hoeschst 33342 staining were implanted subcutaneously at a concentration of 1.0×10⁵/100 μL cells in PBS in the flank under general anesthesia, and the growth characteristics of the established tumors were monitoring by palpation. All mice were sacrificed when the largest subcutaneous tumors reached ∼1.0 cm in diameter. The tumors were isolated and measured. All of the animal studies were approved by and conducted in accordance with the principles of the regulatory agency of the State of Bavaria.
Immunofluorescence analysis
After sorting both SP and NSP cells were plated on Lab-Tek™ Chamber Slides (Thermo Fisher Scientific, Inc.) in normal cell culture media at 37°C with 5% CO2. Cells were fixed with 4% paraformaldehyde for 30 min at room temperature, permeabilized with 0.1% Triton X-100 in blocking serum for 30 min at room temperature, and finally incubated with anti-ABCG2, anti-CD133, anti-CD44, anti-CD45 (dilution 1:200; Abcam), anti-β-catenin (dilution 1:200; BD Bioscience) at 4°C overnight. After the cells were stained with a matched FITC or DyLight-594 conjugated secondary antibody (dilution 1:200; Dianova), for 1 h at room temperature, the chamber slides were counterstained with DAPI in mounting medium (Vector Laboratories, Inc.) and visualized by digital fluorescence microscopy (Axioskop 40, AxioCam MRc5; Carl Zeiss AG) using the AxioVision Rel. 4.6 software (Carl Zeiss AG).
RT2 profiler polymerase chain reaction array system
The expression of EMT-related genes was examined using the RT2 Profiler polymerase chain reaction (PCR) array (Cat. no. 330231 PAHS-090C; SuperArray Bioscience). Total RNA of 5×10⁵ sorted SP cells from OE19 or OE19/5-FUres was isolated by using miRNeasy kit (Qiagen). CDNA was synthesized from 250 ng of RNA using a RT2 First start kit (Qiagen). PCR was performed with the RT2 Profiler PCR array system according to the manufacturer's instructions using ABI StepOnePlus™ (Applied Biosystems). The expression levels of different mRNAs were normalized using housekeeping genes expression of B2M, HPRT1, GAPDH, and ACTB. Data were analyzed by Web-Based PCR Array Data Analysis software (
Real-time PCR analysis
Total RNA was extracted from cell pellets as directed by the manufacturer's instructions. Real-time quantitative reverse transcription (qRT-PCR) was performed in 20 μL reactions on 100–150 ng total RNA from each sample using the SuperScript® III Platinum® One-Step qRT-PCR Kit as directed by the manufacturer's instructions on the Eppendorf Mastercycler® ep realplex PCR system. Primers of ABC multidrug transporters (ABCB1, ABCC2, ABCC3, ABCC5, and ABCC11), CD44, TS, and housekeeping gene control-GAPDH were purchased from Eurofins (Oligo sequence was shown in Supplementary Table S1; Supplementary Data are available online at
Western blot analysis
Cells were lysed in RIPA buffer supplemented with protease/phosphotase inhibitors (Roche) and total cellular protein was extracted and blotted as previously described [27].
Statistical evaluation
The differences between groups were analyzed using Student's t-test or one-way ANOVA by SPSS for Windows (version 19; SPSS). Data were expressed as means±standard deviation. Differences were considered statistically significant at P<0.05.
Results
Identification of SP cells in human esophageal carcinoma cell lines
Hoechst 33342 dye staining of esophageal cell lines showed varying levels of SP cells in the different esophageal cancer cell lines. Representative graphs of SP fraction were shown (Fig. 1a). These were 17.1%±3.0%, 0.6%±0.3%, and 8.8%±2.7% in OE19, OE21, and OE33, respectively. The proportion of SP cells was significantly diminished to 0.34%±0.36%, 0.10%±0.14%, and 0.51%±0.43% in response to verapamil treatment (P<0.05) (Fig. 1b). Interestingly, PT1590 and LN1590 cells showed no detectable amount of SP cells based on the standard protocol.
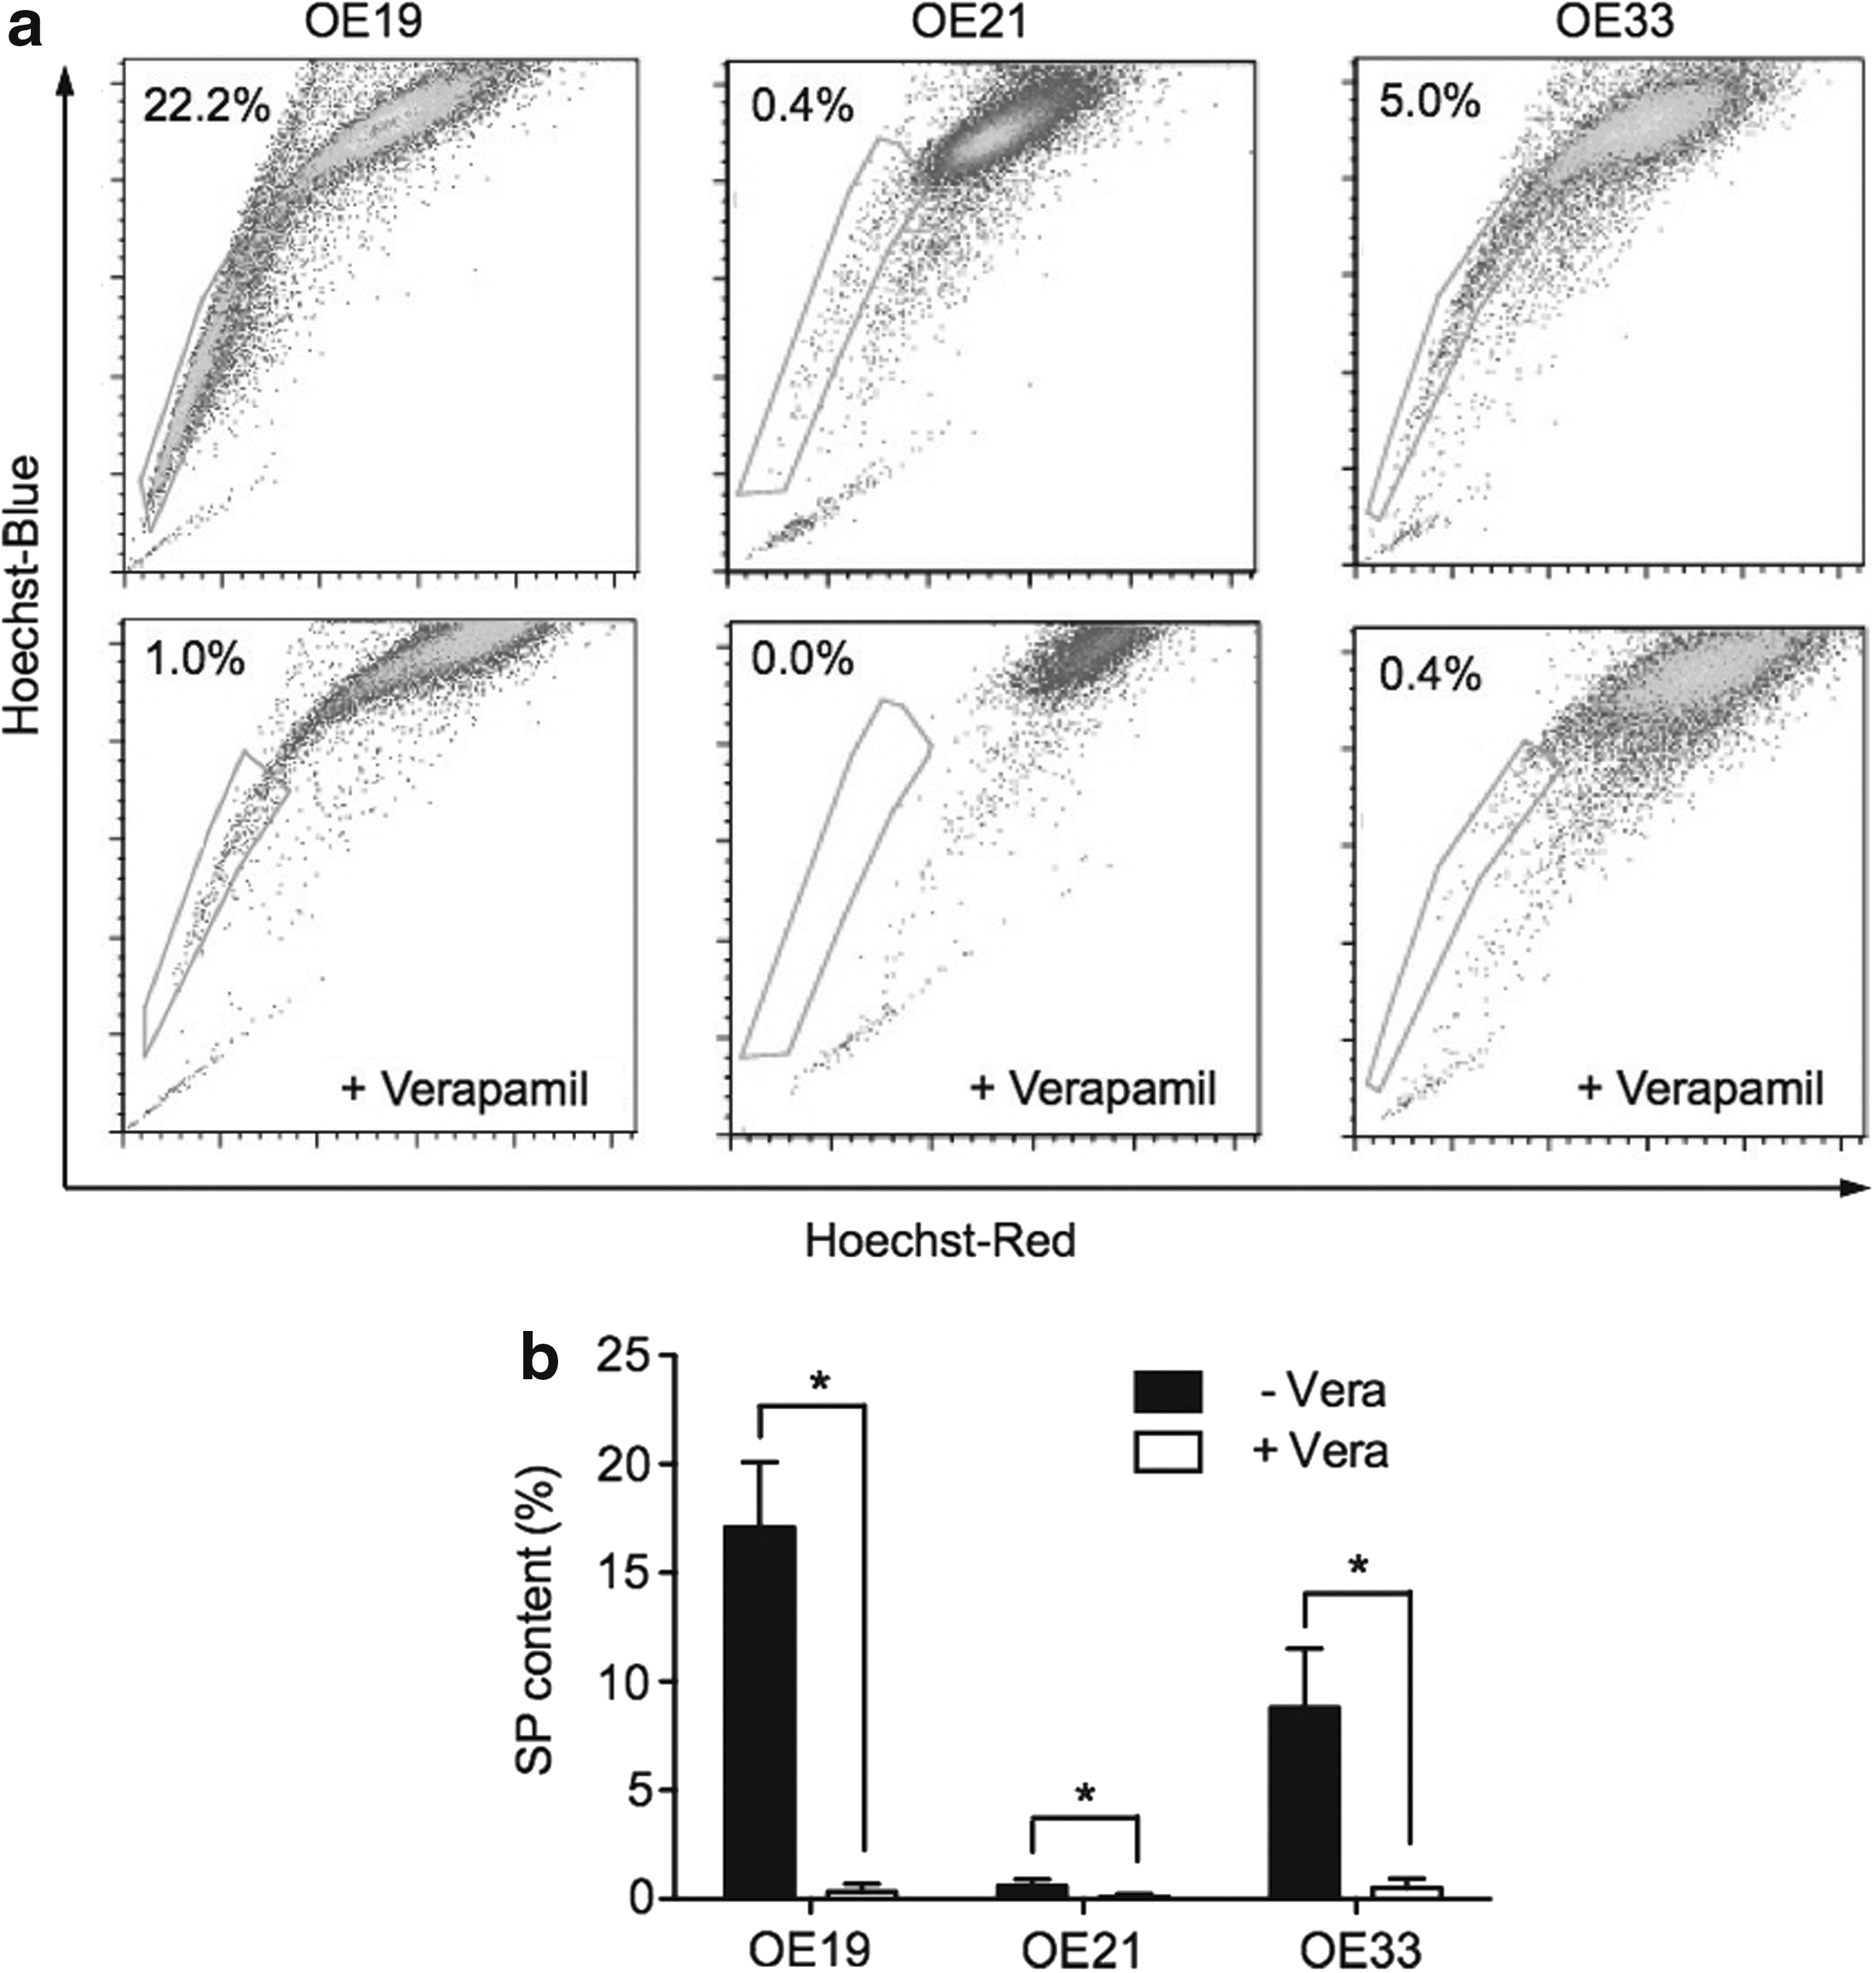
Side population (SP) cells exist in different esophageal cancer cell lines.
SP cells are able to self-renew and differentiate in vitro
To explore the clonogenic ability of SP and NSP cells in vitro, colony formation assays were performed. SP cells from OE19, OE21, and OE33 formed more colonies than NSP cells (Fig. 2a). In soft agar assays, we found that OE19-SP cells were found to generate visible colonies, while OE19-NSP did not (Fig. 2b).
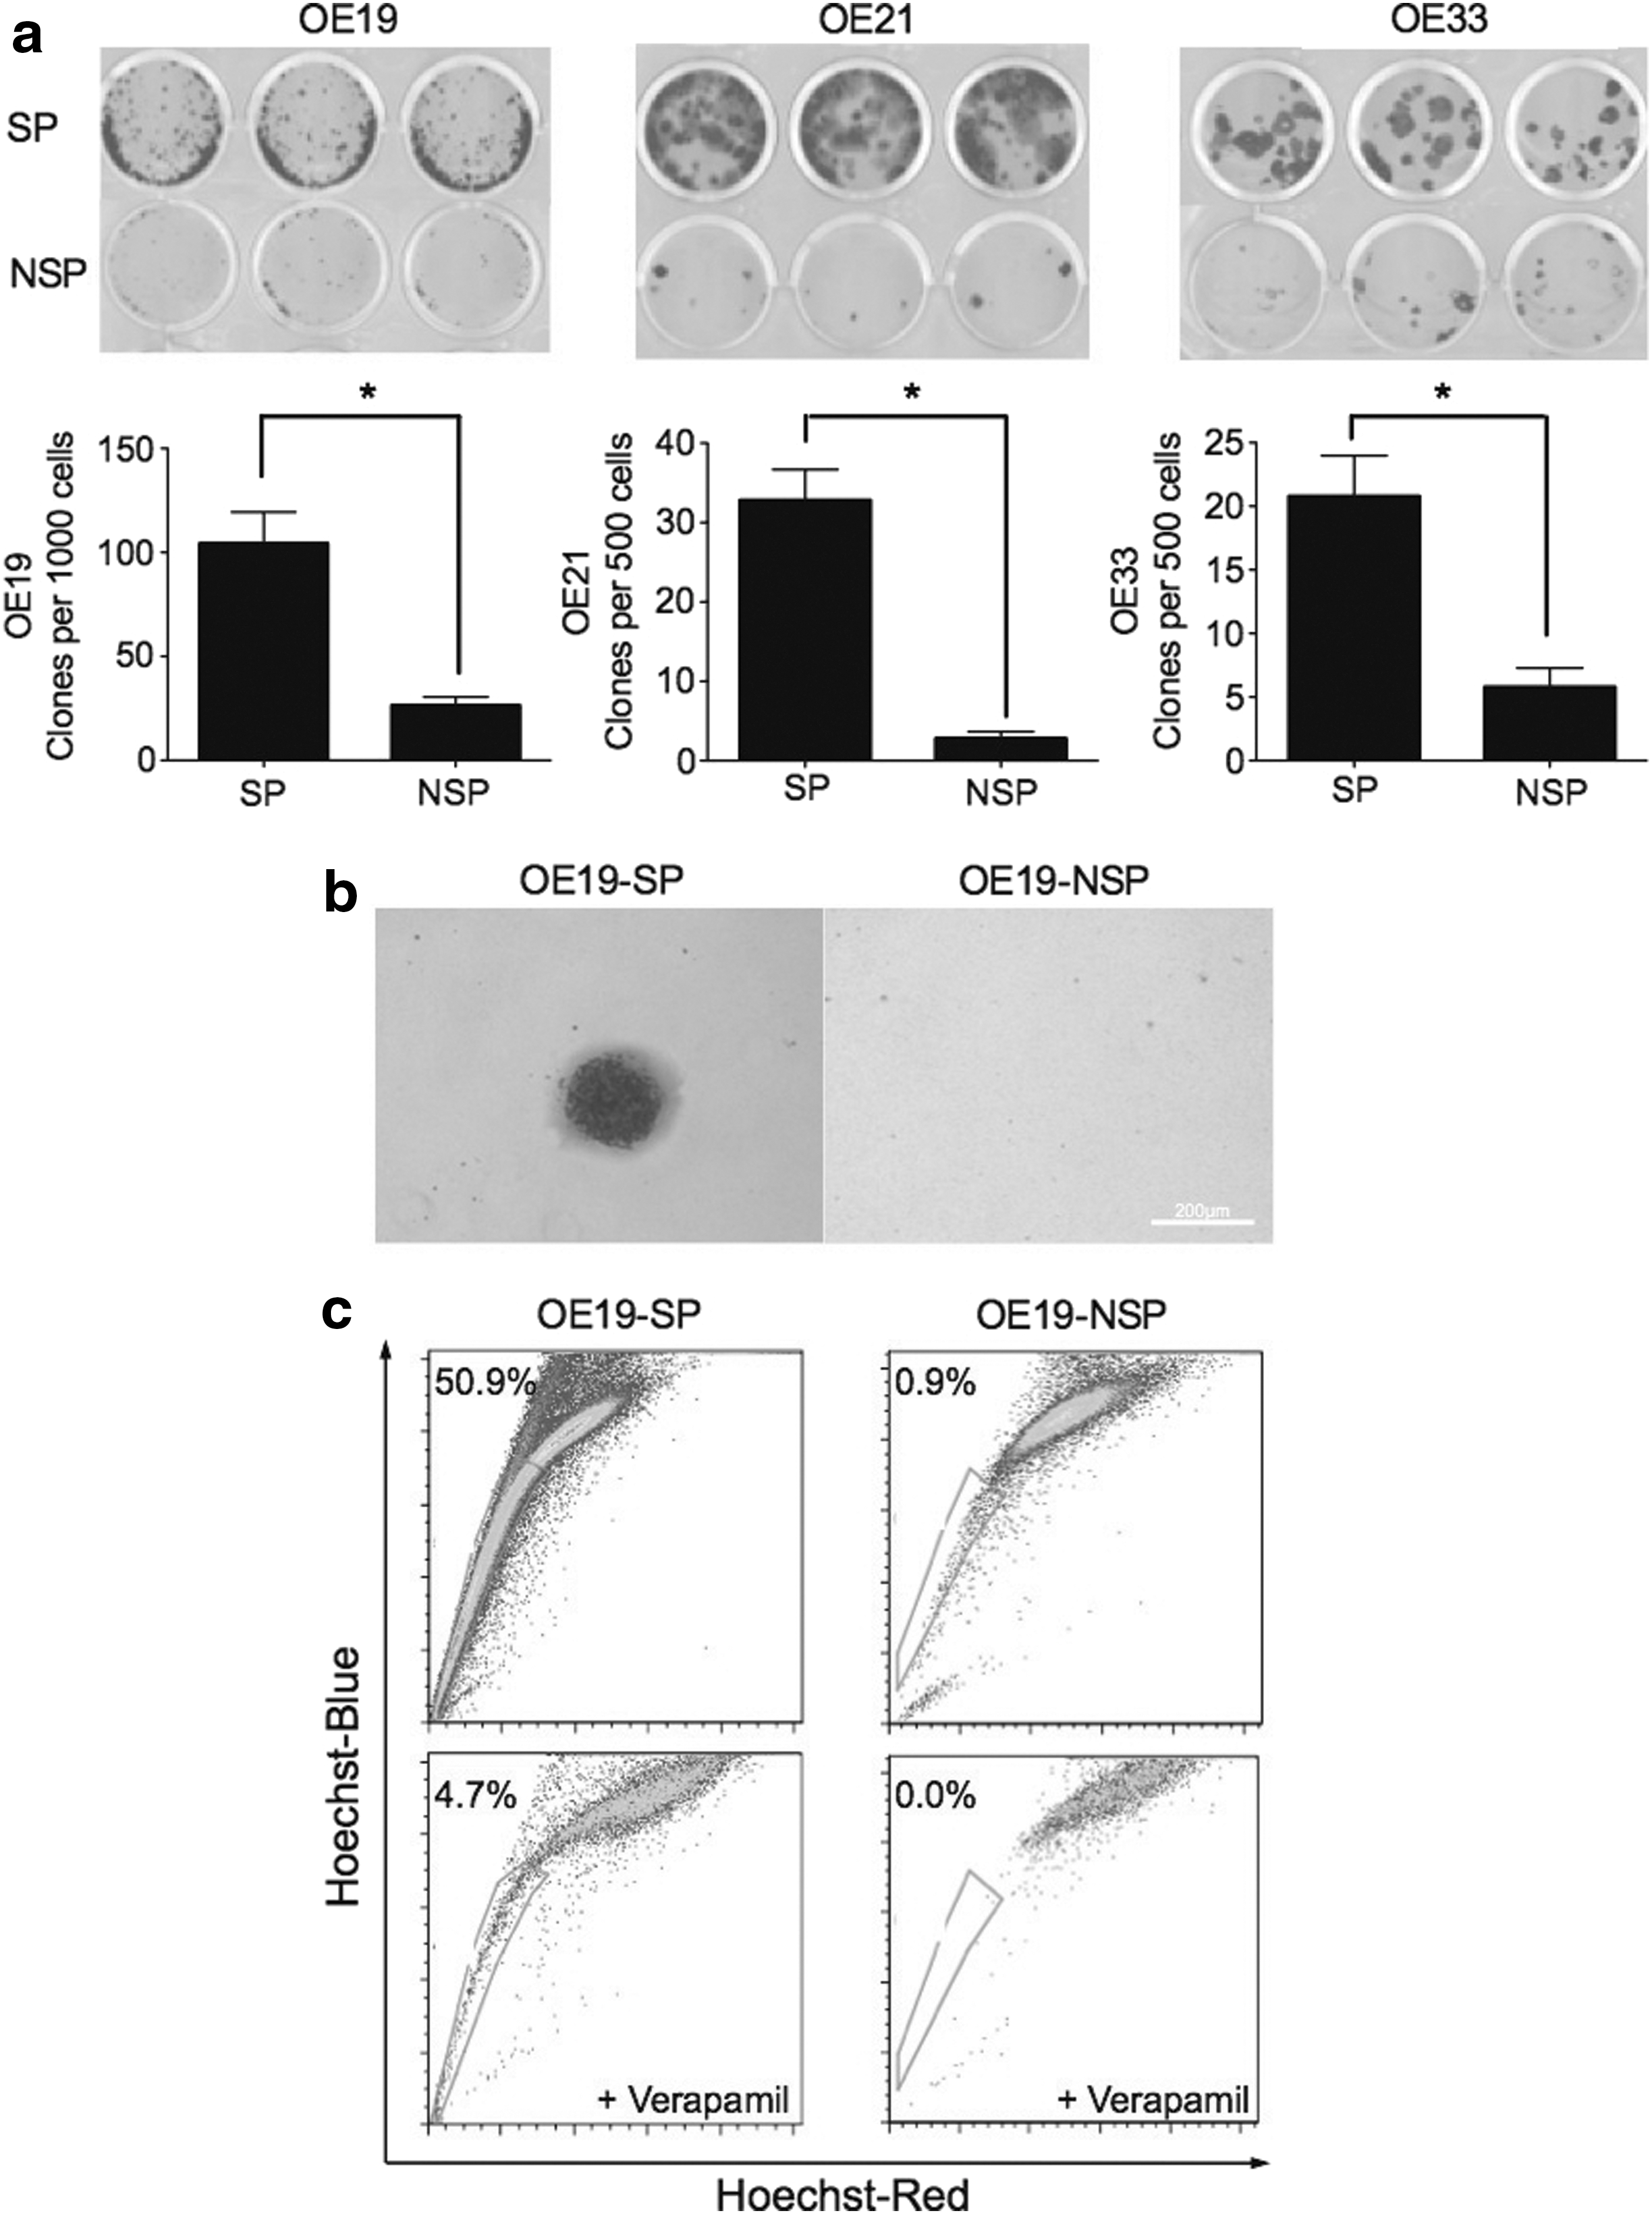
SP cells are able to self-renew and differentiate in vitro.
Isolated SP and NSP cells from OE19 were cultured separately under the same conditions for 1–3 weeks followed by Hoechst 33342 dye reanalysis. SP cells were able to generate both SP (50.9% of whole cell population) and NSP cells. The proportion of SP cells was significantly reduced under verapamil treatment. Conversely, OE19-NSP cells generated only a proportion of 0.86% SP cells (Fig. 2c). Similar tendencies were detected in the OE33 cell line (data were not shown). However, in this instance, the sorting process yielded a limited amount of OE21-SP cells, which could not survive under the growth conditions of the soft agar and differentiation assay.
Tumorigenicity of SP cells in vivo
After tests of sorting for the three cell lines, we found that OE19 cells presented the most optimal sorting results and also showed good cell viability of both SP and NSP cells following the sorting processes. For this reason, we focused on the OE19 cells for in vivo experiments. OE19 tumor xenografts were established by subcutaneous injection of 1.0×10⁵ SP or NSP cells on the flank of BALB/c nu/nu mice. At 63 days, after tumor cell injection, all animals were sacrificed. The weight of the subcutaneous tumor originating from SP cells was significantly higher compared to subcutaneous tumors from NSP cells (1.04±0.36 g vs. 0.22±0.34 g, P<0.05; Fig. 3a, b).
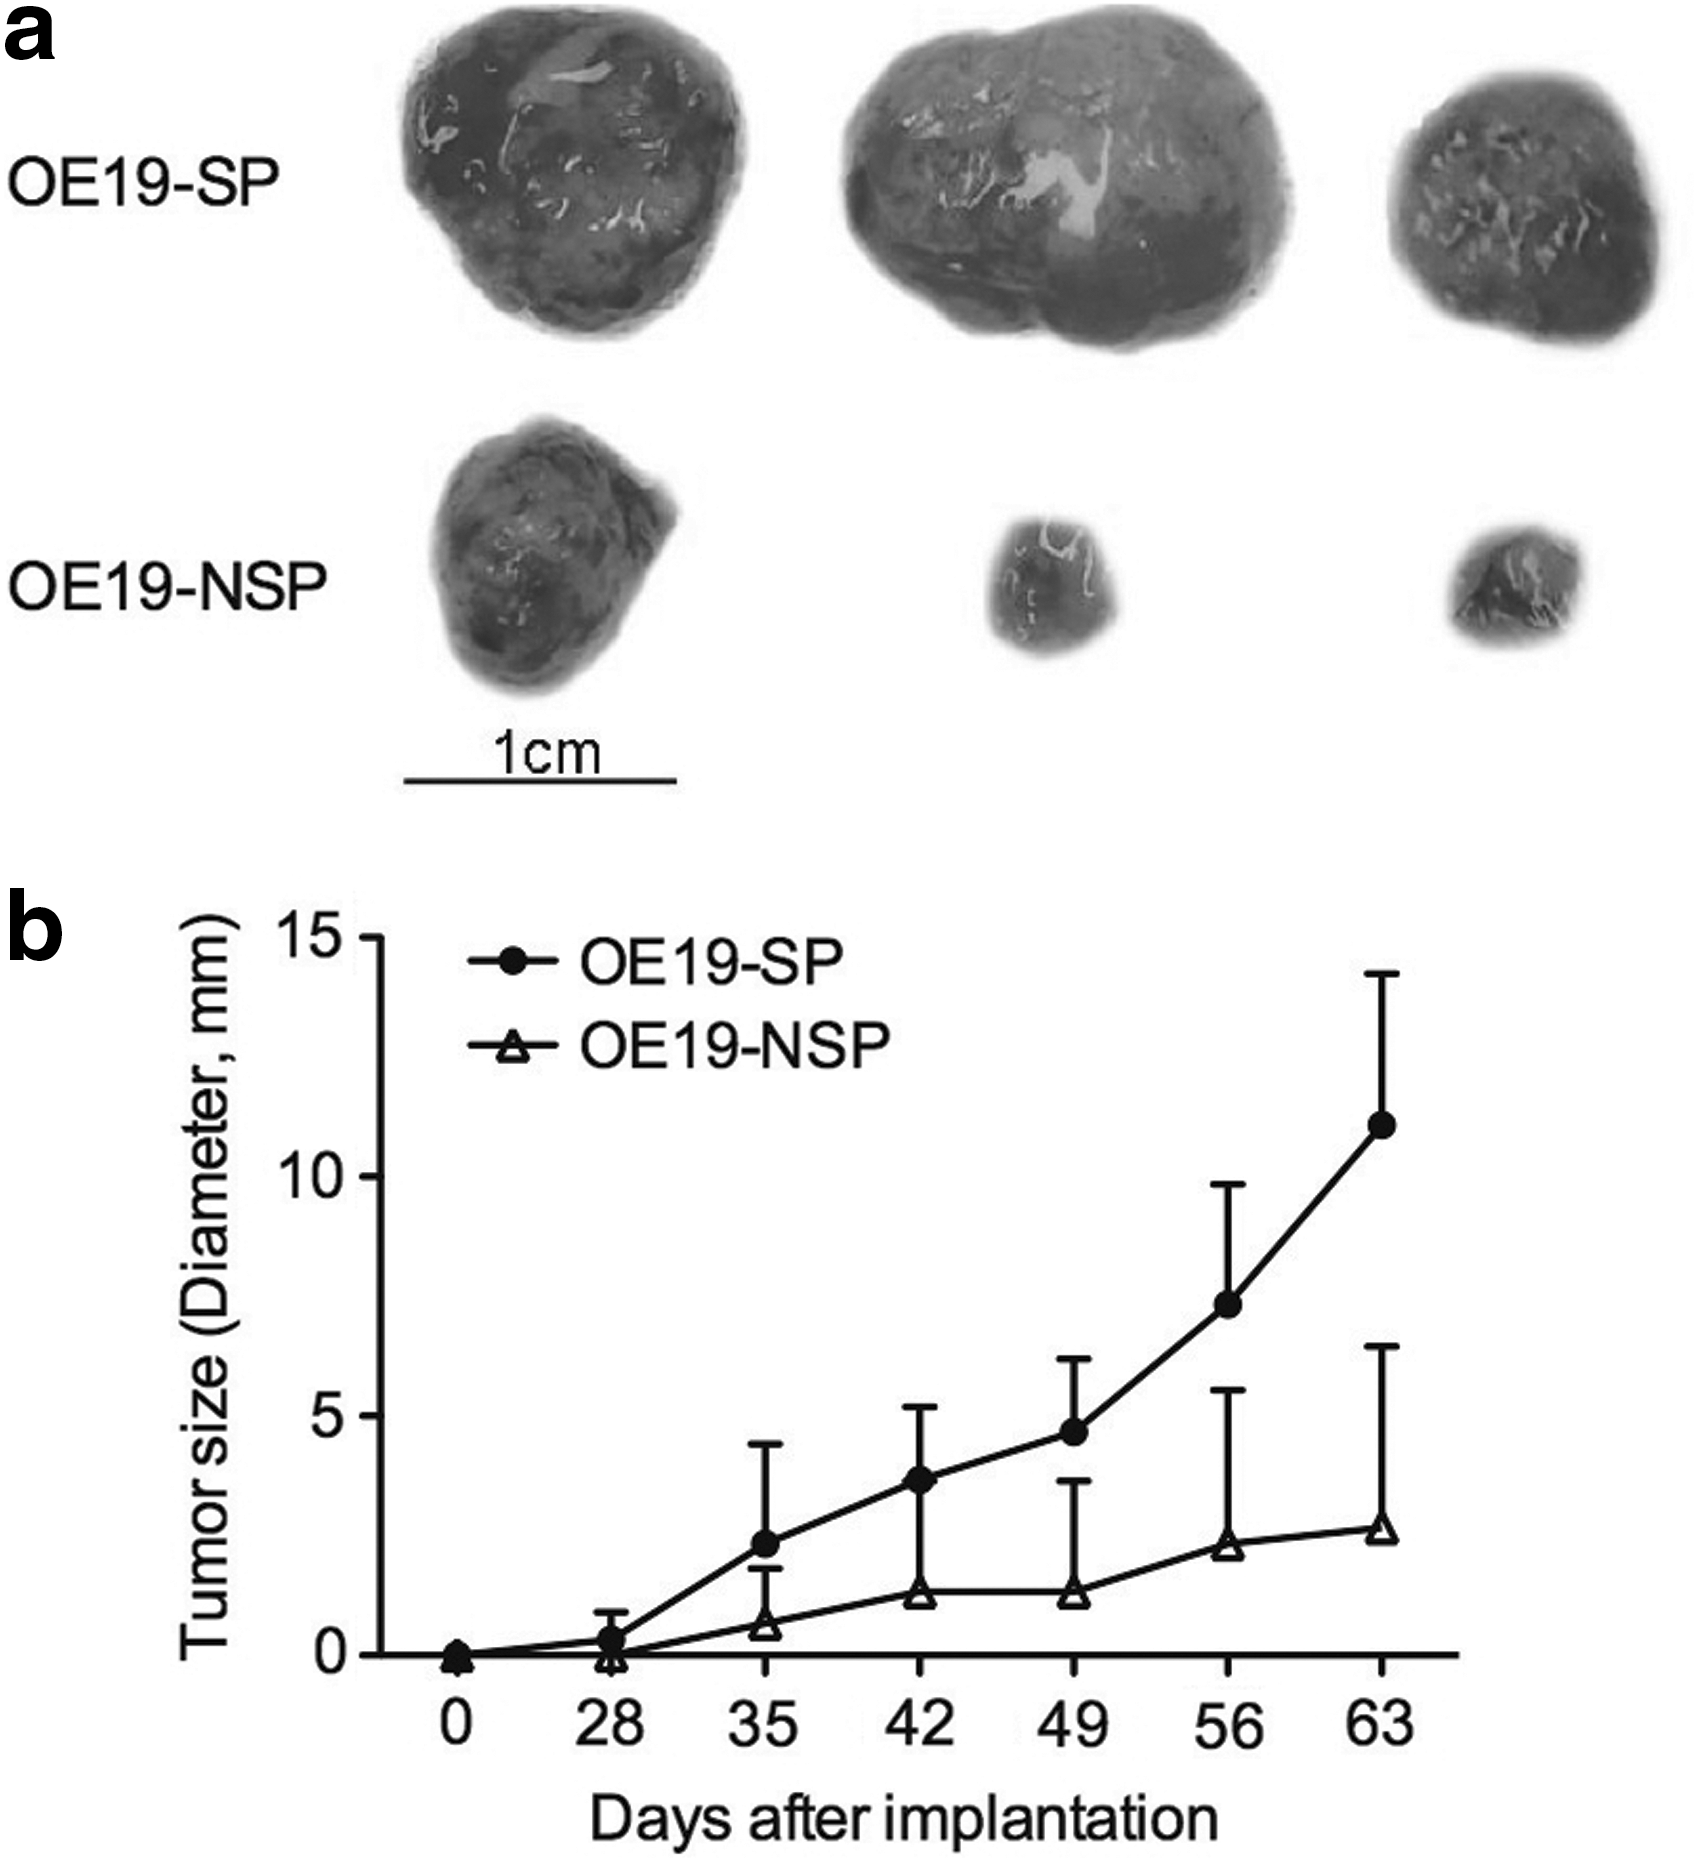
SP cells are more tumorigenic in vivo.
Intrinsic chemotherapy resistance of SP cells
Previous studies have indicated that SP cells possess resistance to chemotherapy [16,28,29]. After sorting, OE19-SP and OE19-NSP cells were plated for 24 h in tissue culture flasks. After primary attachment, the cells were harvested and replated in 96-well plates for treatment with 5-FU and cisplatin over 48 h. After treatment with 5 μg/mL 5-FU, cell viability was 45.1%±5.1% of SP versus 33.0%±2.5% for NSP cells. Treatment with 5 μg/mL cisplatin led to a cell viability of 44.4%±6.3% of SP versus 30.8%±5.5% of NSP cells (P<0.05) (Fig. 4).
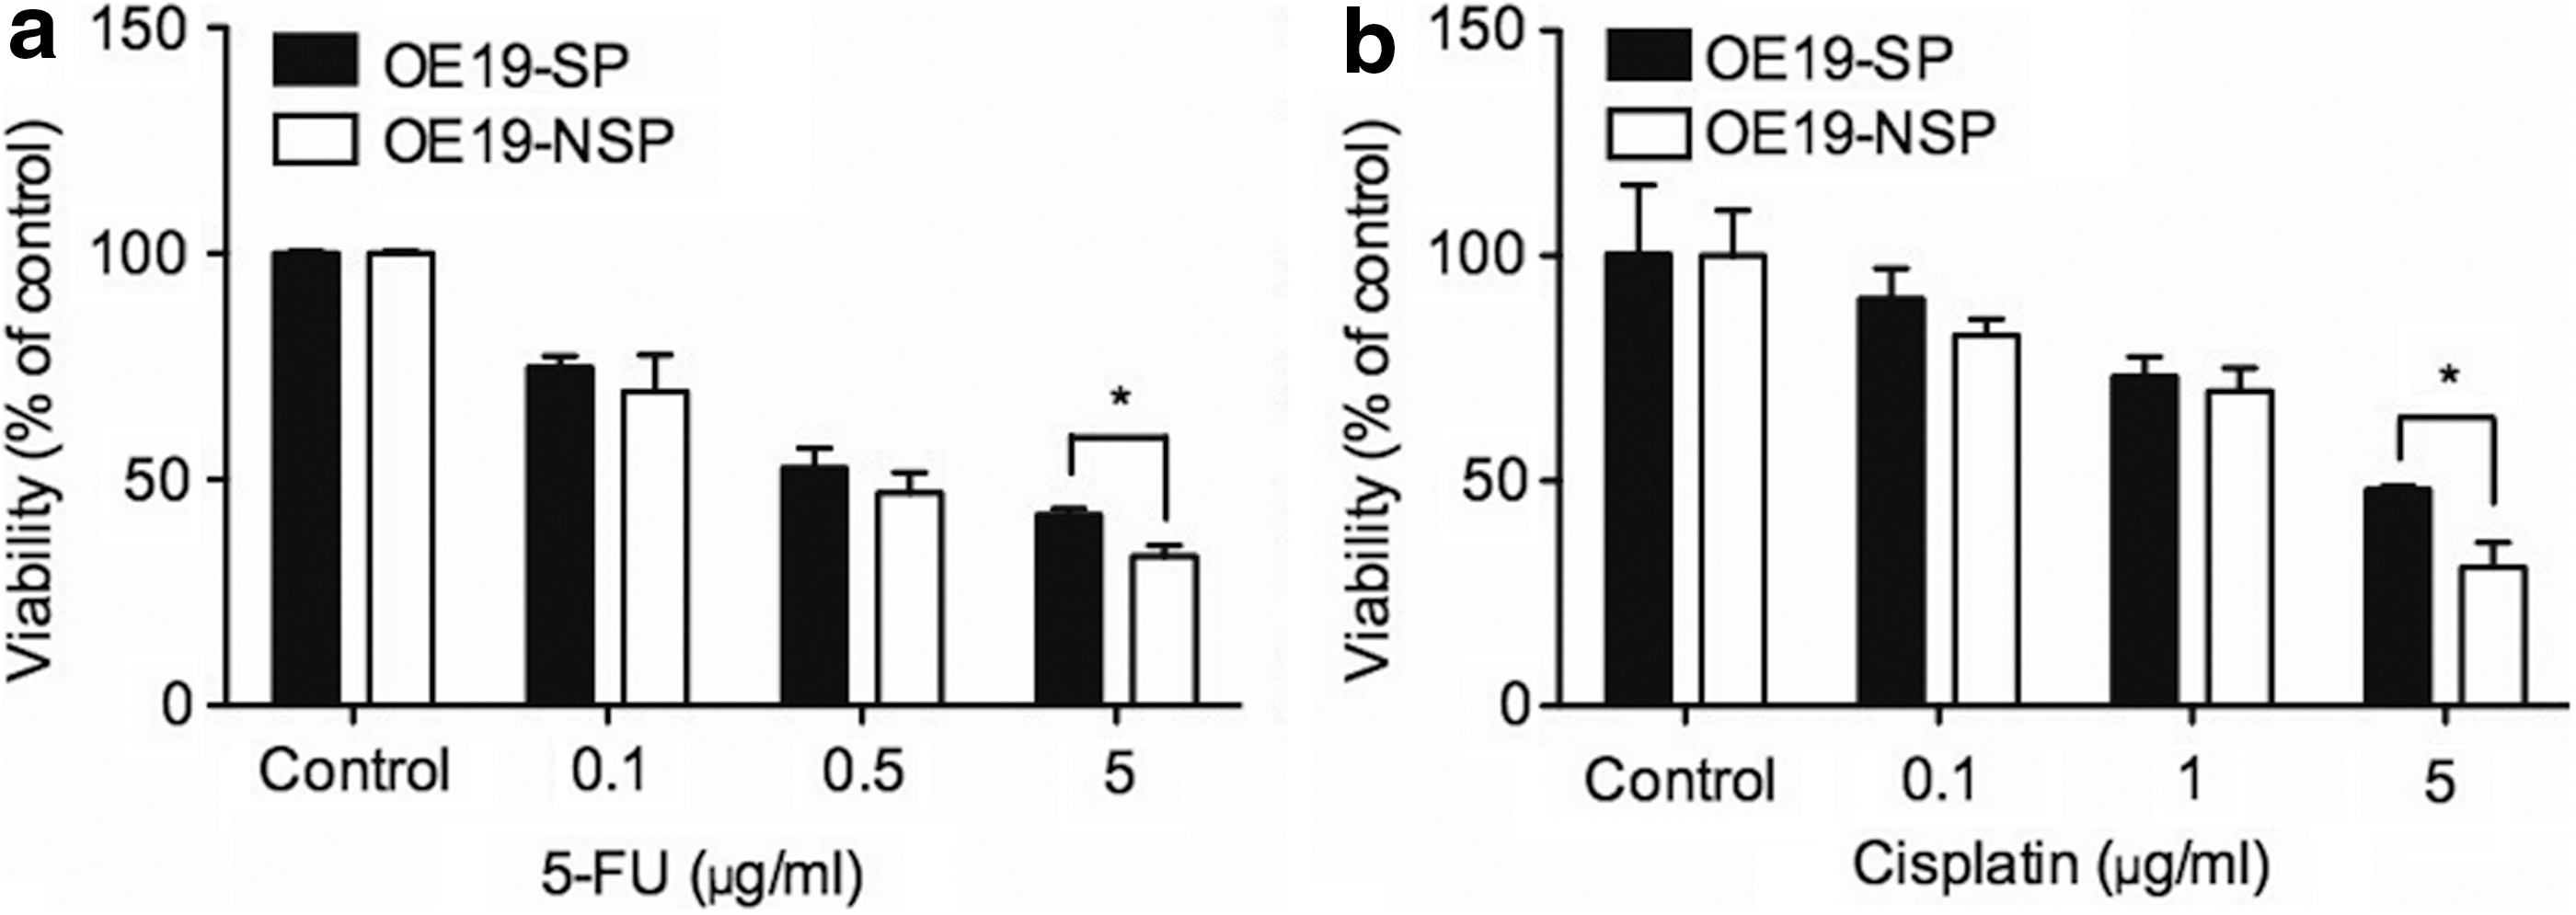
SP cells are chemoresistant. OE19-SP cells were more resistant to chemotherapeutic drugs, such as 5-fluorouracil (5-FU)
Expression of CSC markers and chemoresistance associated markers in SP cells
OE19-SP cells demonstrated significantly higher amount of ABCG2 and CD44 positive subpopulations than OE19-NSP cells (Fig. 5a). In addition, FACS results displayed higher expression of active β-catenin display SP cells (24.4%) than NSP cells (6.6%) (Fig. 5b). Interestingly, we could not detect a clear CD133+ subpopulation either in OE19-SP cells, OE19-NSP cells, or whole cell population of OE19 (<0.2%) (data not shown). Fluorescent staining supported this observation showing a stronger staining of ABCG2 and CD44 in OE19-SP as compared to OE19-NSP cells (Fig. 5c). β-Catenin had an accumulated nuclear localization in OE19-SP cells; whereas OE19-NSP showed more cytomembraneous staining, which indicated that wnt signaling is activated in SP cells (Fig. 5c). Interestingly, a group of ABC multidrug transporter genes, including ABCB1, ABCC2, and ABCC3 were significantly higher expressed in SP than NSP in both the OE19 and OE33 cells (Fig. 5d and Supplementary Fig. S1). In addition, we found an enhanced expression of thymidylate synthase in OE19 SP as compared to NSP cells (Fig. 5d).
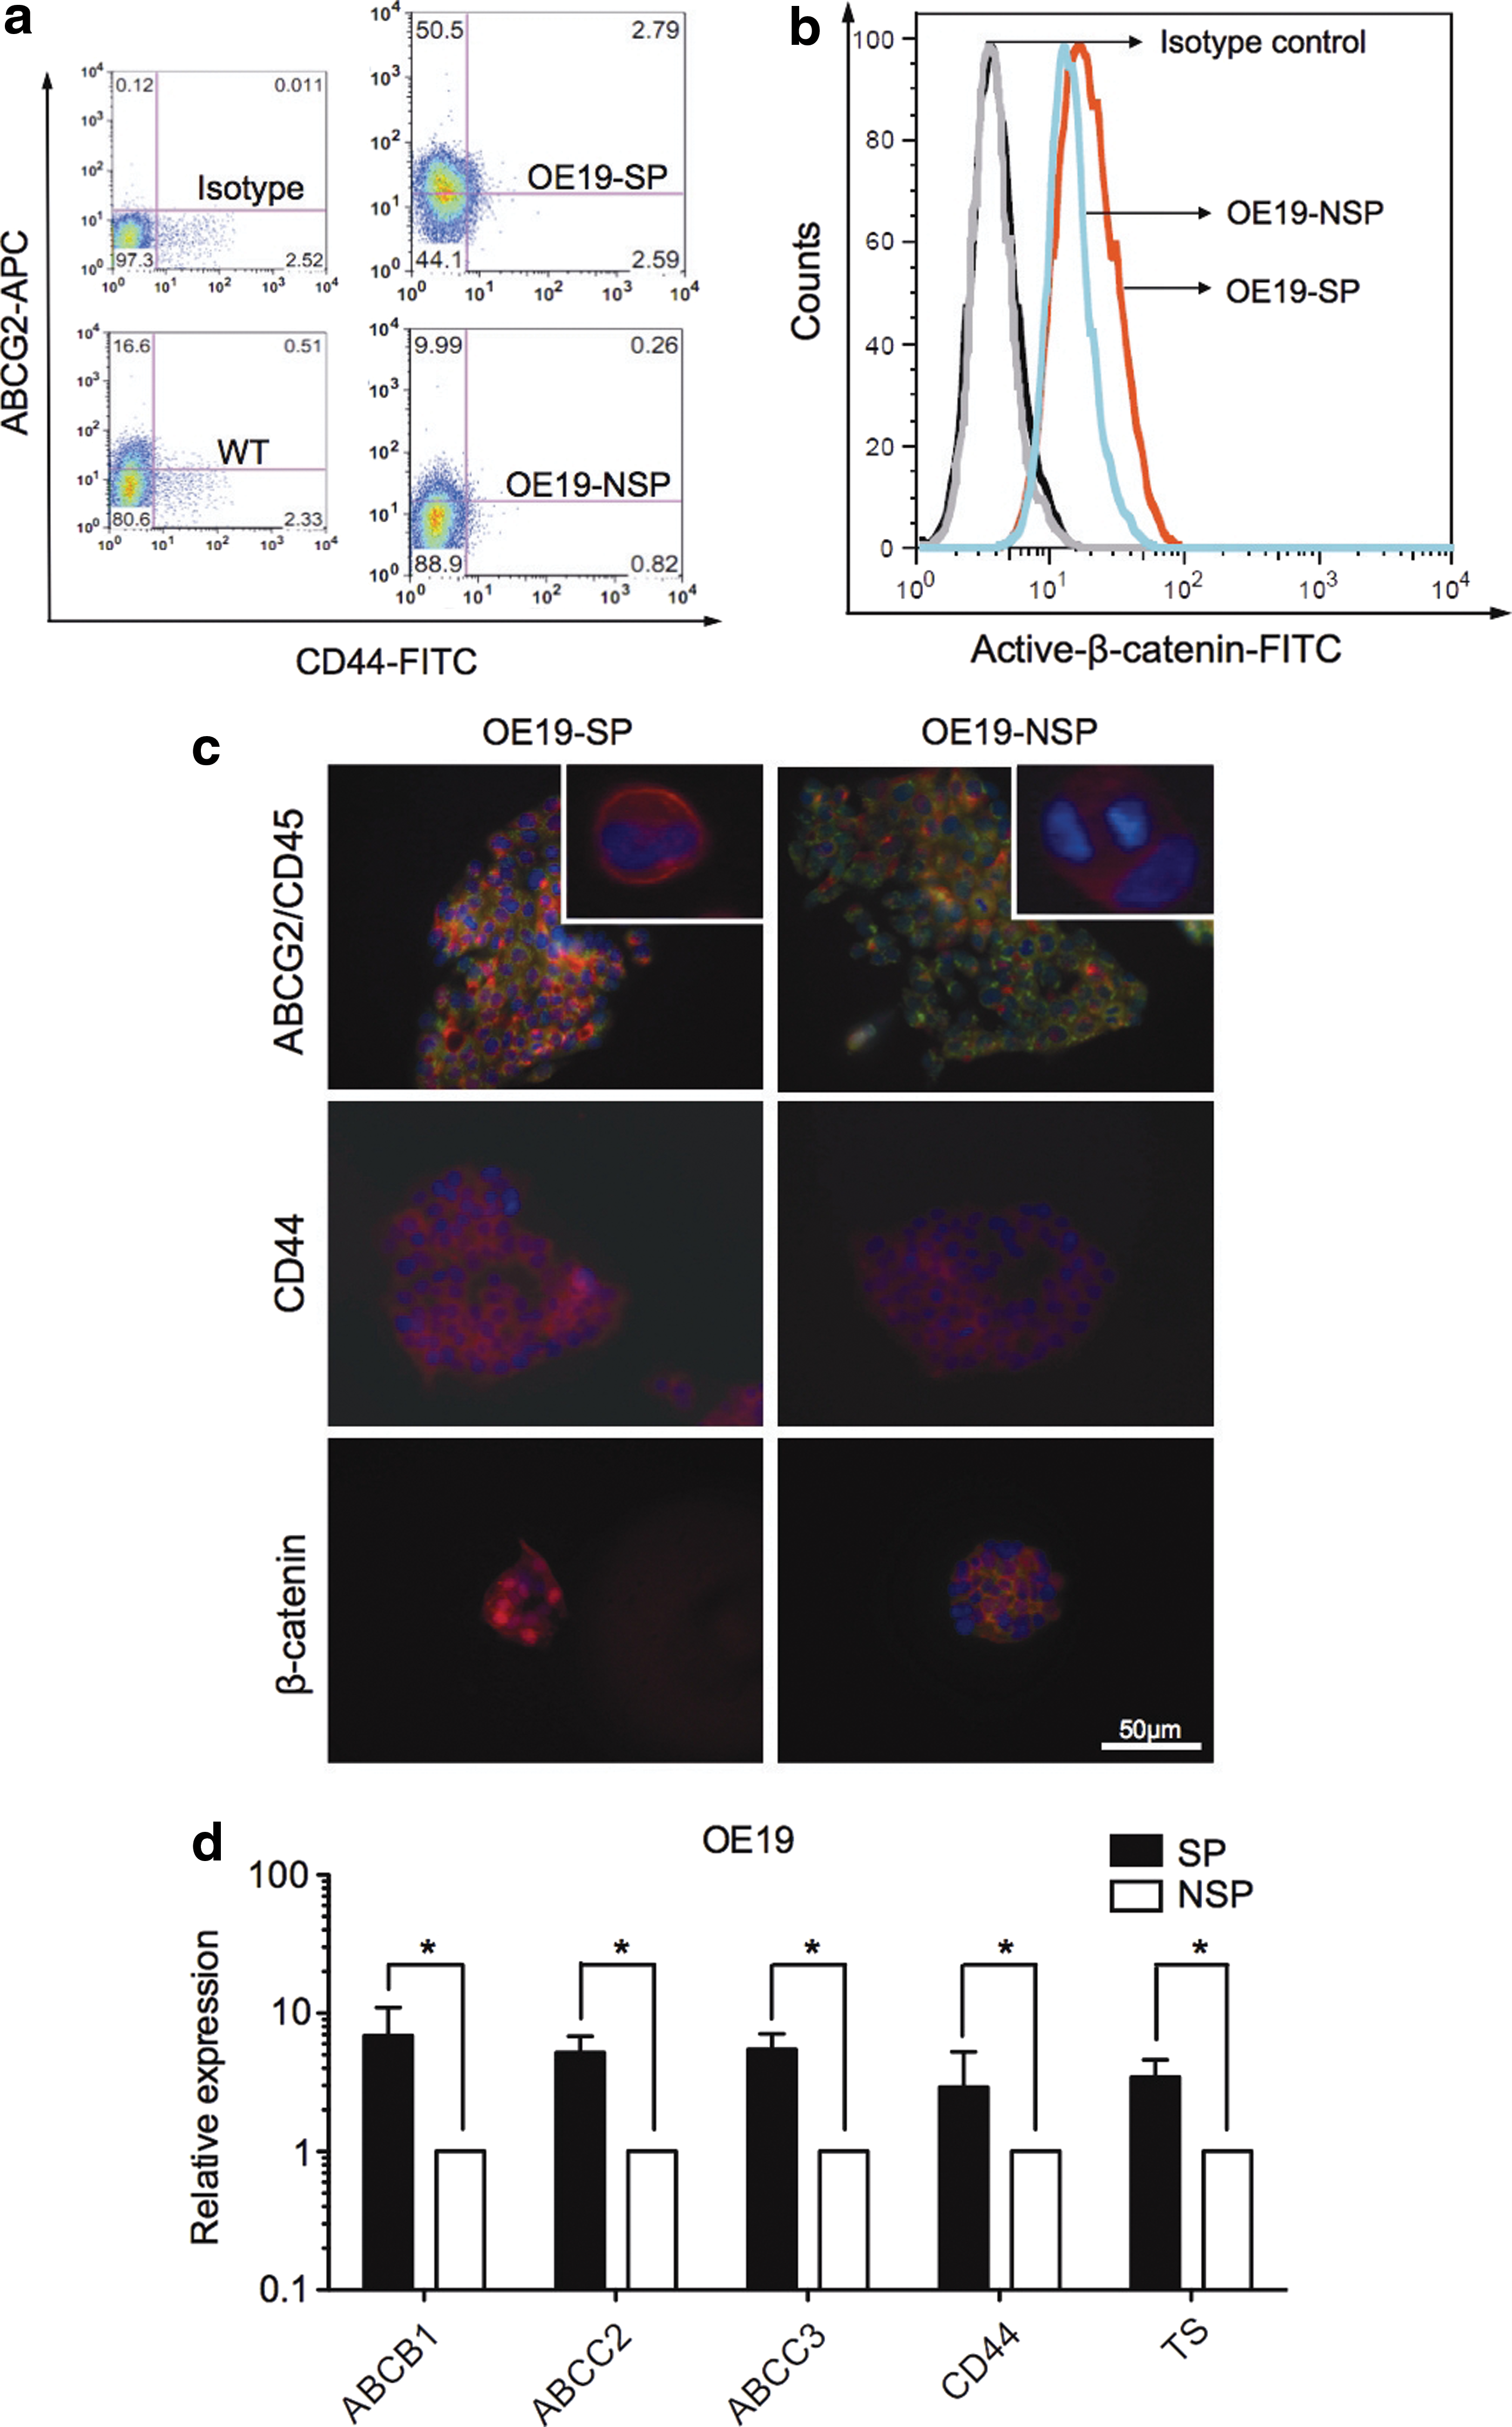
SP cells express other cancer stem cells (CSCs) markers and chemoresistance associated genes.
Enrichment of SP cells based on acquired resistance to 5-FU or cisplatin
To demonstrate an association between chemotherapy resistance and enrichment of SP cells in the PT1590 cell line and the LN1590 cell line, which lacked a stable SP subpopulation, each cell line was cultured in medium with increasing concentrations of 5-FU and cisplatin starting from 0.1 μg/mL up to 5 μg/mL for more than 10 months. Stable chemotherapy resistant cell lines PT1590/5-FUres, PT1590/CDDPres, LN1590/5-FUres, and LN1590/CDDPres were established with significantly higher IC50 values (Table 1). The SP fraction was significantly enriched in both 5-FU and cisplatin resistant cell lines, raising from 0.01% to 0.23% and 0.85% in PT1590/5-FUres and PT1590/CDDPres cells, and from 0.04% to 2.80% and 1.06% in LN1590/5-FUres and LN1590/CDDPres cells (P<0.001) (Fig. 6a, b). With increasing duration of chemotherapy, the SP subpopulation was substantially growing. Exemplarily, PT1590/CDDPres had about 0.1% of SP cells after 2 months continuous treatment with cisplatin, after 4 months 0.7%, and after 8 months of chemotherapy about 1.3% of SP cells (Fig. 6c). Protein levels of thymidylate synthase were highly elevated in PT1590/5-FUres and LN1590/5-FUres as compared to the sensitive cells (Supplementary Fig. S2a). Accordingly, ERCC1 was markedly higher expressed in PT1590/CDDPres and LN1590/CDDPres using FACS analysis as compared to the respective sensitive cell lines (Supplementary Fig. S2b).
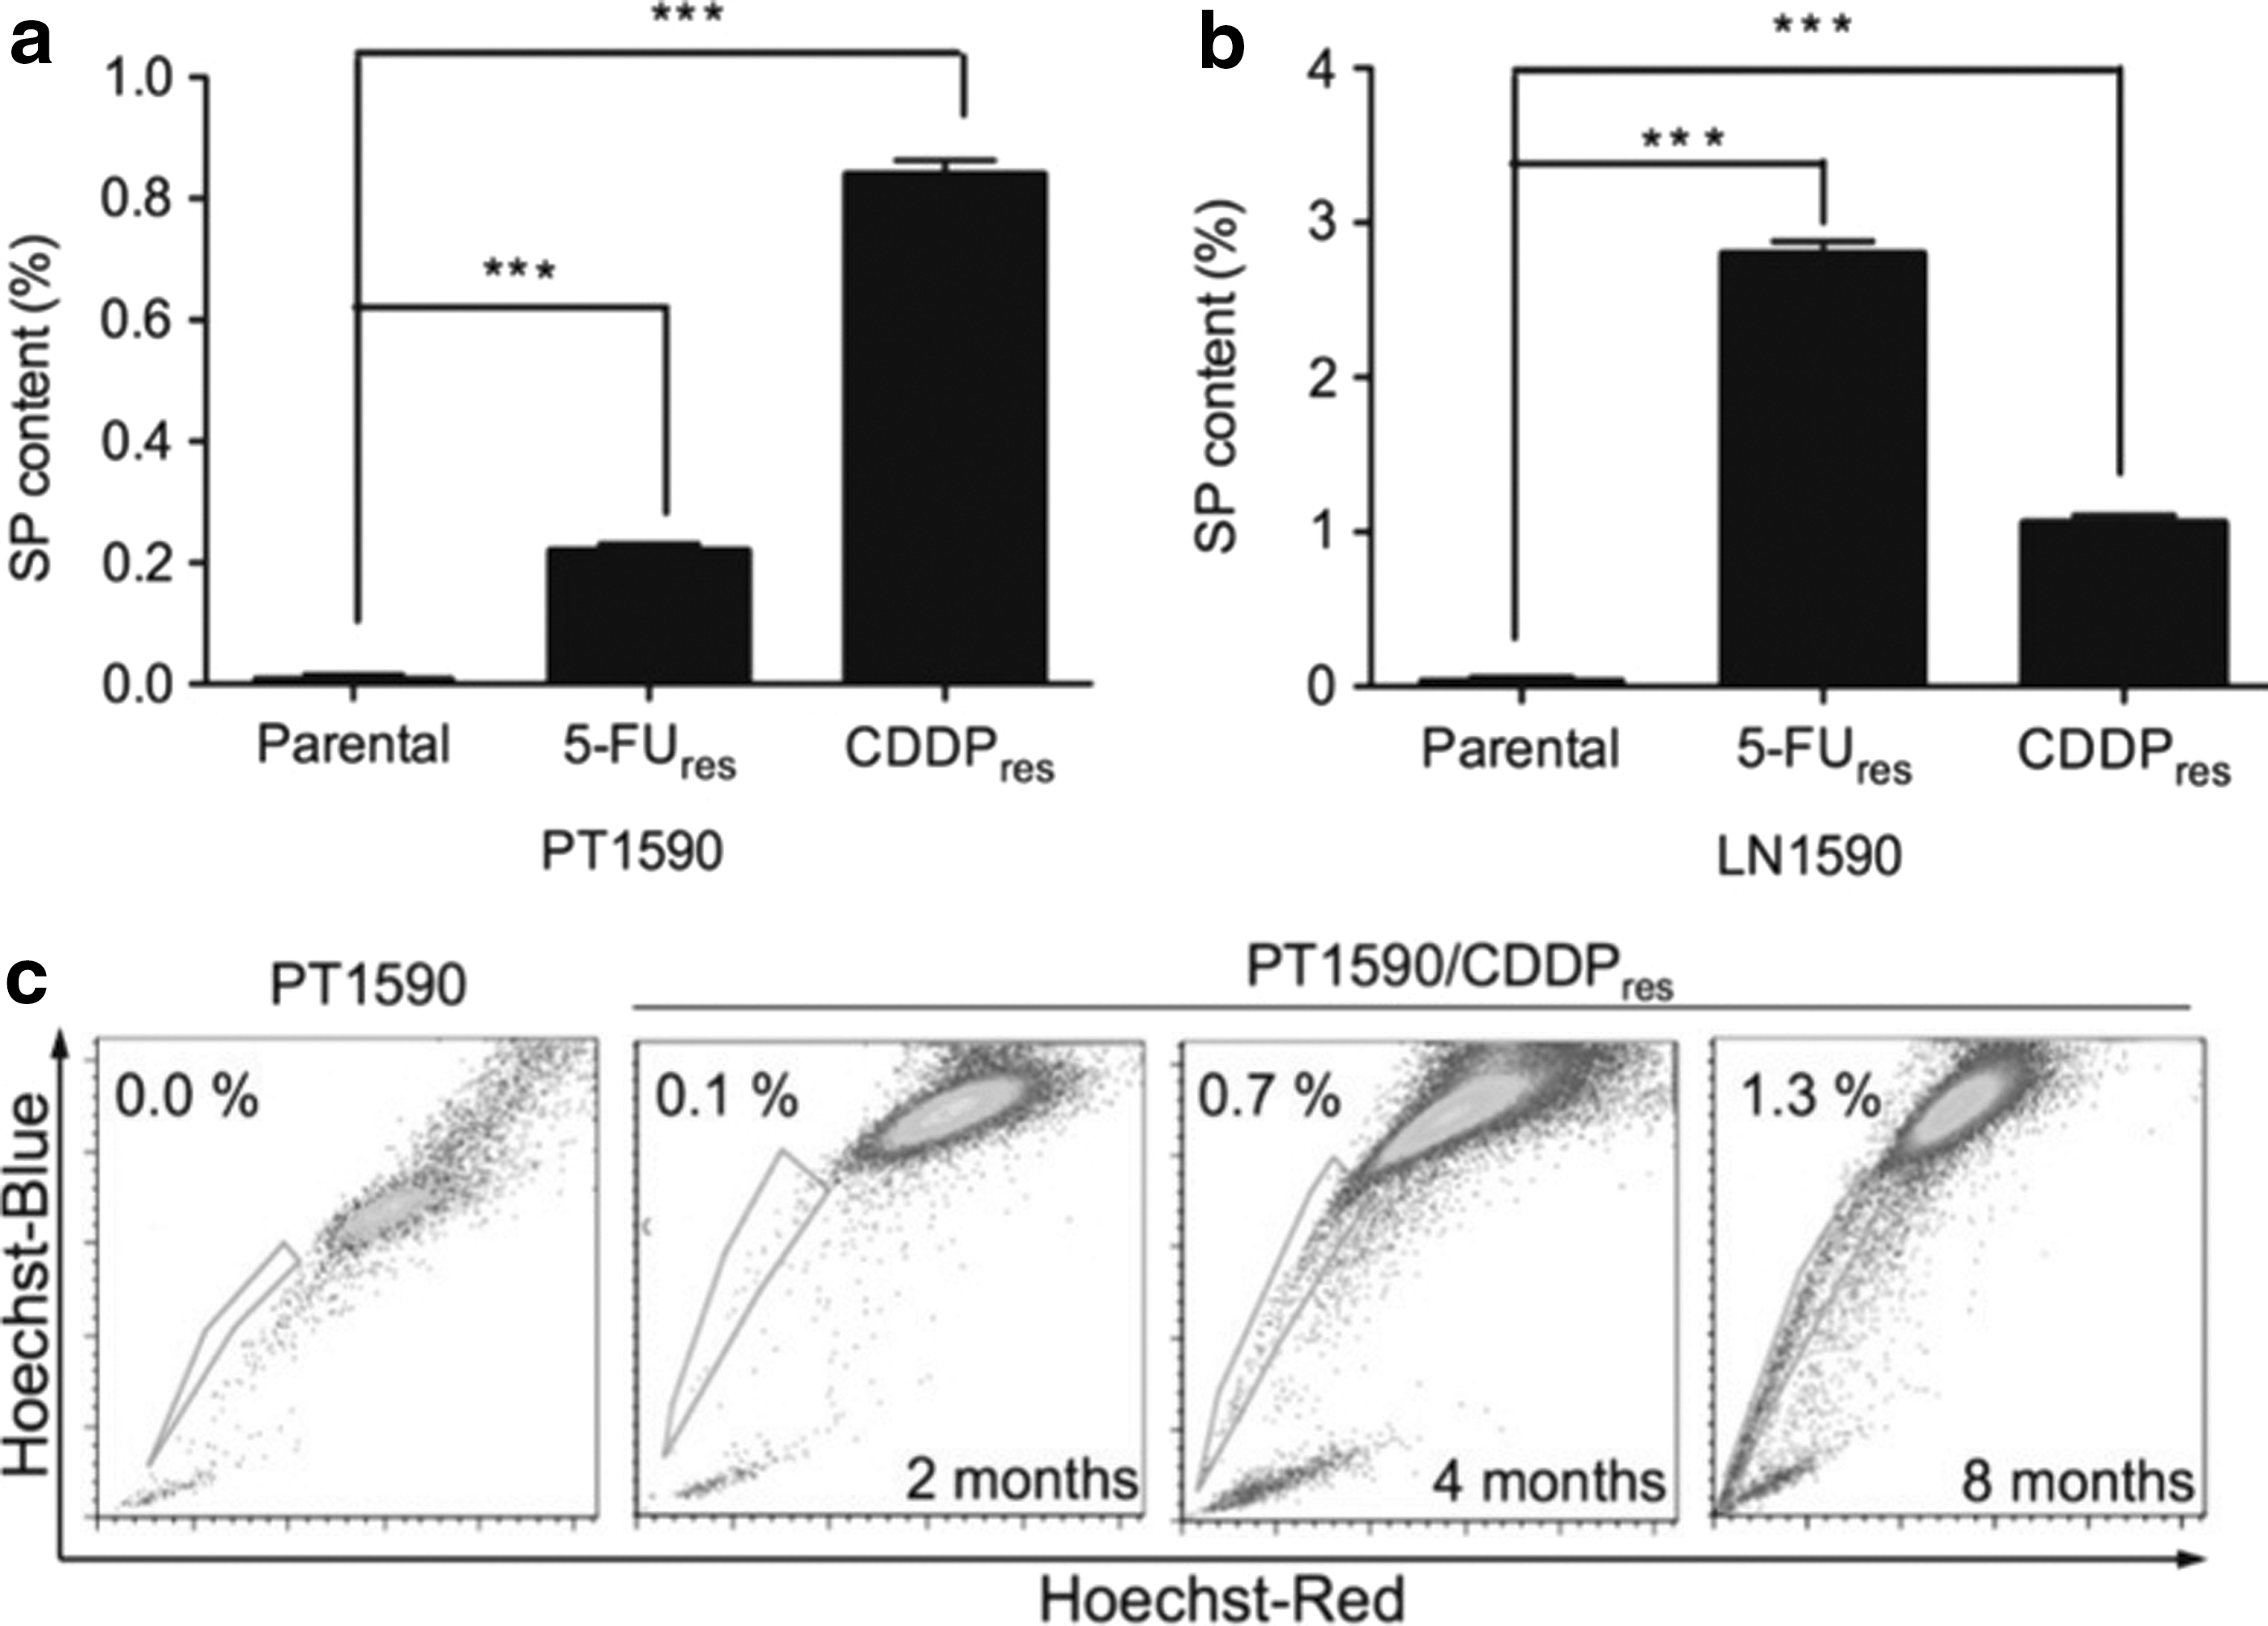
Regeneration of SP cells in PT1590 and LN1590.
IC50 values of 5-FU and cisplatin parental and resistant PT1590 and LN1590 are presented by MTT assay.
5-FU, 5-fluorouracil; IC50, 50% inhibitory concentration.
EMT is associated with chemotherapy resistance in SP cells
OE19 cells were then cultivated over 6–12 months in the presence of 1–20 μg/mL 5-FU. The surviving cells (OE19/5-FUres) resembled spindle-shaped mesenchymal cells which grew differently compared to sensitive cells, which were tightly packed in tissue culture (Fig. 7a) OE19/5-FUres cells demonstrated a significantly higher IC50 value of 191.9±3.1 μg/mL compared to sensitive OE19 cells with an IC50 value of 26.8±0.2 μg/mL after 5-FU application for 48 h (P<0.001). Since we observed a different morphology of OE19/5-FUres cells with a mesenchymal-like phenotype, vimentin, which is a type III intermediate filament protein expressed in mesenchymal cells, was determined in both cell lines by immunofluorescent staining and western blot analysis (Fig. 7b, c). The protein level of vimentin was elevated in OE19/5-FUres cells and predominantly expressed at the cell surface.
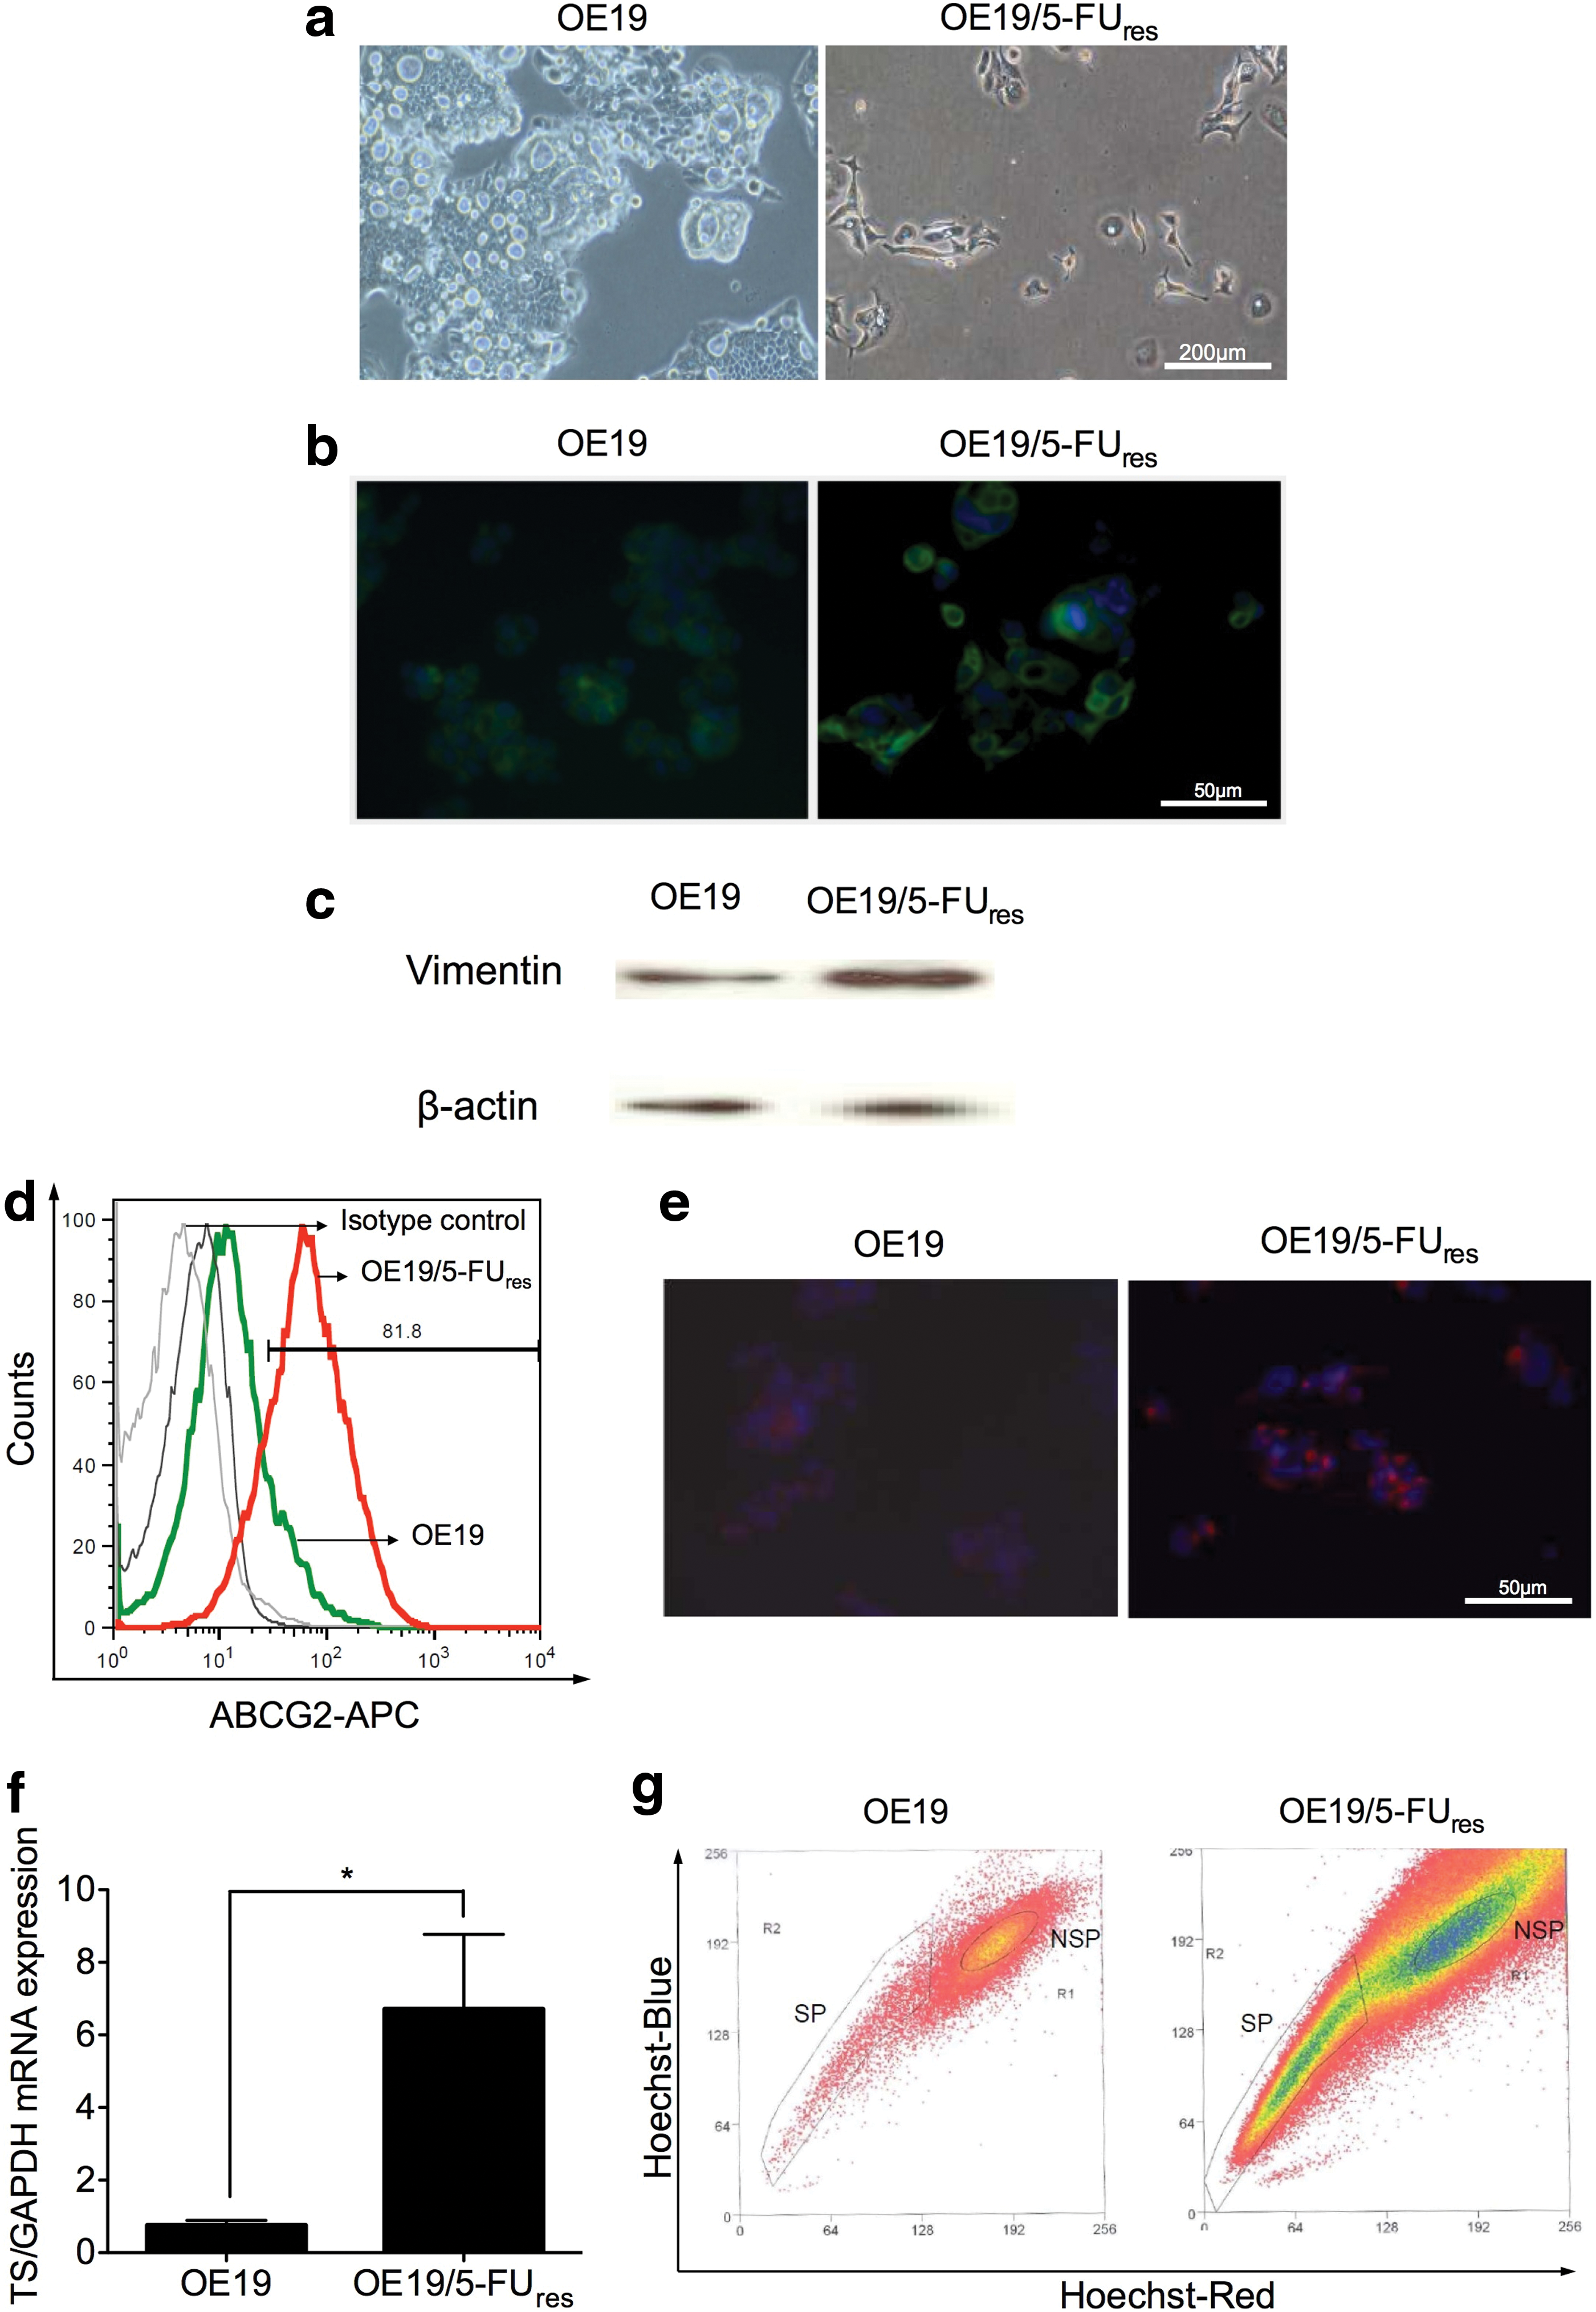
Establishment of OE19/5-FUres cell lines: association to a mesenchymal like phenotype.
Furthermore, ABCG2/BCRP1, a calcium-sensitive cell surface protein excluding the Hoechst dye, conferring resistance to several chemotherapeutic agents as previously reported, was significantly elevated in OE19/5-FUres cells with 4.97±1.5-fold positive ABCG2 cells compared to sensitive OE19 cells (P<0.02) (Fig. 7d). Immunofluorescent staining for ABCG2 displayed a cytoembraneous expression in OE19/5-FUres cells (Fig. 7e). Meanwhile, 5-FU resistant marker-TS was confirmed overexpressed in 5-FU resistant variant as compared to parental OE19 (6.7±4.6 vs. 0.8±0.4, P<0.05) (Fig. 7f). Comparing this to recent studies indicating that the presence of the ABCG2 transporter highly correlates with the SP phenotype, we could demonstrate a significant enhancement of SP cells from 2.18%±0.25% in sensitive OE19 cells compared to 19.74%±4.06% in OE19/5-FUres cells (P<0.05) (Fig. 7g). Cisplatin resistant variants of OE19 were also developed. The IC50 value of OE19/CDDPres cells demonstrated a higher resistance (12.2±1.0 μg/mL) as compared to sensitive OE19 cells (IC50 value of 6.0±1.3 μg/mL) after cisplatin application for 48 h (P<0.005). We were also able to demonstrate an enhanced mesenchymal phenotype with chemoresistant characteristics associated with enrichment in SP cells, that paralleled the phenomena found in OE19/5-FUres cells (Supplementary Fig. S3).
Finally, we investigated whether SP cell induced chemotherapy resistance is associated with EMT. A commercial EMT PCR array (The Human Epithelial to Mesenchymal Transition RT2 Profiler™ PCR Array) was used to profile the expression of 84 key genes that either change their expression during EMT or regulate alterations of EMT associated gene expression. SP cells isolated from both OE19 and OE19/5-FUres were analyzed as described in Materials and Methods. The mRNA expression of SLUG (SNAI2), CALD1, WNT11, MSN, ZEB1, SERPINE1, VCAN, COL3A1, ERBB3, TMEFF1, TCF4, ITGA5, TIMP1, GSK3B, ITGAV, BMP1, MMP9, COL5A2, FOXC2, MMP3, NOTCH1, VIMENTIM, MAP1B, FN1, DSC2, and COL1A2 was significantly upregulated in SP cells from OE19/5-FUres cells (>4-fold changes) when compared to that in the SP subpopulation of sensitive OE19 cells. In contrast, a decrease of TSPAN13 and IL1RN mRNA expression in OE19/5-FUres-SP cells was analysed (Table 2). Western blot analysis showed an overexpression of mesenchymal marker VIMENTIN in resistant SP cells in protein level (Supplementary Fig. S4). Key factors of the Wnt, Notch, and TGF-β/BMP signaling pathway, such as WNT11, NOTCH1, and BMP1 were also considerably different in OE19/5-FUres-SP cells as compared to the SP subpopulation of sensitive OE19 cells.
mRNA levels of 84 EMT associated key genes either change their expression during the process of EMT or regulating EMT gene expression changes were evaluated in OE19/5-FUres-SP cells as compared to the SP subpopulation of sensitive OE19 cells. In OE19/5-FUres-SP cells many EMT key genes, such as SNAI2, CALD1, SERPINE1, VCAN, TMEFF1, TCF4, ITGA5, TIMP1, ITGAV, BMP1, MMP9, COL5A2, FOXC2, MMP3, NOTCH1, VIMENTIM, MAP1B, FN1, DSC2, COL1A2 were significantly up-regulated, while TSPAN13 and IL1RN were significantly down-regulated. Wnt, Notch, and TGF-β/BMP signaling pathway key factors were also involved in 5-FU resistance associated EMT of OE19-SP cells.
SP, side population; EMT, epithelial-to-mesenchymal transition.
Discussion
More than 90% of esophageal cancers are either SCC or AC [30]. The incidence of esophageal AC located in the distal oesophagus and gastroesophageal junction is rising and often associated with a history of gastroesophageal reflux disease and Barrett's oesophagus [31]. More than two-thirds of patients present with unresectable or metastatic disease at the time of diagnosis, most patients with localized disease will develop metastases despite therapy [31,32]. Traditional chemotherapy is based on cisplatin and 5-FU, a combination of chemotherapeutic agents with Epirubicin or Taxane, which constitutes the most effective treatment option [33,34]; however, development of resistance to chemotherapy remains a major challenge. An understanding of the molecular mechanisms of resistance primarily to 5-FU and cisplatin is important to effectively treat esophageal cancer in the future.
CSCs are often resistant against chemotherapeutic agents either based on clonal selection of drug resistant cancer cells with high tumorigenic potential with respect to lung cancer [35], or caused by elevation of drug transporters that enable the ejection of chemotherapeutic agents, such as 5-FU and irinotecan [36,37]. In the present study we analysed the function of SP cells for chemotherapy resistance and metastasis in esophageal cancer. One key feature to characterize SP cells as stem cell like cells is higher resistance to chemotherapy than the bulk of cancerous cells (resistance to apoptosis, expression of certain pumps, including ABCC1, ABCG2, and MDR1, which are the principal mediators of multidrug-resistance, quiescent in the absence of specific stimulation from the microenvironment). The SP assay constitutes a highly valuable primary purification strategy for isolating potential stem/progenitor cells from various tissues or cell lines, particularly in the absence of specific cell surface markers [38]. The results presented suggest that SP cells in esophageal cancer indeed mirror the proposed biology of CSCs.
Using Hoechst 33342 dye, we detected by FACS analysis different proportions of SP cells in four esophageal AC and one SCC cell line varying from 0 to nearly 20% [39,40]. SP cells are generally identified based on their drug/dye efflux efficiency maintained by the breast cancer resistant protein 1 (Brcp1)/ABCG2, a member of ABC family, [17] which has been associated with multidrug resistance in diverse malignancies [41]. Our results reproducibly demonstrated that OE19 cells comprised a larger amount of SP cells displaying intrinsic resistance towards 5-FU and cisplatin (Fig. 4). Other ABC multidrug transporters, such as ABCB1, ABCC2, and ABCC3 were all highly expressed in SP cells, whereas ABCC5 and ABCC11 were not detectable either in sorted subpopulation or the whole cell population in our real-time PCR system. Shi et al. found SP cells expressing high resistance to 5-FU, mitomycin, and cisplatin in hepatocellular carcinoma cell lines with different metastatic potential, including HCCLM3, MHCC97H, MHCC97L, and Hep3B cells [28], while Haraguchi et al. evaluated the same tendency of SP cells in Huh7 response to Doxorubicin, 5-FU, and Gemcitabine [18]. Previous studies have shown the existence of even radio-resistant stem like cells in esophageal cancer. Che et al. developed a radio-resistant subtype—Eca109R50Gy cells—which show some properties of CSCs [42], while Zhang et al. found an enrichment of SP cells in radio-resistant esophageal cancer cell lines after fractionated irradiation with high expression of stem cell markers, such as β-catenin, Oct3/4, and β1-integrin [43].
To support the hypothesis that the existence of SP cells contribute to chemotherapy resistance, we developed 5-FU and cisplatin resistant variants of different cell lines. The corresponding resistant cells of PT1590 and LN1590 displayed a significantly higher IC50 value for 5-FU and cisplatin cytotoxicity (Table 1) and substantially elevated resistant markers, such as thymidylate synthase and ERCC1 (Supplementary Fig. S2a, b). By stepwise elevation of the respective 5-FU and cisplatin concentration a SP subpopulation was generated in SP negative PT1590 and LN1590 cell lines (Fig. 6a–c). In OE19 resistant variants, SP fractions increased with the duration of chemotherapy (Fig. 7g and Supplementary Fig. S4g). For those SP negative/low cell lines, the de novo appearance of SP after chemotherapy might be due to the accumulation of mutations or activation of oncogenes, such as MYC and other stem cell signaling pathways [44]. SP and NSP cells are probably still a mixture of different subpopulations, our differentiation assay showed that NSP cells rarely but still can contain small amounts of SP cells. We speculate that under growth conditions of the differentiation assay with low FCS concentration the increasing survival pressure may lead to reactivation of stem-like pathways and ABCG2 expression in NSP cells resulting in a measurable small amount of SP cells by FACS. OE19-SP cells showed a higher expression of ABCG2 and CD44 than that seen in OE19-NSP cells (Fig. 5). The importance of ABCG2 for chemotherapy resistance was first demonstrated in stem cells derived from ABCG2-deficient mice, which were more sensitive to the ABCG2 substrate mitoxantrone [45].
Only few convincing data has been reported supporting the existence of common CSC surface markers on esophageal cancer cells. CD44 is a transmembrane glycoprotein widely used as a surface marker for CSCs [46]. CD44+/CD24− cells were about 10–60-fold more resistant to chemotherapy in relation to corresponding non-CD44+/CD24− cells in breast cancer [47]. The expression of CD44 has been found to correlate with a poor prognosis in esophageal SCC according to Chai et al. [48] and Takayama et al. [49]. Other stem cell associated tumor cell subpopulations also contribute to chemotherapy resistance, for example, CD133+ cells are enriched both after cisplatin exposure in lung cancer [50] and after gemcitabine therapy in pancreatic cancer [51]. CD133+ cells in glioblastoma, lung cancer, and hematopoietic malignancies have been linked to poor progonosis [52]. However, increasing evidence suggests that CD133 may not be suitable as ideal CSC marker in HCC and esophageal cancer cell lines or tissues [24]. Furthermore, signal transduction pathways, such as PI3K/Akt/mTOR and Wnt have been generally associated to CSC survival [53,54]. Interestingly, these pathways are often aberrantly regulated in esophageal cancer [55,56].
Self-renewal and the potential of differentiation are key properties of CSCs and manifest the fundament of tumorigenicity. The SP cells described here were able to reproduce both SP and NSP cells with an enrichment of the SP fraction after resorting compared to the whole cell population (Fig. 2). SP cells displayed tumorigenic capacity both in vitro and in vivo in colony formation assay, soft agar assays (Fig. 2), and in a subcutaneous in vivo model of esophageal cancer (Fig. 3). These results are in accordance to previous discoveries found in hepatocellular and brain cancer [16,57].
The metastatic potential of SP cells has been so far controversially discussed. Chua et al. described SP cells of the U87MG glioma cell line significantly more invasive than corresponding NSP cells [58], whereas others found that SP cells of glioma or human hepatocellular cancer cell lines exhibited a slower migration rate in monolayers, as well as boyden chamber migration assays [59]. Interestingly, emerging evidence suggests an association between chemotherapy resistance and EMT in cancer [60]. EMT and the reciprocal mesenchymal to epithelial transition are linked to tumor metastasis, stem cell differentiation, and development. Brabletz et al. identified at the invasive front of tumors malignant cells with stem cell like characteristics that acquired the ability of metastasis through EMT [61]. During EMT, epithelial cells lose their apical and basolateral polarities, break their intercellular tight junctions, and degrade basement membrane extracellar matrix components to become migratory mensenchymal cells. In human esophageal cancer, changes in the expression of EMT key regulators, such as Snail, Slug, and Twist play an important role in tumorigenesis and progression, and are significantly higher expressed in advanced stages and metastatic lesions [62 –64]. Tomizawa et al. presented some EMT and CSC markers in specimens of early esophageal AC in Barrett's esophagus at the invading edges of the tumor, which abundantly express Snail, Slug, and Twist, suggesting that early stage cancers predominantly constitute cells with metastatic potential [65]. Primarily, we observed a mesenchymal like phenotype together with vimentin overexpression and an increasing SP cell fraction in resistant OE19/5-FUres cells after long term 5-FU exposure in vitro (Fig. 7). To evaluate whether SP cell related chemotherapy resistance leads to induction of EMT processes in esophageal cancer, we analyzed the expression of EMT associated genes in SP cells from both resistant OE19/5-FUres and sensitive OE19 cells via a high through-put PCR array. Zhang et al. have shown the relevant role of Slug expression in apoptosis, invasion, and metastasis of human esophageal AC cells and its relationship to E-cadherin and BCL-2 expression in vitro and in vivo [63]. Our analysis presented Slug (snail2) significantly upregulated in SP cells of OE19/5-FUres cells indicating their relation to dedifferentiation and 5-FU-induced resistance. EMT activator ZEB1 is known as crucial factor for tumor progression towards metastasis [66]. Ohashi et al. found that ZEB1 and ZEB2 are associated to TGF-β-mediated EMT in cells with EGFR overexpression during esophageal carcinogenesis [67]. Recently, the ZEB/miR-200 feedback loop has been identified as the molecular motor for cellular plasticity in developmental processes and for cancer progression toward metastasis [68,69]. In resistant OE19/5-FUres cells, the SP subpopulation showed 8.5-fold upregulation of ZEB1 as compared to the SP subpopulation of sensitive OE19 cells. Interestingly, IL1RN, the interleukin 1 receptor antagonist, a negative regulator of heterotypic cell-cell adhesion was fourfold downregulated in the SP subpopulation of OE19/5-FUres cells. In addition, genes regulating the Wnt pathway, such as GSK3B and WNT11 were significantly higher expressed in the SP subpopulation of OE19/5-FUres as compared to SP cells of sensitive OE19. Activated β-catenin has been already demonstrated in the SP as compared to the corresponding NSP fraction of sensitive OE19 cells (Fig. 5b, c). These findings suggest that the application of chemotherapy may lead to propagation of stem cell-like subpopulations of esophageal cancer cells that are not only therapy resistant but also potentially metastatic due to activated EMT related pathways. Similar data was found in OE19/CDDPres cells supporting an association between chemotherapy resistance and EMT-like processes in esophageal cancer cell lines.
Taken together, our data provides evidence that (1) SP cells represent a stem cell like subpopulation in human esophageal cancer in vivo and in vitro, (2) SP cell biology may contribute to intrinsic and acquired chemotherapy resistance to 5-FU and cisplatin, and (3) SP cells mediated chemotherapy resistance is associated with changes in EMT regulation in esophageal cancer.
The results presented suggest that long term application of chemotherapy may create acquired resistance in originally chemotherapy sensitive esophageal cancers by enrichment of SP cells and thereby promote disease progression towards distant metastasis. Targeting SP cell mediated EMT activation may not only represent an efficient additional cancer therapy to overcome traditional chemotherapy resistance but also prevent disease progression towards distant metastases by eradicating the SP subpopulation. Our results indicate in particular the application of wnt inhibitors to target resistant SPs in esophageal cancer.
Footnotes
Acknowledgments
The authors thank Dr. Andreas Herbst, Dr. Christian Korn, Dr. Celine Schelcher, and Dr. Serene Lee for their expertise in this project and Anneli Tischmacher for her technical assistance. This research was supported by the Deutsche Krebshilfe Nr: 108168, the DFG BR 1614/7-1 and the DKTK/DKFZ 2013 (“Stem cells in Oncology”) to C.J.B.
Author Disclosure Statement
The authors indicate no conflict of interest.
References
Supplementary Material
Please find the following supplemental material available below.
For Open Access articles published under a Creative Commons License, all supplemental material carries the same license as the article it is associated with.
For non-Open Access articles published, all supplemental material carries a non-exclusive license, and permission requests for re-use of supplemental material or any part of supplemental material shall be sent directly to the copyright owner as specified in the copyright notice associated with the article.