
Abstract
The value of human disease models, which are based on induced pluripotent stem cells (iPSCs), depends on the capacity to generate specifically those cell types affected by pathology. We describe a new iPSC-based model of Friedreich ataxia (FRDA), an autosomal recessive neurodegenerative disorder with an intronic GAA repeat expansion in the frataxin gene. As the peripheral sensory neurons are particularly susceptible to neurodegeneration in FRDA, we applied a development-based differentiation protocol to generate specifically these cells. FRDA and control iPSC lines were efficiently differentiated toward neural crest progenitors and peripheral sensory neurons. The progress of the cell lines through discrete steps of in vitro differentiation was closely monitored by expression levels of key markers for peripheral neural development. Since it had been suggested that FRDA pathology might start early during ontogenesis, we investigated frataxin expression in our development-related model. A pronounced frataxin deficit was found in FRDA iPSCs and neural crest cells compared to controls. Whereas we identified an upregulation of frataxin expression during sensory specification for control cells, this increase was not observed for FRDA peripheral sensory neurons. This early failure, aggravating frataxin deficiency in a specifically vulnerable human cell population, indicates a developmental component in FRDA.
Introduction
F
Frataxin deficiency causes altered cellular iron metabolism, mitochondrial dysfunction, and increased sensitivity to oxidative stress [4]. However, the relative contributions of these mechanisms to the neurodegeneration of the most vulnerable cell populations, including dorsal root ganglia (DRG) proprioceptive neurons and neurons of the cerebellar deep nuclei, remain elusive [5 –7]. Neurodegenerative processes in these cells lead to sensory ataxia, dysarthria, and loss of tendon reflexes [8].
Previously, a development-related component in FRDA had been discussed, supported by the prenatal death of mice with a frataxin loss-of-function [9,10]. Furthermore, based on neuropathological findings, a trans-synaptic atrophy mechanism due to missing trophic input from the DRG was proposed. It is suggested that this process starts during intrauterine development [11]. However, a thorough investigation aiming at the developmental hypothesis of FRDA has not yet been reported.
Important new insights in FRDA pathogenesis as well as the development of new therapeutic approaches can be expected from disease models based on the induced pluripotent stem cell (iPSC) technology [12]. The generation of iPSC lines from FRDA patients has already been reported [13 –15]. These lines expressed reduced levels of frataxin mRNA and/or protein and had the potential to differentiate in various cell types, including neurons and cardiomyocytes [14,15].
We generated iPSC lines from two FRDA patients and validated their pluripotency as well as their reduced frataxin levels. The main goal of the study was to investigate for the first time, the potential of FRDA-iPSCs to undergo differentiation specifically to peripheral sensory neurons, recognized as the most affected population in FRDA [5,6].
Peripheral sensory neurons are derivatives of the neural crest, which is a transient multipotent cell population migrating throughout the body after closure of the neural tube and forming a variety of different tissues, including the peripheral nervous system [16 –18]. To date, several studies have reported the generation of human neural crest cells and peripheral sensory neurons from pluripotent stem cells (PSC) [19 –25]. Recent protocols showed improved efficiency of neural crest cell differentiation [26,27]. We followed a development-related approach for sensory neuronal differentiation [24,28], and provide evidence for the bonafide neural crest and peripheral sensory neuronal identity of cells derived from human iPSCs.
Since PSC differentiation in vitro can serve as an ontogenetic model, we aimed to investigate expression dynamics of frataxin in parallel with specific markers for human neural crest development. Quantitative determination of frataxin expression levels revealed an upregulation in early peripheral sensory neurons, which was not sustained by the FRDA iPSC-derived neurons. This unexpected early difference between the patient and control neurons provides evidence for a development-related component FRDA.
Materials and Methods
Generation of the iPSC lines from human fibroblasts
This research was approved by the local Research Ethics Committee of the Innsbruck Medical University (UN3152-No.261/2.1 and UN4240-No.297/4.7), and written informed consent was obtained from patients.
The timeline and steps of the protocol for the generation of iPSCs are outlined in the Supplementary Figure S1 (Supplementary Data are available online at
iPSC, induced pluripotent stem cell; FRDA, Friedreich ataxia.
The derived iPSCs, as well as the human embryonic stem cells (hESCs) (lines HS207 and HS401, kindly provided by Prof. Outi Hovatta, Karolinska Institute, Sweden) were cultured on mitotically inactivated mouse embryonic fibroblasts in the PSC medium, consisting of the knockout DMEM supplemented with 20% knockout serum replacement, 0.1 mM 2-mercaptoethanol, 1% nonessential amino acids, 2 mM glutamax, 25 U/mL penicillin, 25 μg/mL streptomycin (all from Invitrogen), and 10 ng/mL human recombinant basic fibroblast growth factor (bFGF; Peprotech), at 37°C and 5% CO2 with the medium changed every day [30]. For the spontaneous differentiation experiments, the iPSCs were cultured for 15 days in the PSC medium without bFGF.
Karyotyping for all selected iPSC lines was done following a standard protocol [31].
Neural crest induction and differentiation toward peripheral neurons
The differentiation of iPSCs toward neural crest cells was performed following a recently published protocol [26,27], to which we introduced specific modifications.
Neural crest induction
For neural crest induction, iPSCs were dissociated using Accutase (Sigma-Aldrich) and plated on Geltrex (Invitrogen)-coated plates at a density of 1×10⁵ cells/cm2 in the PSC medium without bFGF, supplemented with 5 μM CHIR99021 (Axon Medchem), 20 μM SB431542, 5 μM dorsomorphin, and 10 μM Y-27632 (all from Sigma-Aldrich). The N2 medium (DMEM/F12 supplemented with N2, 1% NEAA, 2 mM glutamax, 25 U/mL penicillin, and 25 μg/mL streptomycin; all from Invitrogen), with the 3 μM CHIR99021 and 10 μM SB431542 supplements, was added in increasing 25% increments every other day starting on day 4 (100% N2 medium on day 10 and continued until day 14, with the medium changed every day).
Neural crest specification
Neural crest specification was initiated by culturing the neural crest-like cells further in the N2 medium supplemented only with CHIR99021 (3 μM) and Y-27632 (10 μM), for 7 days (medium changed every day).
Neuronal differentiation
For peripheral neuronal differentiation, neural crest-like cells were plated on Geltrex-coated plates and cultured in the N2 medium supplemented with the brain-derived neurotrophic factor (10 ng/mL; Peprotech), neurotrophin-3 (10 ng/mL; Peprotech), nerve growth factor (10 ng/mL; Peprotech), ascorbic acid (200 μM; Sigma-Aldrich), and dbcAMP (0.5 mM; Sigma-Aldrich) for 7–14 days, with the medium partially (2/3) changed every other day.
GAA expansion analysis
Genomic DNA was extracted from fibroblasts and iPSCs using the Qiagen DNeasy®Blood&Tissue kit as per the manufacturer's instructions. The concentration and purity of the genomic DNA were assessed using the Nanodrop1000 spectrophotometer (Thermo Fisher Scientific). The size of the GAA expansion in the intron 1 of the FXN gene was determined by polymerase chain reaction (PCR), using 100 ng genomic DNA, the forward primer 5′-AGAAGTGGTAGAGGGTGTTTCACGAGGA-3′ and the reverse primer 5′-AACACAACTCTGCTGACAACCCATGCTG-3′ in 50 μL reactions. Ten microliters of the PCR product was electrophoresed on a 1% agarose (w/v) gel alongside a standard DNA marker (1 Kb Plus; Invitrogen).
Quantitative real-time PCR
mRNA was isolated using Dynabeads® Oligo (dT)25 (Invitrogen) following the manufacturer's protocol. For the cDNA synthesis, we used the High-Capacity cDNA Reverse Transcription Kit and protocol (Applied Biosystems). The levels of cDNA were assessed by quantitative real-time PCR (qRT-PCR) using the TaqMan® Master Mix and Gene Expression Assays (both Applied Biosystems; see Supplementary Table S1), following the manufacturer's protocol. The results from three to six experiments for every condition, each experiment with three technical replicates, were normalized to glyceraldehyde-3-phosphate dehydrogenase (GAPDH) and expressed as ΔC t values (low ΔC t levels indicate high expression). Relative expression ratios were calculated by the ΔΔC t method [32]. The silencing of the viral transgenes, used for reprogramming, was determined by qRT-PCR using the Ampliflour® Viral OCT-4 Primer Set kit (Millipore) according to the manufacturer's instructions.
Immunocytochemistry
Immunocytochemical assays were performed using a standard method, as described previously [30]. Antibodies, suppliers, and dilutions are presented in the Supplementary Table S2. Pictures were taken with an ApoTome Imaging System based on Axio Observer Z1 (Zeiss) using AxioVision software (Zeiss). For relative quantification of positive cells and frataxin staining intensity, at least three coverslips in each experimental group with five fields per coverslip were analyzed using the Metamorph software (Molecular Devices).
Western blot
Whole cell proteins were extracted with the Roti®-Load 1 buffer (Carl Roth), according to the manufacturer's protocol. Briefly, ∼25 μg of proteins from each sample were electrophoresed in 14% SDS-PAGE and transferred onto PVDF membranes. Primary antibodies (1:500, anti-FXN; Abcam and 1:10,000, anti-GAPDH; Millipore) in Tris-buffered saline with 5% nonfat dry milk and 0.1% Tween 20 were incubated overnight at 4°C. HRP-conjugated secondary antibodies (goat anti-mouse 1:10.000; Santa Cruz) were incubated for 1 h at room temperature. Immunocomplexes were revealed by SuperSignal West Pico (37071; Pierce), according to the manufacturer's instructions.
Statistics
Data are depicted as mean±standard error of the mean. Histograms were generated using Prism Software (GraphPad Software, Inc.). For statistical analysis, the Prism Software was used. For comparisons between groups, the Student's t-test or analysis of variance (ANOVA) followed by Bonferoni post hoc analysis were applied. A P-value of less than 0.05 was considered significant and presented as *P<0.05, **P<0.01, and ***P<0.001, respectively.
Results and Discussion
IPSC lines derived from FRDA fibroblasts maintain the GAA mutation and frataxin deficiency
IPSC lines were generated from dermal fibroblasts derived from two patients with FRDA and two healthy individuals (Table 1). Fibroblasts were transduced with a polycistronic lentivirus expressing OCT4, SOX2, c-MYC, and KLF4. The resulting colonies, which maintained a stable morphology after six passages, were analyzed for expression of OCT4, SOX2, NANOG, LIN28, CDH1, and OTX2. Three clonal cell lines for each patient/control were selected, which expressed high levels of pluripotency markers and low levels of differentiation markers (Table 1, Supplementary Fig. S2 and Supplementary Table S3). These lines carried silenced viral transgenes and maintained a normal karyotype (Table 1). In spontaneous differentiation experiments, we detected the expression of markers of endoderm, mesoderm, and ectoderm, including neuronal markers (Supplementary Fig. S3). Therefore, the iPSC lines from the successfully reprogrammed FRDA fibroblast were remarkably similar to hESCs and control iPSCs regarding their pluripotency.
We next determined whether the expanded GAA repeats detected in the fibroblasts from FRDA patients were also present in the FRDA-iPSC lines. Genotype analysis showed that all selected FRDA-iPSC lines retained the pathological GAA repeat expansions (Fig. 1A). By qRT-PCR analysis, we found that fibroblasts and iPSCs expressed ∼25% FXN transcripts in patients compared to controls (Fig. 1B). This strong difference was confirmed at the protein level by immunocytochemistry and western blot analysis (Fig. 1C, D). These findings are consistent with previous reports of reduced frataxin levels in various cell types derived from FRDA patients [33] and in FRDA-iPSCs [13 –15].

GAA triplet repeats and frataxin expression in Friedreich ataxia (FRDA) fibroblasts and induced pluripotent stem cells (iPSCs).
FRDA-iPSCs differentiate into neural crest and peripheral sensory neuron-like cells
To differentiate FRDA-iPSCs into cells with a peripheral sensory phenotype, iPSC lines were subjected to a specific development-based cell culture protocol that has proven to be useful for differentiation of human PSCs into neural crest cells and peripheral sensory neurons [21,24,26]. This protocol is based on reiterative roles of canonical Wnt/β-catenin signaling during neural crest development, which controls neural crest induction and sensory neuronal specification in a sequential fashion [26,28,34,35].
In an attempt to align our protocol with stages of in vivo development [36], we defined three differentiation steps: neural crest induction (stage 1), neural crest specification (stage 2), and neuronal differentiation (stage 3). In stage 1, the cells displayed the morphological characteristics of premigratory neural crest stem cell colonies and migratory neural crest progenitors. In stage 2, migrating cells formed an adherent layer of neural crest progenitors and early neurons, whereas many cells extended neurites and formed neuronal-like networks in stage 3 (Fig. 2).

Peripheral neural differentiation of human iPSCs.
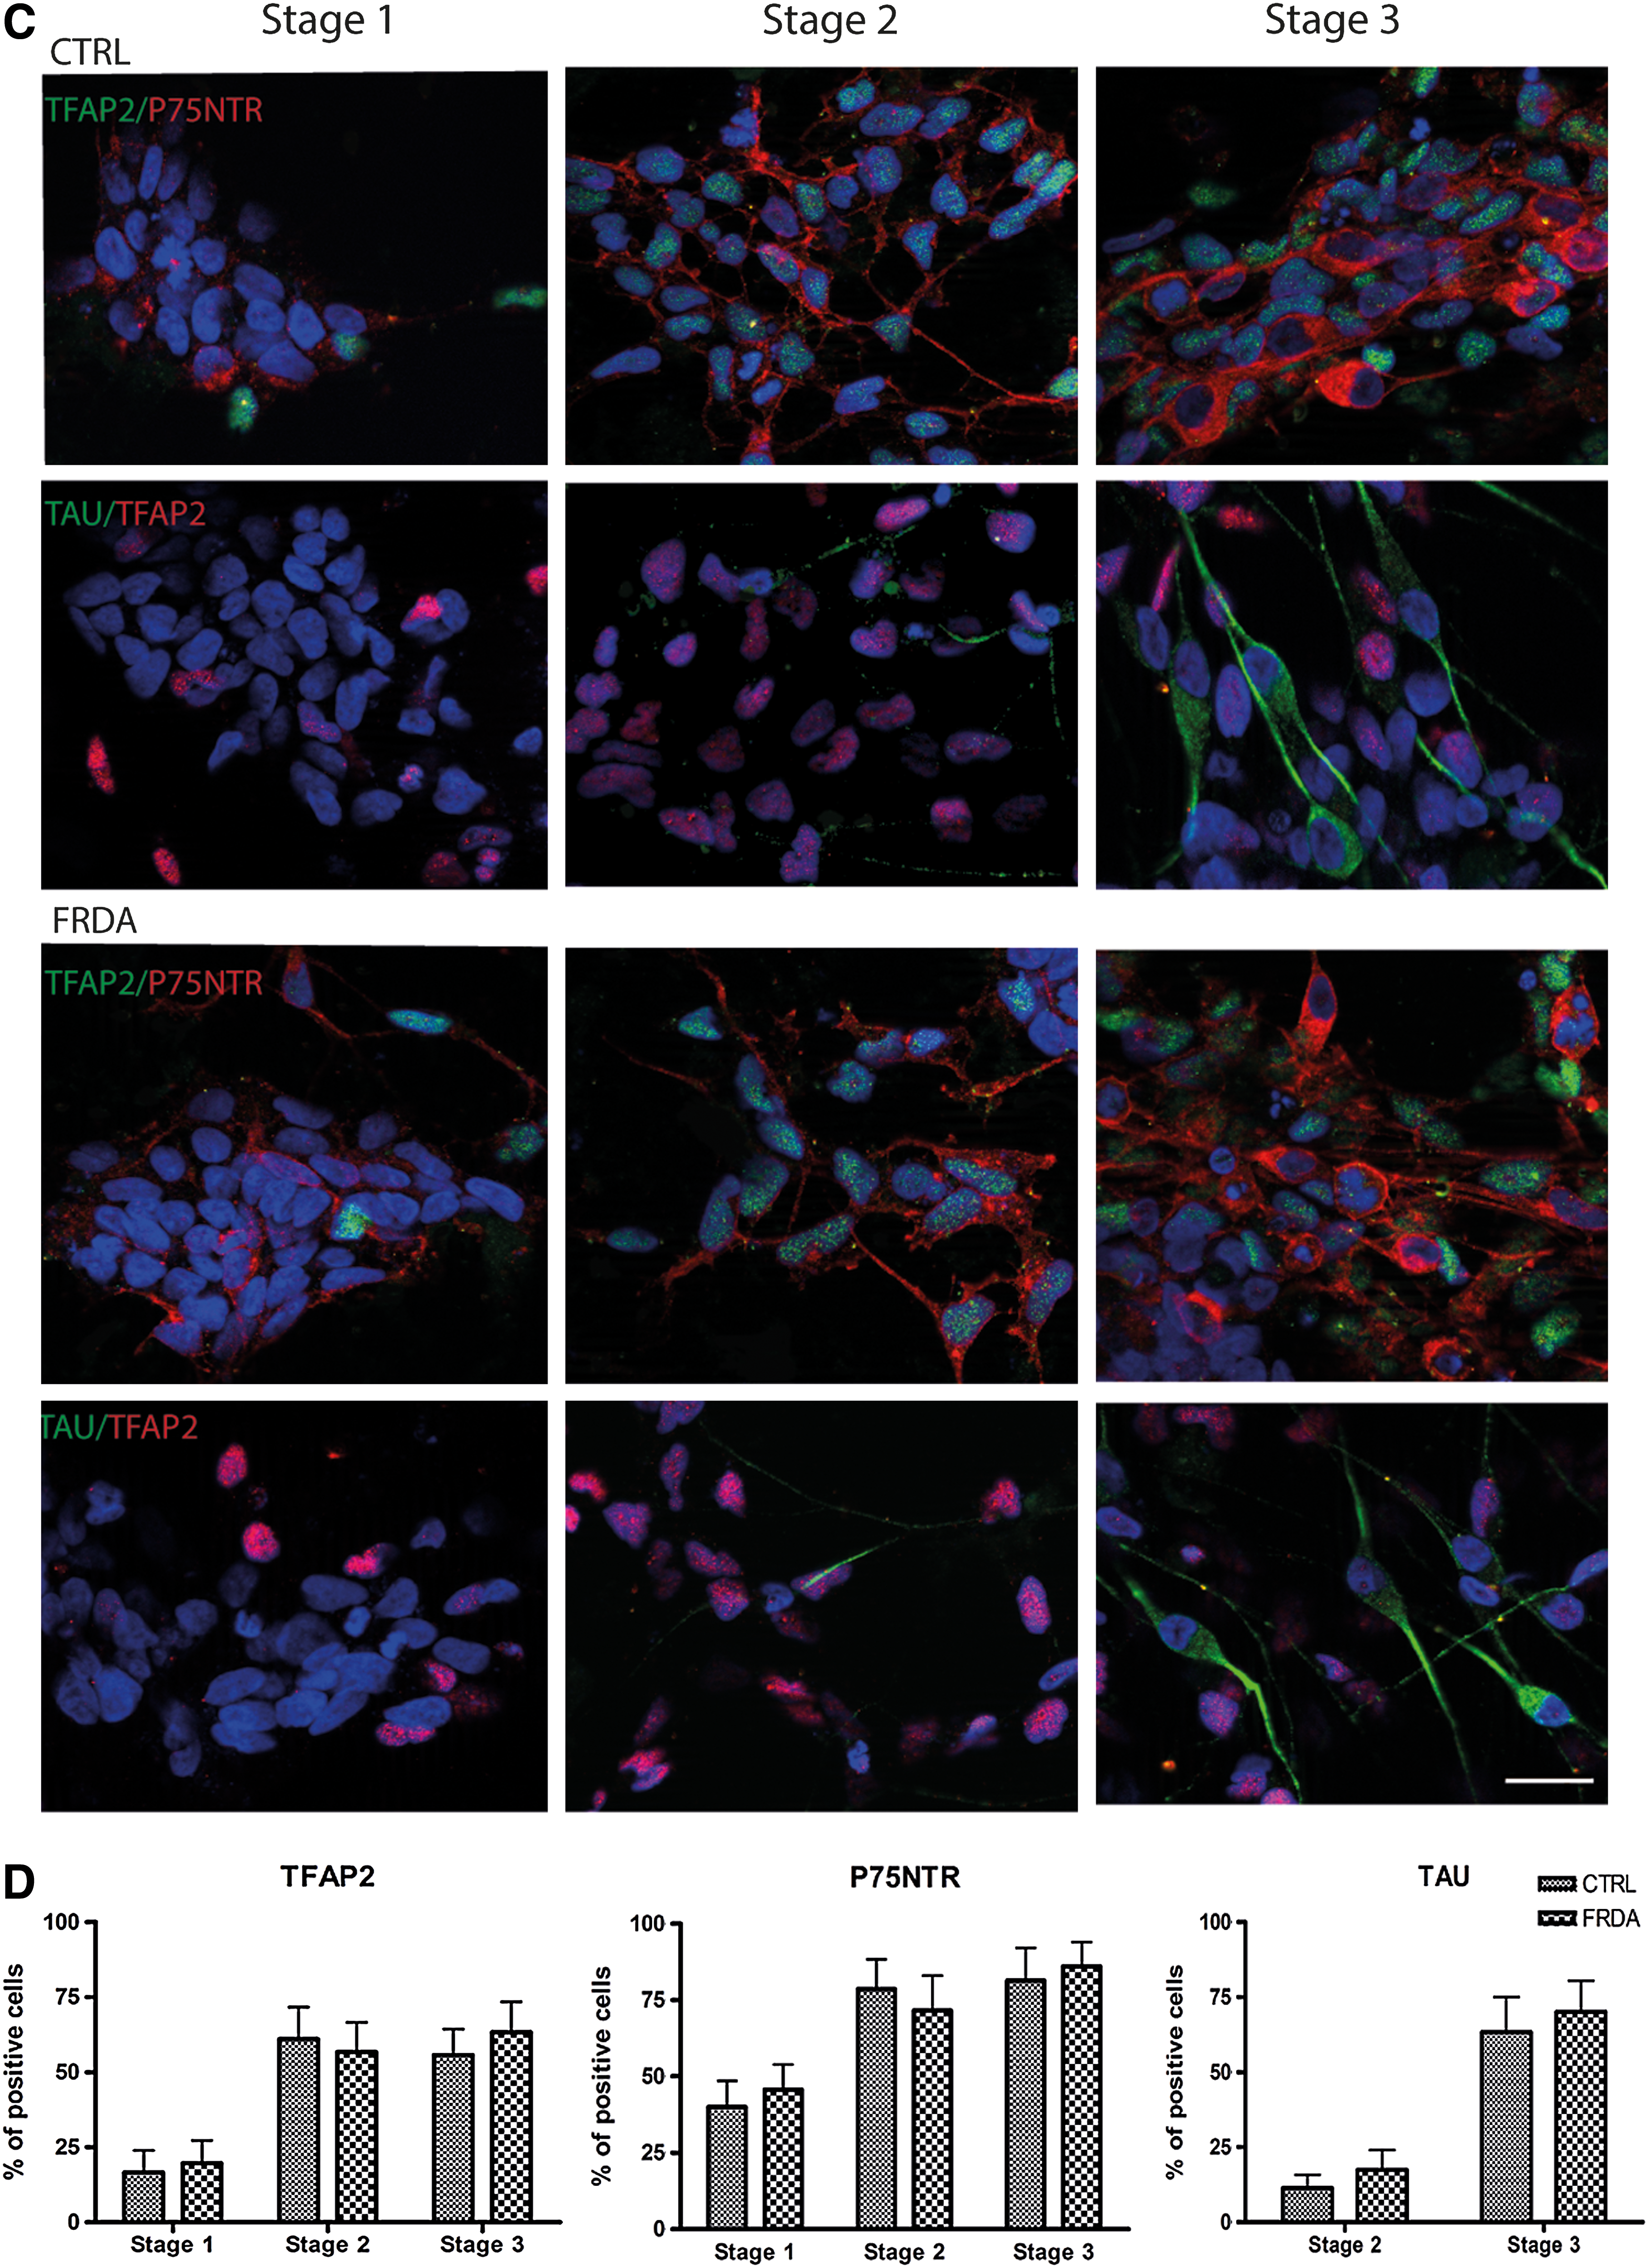
On the basis of a recent documentation of in vivo neural crest development in human embryos, we were able to phenotypically compare the iPSC derivatives with human neural crest development. A battery of markers was used for each stage of neural crest differentiation, taking into account that no single marker is exclusively expressed in neural crest or sensory neuronal precursors. TFAP2, P75NTR, SOX9, and SOX10 were found to be expressed in the neural crest, as well as in the DRG and cranial ganglia [36]. We used this set of markers in combination with the pan-neuronal markers NCAM and TAU. TFAP2, P75NTR, SOX9, SOX10, and NCAM transcripts were expressed at all three stages in our cultures (Fig. 2B), whereas TAU started to be expressed in stage 2 and was strongly upregulated in stage 3. This dynamic expression, confirmed by immunostaining and cell counting for TFAP2, P75NTR and TAU (Fig. 2C, D), was consistent with previous reports on human neural crest differentiation with a similar protocol [20,21,26,37]. No significant differences were found in the expression of neural crest markers or pan-neuronal markers between control and FRDA cell lines (Fig. 2B–D).
The cells generated with our development-related protocol were essentially negative for a variety of markers of the developing CNS as well as for derivatives of the mesoderm or endoderm (Supplementary Table S4), therefore providing further evidence for efficient neural crest cell differentiation for all lines. As the glial marker GFAP was not expressed in our cultures at the end of stage 3 (Supplementary Table S4), we aligned stage 3 to an early embryonic neurogenic window in vivo, where gliogenesis had not yet started [17,37].
We next analyzed the differentiation of neural crest cells toward a sensory phenotype, as expected after their specification by CHIR99021 and provided neurotrophic support in our protocol. When in vivo the migrating neural crest cells start to coalesce into early sensory ganglia, the proneural transcription factors neurogenin-2 (NGN2) and neurogenin-1 (NGN1) become expressed [38]. Transcripts for both markers were increased over time in our cultures (Fig. 3A). Also consistent with early sensory neurogenesis [18,39,40], the expression levels of PRPH, BRN3A, ISL1, and HNK1 at stage 3 were found to be highly upregulated (Fig. 3A). The majority of neurons derived from all iPSC lines coexpressed BRN3A and PRPH, and in the same time BRN3A and TAU (Fig. 3B). Since the combination of PRPH and BRN3A staining has been shown to be specific for peripheral sensory neurons in vivo as well as in vitro [24,41], we conclude that after stage 3 of our protocol, the majority of neurons were specified as peripheral sensory neurons. Many of the PRPH-positive cells coexpressed ISL1, another recognized marker of sensory specification [40,42] (Fig. 3B). TAU-positive cells were negative for the proliferation marker KI67, confirming a postmitotic neuronal phenotype (Supplementary Fig. S4).

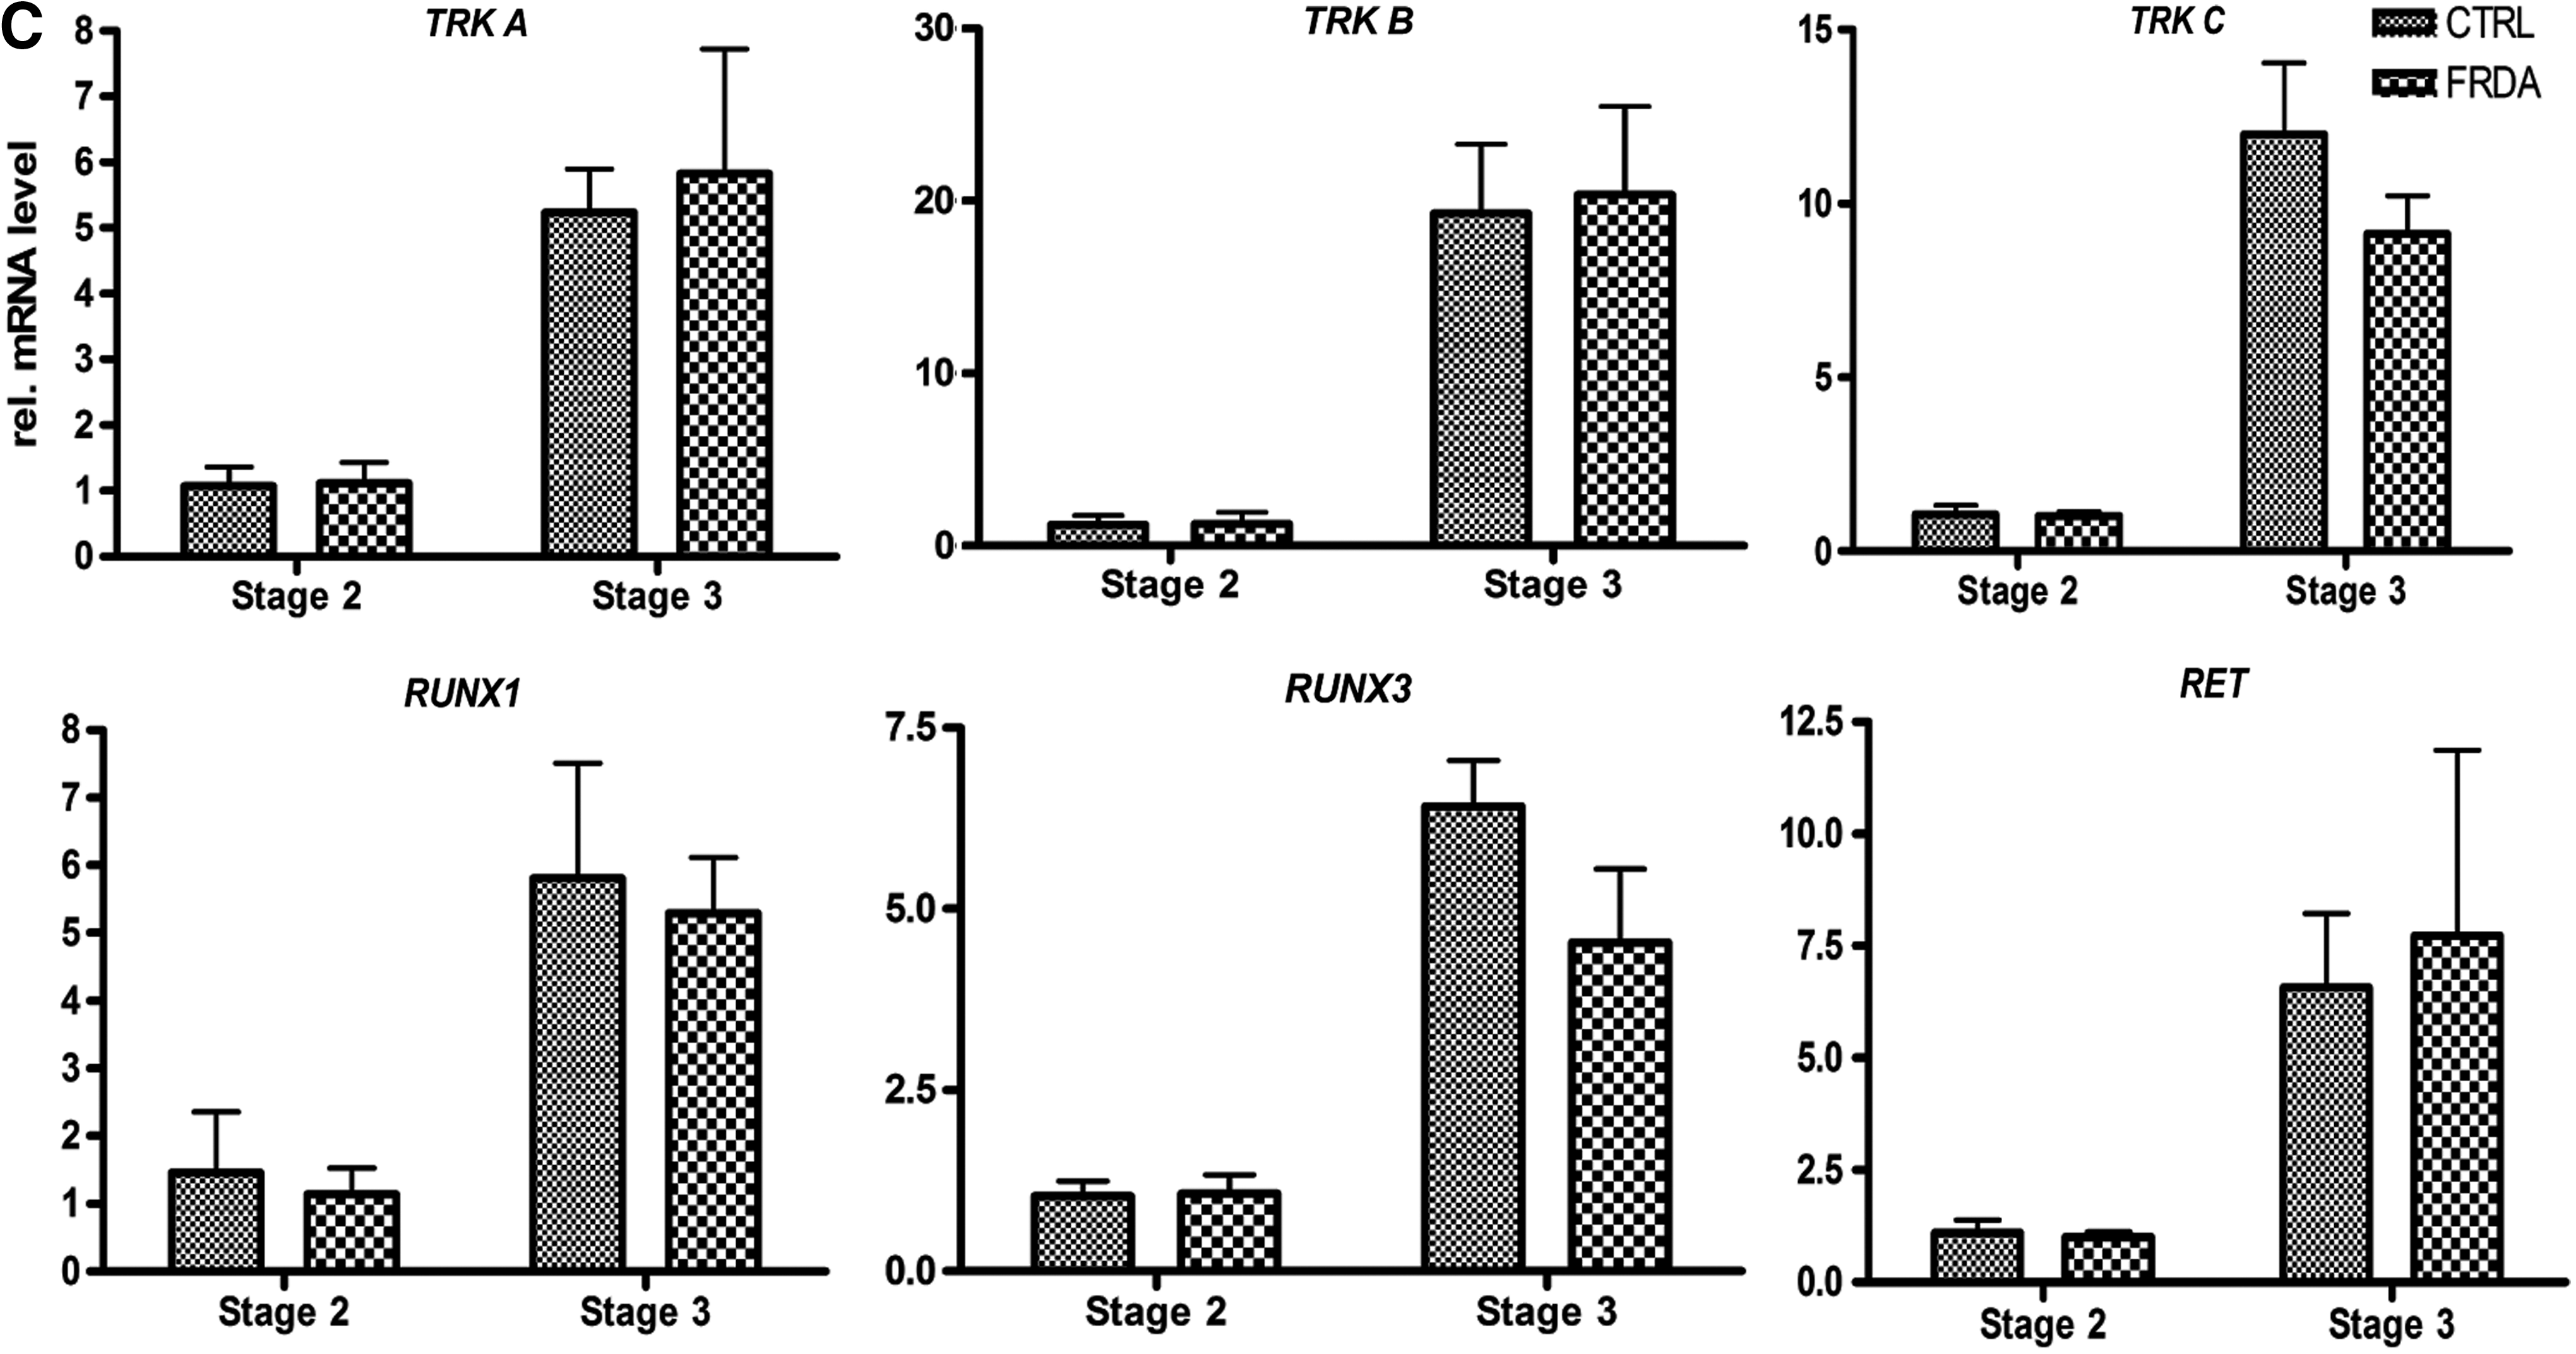
Sensory neuronal specification of human iPSCs.
The increasing expression of the glutamatergic markers VGLUT1 and VGLUT2 (Fig. 3A, Supplementary Fig. S4) as well as very low expression levels of markers for nonsensory neuronal phenotypes (such as MASH1, HB9, DBH, GAD, and VACHT, Supplementary Table S4), additionally support an efficient sensory specification. The increasing expression of the synaptic marker SYNAPTOPHYSIN (SYP) (Fig. 3A), indicates that the neurons were maturing to become functional.
Peripheral sensory neuron subtypes in vivo can be classified by their expression of the neurotrophic factor binding receptor tyrosine kinases, TRKA, TRKB, TRKC, and RET [38,43]. The initially NGN2-positive progenitors mainly give rise to mechanoreceptors and proprioceptors, expressing TRKB and TRKC, respectively, whereas NGN1-positive progenitors develop into nociceptive neurons expressing TRKA or RET [38,40]. Furthermore, peripheral sensory neurons specifically express RUNX3 as they become proprioceptors or RUNX1 as they become nociceptors [38,44]. In our cultures, newly differentiated neurons upregulated markers of proprioceptive (TRKC, RUNX3), nociceptive (TRKA, RUNX1), or mechanoceptive (TRKB) subtypes in stage 3 (Fig. 3C). Optimization of long-term differentiation will be necessary to sustain the maturation and subtype specification of our stage 3 peripheral sensory neurons.
No significant difference was found between FRDA and control-derived lines regarding the expression of peripheral sensory specification markers (Fig. 3).
Frataxin levels are increased in control, but not in FRDA peripheral sensory neurons
In agreement with other studies, we found that FRDA iPSCs show no obvious phenotype compared to control iPSCs, while retaining their expanded GAA repeats and expressing reduced levels of frataxin [15]. This indicates that a reduced frataxin expression does not influence stem cell proliferation or commitment to a neuronal fate. In view of the fact that neuronal dysfunctions develop over several years in FRDA patients, this might not be surprising. The key question that has to be tackled by research on FRDA iPSC models, or more generally all iPSC models of neurodegenerative disease, is why specific types of neurons are affected earlier or more strongly during the disease course.
Since peripheral sensory neurons are particularly affected in FRDA, we aimed to test the hypothesis that frataxin expression is selectively altered during differentiation of this population. Therefore, we initiated a quantitative study of frataxin expression in stage aligned cell populations during in vitro differentiation of iPSCs to peripheral sensory neurons.
When we analyzed the temporal dynamics of frataxin expression, we detected an increase of frataxin expression in stage 3 of our protocol in control cells, at the mRNA (Fig. 4F) and protein levels (Fig. 4G). However, a corresponding increase was not detected in the FRDA-derived sensory populations (Fig. 4F, G). Consequently, a significant difference was detected in FXN transcript levels between FRDA and control peripheral neurons after stage 3, compared to the deficit found at stages 1 and 2 (Fig. 4A). This discrepancy was confirmed also at the protein level (Fig. 4B–E).
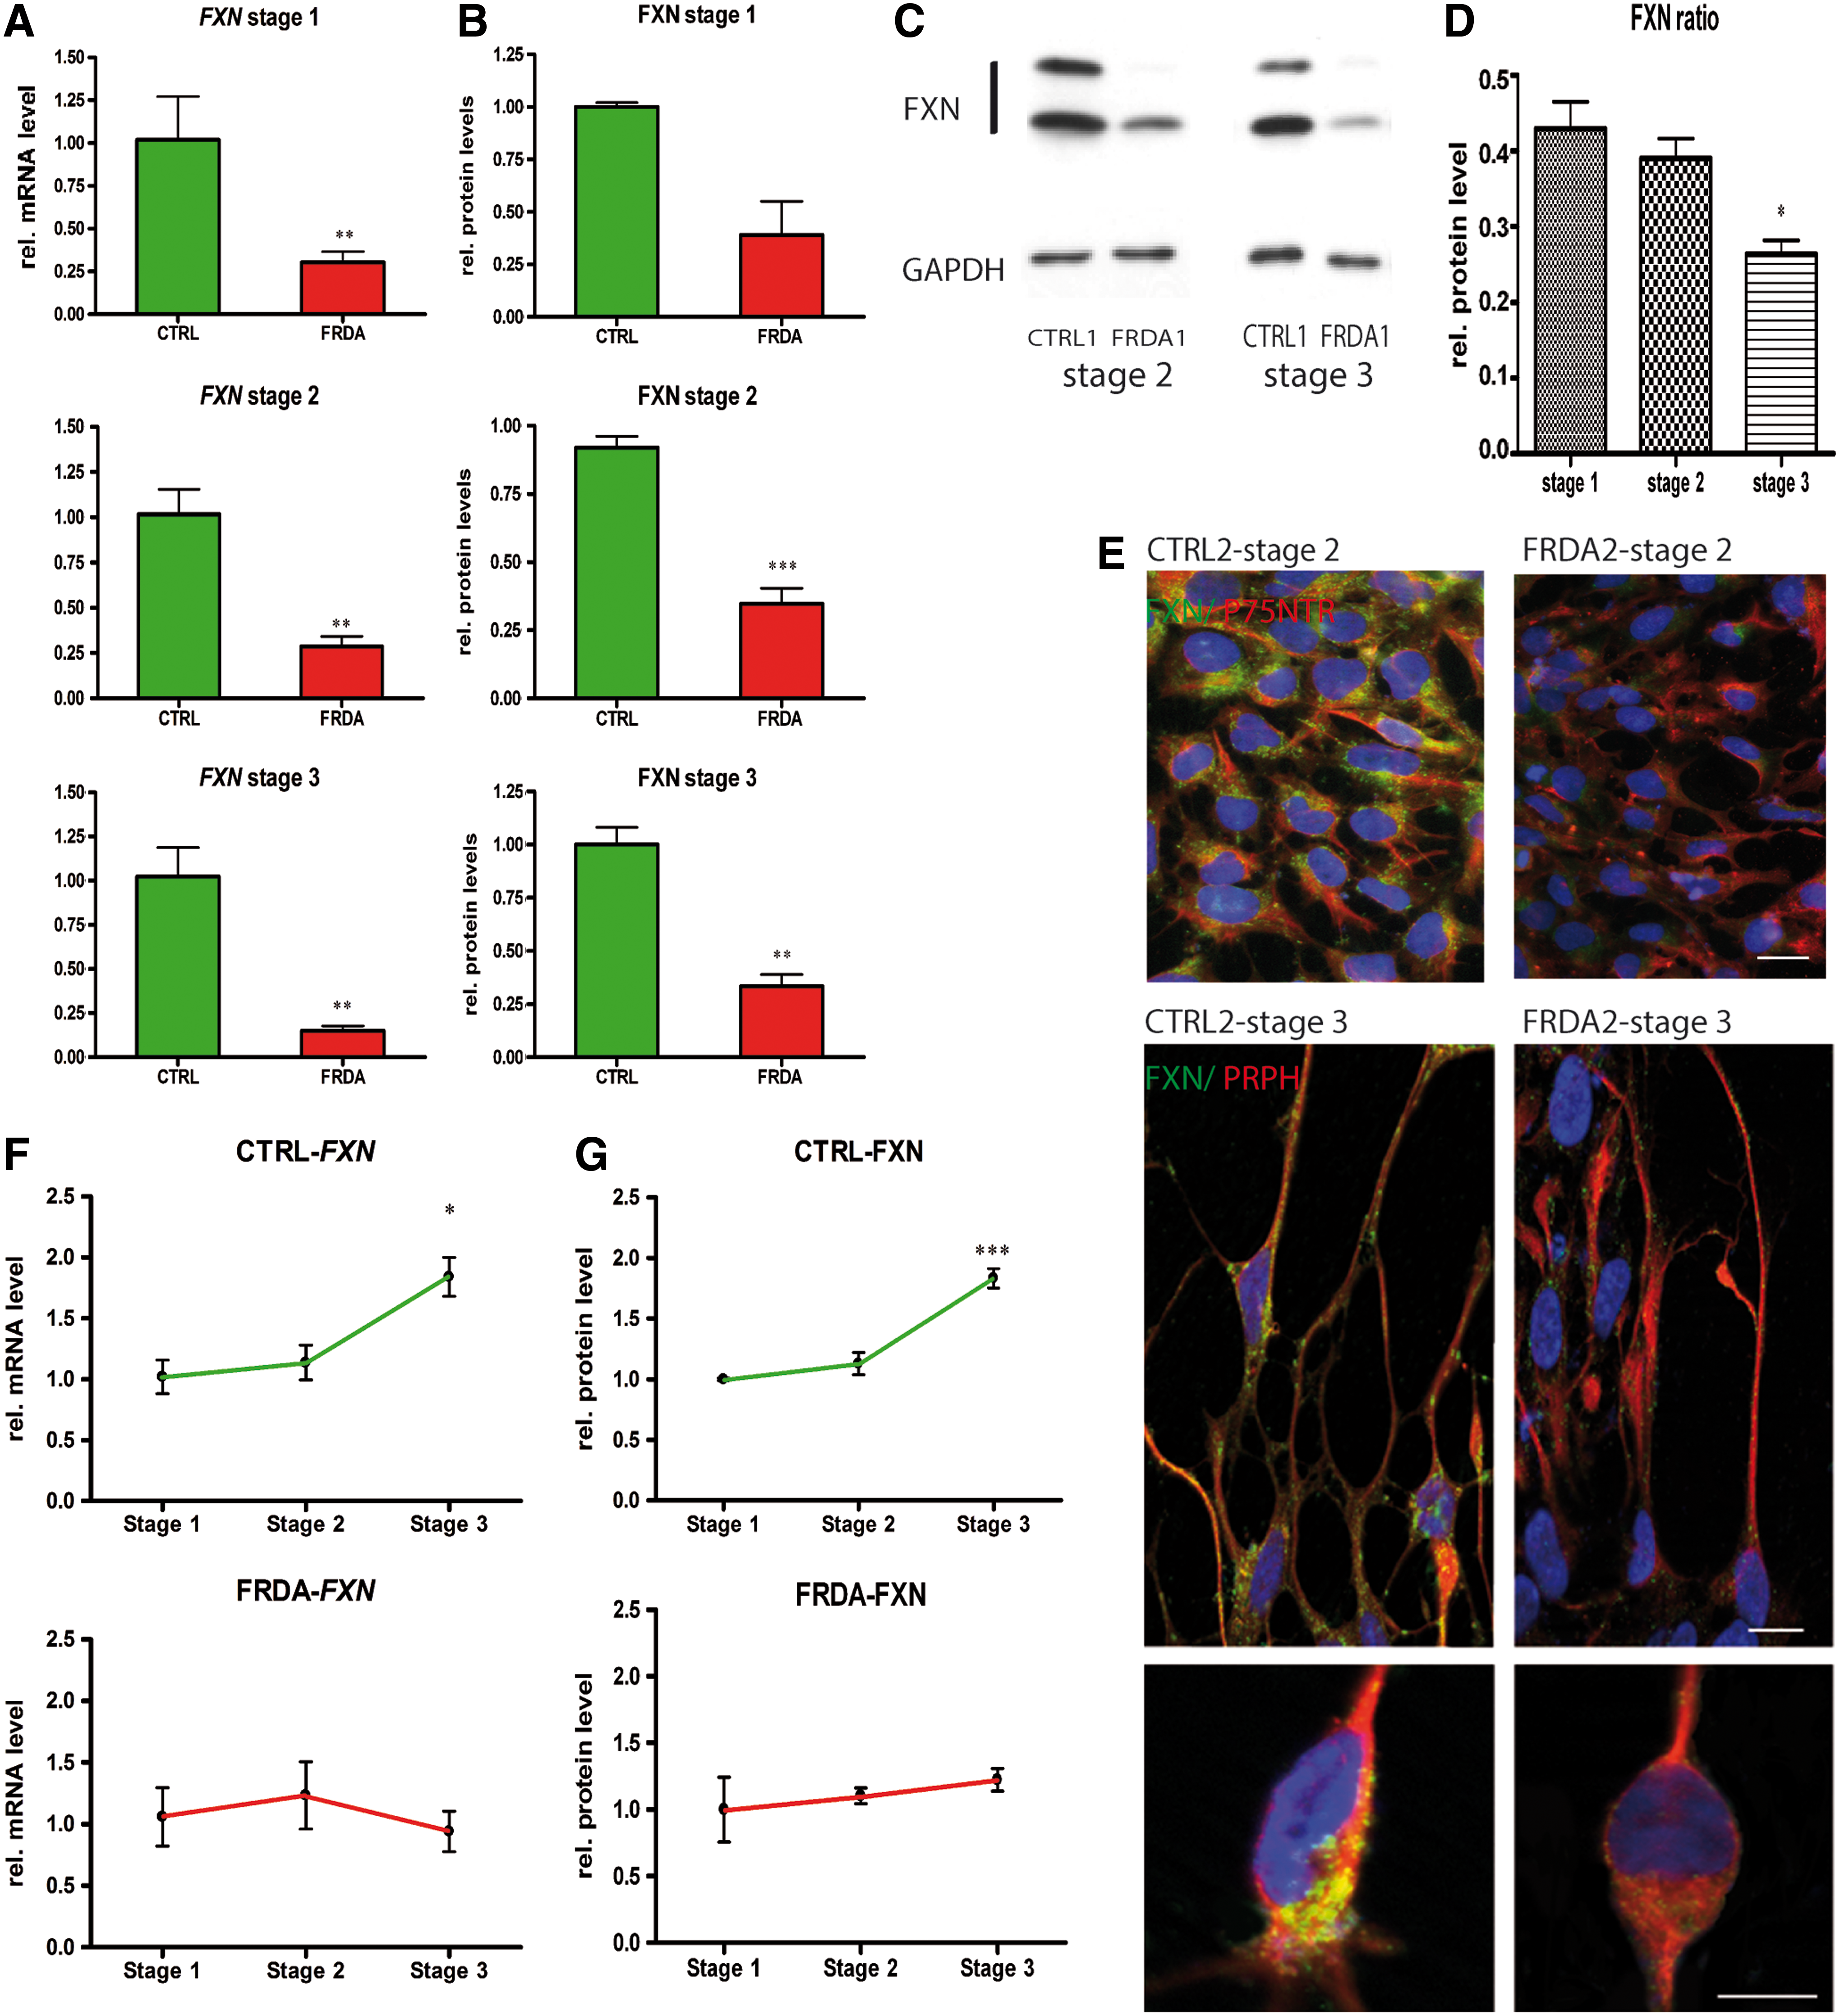
Differential frataxin expression during FRDA and control iPSC differentiation to peripheral sensory neurons.
These results provide evidence for an upregulation of frataxin expression in neuronal cultures in a condition which, with respect to their differentiation status, corresponds to the time point during in vivo development when peripheral sensory neurons become postmitotic, extend neurites to their target tissue, and activate their endogenous cell death program to become neurotrophic factor dependent [43]. Our finding might be indicative of a selective requirement for frataxin during these decisive phases of wiring of the sensory pathways.
A developmentally regulated tissue-specific expression of frataxin was previously shown in mouse embryos [45]; however, evidence is not available for human embryos. A peak of expression of frataxin was identified in the early DRG [45], which is in accordance with our newly identified profile in human iPSC-derived peripheral sensory neurons.
Strikingly, this stage-specific increase of frataxin does not occur in FRDA iPSC derivatives, which results in an even larger frataxin deficit of these cells compared to controls. Our data support the hypothesis that an early selective frataxin deficiency might have detrimental developmental effects that aggravate over time and consequently manifest in cell-specific degeneration. Whether such frataxin expression discrepancy can also be determined in other vulnerable cell types in FRDA, such as cerebellar neurons [7], Schwann cells [46], or cardiomyocytes [15,47], remains to be elucidated. As the role of the frataxin is still elusive, the investigation of the causative cell-type-specific vulnerability during development needs further investigation.
Conclusion
IPSCs carry high hopes for the generation of new groundbreaking human disease models. We describe in this study, a cellular model for FRDA in which human peripheral sensory neurons, resembling the most vulnerable cell population, are analyzed in terms of expression of frataxin, the hallmark protein affected in this pathology. This analysis was made possible by the generation and characterization of FRDA-derived iPSCs, neural crest, and peripheral sensory neurons with a differentiation protocol specifically tailored for this purpose.
Our study reports a previously unknown dynamic change of frataxin levels in an extensively monitored human cell culture model. This early and stage-specific difference in frataxin expression might indicate a developmental presymptomatic component in FRDA pathogenesis.
Footnotes
Acknowledgments
The authors acknowledge Prof. Outi Hovatta for kindly providing the hESCs, and for technical advice, Christian Unger (iPSC generation), Andrea Köhler (genotyping), Markus Forster (fibroblast derivation), Clemens Jaitner and Alexander Feurle (western blot and genotyping). Furthermore, the authors thank Carlo Bavassano for the support with cell culture issues and Veronika Schuchter for proofreading the manuscript. We acknowledge the Developmental Studies Hybridoma Bank for the monoclonal antibodies TFAP2 (3B5) and ISL1 (39.4D5). This work was supported by the Oesterreichische National bank (Nr.14282), Austrian Science Funds SPIN FWF W1206-B05 and FWF TRP233-B18 and Tiroler Zukunftsstiftung, Austria.
Author Disclosure Statement
No competing financial interests exist.
References
Supplementary Material
Please find the following supplemental material available below.
For Open Access articles published under a Creative Commons License, all supplemental material carries the same license as the article it is associated with.
For non-Open Access articles published, all supplemental material carries a non-exclusive license, and permission requests for re-use of supplemental material or any part of supplemental material shall be sent directly to the copyright owner as specified in the copyright notice associated with the article.