
Abstract
Potential therapeutic use of human adipose tissue-derived stem cells (hADSCs) requires the production of large cell numbers by in vitro expansion. However, long-term in vitro culture is associated with reduced stem cell characteristics and differentiation capability. We investigated the proliferation rate and expression of p16INK4a mRNA, surface stem cell markers, and stem cell transcription factors. The proliferation rate decreased significantly as passages increased, and the expression of p16INK4a mRNA significantly increased. FACS analysis of CD73, CD90, and CD105 expression showed no significant difference among examined passages; however, the mRNA expression levels of pluripotent markers, Oct4 and Nanog, were significantly decreased at higher passages. At passages 12 and 20, there was decreased differentiation capability into insulin-producing cells, evidenced by significantly decreased expression of insulin and related β cell markers. Adipogenic and osteogenic differentiation was also decreased at higher passages. We then analyzed the transcriptional expression profiles of 48 nuclear receptors at four different passages. We found that the expression of peroxisome proliferator-activated receptor γ (PPARγ) and thyroid hormone receptor TRβ was significantly decreased at higher passages. Treatment with PPARγ activators or overexpression of PPARγ in hADSCs at passage 20 could recover Oct4 expression levels and increase Oct4 promoter activity. PPARγ inactivation by GW9662 inhibited the troglitazone-induced Oct4 mRNA expression. Furthermore, PPARγ overexpression in hADSC at passage 20 improved the differentiation potential to insulin-producing cells. In conclusion, we demonstrated that hADSCs undergo characteristic changes and reduction of differentiation capability during expanded culture in vitro, and revealed the role of PPARγ as one potential factor in the regulation of Oct4 expression during in vitro aging of hADSCs.
Introduction
S
Mesenchymal stem cells (MSCs) are multipotent adult stem cells that can be isolated from various mesenchymal tissues in the adult body. MSCs were first described by Friedenstein et al. as bone marrow-derived clonogenic, plastic-adherent cells that are capable of differentiating into osteoblasts, adipocytes, and chondrocytes [1]. However, the ideal stem cells for use in functional tissue engineering need to be abundantly available, harvested with minimal morbidity, reliably differentiated down various pathways, and safe and effective for transplantation. Recently, some reports described the isolation of MSCs from human adipose tissue that seem to satisfy these criteria [2,3]. These human adipose tissue-derived stem cells (hADSCs) are capable of forming mesodermal tissues such as bone, cartilage, tendons, skeletal muscle, and fat when cultivated under lineage-specific conditions and can also form non-mesodermal tissues such as neurons and endocrine pancreatic cells [4,5].
As a first step for therapeutic application, it is necessary to obtain a sufficient cell number of MSCs by continuously subculturing in vitro for subsequent differentiation. Although MSCs are expandable, long-term in vitro culture of MSCs is associated with reduced proliferative potential due to cellular senescence, leading finally to growth arrest, a phenomenon known as replicative senescence, thus limiting the potential for MSC expansion [6,7]. As well, long-term expanded MSCs have altered differentiation potential toward mesenchymal cell lineages such as adipocytes, osteocytes, and chondrocytes [8]. In this study, we investigated the stem cell characteristics of hADSCs during extended culture in vitro and examined their capability to differentiate into insulin-producing cells. In addition, we analyzed the expression of 48 nuclear receptors (NRs) during culture to further understand which NRs might be involved in regulating the expression of the stem cell marker, octamer-binding transcription factor 4 (Oct4), during in vitro aging of hADSCs.
Materials and Methods
Materials
STEMPRO® hADCSs were purchased from Life Technologies (Cat.No.R7788-115) and cultured in MesenPRO™ medium. The following reagents were purchased from indicated suppliers: troglitazone from Enzo Life Science; activin A, basic fibroblast growth factor (bFGF), and hepatocyte growth factor (HGF) from Peprotech; B27 serum-free supplement and N2 supplement from Life Technologies; and 15-deoxy-Δ12,14-prostaglandin J2 (15PGJ2), valproic acid, exendin-4, nicotinamide, dexamethasone, 3-isobutyl-1-methylxantine, insulin, ascorbate-2 phosphate, β-glycerol phosphate, GW9662, and 3,3′,5-triiodo-L-thyronine (T3) from Sigma-Aldrich.
Cell culture
hADSCs were chosen for experiments at passages 4, 7, 12, and 20. The growth kinetics of each passage of hADSCs was measured by allowing cell proliferation for 1 week. Briefly, cells from each passage were seeded at 104 cells/cm2 in six-well plates and allowed to divide for 7 days. The medium was changed twice weekly. One culture from each group was harvested daily for determination of cell numbers. For chemical treatments, cells were seeded at 104 cells/cm2 in six-well plates and allowed to attach overnight. Then, the growth medium was replaced with fresh medium containing troglitazone or 15PGJ2. Samples were collected at various times during incubation.
RNA isolation and quantitative polymerase chain reaction
Total RNA was isolated from cells using Trizol reagent according to the manufacturer's protocol. RNA samples were treated with DNase in order to remove possible contaminating genomic DNA. Quantification of RNA was measured by an ND-1000 spectrophotometer (Thermo Fisher Scientific). cDNA was synthesized from 0.8 μg RNA using a PrimeScript™ 1st strand cDNA synthesis kit (Takara). Quantitative polymerase chain reaction (PCR) was performed in duplicate and reaction mixture containing 1×Power SYBR-Green Master-mix (Applied-Biosystems), 600–750 nM each forward and reverse primers and 50 ng cDNA template. PCR amplification was carried out using Applied-Biosystem Prism 7900HT Real-Time PCR Sequence Detection System and stopped at 40 cycles. The relative gene expression levels were normalized with human cyclophilin using the comparative CT method. The 48 human NR primer sequences followed a previous report [9]. The other quantitative PCR primer sequences are listed in Table 1.
Ngn3, neurogenin-3; Oct4, octamer-binding transcription factor; PDX1, pancreatic and duodenal homeobox 1; PPARγ, peroxisome proliferator-activated receptor γ; RXRα, retinoid X receptor α; Sox2, sex-determining region Y-box 2; SREBP-1c, sterol regulatory element-binding protein 1c; aP2 adipocyte fatty acid-binding protein 2; C/EBPα, CCAAT/enhancer-binding protein α; Runx2, runt-related transcription factor 2; OPG, osteoprotegerin; ALP, alkaline phosphatase.
Western blot
Whole cell extracts from undifferentiated cells at passages 4, 7, 12, and 20 were prepared. After Bradford assay, 40 μg of protein per lane were separated by electrophoresis in a 15% sodium dodecyl sulphate polyacrylamide gel. Proteins were then transferred to a polyvinylidene difluoride membrane. The membranes were blocked with 5% skim milk in Tris-buffered saline with 0.05% Tween 20 for 1 h and incubated with primary antibody to p16INK4A (1:500; Upstate) overnight. Membranes were then incubated with secondary antibody horseradish peroxidase-conjugated anti-rabbit IgG (Santa Cruz) for 1 h at room temperature and visualized using a Fujifilm luminescent image analyzer LAS4000. Beta actin was used as a loading control.
Flow cytometry
Single-cell suspensions at passages 4, 7, 12, and 20 were obtained and washed twice with FACS buffer containing 1% fetal bovine serum in phosphate-buffered saline. Cells were counted and suspended at a concentration of 5×10⁵ cells in 100 μL FACS buffer and incubated for 30 min at 4°C in the dark with the following fluorescent antibodies: CD73-PE, CD90-FITC, and CD105-FITC (BD Biosciences). Cells were washed twice with FACS buffer and then analyzed using flow cytometry (FACS Calibur System; Becton Dickinson). Data acquisition and analysis were then performed (Cell Questsoftware; Becton Dickinson).
Differentiation of hADSCs
To induce insulin-producing cell differentiation, cells from passages 4, 7, 12, and 20 were trypsinized, suspended in culture medium, and centrifuged. Cells were counted and seeded at a density of 104 cells/cm2 in a 12-well low attachment plate (SPL 30212). To examine the effect of peroxisome proliferator-activated receptor γ (PPARγ) overexpression, hADSCs were transiently transfected with a pcDNA flag PPARγ plasmid (Addgene plasmid No. 8895, a gift of Dr. Bruce Spiegelman) or pcDNA plasmid (250 ng each) using a Neon transfection system (Life Technologies; two electric pulses at 1,005 V with 35 ms duration). Transfected cells were incubated in MesenPRO medium containing 2% growth supplement for 24 h and then differentiated into insulin-producing cells. To examine the effect of a PPARγ activator, troglitazone was added to hADSCs, and the cells were incubated for 24 at 37°C. Cells were then differentiated into insulin-producing cells using defined medium. The basic differentiation medium was serum-free DMEM/F12 (1:1) supplemented with 1% B27 serum-free supplement, 1% N2 supplement, and 1% penicillin/streptomycin. A three-step, 10-day protocol was used to differentiate hADSCs into insulin-producing cells: (1) 3 days of incubation in basic medium plus 50 ng/mL activin A and 2 mM valproic acid, (2) 3 days of incubation in basic medium plus 10 nM exendin-4 and 10 ng/mL bFGF, and (3) 4 days in incubation in basic medium plus 10 nM exendin-4, 50 ng/mL HGF, and 10 mM nicotinamide.
For adipogenic differentiation, cells were seeded at a density of 2×10⁴ cells/cm2 in six-well culture plates and cultured for 2 days before differentiation. Subconfluent cells were incubated for 12 days with adipogenic differentiation medium consisting of DMEM high glucose supplemented with 10% fetal bovine serum, 1 μM dexamethasone, 500 μM 3-isobutyl-1-methylxantine, 5 μg/mL insulin, and 10 μM troglitazone; the medium was changed every 3 days. After adipogenic differentiation, cells were fixed in 10% formalin for 30 min at room temperature, washed, and stained with 1.8 mg/mL Oil Red O solution and visualized under a microscope. Oil Red O assays were performed by lysing stained cells with isopropanol and measuring the absorbance at 450 nm wavelengths.
For osteogenic differentiation, 5×10³ cells/cm2 at passages 4, 7, 12, and 20 were seeded in six-well culture plates. After overnight incubation, the growth medium was replaced by osteogenic medium containing DMEM/F12 (1:1) supplemented with 0.1 μM dexamethasone, 50 μM ascorbate-2 phosphate, and 10 mM β-glycerol phosphate. After 2 weeks of incubation, the alkaline phosphatase (ALP) activity of the differentiated cells was measured using an ALP staining kit (Primary Cell Co.).
Insulin secretion
The insulin secretion of the differentiated cells was measured using a human insulin ELISA kit (Mercodia) according to the manufacturer's instructions. Insulin content was normalized with protein content of the corresponding cell lysates.
Luciferase reporter gene analysis
The luciferase reporter construct (phOct4-Luc) containing the upstream region of human Oct4 was kindly provided by Shinya Yamanaka (Addgene plasmid No. 17221). To find the effect of PPARγ overexpression, hADSCs (passage 20) were transfected with the phOct4-Luc plasmid (500 ng) and a β-galactosidase plasmid (200 ng) after transfection with the pcDNA flag PPARγ plasmid or pcDNA plasmid (250 ng each). They were subjected to 2 electric pulses at 1,005 V with 35 ms duration using the Neon transfection system. Thirty-six hours after transfection, the cells were collected with 1× passive lysis buffer (Promega). The intensity of luciferase activity was normalized with β-galactosidase expression.
Statistical analysis
Data are presented as mean±SD. The significance of differences was analyzed with an unpaired Student's t-test and one-way ANOVA with the Bonferroni procedure using SPSS ver. 10.0 (SPSS, Inc.) The value of statistical significance was set at P<0.05.
Results
Characterization of hADSCs during expanded culture
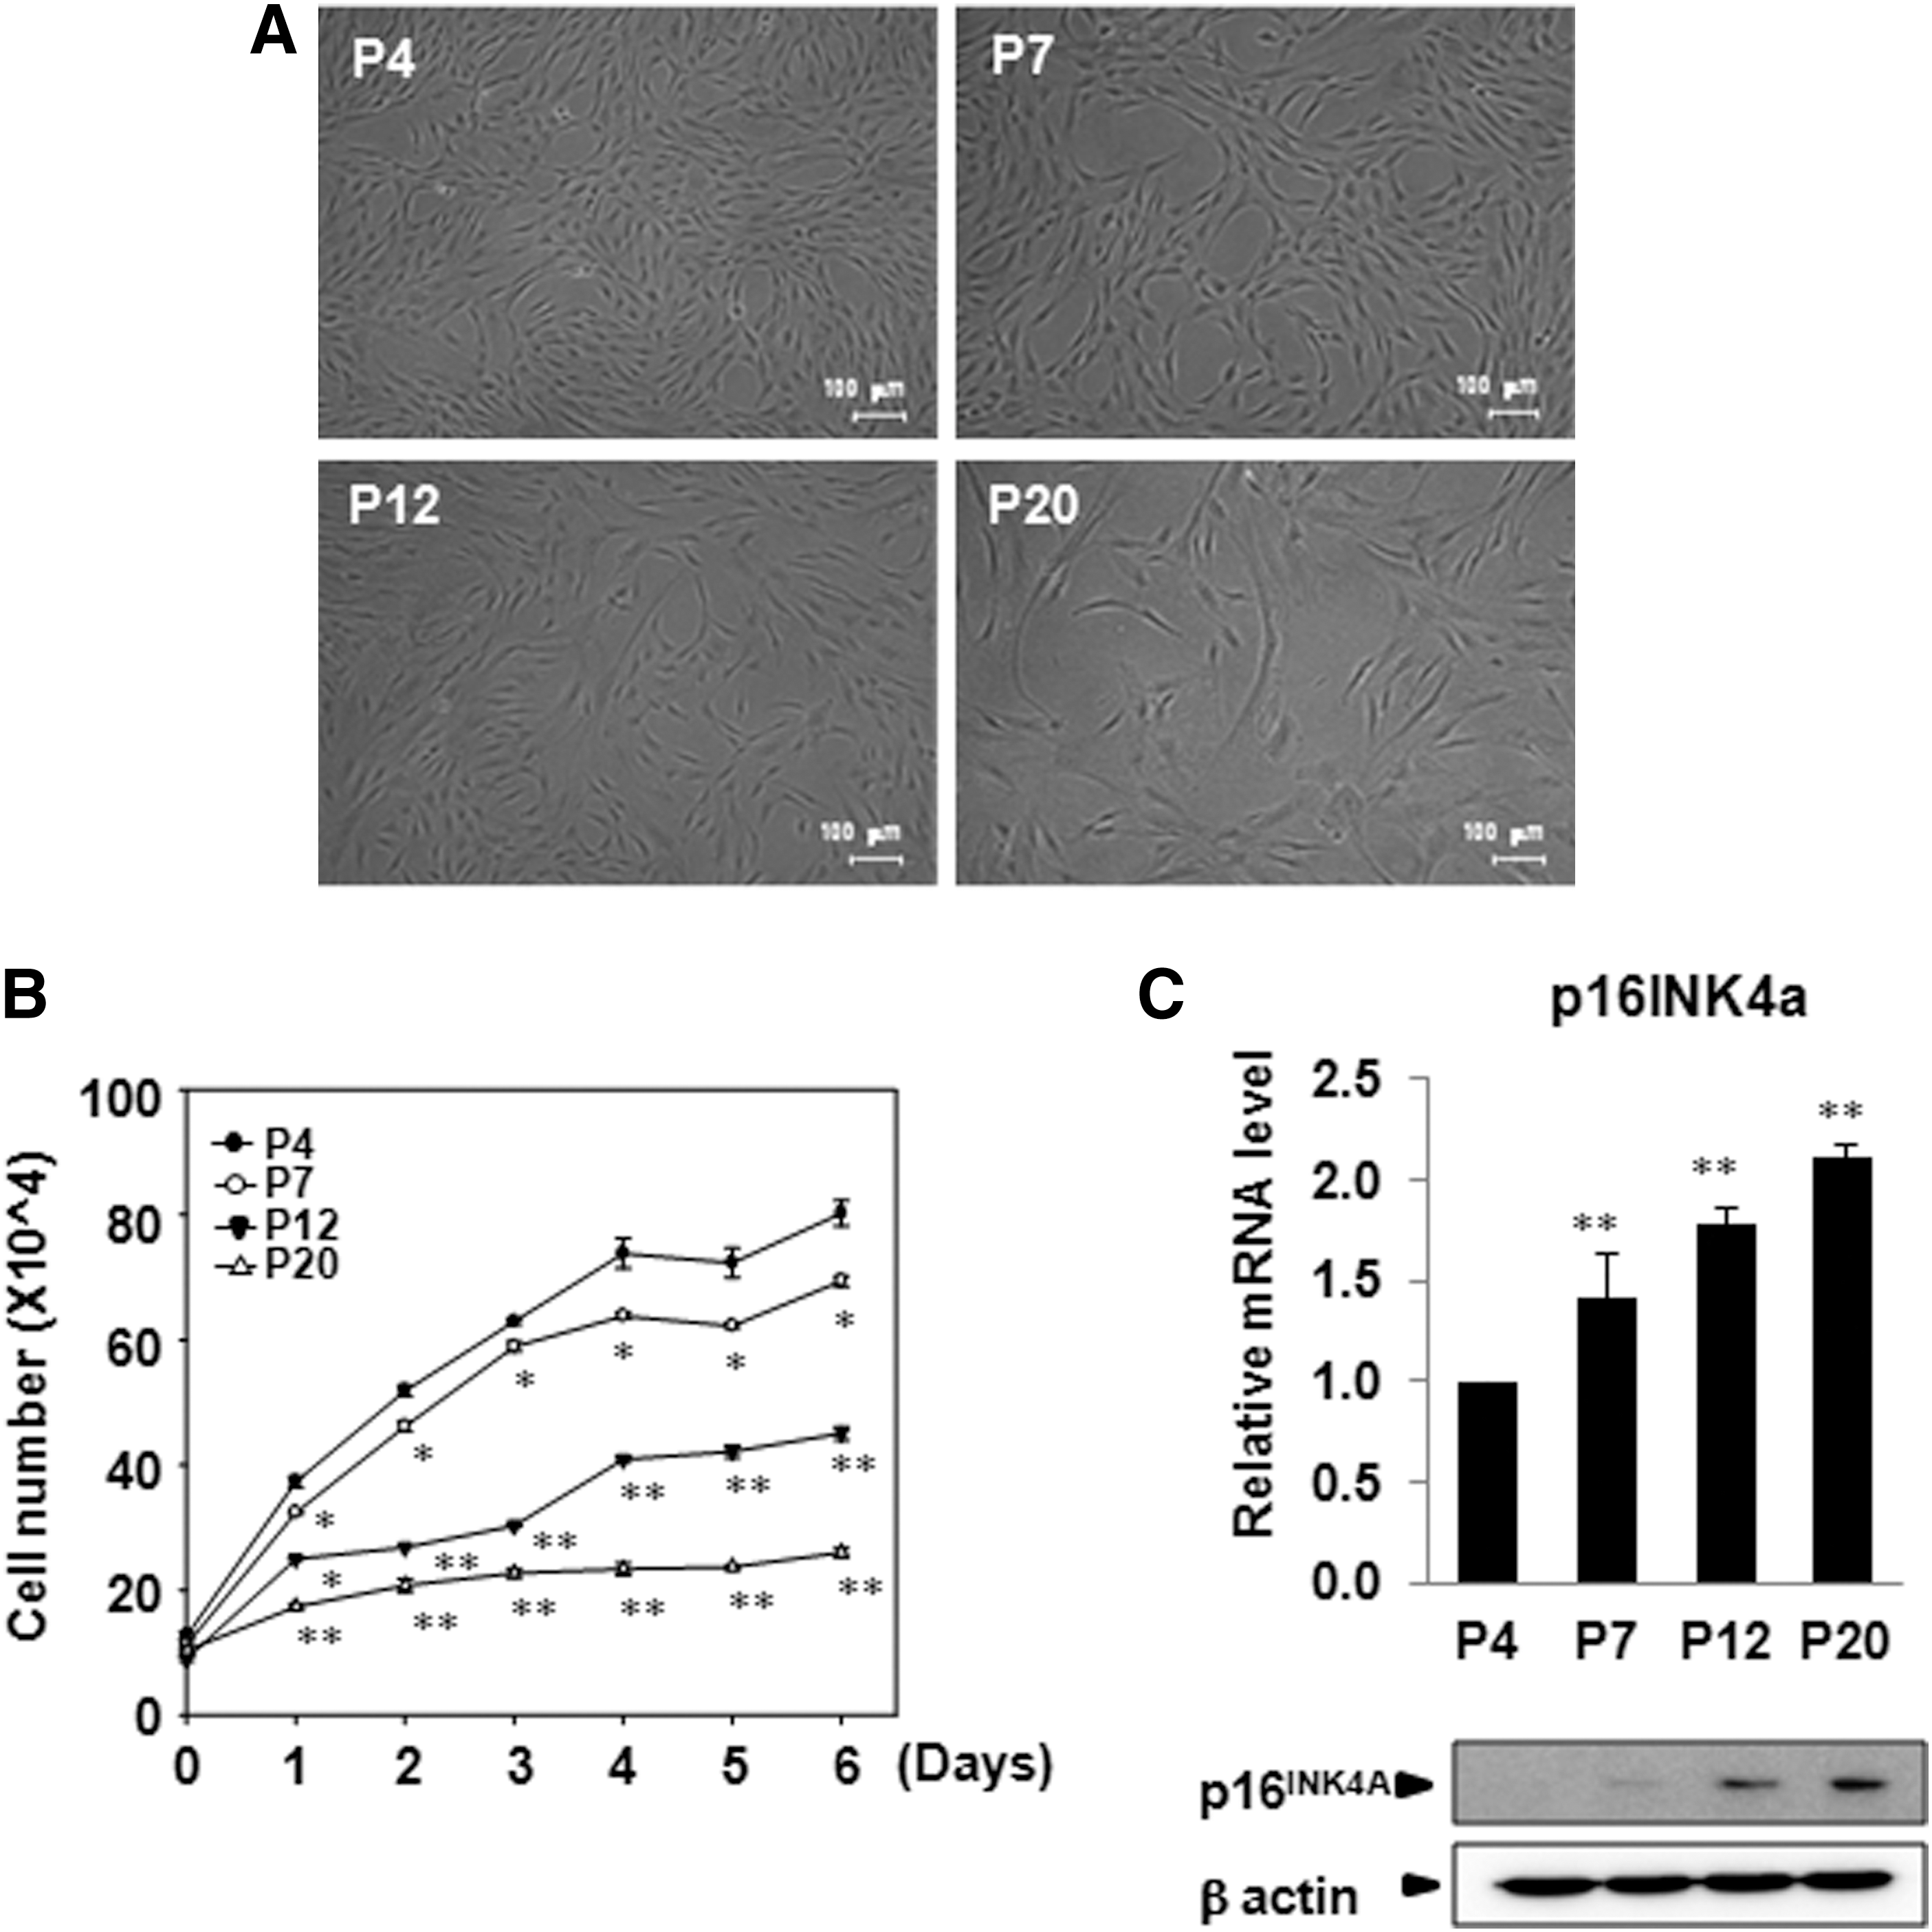
hADSCs were cultured in vitro and the morphology, growth rate, and expression of p16INK4A was examined at different passages. Cells displayed a small spindle shape at the early passages (P4 and P7), and they became larger, flattened, and tightly attached to the plate at later passages (Fig. 1A). When we analyzed growth kinetics, the growth rate was slower and the increase of cell number was significantly reduced with increasing passage number (Fig. 1B).
Characterization of human adipose tissue-derived stem cells (hADSCs) during expanded culture.
Previous studies have shown that senescence-associated gene expression increases continuously during in vitro expansion. This is in line with the changes in morphology and loss of differentiation potential [7]. p16INK4A is known to contribute to cellular senescence and also stem cell aging. It accumulates in many aged cells and tissues and is considered a biomarker of aging [10,11]. We found that p16INK4A mRNA and protein expression was increased in later passages as compared with passage 4 (Fig. 1C).
Expression of stem cell markers during expanded culture
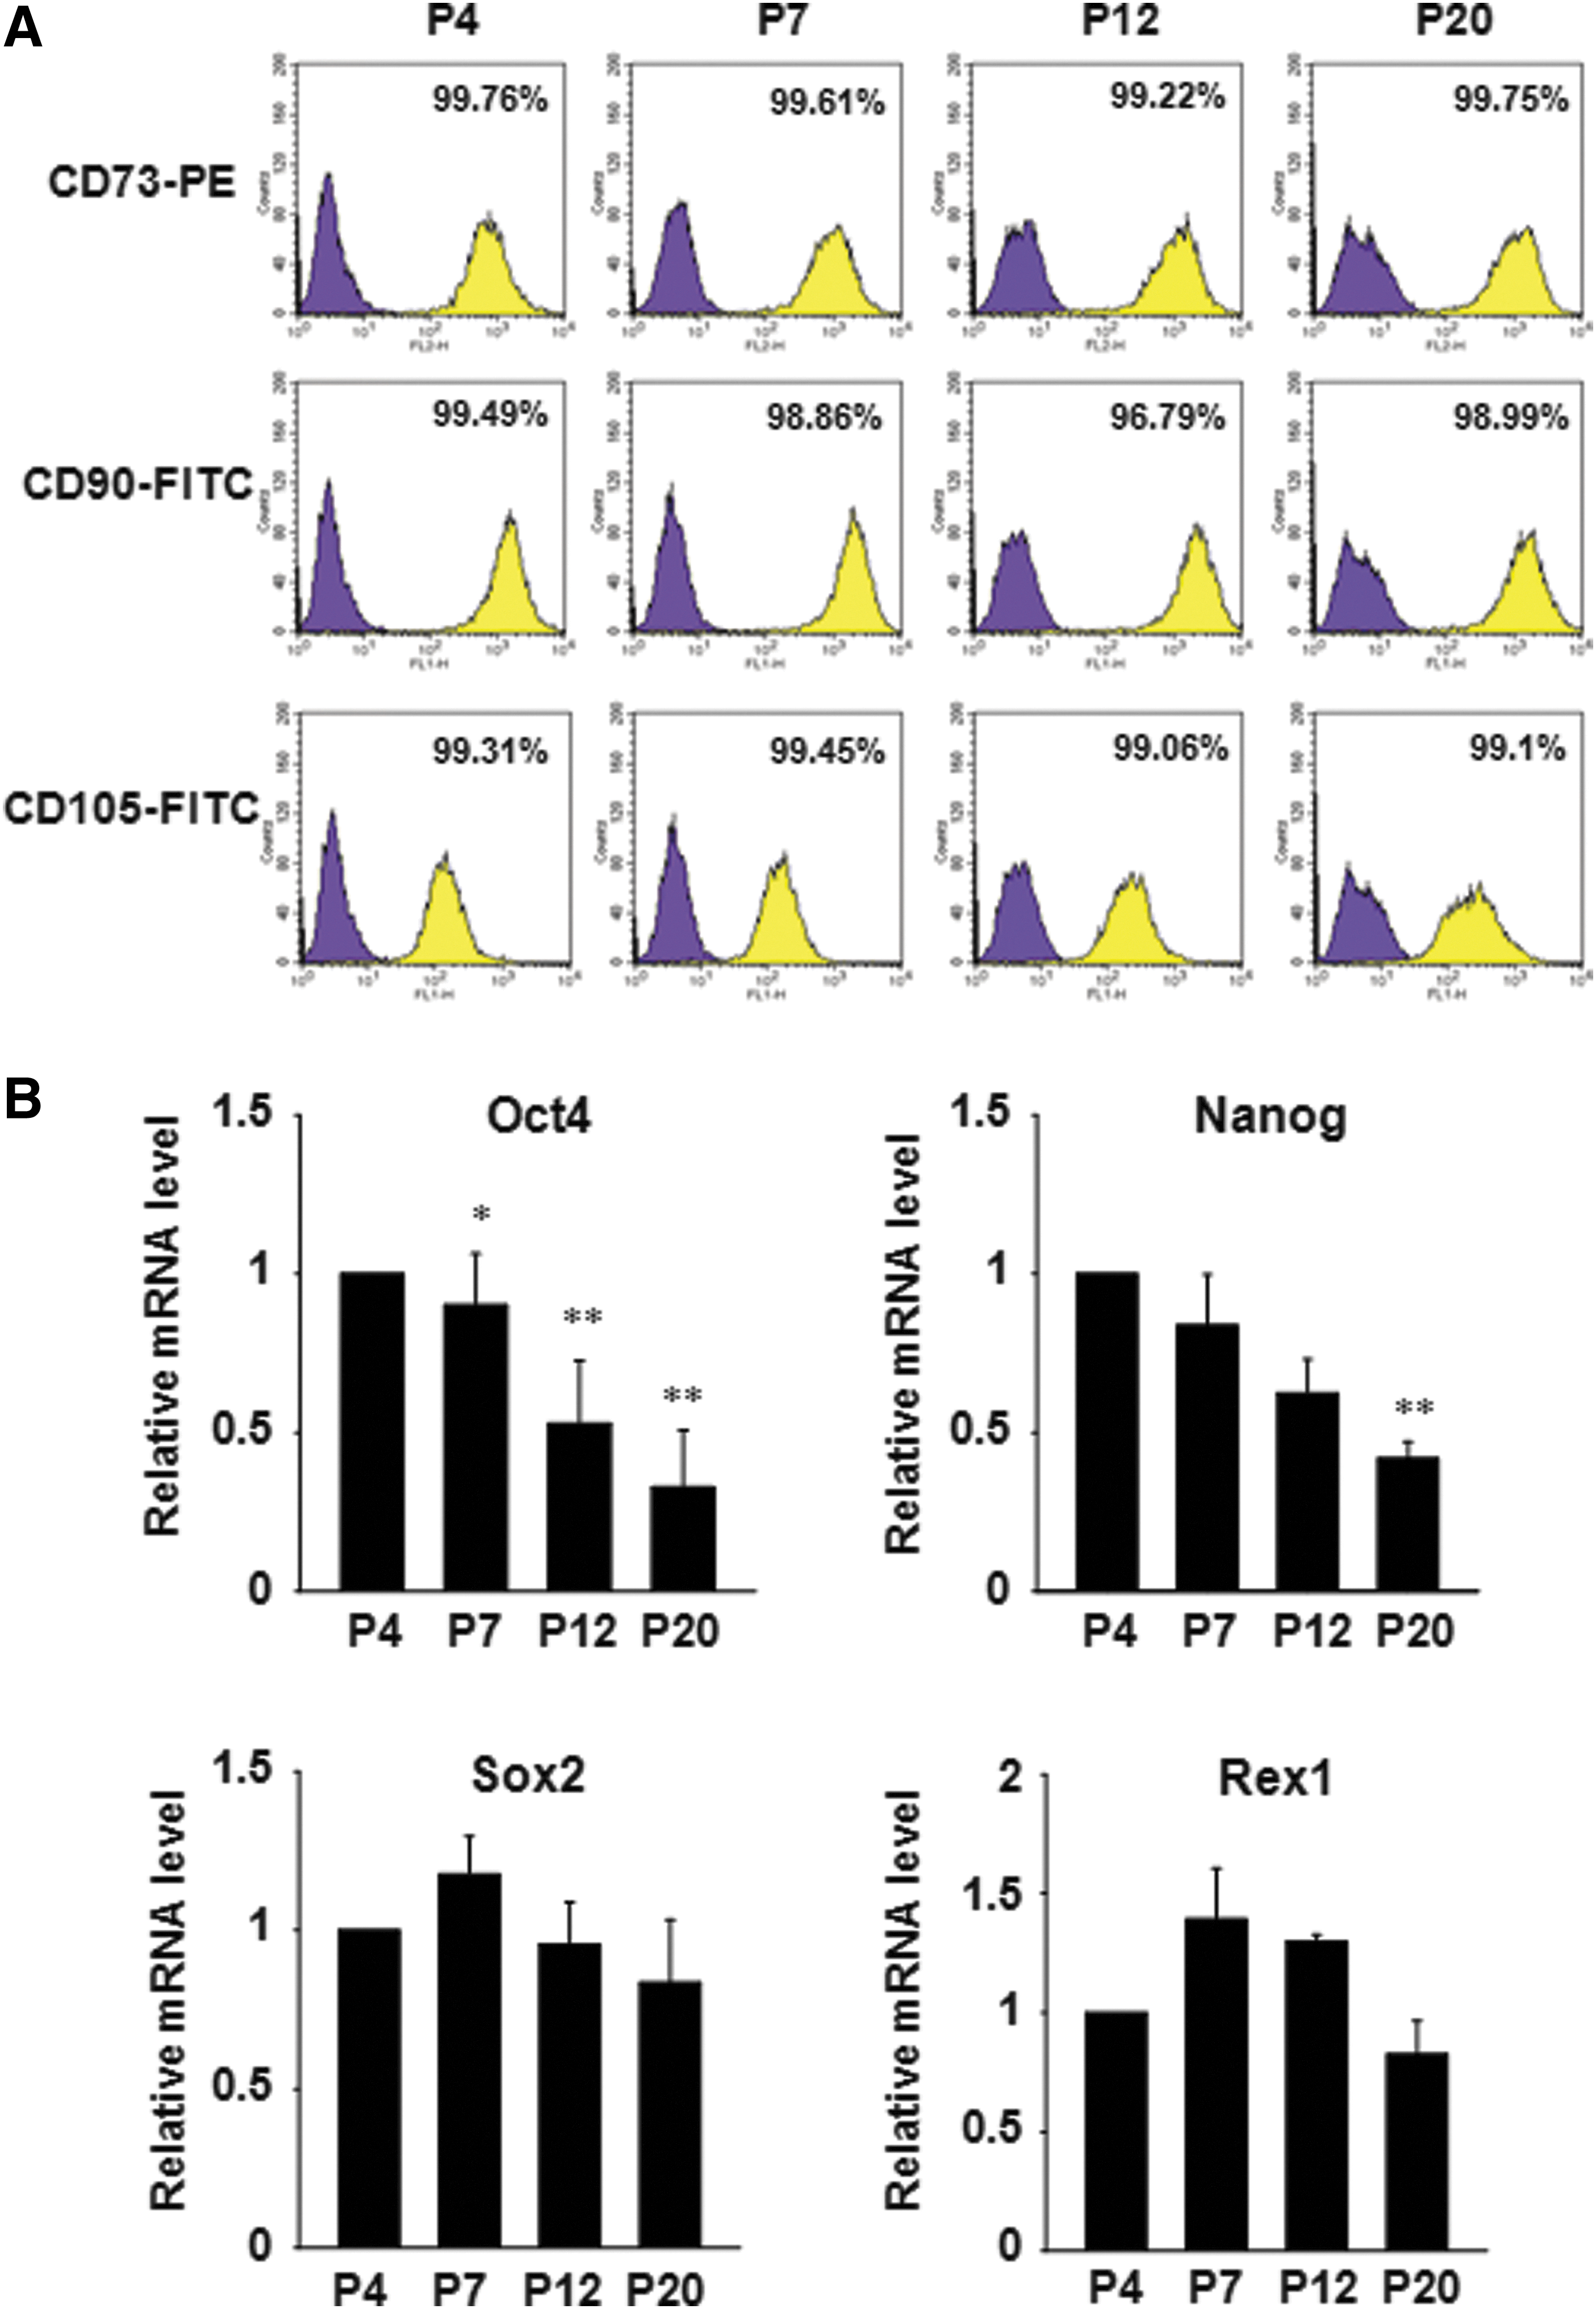
Expression of mesenchymal surface markers in hADSCs at different passages was examined by FACS analysis. The cell populations that expressed CD73, CD90, or CD105 were not different among passages (Fig. 2A). hADSCs have been reported to express several markers of pluripotent embryonic stem (ES) cells [12,13]. Therefore, we examined the expression of several important pluripotent markers. Oct4, an important transcription factor in maintaining the undifferentiated status of ES cells, was significantly decreased at passages 7, 12, and 20 as compared with passage 4. A similar pattern was observed with Nanog expression level. However, the expression of sex determining region Y-box 2 (Sox2) and reduced expression 1 (Rex1) was not significantly changed (Fig. 2B).
Expession of stem cell markers in hADSCs during expanded culture.
Reduction of differentiation capability of hADSCs into insulin-producing cells
hADSCs are multipotent stem cells that are able to differentiate into mesenchymal and nonmesenchymal lineages [14,15]. Therefore, we tested the ability of hADSCs at different passages to differentiate into insulin-producing cells, a non-mesenchymal lineage. For all passages, cells aggregated together and formed spheroid clusters, which became islet-like structures by day 10. However, hADSCs at passages 4, 7, and 12 formed clusters with smooth surfaces, whereas cells at passage 20 formed clusters with wrinkled and rough surfaces (Fig. 3A). To determine whether the morphological changes reflect successful differentiation of hADSCs, we analyzed the mRNA expression of insulin and the beta-cell differentiation transcription factors, pancreatic and duodenal homeobox 1 (PDX1) and neurogenin-3 (NGN3), in differentiated cells by quantitative PCR. The expression levels of insulin and the transcription factors were significantly decreased at passages 12 and 20 as compared with passage 4 (Fig. 3B). We next tested the functional ability of differentiated cells by measuring the amount of secreted insulin. The amount of insulin secreted from cells differentiated at passages 7, 12, and 20 was also significantly decreased. There was about a threefold decrease in insulin secretion at passage 20 compared with passage 4 (Fig. 3C).

Differentiation potential of hADSCs into insulin-producing cells during expanded culture.
Previous reports have shown that hADSCs retain their mesenchymal cell lineage differentiation capability through multiple passages [16]. Therefore, we next examined the ability of hADSCs at different passages to differentiate into adipocytes and osteoblasts. Differentiation of hADSCs into adipocytes, as determined by Oil Red O staining, was observed in all passages. However, lipid vacuoles were more numerous and dense when we differentiated the cells at passages 4 and 7 as compared with passages 12 and 20 (Supplementary Fig. S1A; Supplementary Data are available online at
NR expression pattern of hADSCs during in vitro culture
Stemness is maintained by several key regulatory transcription factors and signaling molecules, which establish precise patterns of gene expression that characterize the undifferentiated phenotype. NRs are involved in the pathway of tissue-specific stem cell regulation [17], and certain NRs also play crucial roles in maintaining ES cells in co-operation with Oct4 and Nanog [18,19]. To investigate the changes in NR expression profile of hADSCs during culture, we screened the expression of 48 human NRs at passages 4, 7, 12, and 20. Analysis of NR mRNA expression levels revealed that 24 NRs were expressed in all examined passages. The 24 expressed NRs were categorized into three groups according to their expression patterns over the four passages: NRs that remained unchanged (13/24, Fig. 4A), NRs with decreasing expression (10/24, Fig. 4B), and NRs with increasing expression (1/24, Fig. 4C). Of these, only two were statistically significant—PPARγ and thyroid hormone receptor (TR)β showed a significant decrease at passages 12 and 20 or passage 20, respectively, as compared with passage 4 (Fig. 4).
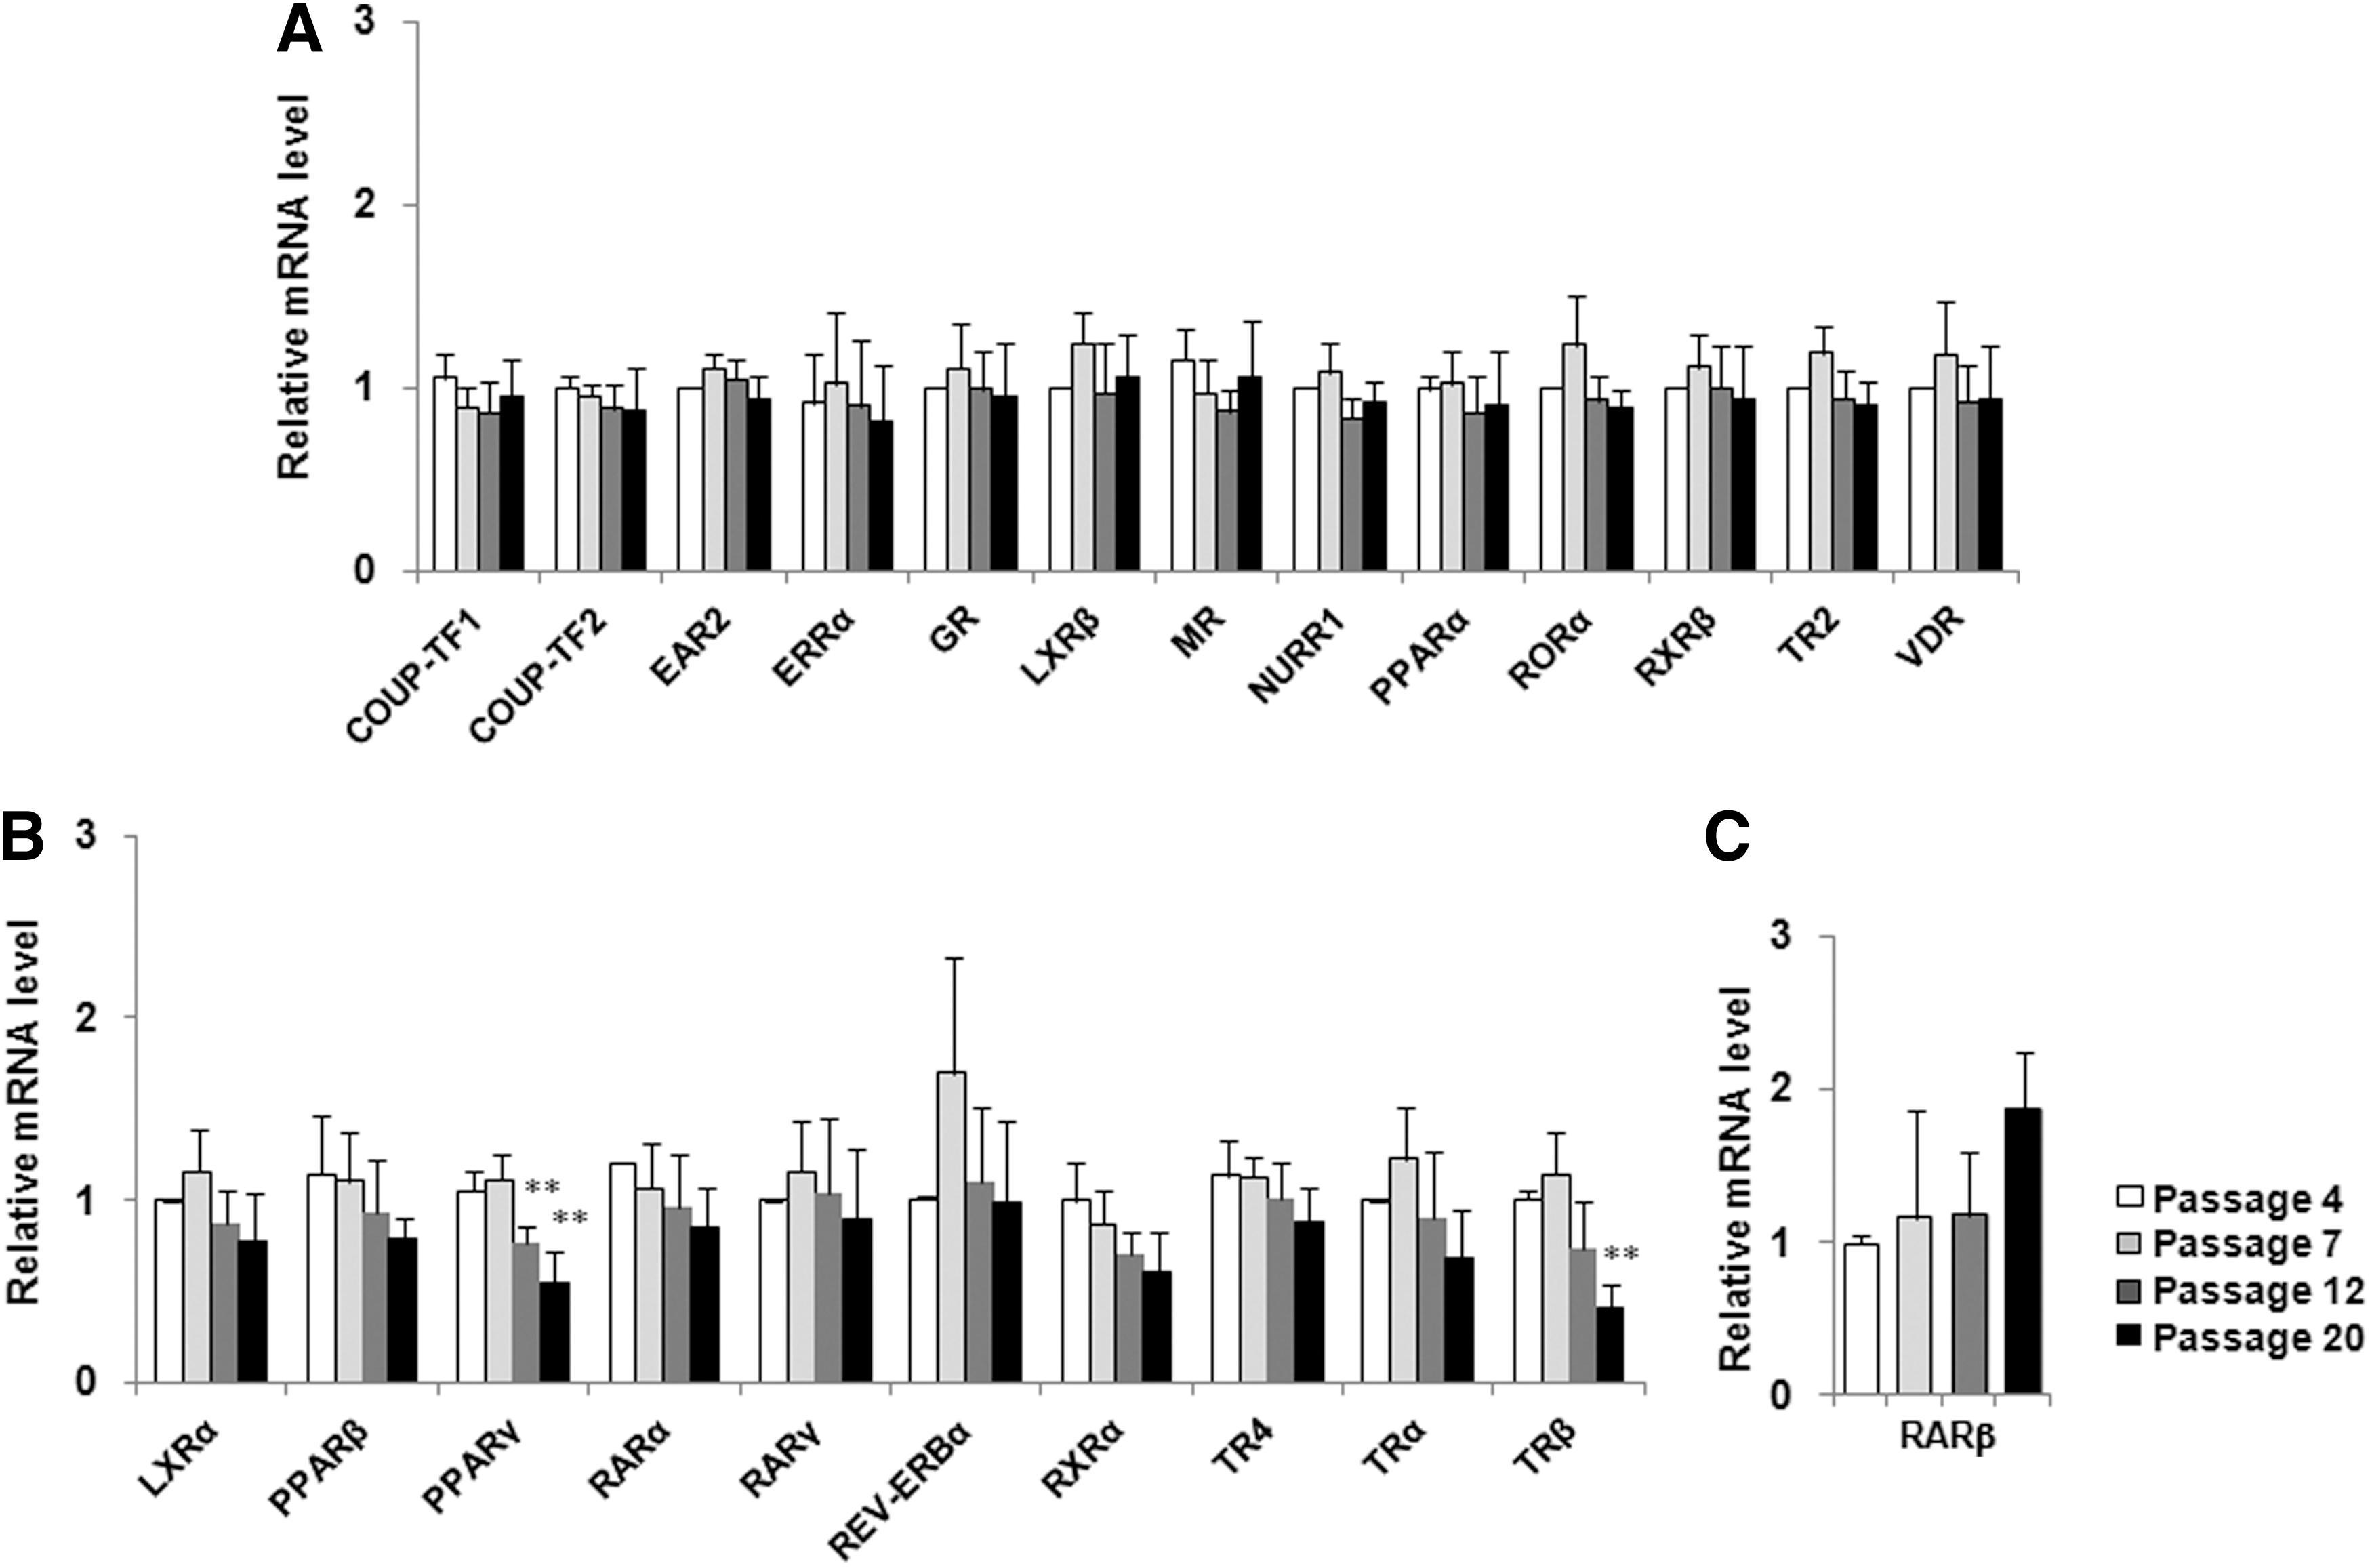
The mRNA expression profile of nuclear receptors (NRs) in hADSCs during expanded culture. hADSCs at passage 4, 7, 12, and 20 were harvested and mRNA expression for 48 NRs was analyzed by quantitative PCR. There were 24 NRs expressed in hADSCs, which could be categorized into three groups according to their expression patterns.
Regulation of Oct4 gene expression level by PPARγ
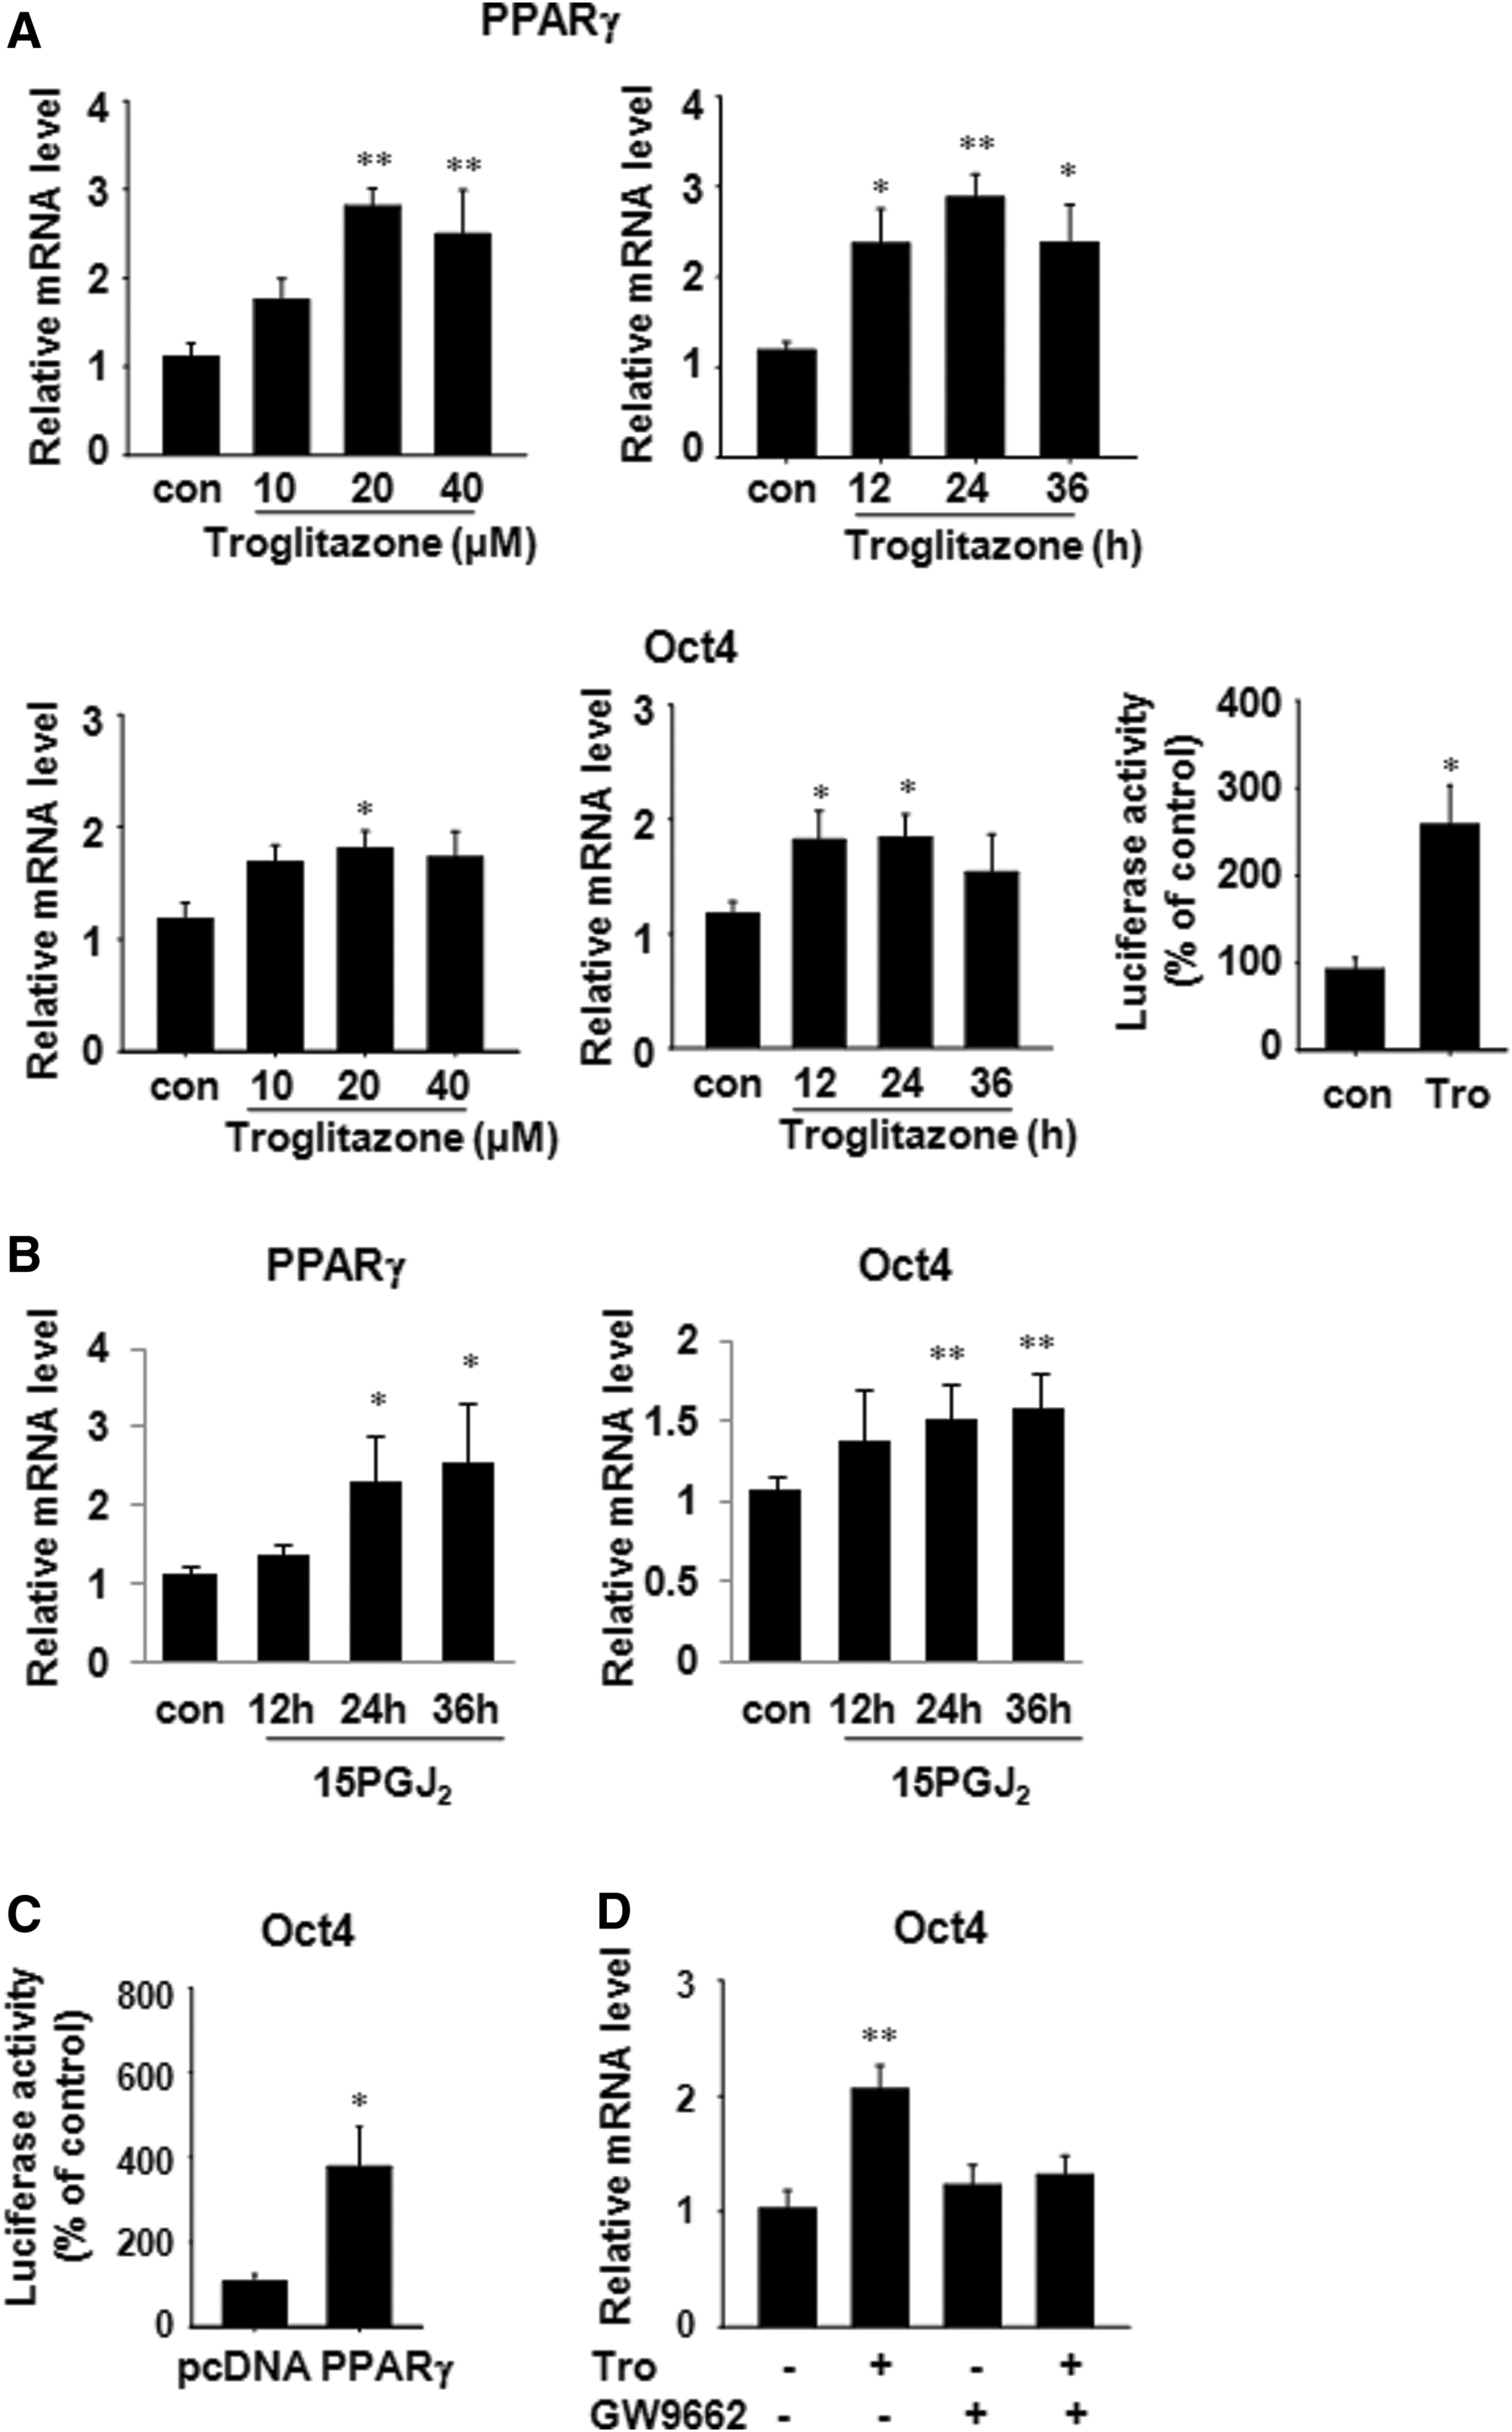
Since PPARγ expression was significantly decreased at passages 12 and 20, we investigated whether PPARγ plays any role in regulation of Oct4, a stem cell marker. Treatment of hADSCs at passage 20 with troglitazone, a PPARγ activator, increased the expression of PPARγ mRNA in a dose- and time-dependent manner and the expression of Oct4 mRNA was increased with a similar pattern (Fig. 5A). To confirm that troglitazone treatment increases Oct4 gene expression, we measured Oct4 promoter activity in hADSCs transiently transfected with phOct4-luc plasmid and found that troglitazone (20 μM) significantly increased the luciferase activity (Fig. 5A). In addition, treatment with 15PGJ2, another PPARγ activator, increased PPARγ and Oct4 mRNA levels in a time-dependent manner (Fig. 5B). We then examined whether PPARγ overexpression could increase the Oct4 promoter activity and found that PPARγ overexpression in hADSCs at passage 20 caused an increase in Oct4 luciferase activity (Fig. 5C). An additional experiment was carried out using GW9662, a PPARγ-specific antagonist, in order to confirm that regulation of Oct4 expression is affected by PPARγ. Troglitazone in combination with GW9662 (10 μM) failed to increase Oct4 mRNA levels in hADSCs (Fig. 5D). These data provide evidence that PPARγ directly increases transcription of the Oct4 gene.
Regulation of Oct4 transcripts by PPARγ in hADSCs.
Since TRβ expression was significantly decreased at passage 20, we examined whether Oct4 expression could be affected by TRβ activation. We found that treatment of hADSCs at passage 20 with T3 (10–40 ng/mL) had no effect on Oct4 or TRβ mRNA levels (Supplementary Fig. S3).
Retaining the differentiation potential by PPARγ
Since PPARγ activator treatment or PPARγ overexpression increased Oct4 mRNA expression, we assessed whether overexpression of PPARγ can maintain the differentiation potential of hADSCs. hADSCs at passage 20 were transfected with the PPARγ plasmid and then differentiated into insulin-producing cells. Insulin and PDX1 mRNA levels were increased in PPARγ overexpressing cells compared with pcDNA-transfected cells (Fig. 6A). Exposure of the hADSCs to troglitazone for 24 h resulted in an increase in the pancreatic beta-cell-related gene expression (Fig. 6B).
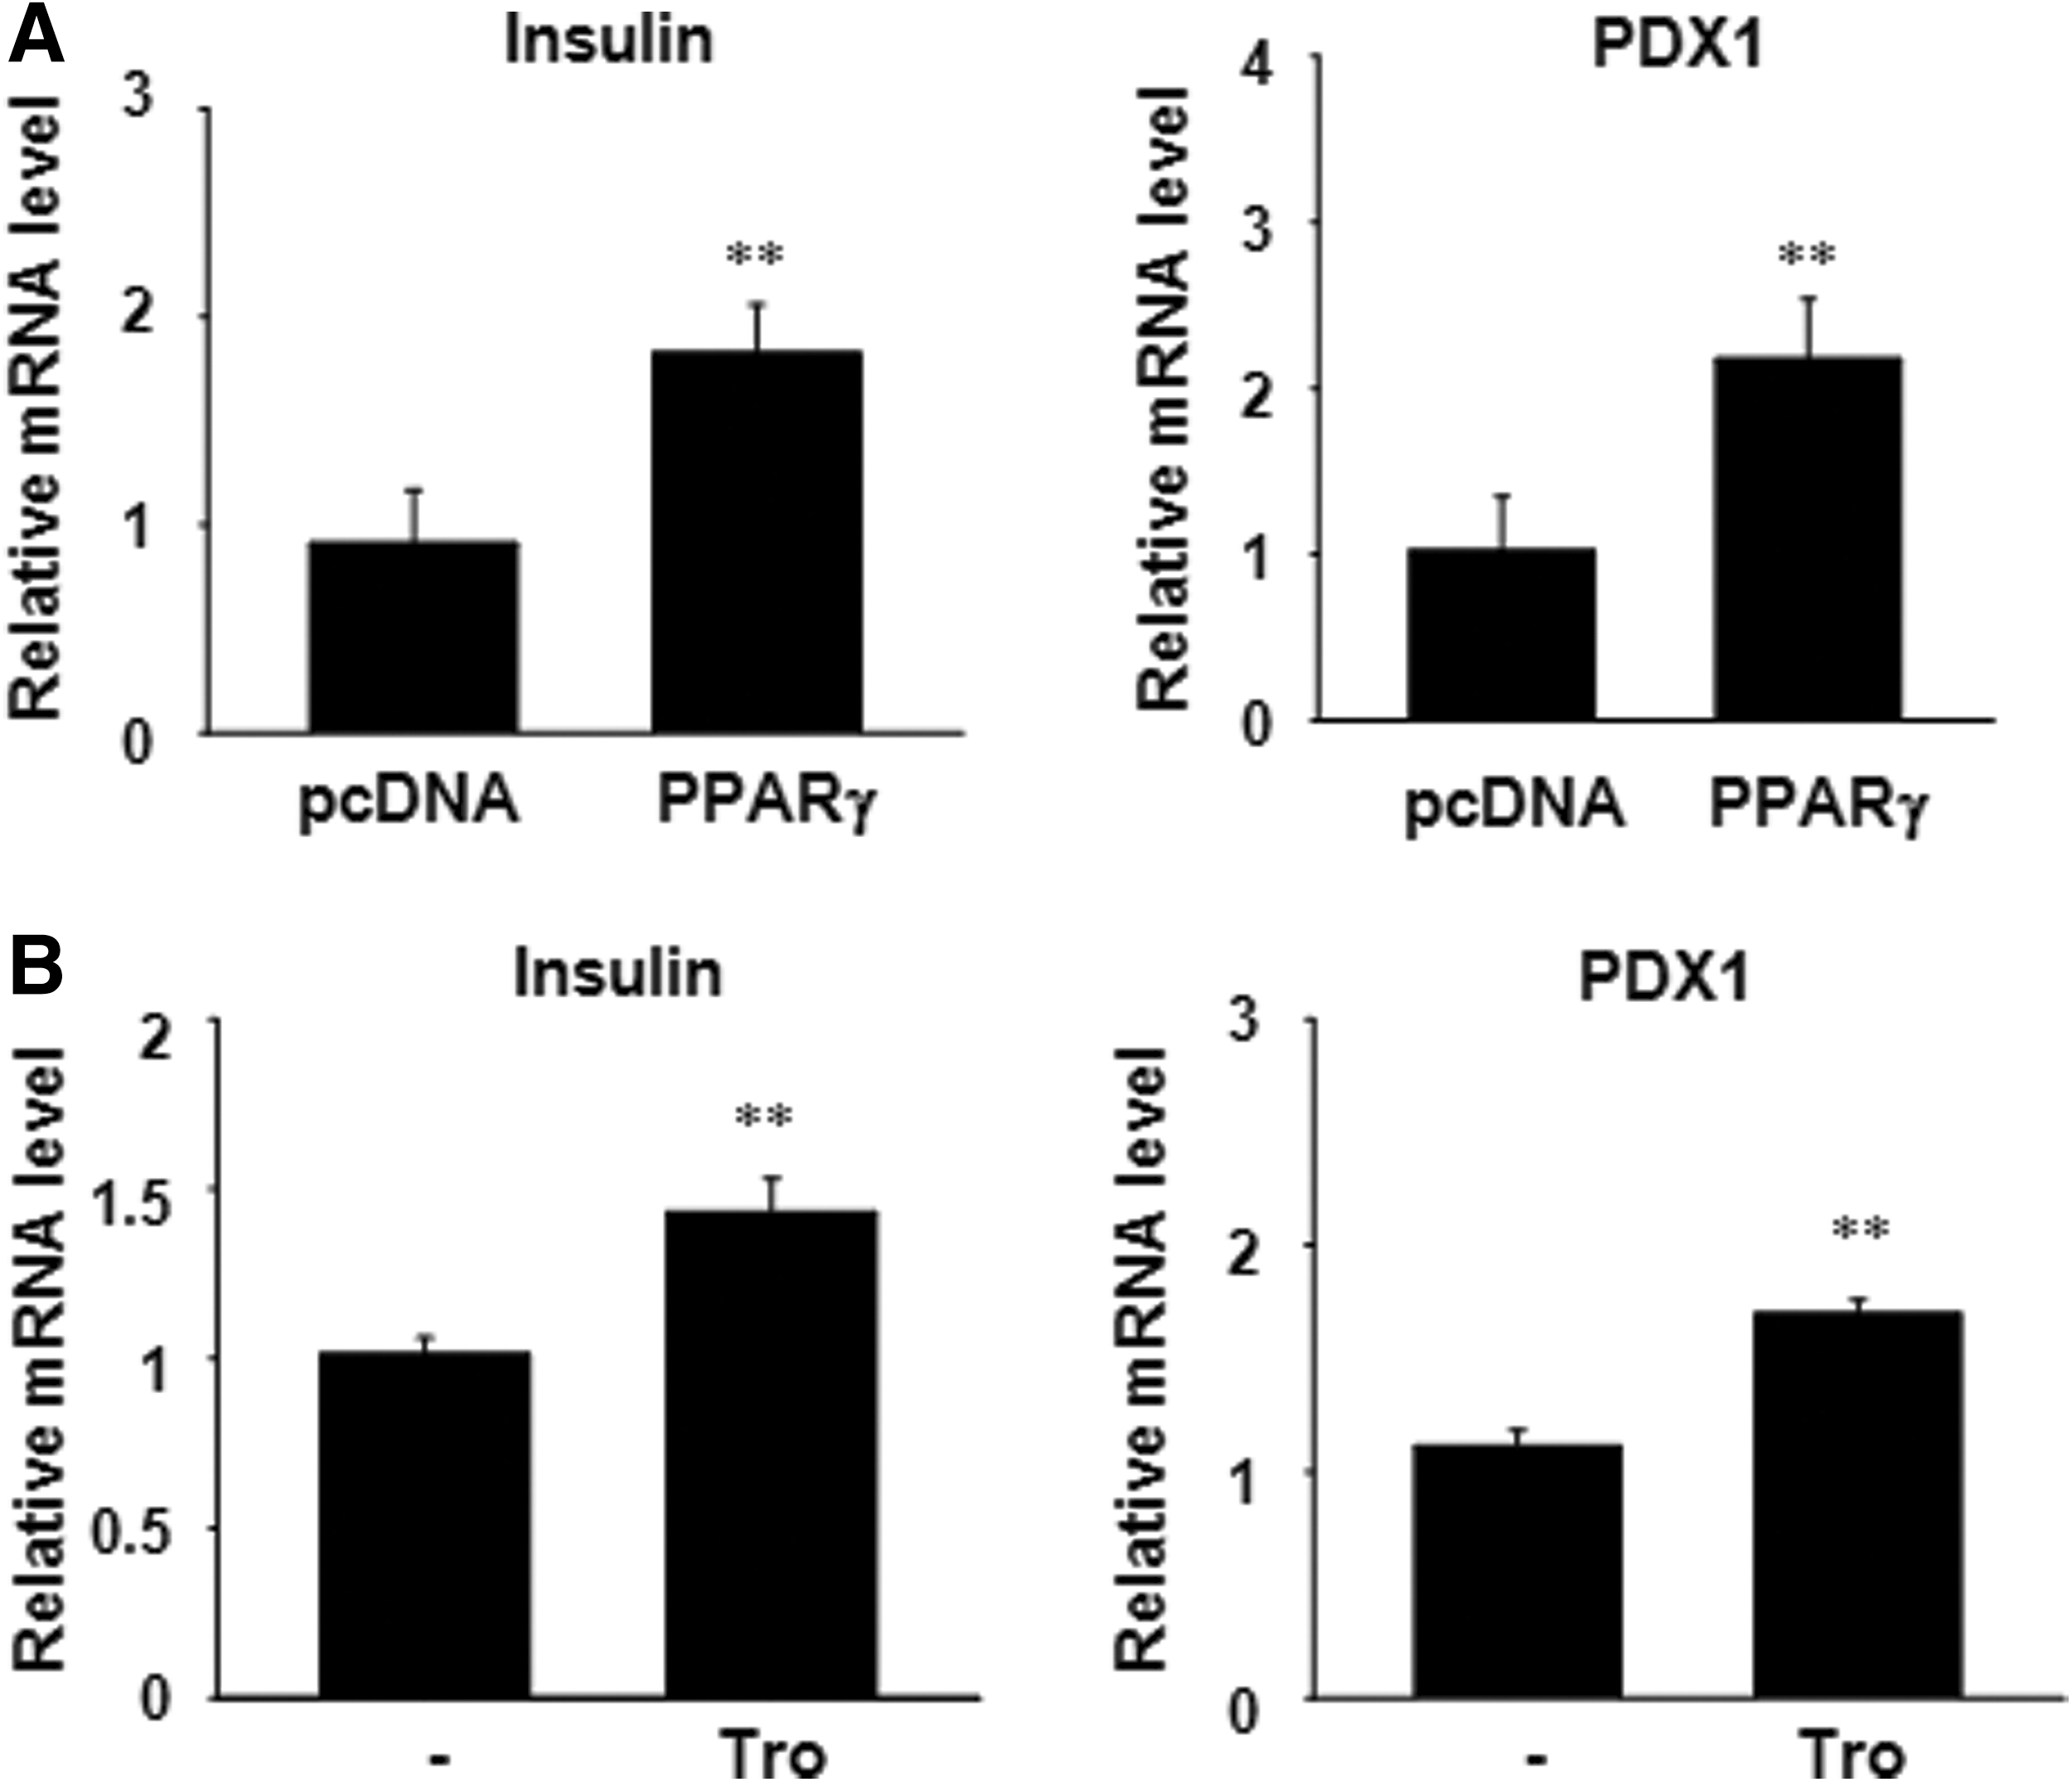
Differentiation potential of PPARγ overexpressing hADSCs into insulin-producing cells.
Discussion
MSCs have great therapeutic interest for mediating endogenous repair of cells and tissue damage, but they need to be expanded before they can be used for therapeutic purposes. However, expansion in vitro causes changes at both cellular and molecular levels, resulting in a decrease of the proliferation and differentiation potential of MSCs [20,21]. We found morphological changes and decline of proliferation rates during long-term culture of hADSCs, as previously reported [22,23]. Many studies have reported that MSCs undergo the typical Hayflick phenomenon of cellular senescence during long-term culture in vitro [24]. In our study, we detected an increase of p16INK4A mRNA and protein expression as passage numbers increased.
To determine whether in vitro expansion could alter the mesenchymal characteristics of the cells, we checked the expression of surface markers. FACS data showed that hADSCs exhibited the most common phenotypical MSC markers (CD73, CD90, and CD105), and the expression of these markers was similar regardless of passage, suggesting that they are not directly related to stem cell maintenance or functional ability. We then examined the expression of several pluripotent stem cell markers that have been reported to be expressed in MSCs [25]. The expression of Oct4, an important pluripotent marker of ES cells, and Nanog gradually declined with increase of passages, whereas the expression of Sox2 and Rex1 did not. These results suggest that long-term culture of hADSCs reduces stemness and differentiation potential.
We investigated whether hADSCs at later passages have a reduced ability to differentiate into insulin-producing cells. Several methods have been used to generate insulin-producing cells from stem cells in vitro [26]. We used a three-step protocol with a combination of defined factors for induction of insulin-producing cells. At the first stage, we used activin A and valproic acid to induce definitive endoderm and orient to the endocrine lineage, respectively [27,28]. Exendin-4 and bFGF were added at the second stage to expand pancreatic progenitors, promote a pancreatic fate, and stimulate insulin secretion [29]. To induce β cell maturation and proliferation as well as increase insulin secretion, exendin-4, HGF, and nicotinamide were supplied at the last stage. Since we did not use insulin that might be absorbed by cells during in vitro culture [30], the insulin which appeared in the clusters was synthesized de novo by differentiated hADSCs. Although hADSCs from all examined passages could successfully generate insulin-producing cells, hADSCs at later passages had reduced differentiation potential evidenced by reduced expression of β cell- and pancreatic lineage-related genes and lower secretion of insulin in differentiated cells.
In agreement with previous reports [31,32], our study also demonstrated that hADSCs at higher passages have a reduced ability to differentiate into adipocytes or osteoblasts. The limitation could be seen at passage 12, and the differentiation capability was lost at passage 20. The decrease in differentiation potential could be due to a decrease of the expression of Oct4 and Nanog transcription factors along with the increase of p16INK4A. These results indicate that the intrinsic differentiation potential of hADSCs relates to pluripotent stem cell regulation as well as senescence machinery. However, the underlying mechanisms need to be explored further.
NRs are involved in many cellular pathways, including regulation of stemness and stem cell differentiation [17,33]. For example, estrogen-related receptor β, steroidogenic factor 1, liver receptor homolog-1 (LRH-1), and DAX-1 are involved in the maintenance of ES cell pluripotency [34]. Retinoic acid receptors play a role in the differentiation of ES cells into the neuronal cells, and activation of RXRs promotes differentiation of ES cell into cardiomyocytes [34]. Given the importance of NRs in controlling cell development, studying the expression of NRs during expanded culture in vitro could provide a view of changing transcriptional regulatory networks. To examine the expression profile of NRs in hADSCs during culture, we assessed the expression all 48 human NRs at passages 4, 7, 12, and 20 by quantitative PCR. A half of NRs examined were expressed in hADSCs (with the Ct≤33), and the expression of PPARγ and TRβ was significantly decreased with an increase in passage. We found that Oct4 mRNA and Oct4 promoter activity were correlated with PPARγ expression, suggesting that PPARγ may play a role in the regulation of Oct4 expression. Treatment of hADCSs with PPARγ activators elevated both PPARγ and Oct4 mRNA, and overexpression of PPARγ increased Oct4 promoter activity. Furthermore, PPARγ activation or overexpression in hADSCs improved the differentiation potential into insulin-producing cells. These results suggest that the up-regulation of Oct4 by PPARγ maintains the stemness and differentiation potential during expanded culture of hADSCs. Some NRs such as germ cell nuclear factor and LRH-1 are known to bind to the regulatory regions of Oct4 and suppress or activate Oct4 transcription in ES cells [34]. Further research is required to determine whether there are any putative PPAR response elements in the Oct4 promoter.
Since hADSCs are relatively easy to isolate and manipulate in vitro, they could be considered promising candidates for the development of various therapeutic modalities for tissue regeneration. A better understanding of the biological characteristics and their differentiation potential will allow us to properly manipulate hADSCs in vitro before transplantation. The reduction of differentiation potential during expanded culture needs to be solved for clinical application of stem cell therapy. Further investigations are needed to establish the culture strategies to permit the expansion of hADSCs while retaining their potential for differentiation.
Footnotes
Acknowledgements
This research was supported by a grant from the Innovative Research Institute for Cell Therapy Project, Ministry for Health, Welfare and Family Affairs, Republic of Korea (A062260) and a grant from the R&D program of MOTIE/KIAT.
Author Disclosure Statement
The authors declare that there are no conflicts of interest.
References
Supplementary Material
Please find the following supplemental material available below.
For Open Access articles published under a Creative Commons License, all supplemental material carries the same license as the article it is associated with.
For non-Open Access articles published, all supplemental material carries a non-exclusive license, and permission requests for re-use of supplemental material or any part of supplemental material shall be sent directly to the copyright owner as specified in the copyright notice associated with the article.