
Abstract
It has been shown that bone marrow mesenchymal stromal cells (MSCs) from patients with myelodysplastic syndromes (MDSs) display defective proliferative potential. We have probed the impaired replicative capacity of culture-expanded MSCs in MDS patients (n=30) compared with healthy subjects (n=32) by studying senescence characteristics and gene expression associated with WNT/transforming growth factor-β1 (TGFB1) signaling pathways. We have also explored the consequences of the impaired patient MSC proliferative potential by investigating their differentiation potential and the capacity to support normal CD34+ cell growth under coculture conditions. Patient MSCs displayed decreased gene expression of the senescence-associated cyclin-dependent kinase inhibitors CDKN1A, CDKN2A, and CDKN2B, along with PARG1, whereas the mean telomere length was upregulated in patient MSCs. MDS-derived MSCs exhibited impaired capacity to support normal CD34+ myeloid and erythroid colony formation. No significant changes were observed between patients and controls in gene expression related to TGFB1 pathway. Patient MSCs displayed upregulated non-canonical WNT expression, combined with downregulated canonical WNT expression and upregulated canonical WNT inhibitors. MDS-derived MSCs displayed defective osteogenic and adipogenic lineage priming under non-differentiating culture conditions. Pharmacological activation of canonical WNT signaling in patient MDSs led to an increase in cell proliferation and upregulation in the expression of early osteogenesis-related genes. This study indicates abnormal WNT signaling in MSCs of MDS patients and supports the concept of a primary MSC defect that might have a contributory effect in MDS natural history.
Introduction
M
Multipotent mesenchymal stromal cells (MSCs) are the main components of the marrow microenvironment and the constituents of the regulatory niches that influence the survival, cell cycle, self-renewal, and differentiation processes of HSCs [5,6]. Several studies have shown that ex-vivo-expanded MSCs from MDS patients display functional and cytogenetic abnormalities, such as impaired replicative potential, abnormal cytokine production, defective differentiation and immunoregulatory capacity, and genetic aberrations, although different from those detected in the respective HSCs [7,8]. Although results from many of these studies have not been universally confirmed [9,10], they raise a strong possibility that MSCs in MDSs fail to support hematopoiesis and corroborate the hypothesis of a permissive microenvironment that promotes the emergence and/or evolution of clonal hematopoiesis in MDSs.
We and others have previously shown that MSCs from MDS patients, despite their ability to normally expand ex vivo, display a defective proliferative capacity associated with an impaired colony-forming potential and passage recovery in long-term cultures [8,11]. The mechanisms underlying the impaired replicative potential of BM MSCs in MDS patients remain obscure. Premature cell senescence associated with an abnormal telomere shortening due to the long-standing inflammation has been shown to account, at least in part, for the defective proliferative properties of BM MSCs in patients with rheumatoid arthritis [12]. Apart from the telomere shortening, a number of molecular changes have been recently associated with MSC aging, such as altered gene expression profile of the senescence-associated cyclin-dependent kinase (CDKN) inhibitors CDKN1A (p21), CDKN2A (p16), and CDKN2B (p15); the tumor suppressors TP53 and retinoblastoma (RB1); and the phosphate-associated RhoGAP protein-tyrosine (PARG1) [13,14]. Whether premature cell senescence accounts also for the impaired replicative potential of MSCs from MDS patients has not been investigated so far.
Signaling pathways mediated through the WNT ligands display a pivotal regulatory role in MSC proliferation, self-renewal, and differentiation [15,16]. Further, the canonical Wnt/β-catenin signaling has been associated with cell senescence of BM MSCs in rat models [17]. The possibility of deregulated WNT pathways in MSCs of MDS patients has never been studied. Interestingly, disease-related alterations of the canonical WNT signaling have been identified in HSC populations of MDS patients although their precise role has not been clearly elucidated [18,19].
In the present study we probe the mechanisms underlying the impaired replicative potential of BM MSCs in patients with MDSs by investigating the senescence characteristics of culture-expanded MSC time-course, namely, the relative telomere length, the expression of senescence-associated β-galactosidase (SA-β-gal), and senescence-associated genes. We have also assessed the expression profile of 84 genes associated with the canonical and non-canonical WNT signaling pathways in MSCs from MDS patients compared with healthy individuals. Because a cross-talk between WNT and transforming growth factor-β1 (TGFB1) signaling pathways has been described to regulate the proliferative properties of human MSCs, we have also assessed the expression profile of genes associated with the TGFB signaling in MDS-derived MSCs [20]. Moreover we have assessed patient MSCs' differentiation potential and their capacity to support normal CD34+ cell growth.
Materials and Methods
Patients
We studied 30 patients with de novo MDSs and 32 age- and sex-matched hematologically healthy individuals undergoing orthopedic surgery for hip replacement. Patients were classified according to the World Health Organization (WHO) and the International Prognostic Scoring System (IPSS) and were studied on diagnosis before receiving any medication [21,22]. Patient characteristics are summarized in Table 1. The study has been approved by the Ethics Committee of the University Hospital of Heraklion and informed consent was obtained from all subjects, according to the Helsinki Protocol.
UPN, unique patient number; WHO, World Health Organization; Hgb, hemoglobin; ANC, absolute neutrophil count; IPSS, International Prognostic Scoring System; RA, refractory anemia; RCMD, refractory cytopenia with multilineage dysplasia; RAEB, RA with excess blasts; MDSs, myelodysplastic syndromes.
MSC cultures
BM MSCs were expanded for 10 passages (P) as previously described [12,23]. In brief, BM aspirate was mixed with 3,000 units of preservative-free heparin (Sigma, Saint Louis, MO), diluted 1:1 with phosphate-buffered saline (Gibco Invitrogen, Paisley, Scotland), and layered over Histopaque-1077 (Sigma). The isolated BM mononuclear cells were seeded and cultured in Dulbecco's modified Eagle's medium–low glucose (DMEM-LG; Gibco Invitrogen) supplemented with 10% fetal bovine serum (FBS; Gibco Invitrogen)/100 IU/mL penicillin–streptomycin (Gibco Invitrogen) (thereafter referred as MSC medium), at 37°C/5% CO2 fully humidified atmosphere. Culture medium was replaced twice per week and the nonadherent hemopoietic cells were removed. When adherent MSCs were 80%–90% confluent, cells were detached using 0.25% trypsin–1 mM EDTA (Gibco Invitrogen), reseeded at a concentration of 2,000 cells/cm2, and further expanded for a total of 10 passages (P). P2 MSCs were induced to differentiate with appropriate media toward adipogenic, osteogenic, and chondrogenic lineages [12]. Cell-free supernatants from P2 were stored at −80°C for measurement of Dickkopf 1 (DKK1; Quantikine; R&D Systems, Minneapolis, MN), sclerostin (BI-20442; Biomedica Gruppe, Wien, Austria), and osteopontin (Quantikine; R&D Systems) levels by means of enzyme-linked immunosorbent assay. In a separate set of experiments P2 MSCs were cultured in the presence of the canonical WNT pathway activator 6-bromo-indirubin-3′-oxime (BIO). BIO was purchased from TOCRIS Bioscience (Bristol, United Kingdom) and was dissolved in dimethyl sulfoxide (DMSO).
Proliferative potential of MSCs
The formula 2 n =Nx /N 0 was used to calculate the cell population doublings (PDs) (n) at each passage based on the number of cells counted in the flask after trypsinization (Nx ) and the number of cells initially plated (N 0) [12]. The time (days) for one PD at a given passage was calculated as the ratio between the duration of culture in days and the number of the respective cell PDs (n). Cumulative PDs were calculated as previously described [24]. MSC proliferative potential was also evaluated by a methyl triazolyl tetrazolium (MTT)–based assay in P2 cells.
MSC immunophenotypic characteristics
Trypsinized MSCs from P1 to P10 were immunophenotypically characterized using anti-CD29 (4B4; Cyto-Stat/Beckman-Coulter, Fullerton, CA), anti-CD44 (J173; Immunotech/Coulter, Marseille, France), anti-CD73 (AD2; Becton Dickinson-Pharmingen, San Diego, CA), anti-CD90 (F15.42; Immunotech/Coulter), anti-CD105 (SN6; Caltag, Burlingame, CA), anti-CD146 (P1H12; Becton Dickinson-Pharmingen), anti-CD45 (IMMU19.2; Immunotech/Coulter), anti-CD14 (RMO52; Immunotech/Coulter), and anti-CD34 (QBend10; Beckman-Coulter) monoclonal antibodies [17]. Data were processed in Beckman Coulter Cytomics FC500 (Coulter, Miami, FL).
MSC differentiation capacity
MSC differentiation potential toward the osteogenic, adipogenic, and chondrogenic lineages was assessed as previously described [17]. In brief, the adipogenic differentiation was induced following 21-day culture in MSC medium supplemented with 10% FBS, 0.5 mM 3-isobutyl-1-methylxanthine, 1 μM dexamethasone, 0.2 μM indomethacin, and 10 μg/mL insulin. Adipogenesis was assessed by Oil Red O staining. MSC osteogenic differentiation was induced following 21-day culture in MSC medium supplemented with 0.1 μM dexamethasone, 0.15 mM ascorbate-2-phosphate, and 3 mM NaH2PO4. Osteogenesis was assessed by Alizarin Red S and von Kossa staining. For chondrogenic induction, 0.5×10⁶ MSCs pelleted in 15-mL tubes were cultured for 21 days in DMEM–high glucose (Gibco Invitrogen), supplemented with 6.25 μg/mL insulin, 6.25 μg/mL transferrin, 1.33 μg/mL linoleic acid, 1.25 mg/mL bovine serum albumin, 1 mM sodium pyruvate, 0.17 mM ascorbate-2-phosphate, 0.1 μM dexamethasone, 0.35 mM
Assessment of MSC senescence
Evaluation of senescence-associated gene expression by real-time reverse transcription polymerase chain reaction
Total RNA was isolated from P2, P6, and P10 MSCs using the RNeasy Mini Kit (Qiagen, Hilden, Germany). From each sample, 1 μg of RNA was reverse transcribed into cDNA by means of the SuperScript II First-Strand cDNA synthesis kit (Invitrogen). One hundred nanograms of synthesized cDNA was amplified by real-time polymerase chain reaction (PCR), in 25 μL reactions in SYBR GreenER qPCR Supermix (Invitrogen) and 10 μM of each specific primer for CDKN1A, CDKN2B, CDKN2A, RB1, TP53, and PARG1. Reactions were processed in Rotor-Gene 6000 (Qiagen) using a two-step cycling program of 45 cycles of 95°C for 15 s and 60°C for 15 s. A melting curve (62°C–95°C) was generated at the end of each run to verify specificity of the reactions. The forward and reverse primer sequences are given below: 5′-CAATGATCATGCCCAGTGCA-3′ and 5′-GATCGTGATCTGTGCCAGGA-3′ for PARG1, 5′-CCCAACTCCACCAGATAGCA-3′ and 5′-GGGATTTCCGCATCCTAGCA-3′ for CDKN2B, 5′-CCCAACGCACGAATAGTTAC-3′ and 5′-CACGGGTCGGGTGAGAGT-3′ for CDKN2A, 5′-GCAGTATGCTTCCACCAGGC-3′ and 5′-AAGGGCTTCGAGGAATGTGAG-3′ for RB1, 5′-GCAGACCAGCATGACAGATTT-3′ and 5′-GGATTAGGGCTTCCTCTTGGA-3′ for CDKN1A, and 5′-GCCCCCAGGGAGCACTA-3′ and 5′-GGGAGAGGAGCTGGTGTTG-3′ for TP53. Glyceraldehyde-3-phosphate dehydrogenase (GAPDH) was used as internal control gene, and the forward and reverse primer sequences were 5′-GCCCAATACGACCAAATCC-3′ and 5′-AGCCACATCGCTCAGACA-3′, respectively. Specific gene expression values were expressed as 2−ΔCt, where ΔCt=Ctgene of interest−CtGAPDH.
MSC relative telomere length measurement by semiquantitative real-time PCR
DNA was extracted from P2, P6, and P10 MSCs using the QIAamp DNA mini kit (Qiagen), and the relative telomere length was evaluated using a previously described semiquantitative real-time PCR method with β-globin as control single-copy gene [25]. SYBR GreenER qPCR Supermix was used for the PCRs. The relative telomere length was expressed as 2−ΔCt (ΔCt=Cttelomere−Ctβ-globin).
SA-β-gal expression
Expression of SA-β-gal in P2, P6, and P10 MSCs was determined by a commercially available detection kit (Abcam, Cambridge, United Kingdom) according to the manufacturer's instructions. The number of SA-β-gal-positive (blue) MSCs was evaluated under a phase-contrast microscope, per 100 consecutively counted MSCs. All experiments were performed in triplicate.
WNT and TGF signaling pathway PCR arrays
Total RNA was isolated from P2 MSCs from six MDS patients and six healthy controls as described previously. By using the human WNT Signaling Pathway RT2 Profiler PCR Array (SABiosciences, Qiagen) we profiled the expression of 84 genes related to WNT-mediated signal transduction. Similarly, using the human TGFB/bone morphogenic protein (BMP) Signaling Pathway RT2 Profiler™ PCR Array (SABiosciences, Qiagen) we profiled the expression of 84 genes related to TGFB/BMP-mediated signal transduction. The fold change (FC) for each gene between the group of patients and the group of controls was calculated with the ΔΔCt method (FC=2−ΔΔCt). An at least 2-fold difference in gene expression between patient and control groups was considered significant.
Validation of the PCR array results by real-time RT-PCR
To validate the PCR array results, significantly overexpressed genes were further assessed in P2 MSCs from patients and healthy controls by real-time reverse transcription–polymerase chain reaction (RT-PCR; SYBR GreenER qPCR Supermix), using the specific primers of the PCR array for casein kinase 1-gamma 1 (CSNK1G1), kringle containing transmembrane protein 1 (KREMEN1), WNT5B, WNT5A, and GAPDH (SABiosciences, Qiagen). Reactions were performed in Rotor-Gene 6000 using a two-step cycling program consisting of 45 cycles of 95°C for 15 s and 60°C for 15 s. A melting curve (62°C–95°C) was generated at the end of each run to verify specificity of the reactions.
Assessment of osteogenesis- and adipogenesis-related gene expression by real-time RT-PCR
P2, P6, and P10 MSCs from patient and control cultures were assessed for the expression of genes related to osteogenesis [alkaline phosphate (ALP), osteocalcin (OSC), bone sialoprotein (BSP), distal-less homeobox protein 5 (DLX5), Runt-related transcription factor 2 (RUNX2), and osterix (OSX)] and adipogenesis [CCAAT/enhancer-binding protein alpha (CEBPA) and peroxisome proliferator activated receptor-gamma (PPARG)]. RNA was isolated and reverse transcribed as described previously, and 20 ng of cDNA was amplified in each PCR. PCR was performed with KAPA SYBR FAST qPCR Kit Master Mix (Kapa Biosystems, Boston, MA) and 10 μM of each primer. We used a Rotor-Gene 6000 two-step cycling program consisting of 40 cycles of 95°C for 3 s and 60°C for 30 s. A melting curve (62°C–95°C) was generated at the end of each run to verify specificity of the reactions. The forward and reverse primer sequences for PCR amplification were as follows: 5′-CCTGCAGCTTCAGAAGCTCAA-3′ and 5′-ACTGTGGAGACACCCATCCC-3′ for ALP, 5′-GAGGGCAGCGAGGTAGTGAAGA-3′ and 5′-CGATGTGGTCAGCCAACTCG-3′ for OSC, 5′-GGGCAGTAGTGACTCATCCGAAG-3′ and 5′-CTCCATAGCCCAGTGTTGTAGCAG-3′ for BSP, 5′-GCCACCAACCAGCCAGAGAA-3′ and 5′-GCGAGGTACTGAGTCTTCTGAAACC-3′ for DLX5, 5′-GGCCCACAAATCTCAGATCGTT-3′ and 5′-CACTGGCGCTGCAACAAGAC-3′ for RUNX2, 5′-GCCAGAAGCTGTGAAACCTC-3′ and 5′-TAACCTGATGGGGTCATGGT-3′ for OSX, 5′-AAGAAGTCGGTGGACAAGAACAC-3′ and 5′-ACCGCGATGTTGTTGCG-3′ for CEBPA, and 5′-TCAGGGCTGCCAGTTTCG-3′ and 5′-GCTTTTGGCATACTCTGTGATCTC-3′ for PPARG. GAPDH was used as normalization control and the forward and reverse primer sequences were 5′-CATGTTCCAATATGATTCCACC-3′ and 5′-GATGGGATTTCCATTGATGAC-3′, respectively.
Assessment of Jagged-1 by real-time RT-PCR
MSCs at P2 derived from patients and healthy controls were used to evaluate the expression of Jagged-1. RNA was isolated and reverse transcribed as before. Twenty nanograms of cDNA was amplified in each PCR. PCR was performed with KAPA SYBR FAST qPCR Kit Master Mix (Kapa Biosystems) and 10 μM of each primer. A Rotor-Gene 6000 two-step cycling program consisting of 40 cycles of 95°C for 3 s and 60°C for 30 s was used. A melting curve (62°C–95°C) was generated at the end of each run to verify specificity of the reactions. The forward and reverse primer sequences were as follows: 5′-CCAAGCAGCCGGCGTATA-3′ and 5′-TGTTTTGTCGGCGTGCC-3′. Relative expression levels were normalized using GAPDH as described previously.
Evaluation of MSC hematopoietic supportive capacity
A previously described two-stage culture procedure was used to test the capacity of patient MSCs to support normal hematopoiesis [26,27]. In brief, confluent MSC stromal layers from patients and controls, grown in 25 cm2 flasks, were irradiated (10 Gy); recharged with immunomagnetically sorted (Miltenyi Biotec, Gladbach, Germany) normal allogeneic BM CD34+ cells (5×10⁴) in Iscove's modified Dulbecco's medium (IMDM; Gibco Invitrogen), supplemented with 10% FBS and 100 IU/mL penicillin–streptomycin; and incubated in a 37°C/5% CO2 fully humidified atmosphere. The cocultures were kept for a total of 5 weeks. At weekly intervals cultures were fed by demi-depopulation and the nonadherent cells (NACs) were counted and assayed for clonogenic progenitor cells as previously described [26,27]. In brief, the NACs were cultured in 35-mm Petri dishes in 1 mL IMDM supplemented with 30% FBS, 1% bovine serum albumin (Gibco Invitrogen), 10−4 M mercaptoethanol (Sigma), 0.075% sodium bicarbonate (Gibco Invitrogen), 2 mM
Statistical analysis
Data were analyzed using the GraphPad Prism Statistical PC program (GraphPad Software, San Diego, CA). Grouped data were expressed as mean±1 standard deviation and compared using the non-parametric Mann–Whitney U-test. The two-way analysis of variance was used to define differences between patients and controls in gene expression, relative telomere length, and SA-β-gal positivity through passages as well as in total CFU-GM, CFU-E, and total CFU in culture supernatants time-course. The chi-square test was used for the evaluation of the homogeneity of patient and control groups in age and sex distribution and for assessment of differences between patients and controls displaying detectable sclerostin.
Results
Defective growth characteristics of culture-expanded MDS-derived MSCs
MSC cultures were successfully expanded in all MDS patients although at a slower rate in comparison to healthy subjects. Specifically, MSC doubling time during P2–P10 was significantly increased in MDS patients (n=30) compared with controls (n=32) (P<0.05). MSC PD time ranged from 5.88±2.20 (P2) to 12.99±3.16 days (P10) in patients and from 3.32±0.97 (P2) to 9.82±2.82 days (P10) in controls (Fig. 1A). When we analyzed separately MSCs derived from either low-risk MDS (low/intermediate-1 IPSS) (n=23) or high-risk MDS (intermediate-2/high IPSS) (n=7), we similarly observed significantly higher PD time during P2–P10 as compared with controls (P<0.05 and P<0.05, respectively). Specifically, PD time ranged from 5.52±2.14 (P2) to 13.22±3.32 days (P10) in low-risk MDS-derived MSCs and from 7.052±2.13 (P2) to 12.23±2.66 days (P10) in high-risk MDS-derived MSCs. No significant difference could be detected in PD time throughout culture between MSCs from the two risk groups. In accordance with these observations, long-term growth curves demonstrate a reduced proliferative rate of MDS-derived MSCs (Fig. 1B). Moreover, the maximum cumulative PDs were significantly reduced in patient cultures (10.91±3.96) compared with healthy subjects (23.88±4.57, P<0.05) (Fig. 1C). This finding remained significant when we looked at MSCs derived from (n=23) patients with low-risk MDSs and (n=7) patients with high-risk MDSs separately (P<0.05 and P<0.05, respectively). The maximum cumulative PDs for MSCs derived from low-risk MDSs and high-risk MDSs were 11.20±3.86 and 9.31±4.29, respectively. Notably no difference could be detected in maximum cumulative PDs between the two risk groups (Fig. 1C).
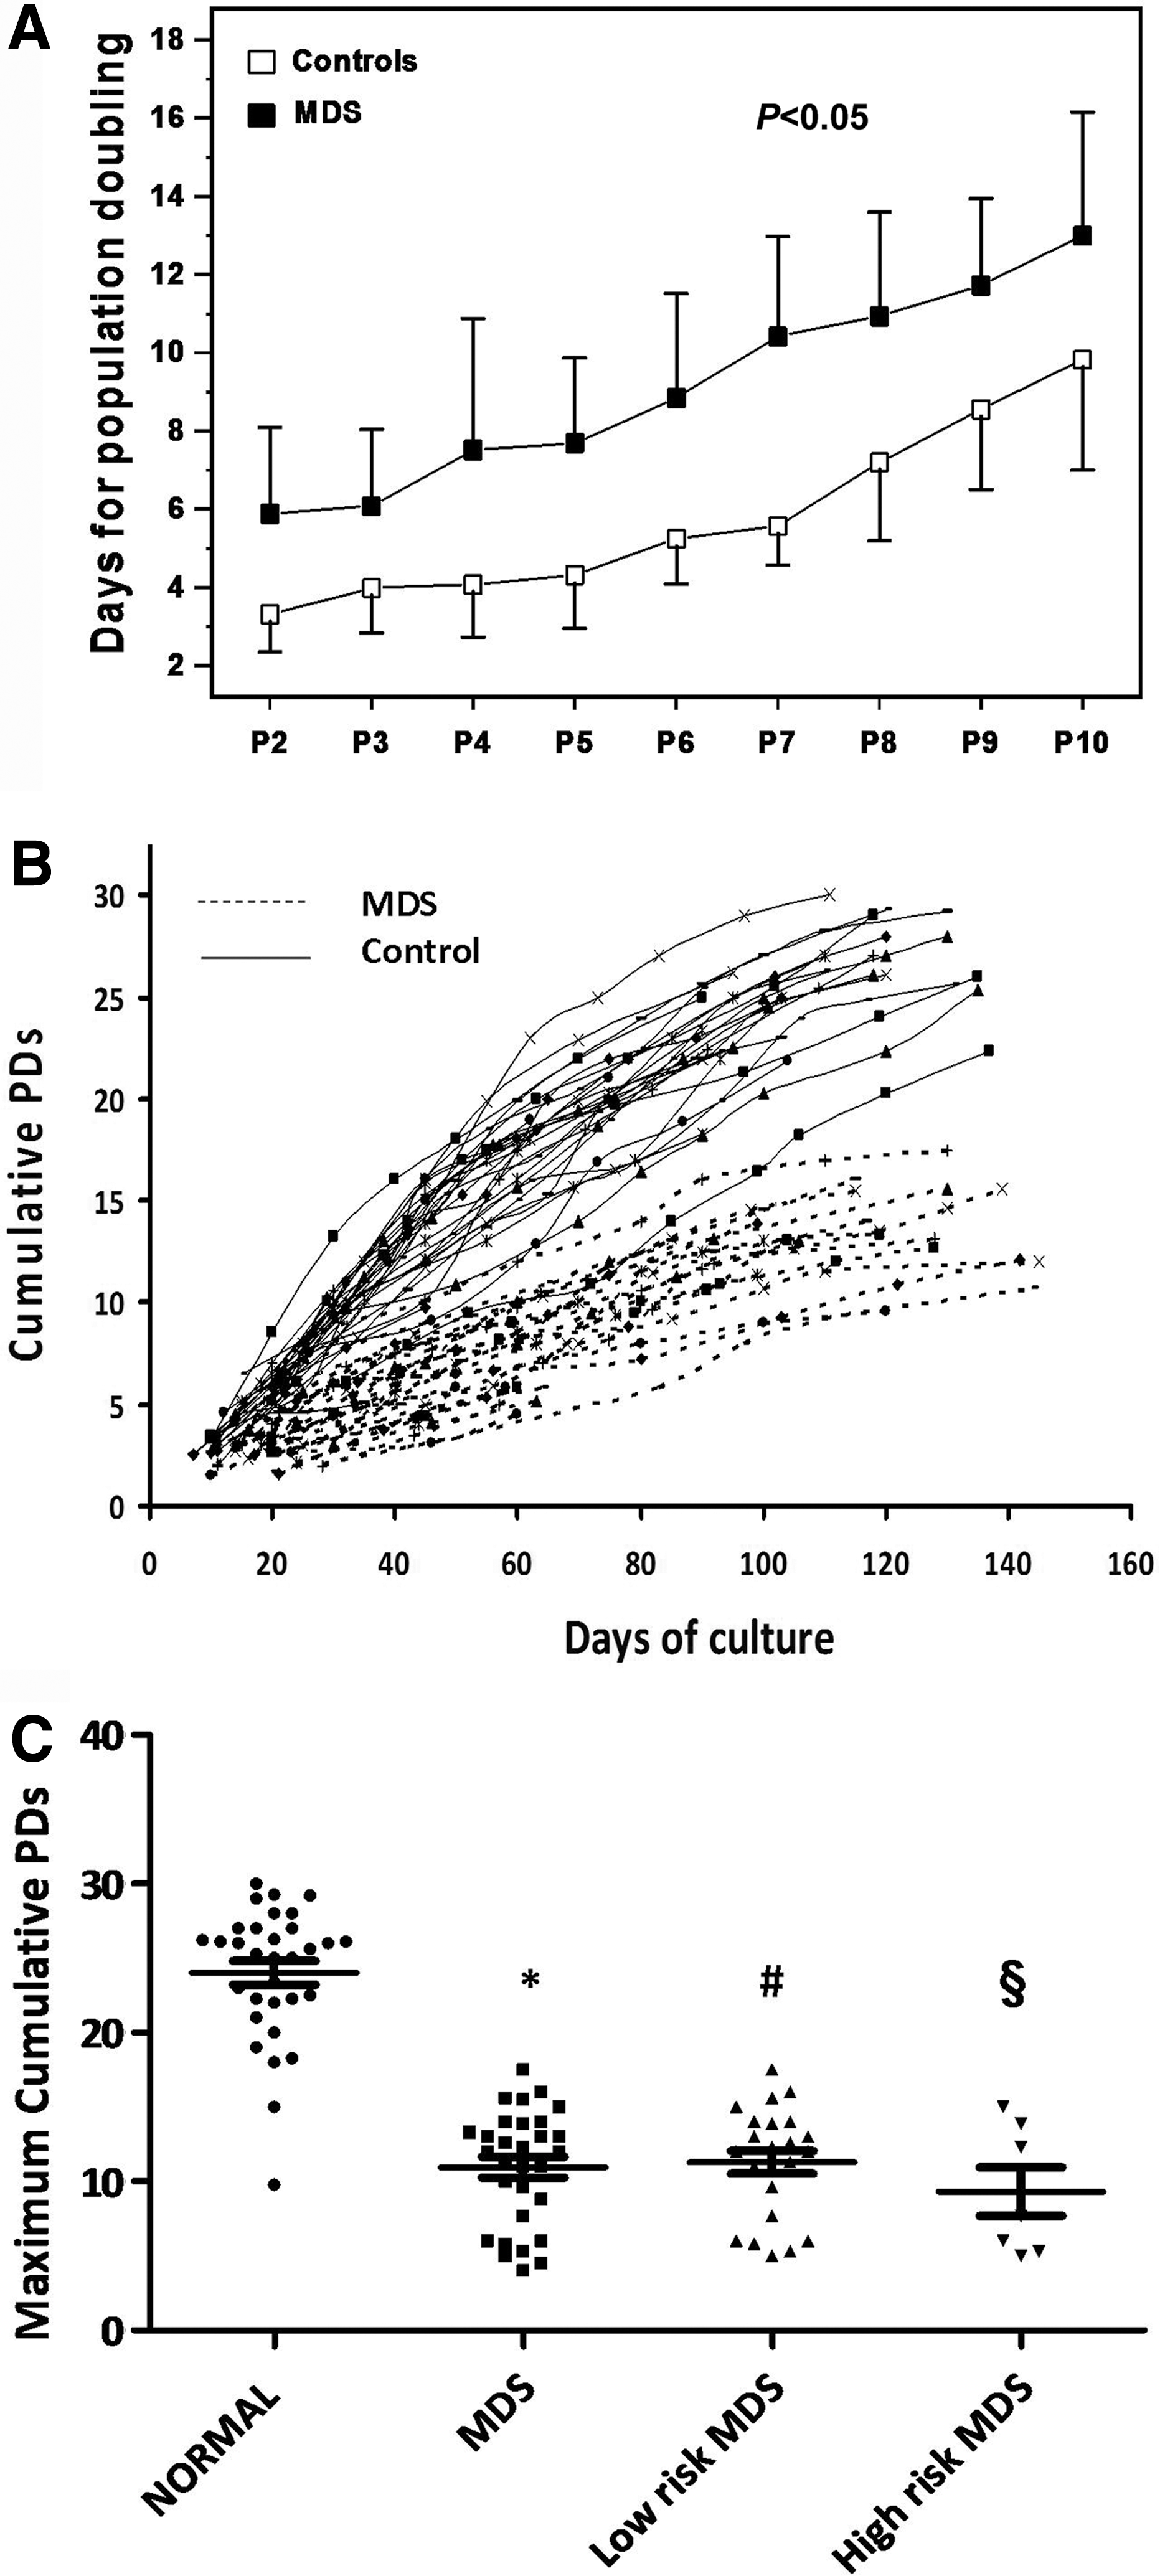
Growth characteristics of MSCs from myelodysplastic syndrome (MDS) patients and healthy individuals. Graph
MSCs displayed the characteristic spindle-like morphology and the immunophenotypic analysis at the end of each passage demonstrated that cultures contained a homogenous cell population positive for CD73, CD90, CD146, CD105, CD29, and CD44 surface antigens and negative for the hematopoietic markers CD45, CD14, and CD34. In accordance with our previously reported data, P2 MSCs from MDS patients were able to differentiate into adipogenic, osteogenic, and chondrogenic lineages as was shown by the respective cytochemical staining.
Decreased senescence characteristics in MSCs of MDS patients
To evaluate whether the increased time for PDs in MSC cultures of MDS patients is due to accelerated cell senescence, we assessed a number of senescence-associated indices in cultures of MDS patients in comparison to healthy controls.
Increased telomere length of MSCs from MDS patients
The relative telomere length of MSCs through P2–P10 was evaluated in 15 MDS patients and 15 age-matched healthy controls. The relative telomere length of MSC time-course was significantly higher in MDS patients compared with healthy subjects (P<0.05), suggesting that the defective PDs of MSCs in MDS patients is unlikely to be due to accelerated telomeric loss (Fig. 2A). By analyzing further the mean relative telomere length of MSCs per passage, a statistically significant difference was obtained in all passages tested (P2, P6, and P10) between patients (9,660±2,884, 6,277±1,630, and 4,790±1,192, respectively) and controls (7,711±2,993, 5,071±1,005, and 3,969±954, respectively; P<0.05, P<0.05, and P<0.05, respectively). Further, to characterize patients' MSC telomere length as appropriate or inappropriate for a given age, we defined the observed/predicted relative telomere length ratio (O/P ratio) according to the equation derived from the linear regression analysis of the correlation between MSC relative telomere length and age (years) of the controls. The mean O/P telomere length ratio of MDS patients at P2, P6, and P10 (1.261±0.375, 1.219±0.3285, and 1.184±0.297, respectively) was higher that the upper 95% confidence limits of the healthy controls (upper and lower 95% confidence limits 1.215 and 0.785, 1.108 and 0.892, and 1.133 and 0.867, respectively; P<0.05, P<0.05, and P<0.05, respectively), corroborating further the increased telomere length of MSCs in MDS patients.
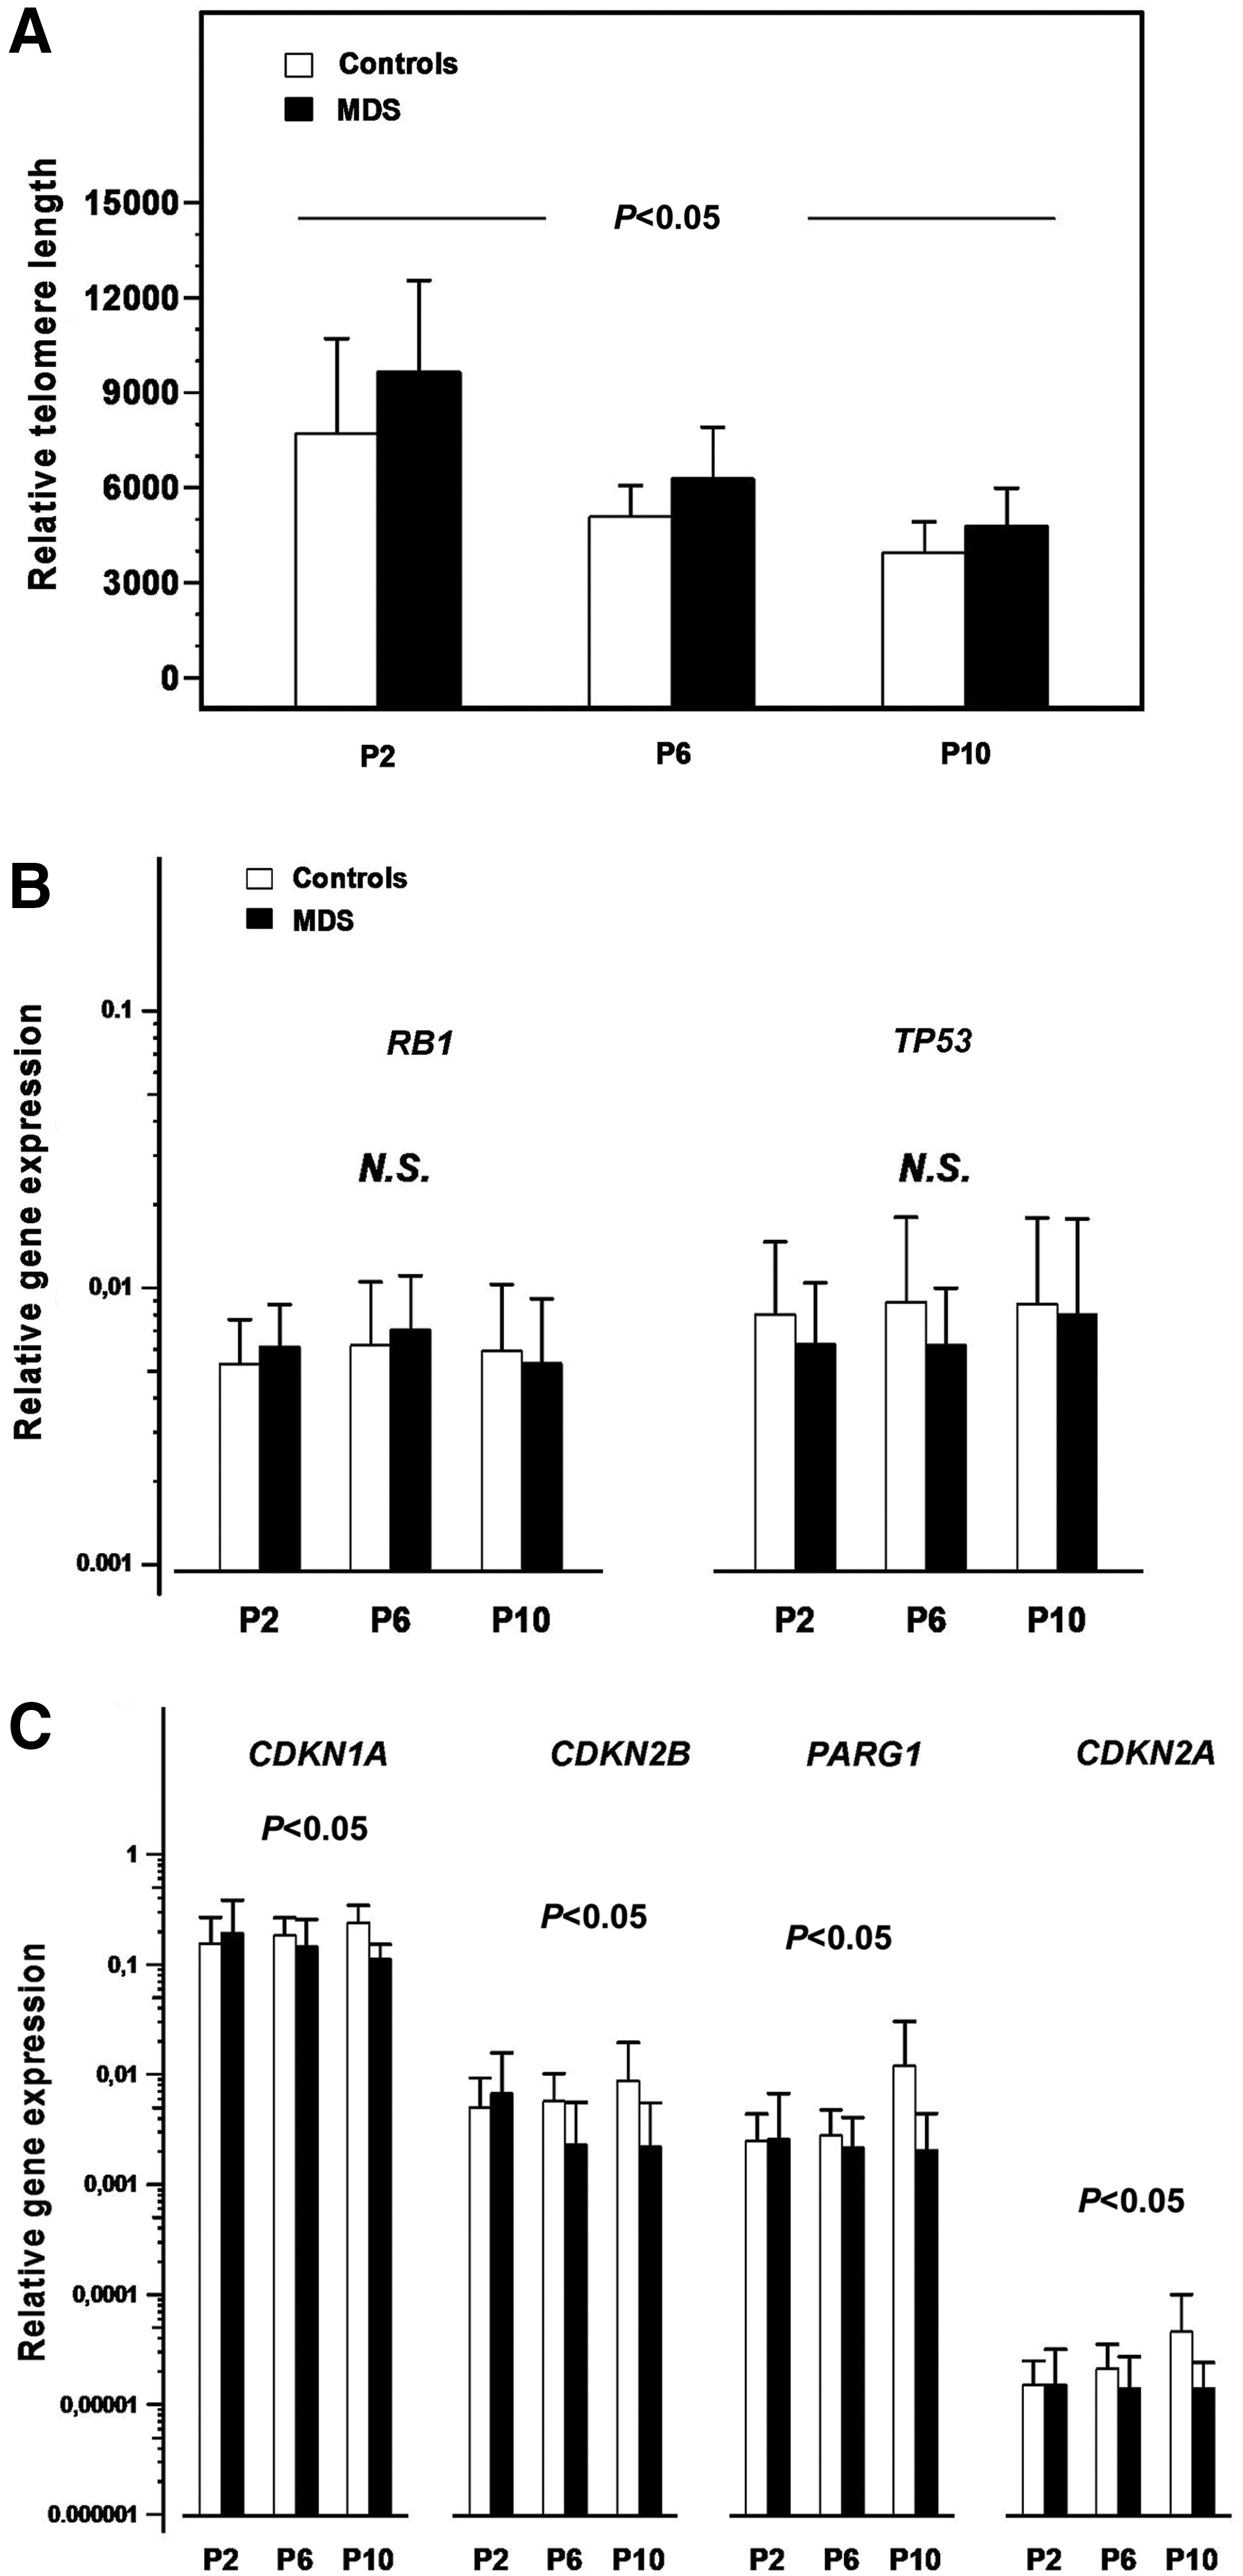
Senescence characteristics of MSCs from MDS patients and healthy individuals.
Decreased expression of senescence-associated genes in MDS MSC cultures
As shown in Figure 2B, no statistically significant difference was documented between patients (n=15) and controls (n=19) in RB1 and TP53 expression time-course. However, a statistically significant decreased expression of CDKN1A, CDKN2B, CDKN2A, and PARG1 was observed in MDS patients compared with healthy controls through P2–P10 (P<0.05, P<0.05, P<0.05, and P<0.05, respectively), suggesting decreased expression of senescence-associated genes in MDS MSC culture time-course (Fig. 2C).
SA-β-gal staining
The number of SA-β-gal-positive cells through P2–P10 did not differ significantly between MDS patients (n=30) and healthy controls (n=32). Specifically, the SA-β-gal-positive cells ranged from 20.72%±11.09% at P2 to 49.40%±13.19% in MDS patients versus 18.66%±7.03% at P2 to 48.81%±13.94% at P10 in healthy controls (P=0.094).
Upregulation of the non-canonical WNT pathway in MSCs of MDS patients
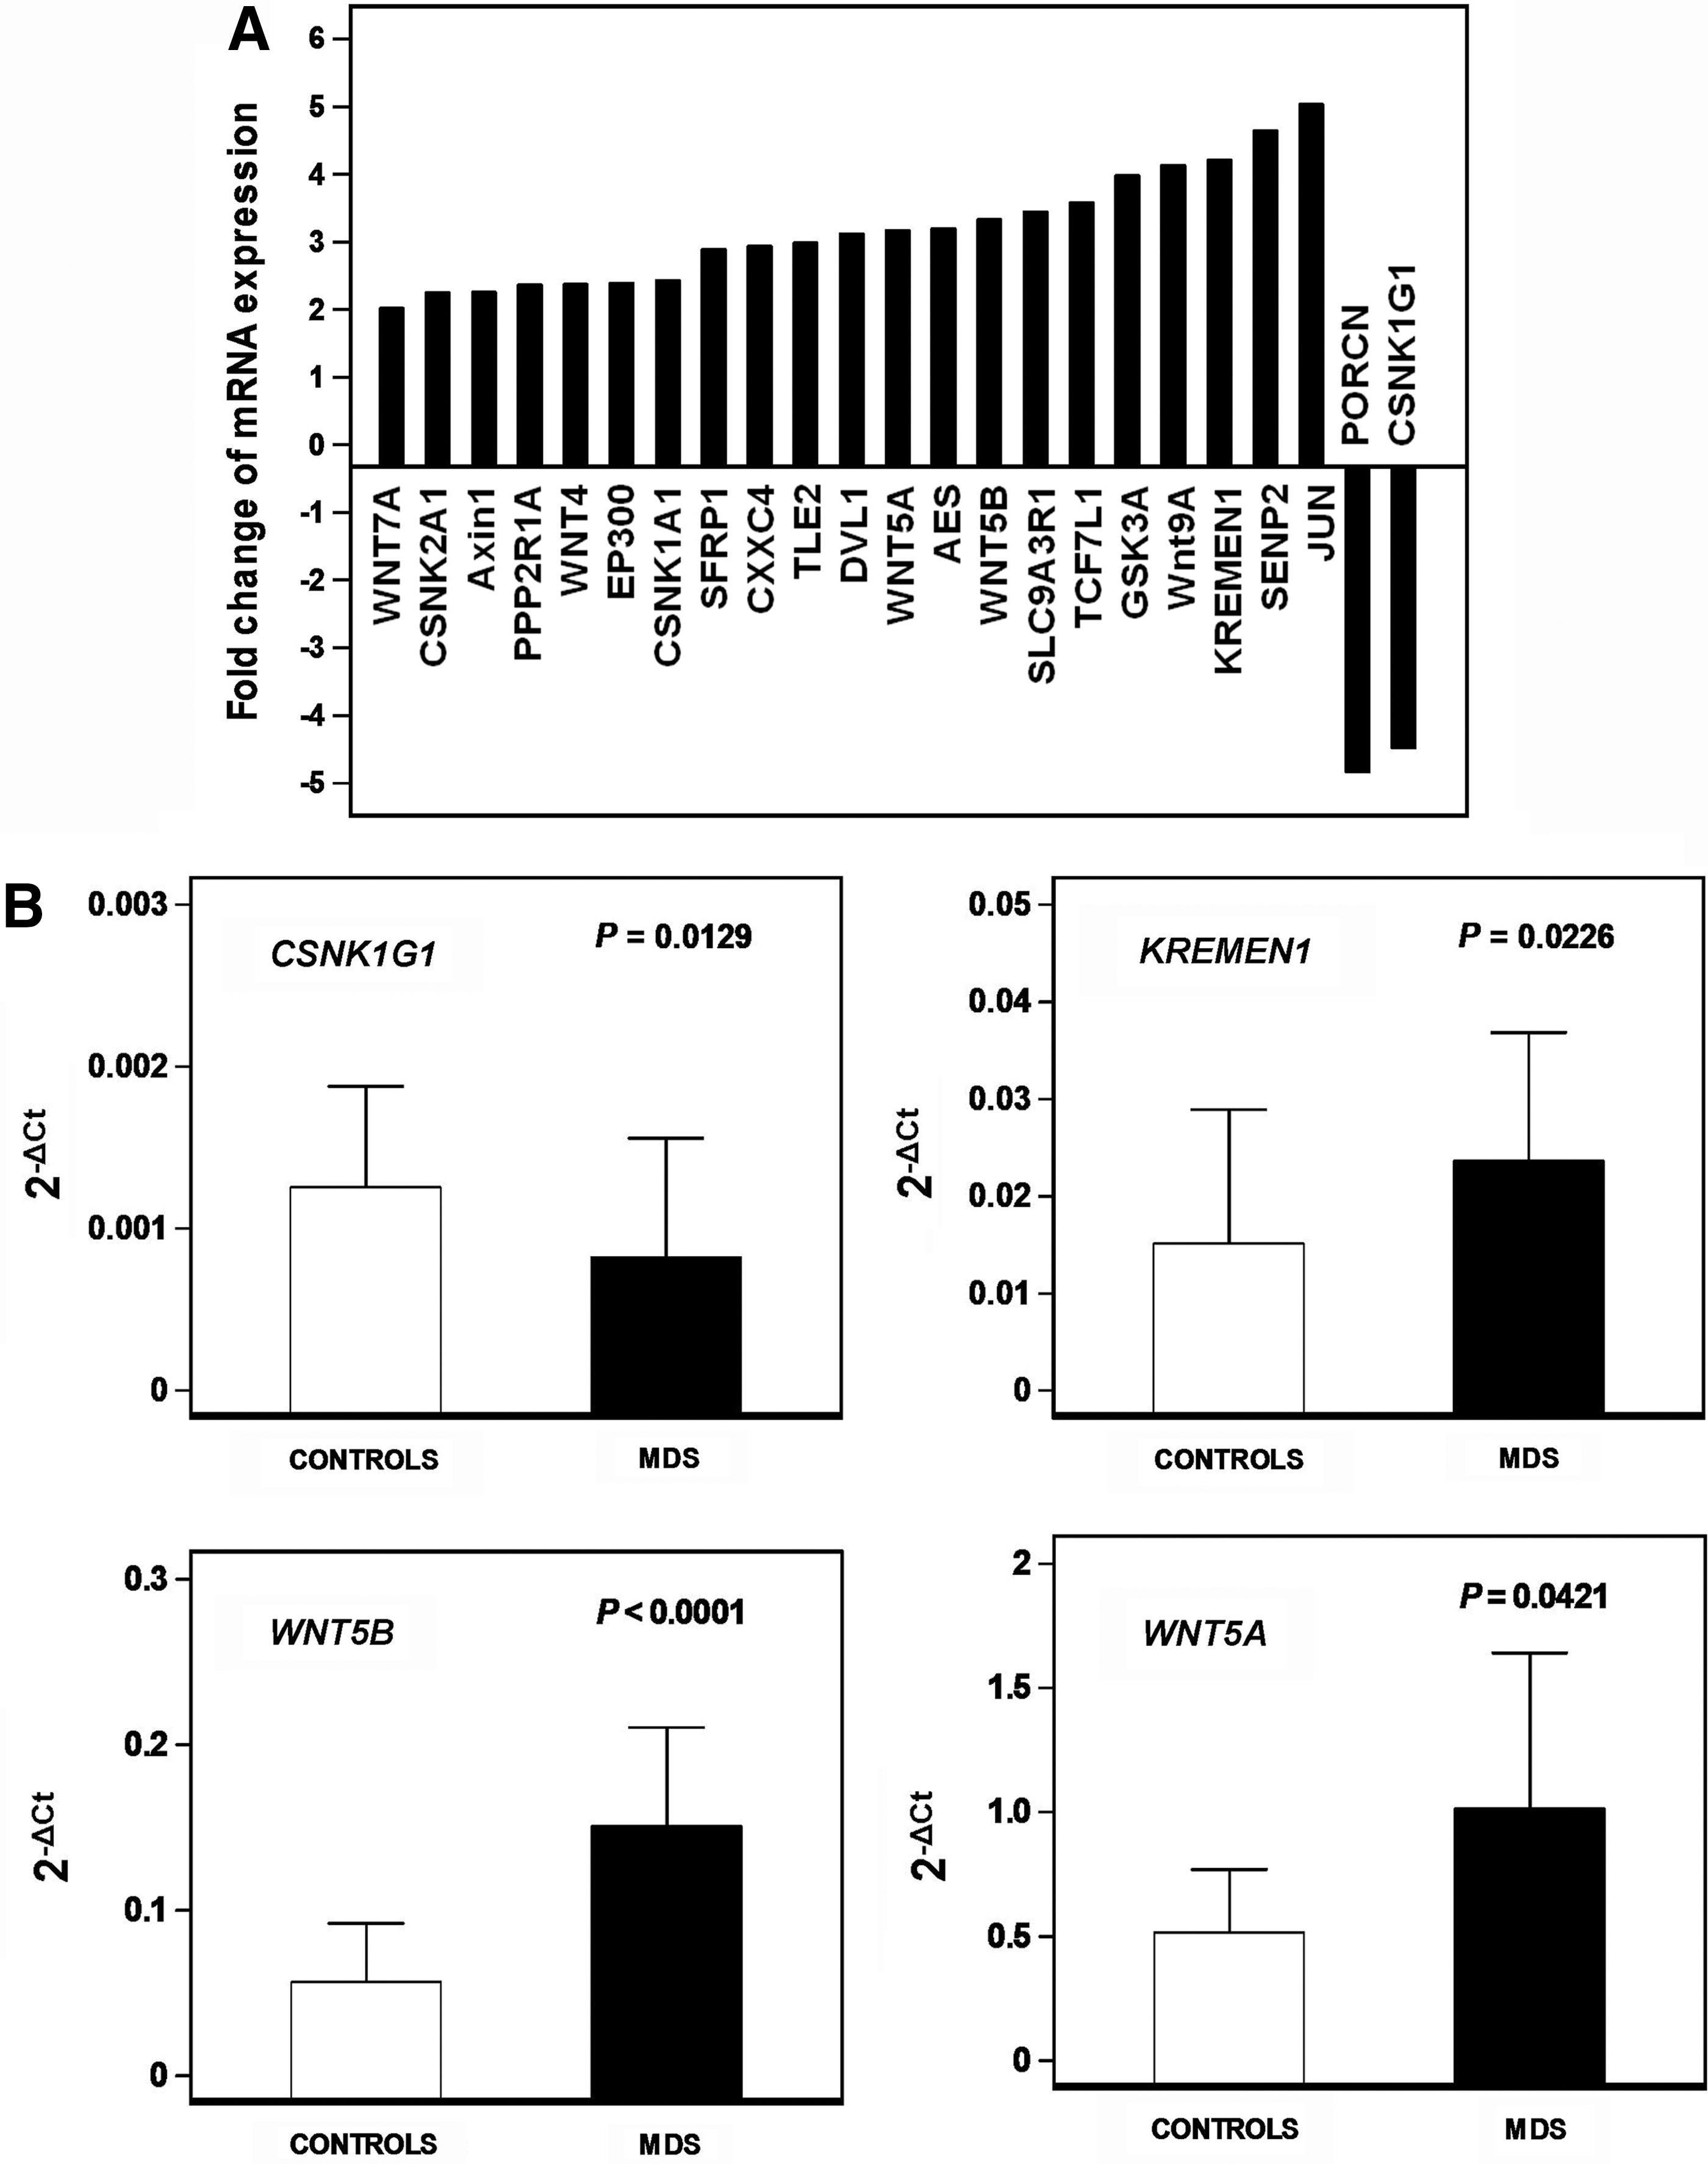
To determine whether the proliferative defect of MSCs in MDS patients might be associated with abnormal WNT-mediated signaling, we investigated the expression of genes implicated in the WNT pathways by means of a PCR array. An at least 2-FC in gene expression between patient and control groups was considered significant. Transcripts of 23 out of 84 WNT-related genes were differentially expressed between patients and controls (Fig. 3A). These genes were further categorized on the basis of their function as canonical or non-canonical WNT signaling molecules, signaling molecules associated with both pathways, canonical WNT inhibitors, and molecules implicated in cell cycle and cellular homeostasis. Among the non-canonical WNT pathway signaling molecules, a significant upregulation was observed in WNT5A (FC 3.17), WNT5B (FC 3.33), WNT9A (FC 4.14), WNT4 (FC 2.3757), and WNT7A (FC 2.0174). Additionally, a significant decrease was observed in the expression of CSNK1G1 (FC −4.4847) and porcupine homolog (PORCN; FC −4.8372), representing genes indispensable for WNT protein secretion. An upregulation was observed in the Disheveled-1 (DVL1; FC 3.12) gene that is implicated in both WNT pathways. A significant increase was also identified in genes implicated in canonical WNT pathway inhibition, namely, KREMEN1 (FC 4.21), SUMO1/sentrin/SMT3 specific peptidase 2 (SENP2; FC 4.64), amino-terminal enhancer of split (AES; FC 3.2), glycogen synthase kinase 3-alpha (GSK3A; FC 3.98), AXIN1 (FC 2.26), CSNK1A1 (FC 2.43), CSNK2A1 (FC 2.25), protein phosphatase 2 regulatory subunit A alpha isoform (PPP2R1A; FC 2.3674), transducing-like enhancer of split 2 (TLE2; FC 2.99), secreted frizzled-related protein 1 (SFRP1; FC 2.8962), and CXXC finger 4 (CXXC4; FC 2.9366). Among genes implicated in cell cycle and cellular homeostasis, an upregulation was observed in the solute carrier family 9 member 3 regulator 1 (SLC9A3R1; FC 3.45), JUN (FC 5.03), transcription factor 7-like 1 (TCF7L1; FC 3.58), and E1A binding protein p300 (EP300; FC 2.39). Taken together these data indicate upregulation of genes contributing to the non-canonical WNT pathway and downmodulation of the canonical WNT signaling due to downregulation of stimulatory and upregulation of inhibitory canonical WNT molecules. As regards to the TGFB/BMP PCR array, no significant changes were observed in gene transcripts between patient and normal MSCs.
Relative expression of genes involved in WNT signaling pathways in MSC cultures of MDS patients and normal subjects.
To validate the data obtained from the PCR array analysis, we evaluated the mRNA expression of four representative genes differentially expressed between patients and controls, namely, the canonical WNT activator CSNK1G1, the canonical WNT inhibitor KREMEN1, and the non-canonical WNT activators WNT5B and WNT5A, in P2 MSCs from MDS patients (n=15) and healthy subjects (n=15). Results, normalized according to GAPDH gene expression, are depicted in Figure 3B. In accordance with the PCR array data, the mean relative mRNA expression of CSNK1G1 was significantly decreased in patients (0.0008±0.00073) compared with controls (0.001256±0.000624, P<0.05) whereas the expression of KREMEN1, WNT5B, and WNT5A was increased in patients (0.02364±0.01323, 0.1508±0.05958, and 1.016±0.6261, respectively) compared with controls (0.01518±0.01375, 0.05661±0.03556, and 0.5163±0.2529, respectively; P<0.05, P<0.05, and P<0.05, respectively).
Increased DKK1 levels in MSC culture supernatants
Sclerostin and DKK1 are secreted regulators of the canonical WNT signaling by targeting and antagonizing lipoprotein receptor-related proteins (LRPs). We have therefore studied sclerostin and DKK1 levels in P2 MSC culture supernatants of MDS patients (n=30) and healthy controls (n=32). Sclerostin was detectable in 5/30 MDS patients (16.67%) and 10/32 healthy controls (31.25%), suggesting a nonstatistically significant difference (P=0.1803) (Fig. 4A). DKK1 levels, however, were significantly increased in patients (5908.81±3962.04 pg/mL) compared with healthy individuals (3736.72±2763.65 pg/mL; P<0.05), indicating further the repression of the canonical WNT signaling in MSCs of MDS patients (Fig. 4B).

Sclerostin and Dickkopf 1 (DKK1) levels in culture supernatants of P2 MSC cultures from MDS patients (n=30) and healthy controls (n=32).
Decreased differentiation-associated gene expression in MSC cultures of MDS patients
It has been shown that the canonical WNT signaling promotes the self-renewal capacity and undifferentiated state of BM MSCs [28]. Since undifferentiated MSCs are primed toward the adipogenic and osteogenic lineages among others [29], we further examined the expression of osteogenesis- and adipogenesis-associated genes in undifferentiated MSC cultures from MDS patients (n=15) and healthy controls (n=15) through passages. However, the expression of osteogenesis-related genes ALP, OSC, BSP, DLX5, RUNX2, and OSX through P2–P10 was significantly decreased in MDS patients compared with controls (P<0.05, P<0.05, P<0.05, P<0.05, P<0.05, and P<0.05, respectively) (Fig. 5A). Similarly, the adipogenesis-related genes CEBPA and PPARG were significantly decreased in patient P2–P10 cultures compared with controls (P<0.05 and P<0.05, respectively) (Fig. 5B). These data might indicate a defect in the lineage-priming program of BM MSCs in MDS patients at least toward the osteoblastic and adipocytic lineages.
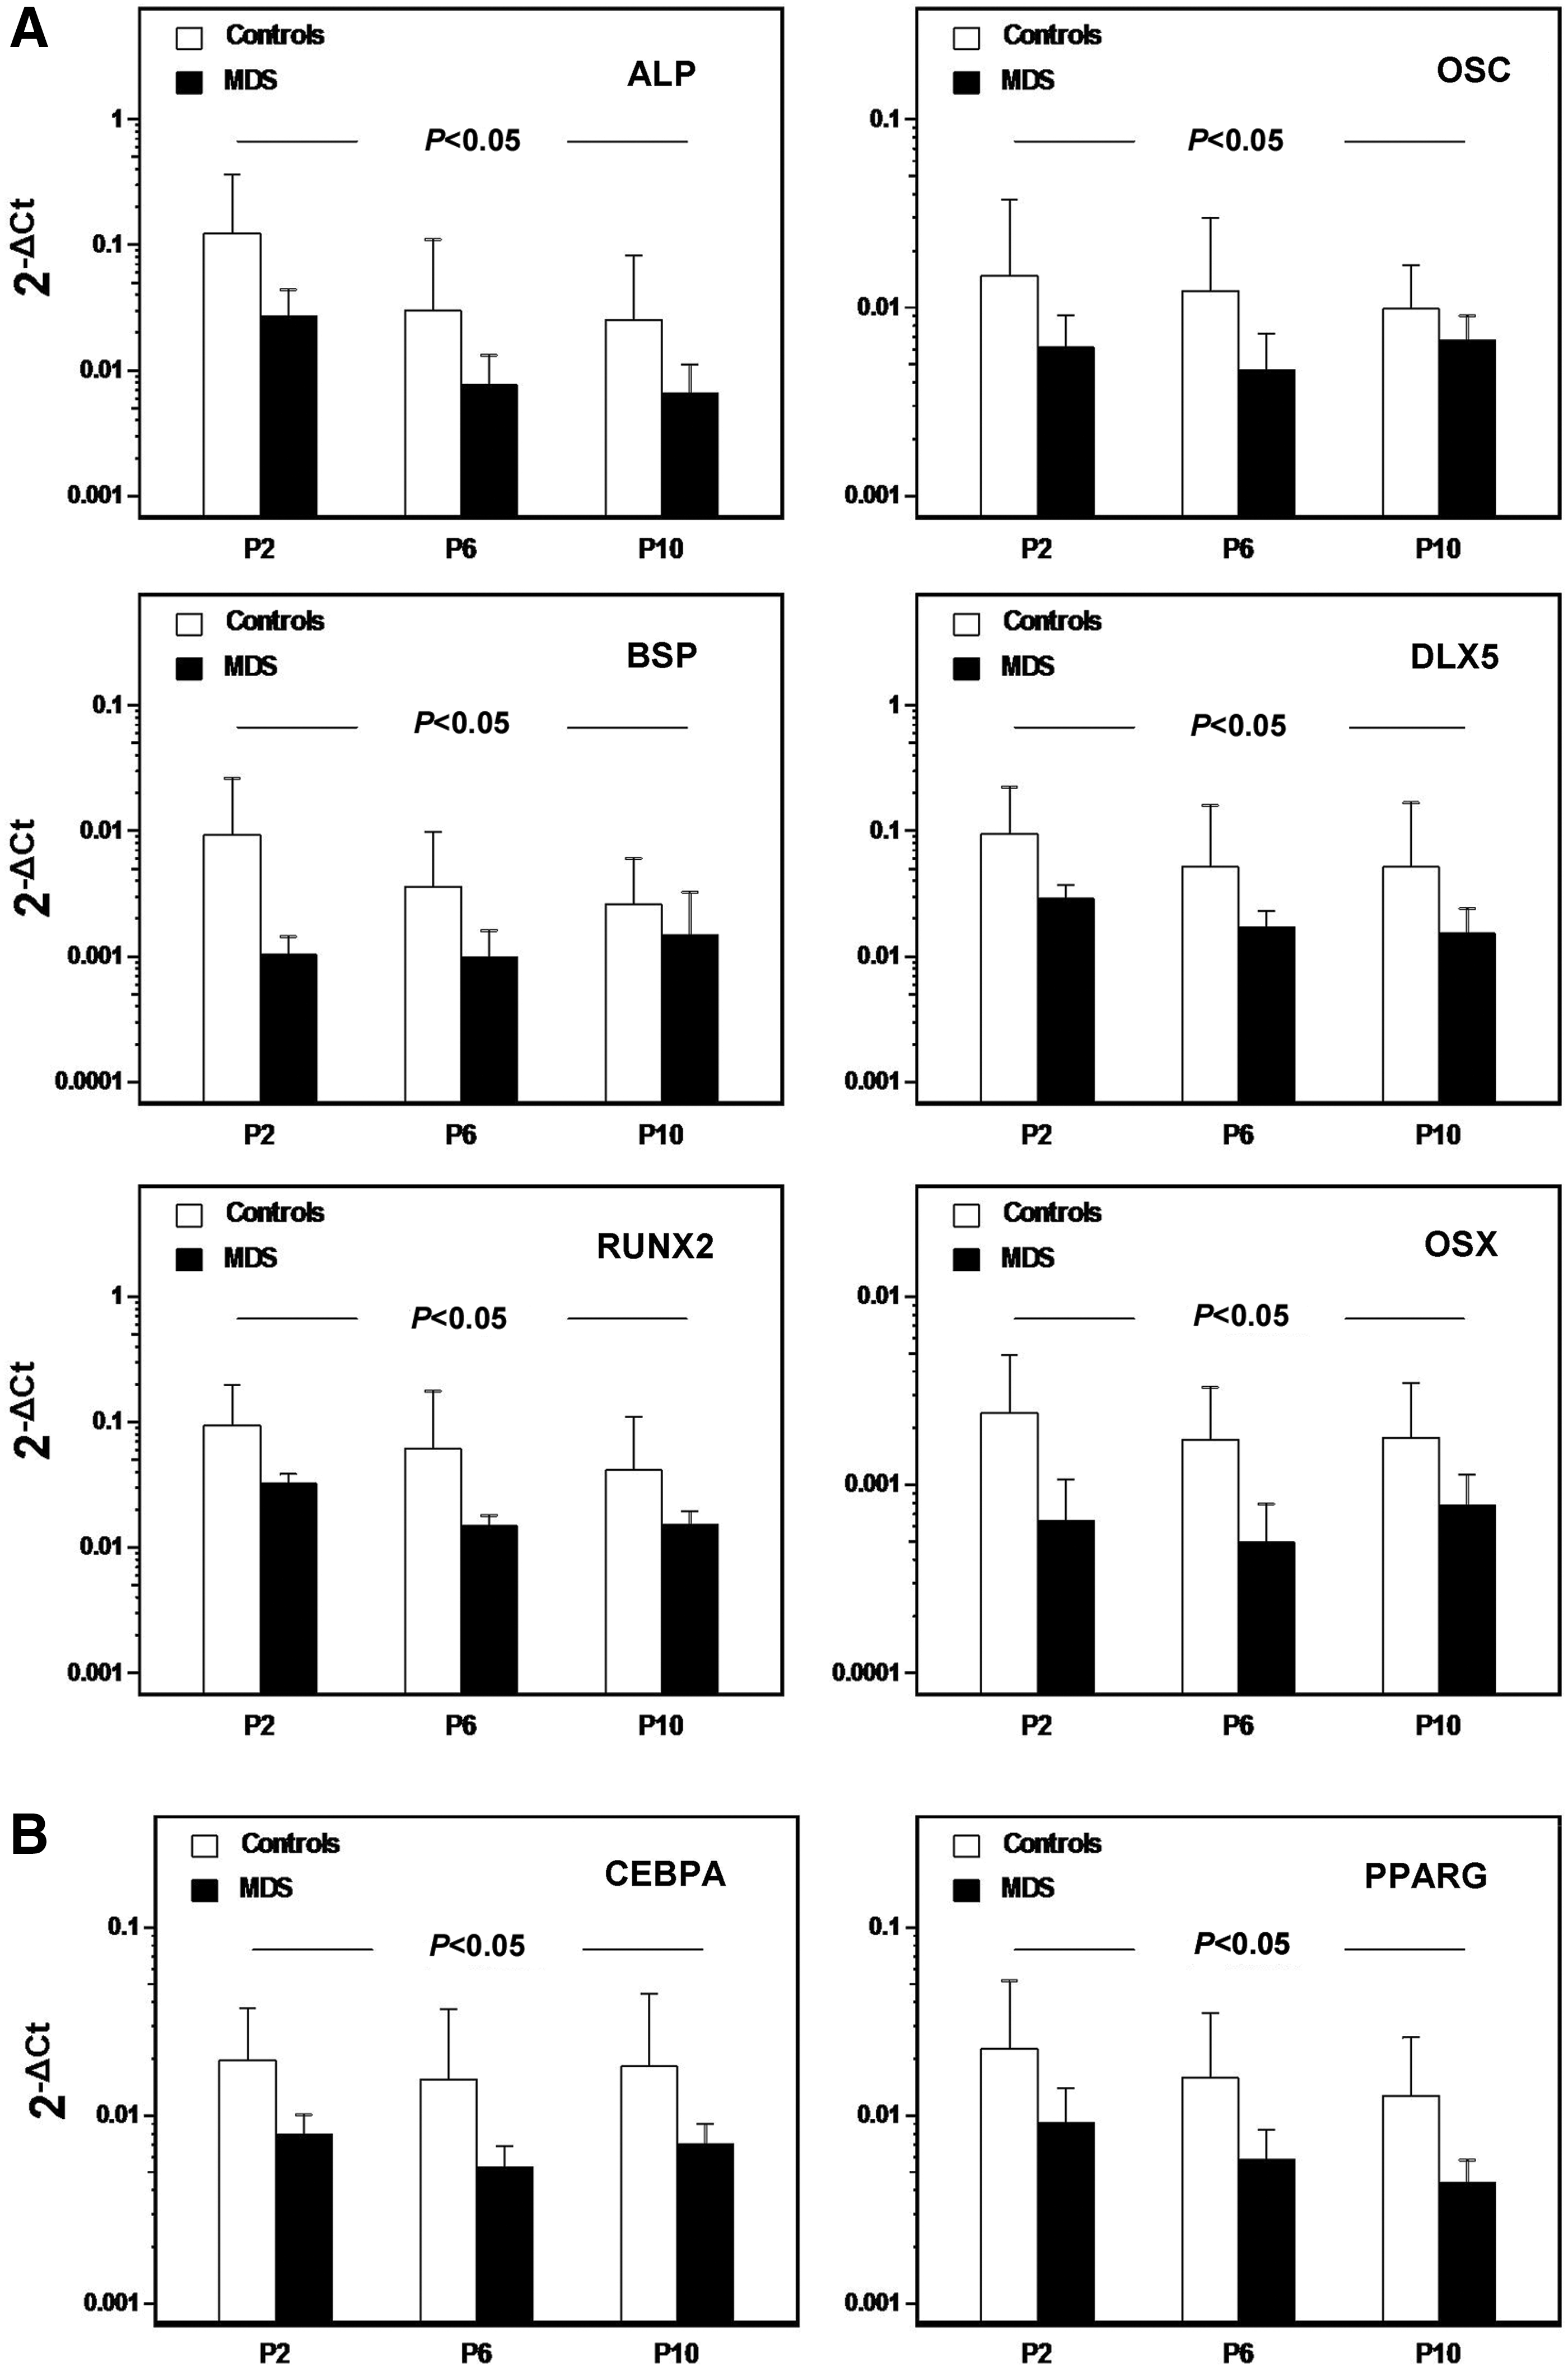
Osteogenesis- and adipogenesis-associated gene expression in undifferentiated MSCs from MDS patients and healthy controls through passages. The bars represent the mean (+1 SD) relative mRNA expression of the osteogenesis-related genes ALP, OSC, BSP, DLX5, RUNX2, and OSX
Pharmacological activation of canonical WNT signaling in MDS-derived MSCs increases their proliferative potential and upregulates the expression of early osteoblastic genes
To further explore the connection between abnormal WNT signaling and defective proliferative potential of MDS-derived MSCs, we activated canonical WNT pathway in patient MSCs and subsequently evaluated cell proliferation. To enhance canonical WNT signaling, we exposed cells to BIO, a specific pharmacological inhibitor of glycogen-synthase-kinase (GSK)-3β, previously shown to effectively stabilize β-catenin [30,31].
Thus, to measure the effects of enhanced canonical WNT signaling on cell proliferation, P2 MSCs (n=6) were cultured for 20 days in the presence of 10, 100, 200, or 500 nM of BIO. Cells were repeatedly stimulated every 48 h with BIO. As controls, MSCs treated with the vehicle DMSO were used. Cell proliferation was assessed using MTT at multiple time points throughout culture. BIO at 10 and 100 nM resulted in a significant increase in cell numbers on day 12 (P<0.05 and P<0.05, respectively), on day 16 (P<0.05 and P<0.05, respectively), and on day 20 (P<0.05 and P<0.05, respectively), whereas BIO treatment had no significant effect in cell proliferation on days 1, 6, and 8 (Fig. 6A). BIO at 200 nM leads to a significant increase in living cell numbers on days 16 and 20 (P<0.05 and P<0.05, respectively), while it did not affect cell proliferation on days 1, 6, 8, and 12 (Fig. 6A). On the other hand BIO at 500 nM significantly reduced living cell numbers on days 12, 16, and 20 (P<0.05, P<0.05, and P<0.05, respectively), but had no effect on cell proliferation on days 1, 6, and 8 (Fig. 6A). A reduction in MSC numbers by prolonged exposure to >400 nM BIO has previously been reported by Krause et al. [30]. The authors suggested that this may be due to mitosis inhibition by high doses of BIO and that it does not result from increased cell apoptosis. In line with this last observation, we found that the reduced MSC numbers after exposure to 500 nM BIO was not due to increased apoptotic cell death (data not shown).

Effects of 6-bromo-indirubin-3′-oxime (BIO) on patient MSCs' proliferative potential and osteogenesis-associated gene expression.
Activation of canonical WNT signaling by the GSG-3β inhibitor LiCl has been shown to prime undifferentiated MSCs toward the osteoblastic lineage [32]. In view of this observation and provided that in MDS-derived MSCs the canonical WNT signaling is downregulated, we investigated whether the reduced osteoblastic lineage priming of MDS-derived MSCs might be attributed, at least in part, to the impaired canonical WNT signaling. Thus, based on the existing literature [30,31] we exposed undifferentiated P2 MDS-derived MSCs to 100 or 200 nM BIO for 5 days or to 2 or 5 μM BIO for 48 h and subsequently evaluated the expression of the master gene of osteogenesis RUNX2 and its transactivator DLX5. BIO at 100 or 200 nM had no significant effect on the expression of RUNX2 or DLX5 by MDS-derived MSCs, as compared with DMSO-treated cells (data not shown). However, BIO at 2 and 5 μM resulted in a significant upregulation in the expression of RUNX2 (P<0.05 and P<0.05, respectively) and DLX5 (P<0.05 and P<0.05, respectively) (Fig. 6B). No significant difference could be detected in RUNX2 and DLX5 levels between cells treated with 2 and 5 μM BIO (P=0.1262 and P=0.1320, respectively).
Taken together we have demonstrated that enhancement of canonical WNT signaling in MDS-derived MSCs improves their proliferative potential and upregulates the expression of early osteoblastic genes. Based on these findings we suggest that downregulated canonical WNT signaling in patient MSCs may account, to a certain degree, for the defective cell proliferation and reduced lineage priming, at least to the osteoblastic lineage.
Defective hematopoiesis-supporting capacity of MSCs from MDS patients irrespective of osteopontin production
To evaluate the capacity of BM MSCs from MDS patients to support the hematopoietic progenitor cell growth, we assessed the clonogenic potential of the NACs in recharged MSC cultures from patients (n=15) and controls (n=15). The frequency of total CFUs in the NAC fraction over a period of 5 weeks was significantly lower in patients compared with controls (P<0.05) (Fig. 7A) due to the lower number of both the total CFU-GM (P<0.05) (Fig. 7B) and CFU-E (P<0.05) (Fig. 7C) progenitor cells.
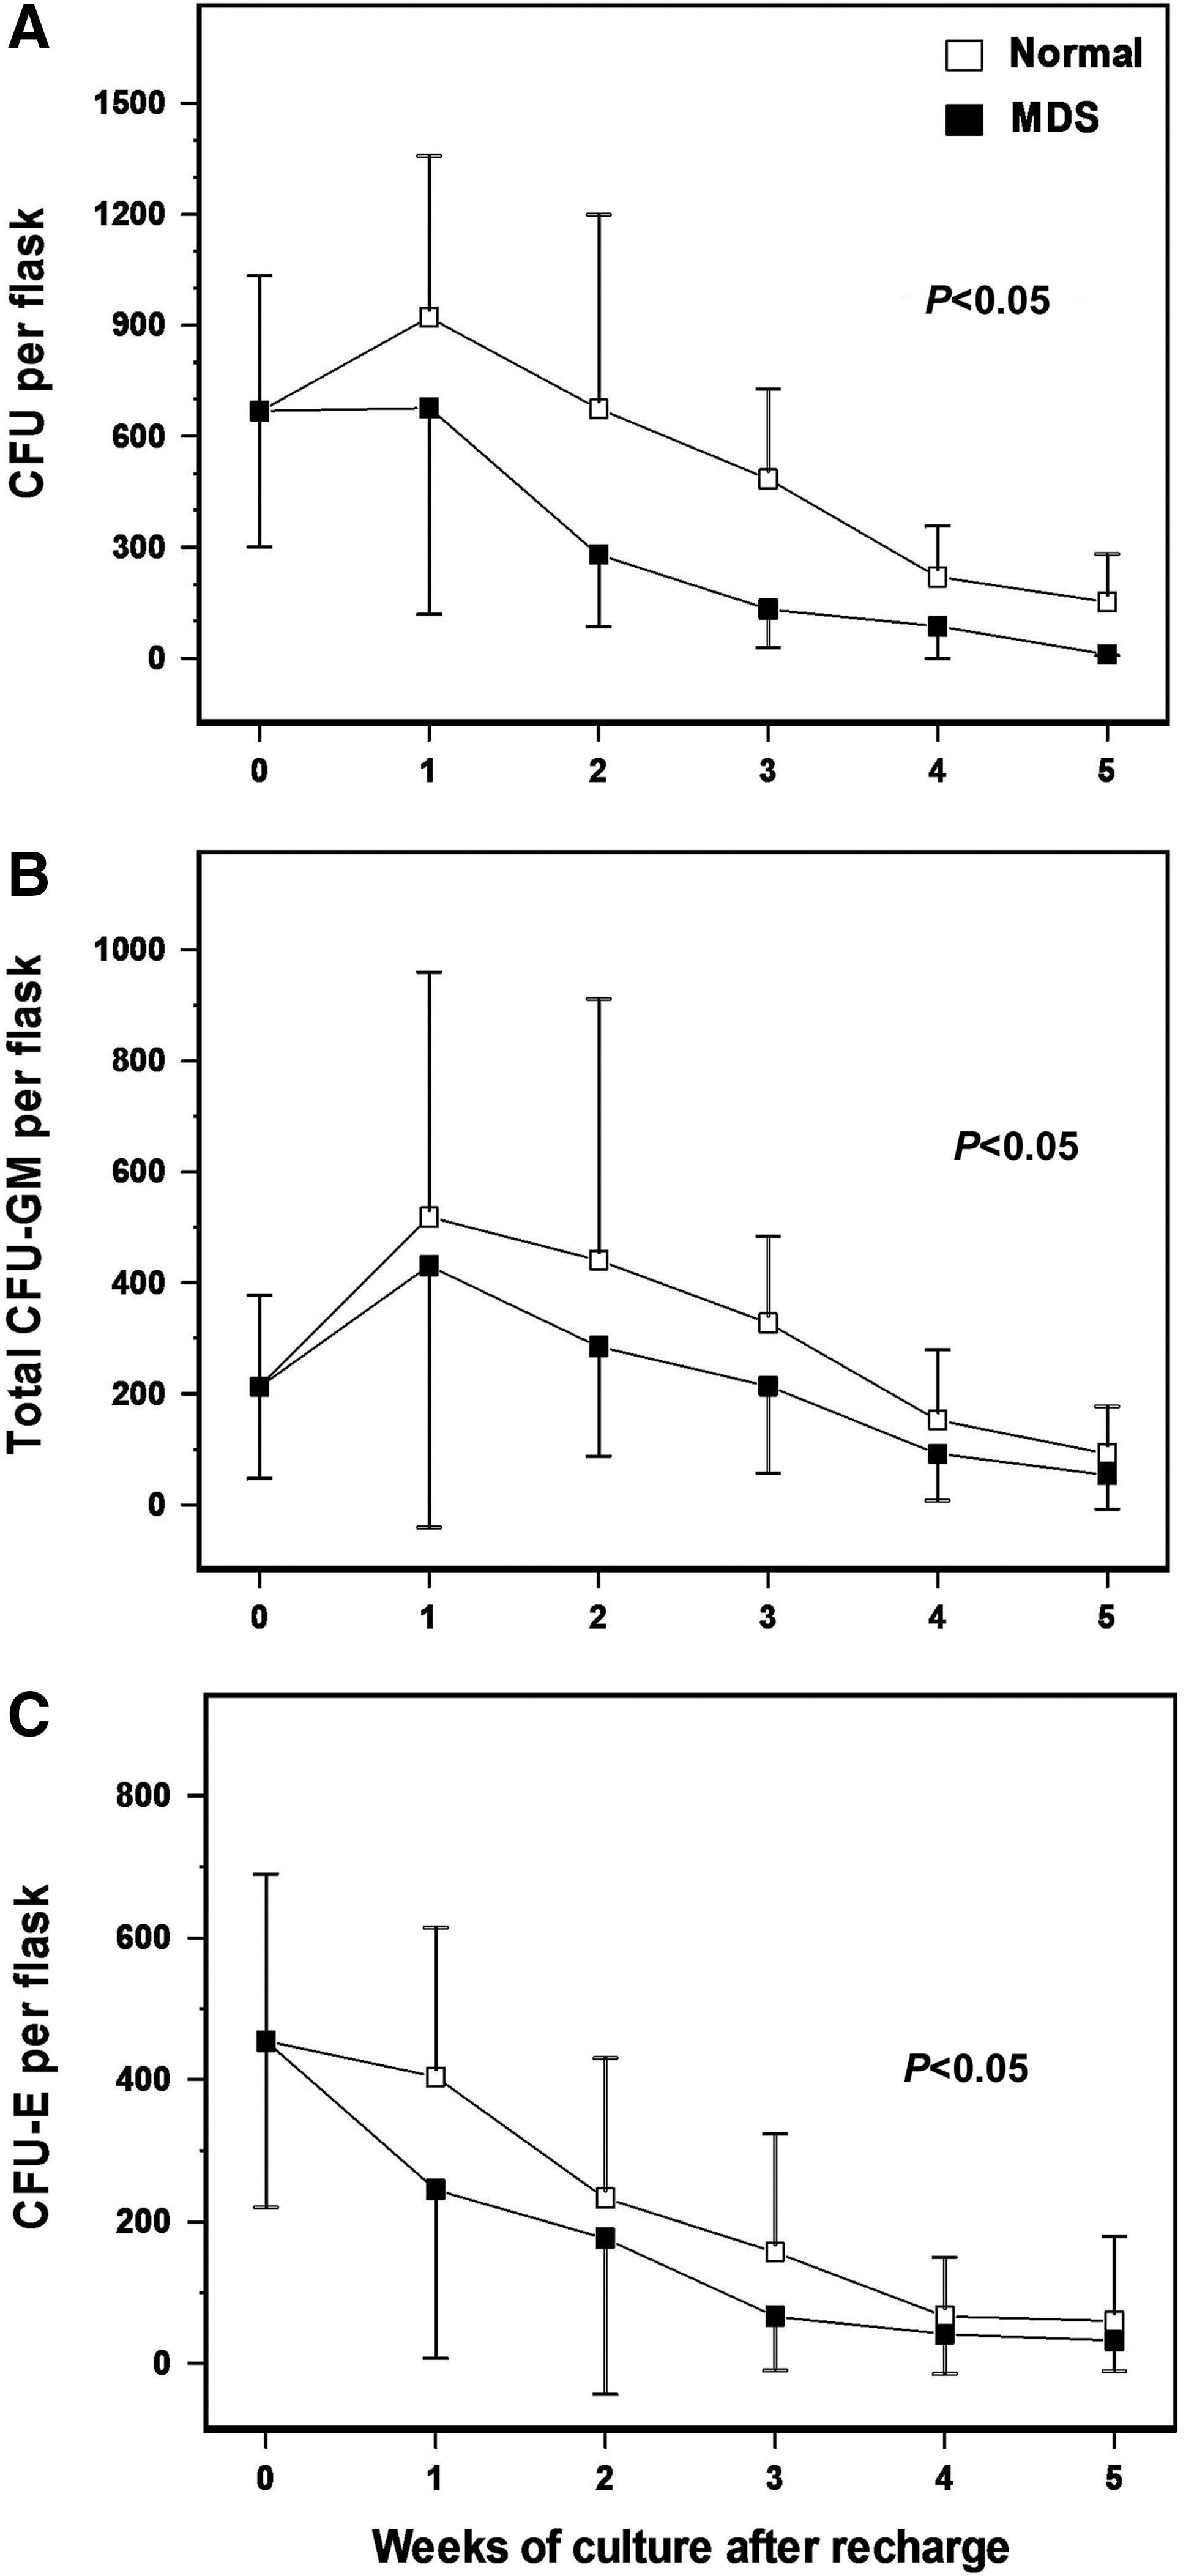
Defective hematopoiesis-supporting capacity of MSCs from MDS patients. Confluent MSC stromal layers from MDS patients (n=15) and healthy controls (n=15) grown in 25 cm2 flasks were irradiated and recharged with normal allogeneic CD34+ bone marrow cells. At weekly intervals for a total of 5 weeks, cultures were fed by demi-depopulation and the non-adherent cells were assayed for clonogenic progenitor cells in methylcellulose culture medium. The graphs depict the mean (±1 SD) number of total colony-forming units (CFUs)
Osteopontin, an MSC-derived cytokine, has been recognized as a negative regulator of hematopoietic progenitor cell proliferation [33,34]. We have therefore evaluated osteopontin levels in MSC culture supernatants from MDS patients and healthy individuals through passages. No statistically significant difference was observed between patient and control cultures, suggesting that factors other than osteopontin affect the hematopoiesis-supporting activity of MSCs in MDS patients.
It has previously been shown that Jagged-1 (a Notch-ligand) is expressed by BM MSCs [35] and that overexpression of soluble Jagged-1 protein results in a significant decrease in the ability of MSC stromal layers to support hematopoiesis [36]. Based on these findings we quantified Jagged-1 gene expression in P2 MSCs from patients (n=15) and healthy controls (n=15). Jagged-1 mRNA levels were found to be significantly increased in MDS-derived MSCs (0.006831±0.0017), as compared with MSCs derived from healthy individuals (0.00375±0.001, P<0.05). Thus, Jagged-1-impaired expression could potentially contribute to the defective hematopoiesis-supporting capacity of MDS-derived MSCs.
Discussion
MSCs and their progeny in the hematopoietic microenvironment regulate the homeostatic maintenance and expansion of HSCs but can also influence the development of hematologic disorders through aberrant production of cytokines and induction of intricate cell-to-cell interactions. Several studies have shown quantitative, functional, and genomic alterations of BM MSCs in MDS patients that might presumably contribute to the malignant transformation of HSCs [7,8]. We have previously shown impaired proliferative potential of BM MSCs in MDSs [11]. In the current study we probe the possible underlying pathogenetic mechanisms by investigating the senescence-associated characteristics of BM MSCs of MDS patients and the expression of genes implicated in the WNT and TGFB/BMP signaling pathways.
MSC doubling time through passages was significantly increased in patients compared with healthy individuals, substantiating our previously reported data for impaired proliferative potential of BM MSCs in MDSs. In line with this observation, cumulative PDs through passages, as well as the maximum cumulative PDs, attained at senescence, were significantly reduced in patient-derived MSCs. These findings remained significant when we looked separately at MSCs derived from low-risk and high-risk MDS subgroups. Because cellular senescence has been associated with defective replicative capacity, we have studied a number of senescence-associated indices in patient and control MSC cultures. We demonstrated that premature cell senescence seems rather unlikely to account for the impaired proliferative potential of BM MSCs in MDSs. Instead, patient MSCs expressed less senescence characteristics compared with their normal counterparts. Specifically, three cell cycle inhibitors usually overexpressed by senescent cells, namely, the CDKN1A, CDKN2A, and CDKN2B, as well as the senescence-associated gene PARG1 known to increase during passages, were significantly downregulated in patients compared with normal subjects [37]. The TP53 and RB1 genes were similarly expressed in patient and normal MSC cultures; however, the expression of these genes has mainly been associated with senescence induced by telomere dysfunction or DNA damage (TP53) as well as with oncogene action, chromatin disruption, and various stresses (RB1) [13].
Likewise, SA-β-gal-positive cells did not differ significantly between patients and controls through passages. This lysosomal protein is active in senescent MSCs; however, its quantitative analysis is not always appropriate for comparisons because it predominantly stains the enlarged senescent cells accumulating abundantly SA-β-gal [14]. Finally, the telomere length that has been recognized as the main indicator of MSC replicative senescence [14,38] was significantly increased in patients compared with controls in all passages tested. Nevertheless, akin to MSCs from healthy donors [39,40], no telomerase activity was detectable in MDS-derived MSCs throughout culture (data not shown). Taken together the aforementioned results that MSC senescence is unlikely to account for the defective proliferative potential of BM MSCs in MDSs. Conversely, the lower expression of senescence characteristics in patient MSCs might imply the delayed replicative senescence process related to the proliferation retardation.
The canonical and non-canonical WNT signaling pathways have a major role in the proliferation and differentiation processes of BM MSCs [28]. We have therefore studied the expression of genes related to the WNT pathways in MSCs from MDS patients. We found substantial upregulation of genes related to the non-canonical WNT pathway in patients compared with controls. Specifically, patient MSCs displayed increased expression of genes classically regarded as non-canonical Wnts, namely, the WNT5A, WNT5B, WNT9A, WNT4, and WNT7A, and decreased expression of genes related to the canonical WNT pathway, namely, the CSNK1G1 and PORCN. CSNK1G1 directly phosphorylates the low-density LRP5/6 upon WNT binding to its receptor frizzled (FZD) while PORCN regulates the secretion of WNT proteins. Patient MSCs displayed also increased expression of genes related to the canonical pathway inhibition. Specifically, an upregulation was identified in KREMEN1 encoding for a transmembrane protein that promotes the internalization of LRP5/6; in GSK3A, CSNK1A1, CSNK2A1, AXIN1, PPP2R1A, SENP2, and CXXC4 encoding for cytoplasmic proteins that contribute to the proteosomal degradation of β-catenin; and in AES, TLE2, and TCF7L1 encoding for transcriptional repressors. An upregulation was also observed in SFRP1 gene encoding for a secreted negative regulator that competes with FZD for WNT binding. Further, MSC culture supernatants from the patients contained increased levels of the WNT inhibitor DKK1 that antagonizes WNT action by blocking access to the LRPs or by interacting with KREMEN1 to promote LPR internalization. The downmodulation of the canonical and upregulation of the non-canonical WNT pathways in patient MSCs was further indicated by the increased expression of JUN, which is classically considered as a target molecule for DVL through the non-canonical WNT signaling. DVL was also upregulated in patient MSCs. At this point we would like to underscore the fact that the deregulation of the WNT signaling pathways reported in our study is mainly inferred from mRNA analysis by means of RT-PCR. Yet it is generally accepted that gene expression may not necessarily correlate with protein levels or functional activity. This is especially true in signaling pathways, like the WNT pathway, the regulation of which involves several post-transcriptional and post-translational modifications. Therefore, we acknowledge that our findings should be interpreted bearing in mind the shortcomings of RT-PCR assays and that they should be further confirmed by protein analysis methods.
The effect of the canonical and non-canonical WNT pathways in the proliferation and differentiation processes of BM MSCs depends largely on the culture conditions, the presence of environmental factors, and the intensity of WNT signals. Although opposing results have been reported, it is generally accepted that the canonical WNT signaling keeps stem cells in a self-renewing and undifferentiated state whereas the non-canonical WNT pathway inhibits MSC proliferation mainly through WNT5A [28,41]. We may therefore hypothesize that the low proliferation rate of BM MSCs in MDSs might be associated with the upregulation of the non-canonical WNT signaling and the parallel downregulation of the canonical pathway. In line with this hypothesis, pharmacological activation of canonical WNT signaling with the GSK-3β inhibitor BIO led to a significant increase in the proliferative potential of MDS-derived MSCs. This finding corroborates previous observations regarding the capacity of BIO to promote MSC expansion in vitro [31]. Notably, the expression profile of genes related to the TGFB/BMP signaling, interacting with WNT pathways during the proliferation and differentiation processes of MSCs [20,42], did not differ between patients and controls.
The BM MSCs of MDS patients displayed normal in vitro differentiation potential toward chondrocytes, osteocytes, and adipocytes following culture in the presence of the appropriate inducers, in line with our previous report [11]. However, in the absence of strong inducers, under non-differentiating culture conditions, both osteogenic-specific gene expression and adipogenic-specific gene expression were decreased in patient MSCs. This finding implies defective lineage priming in patient MSCs [29]. The underlying mechanism to account for this defect has not been elucidated thus far. Nevertheless, it has recently been reported that pharmacological activation of the canonical WNT signaling by the GSK-3β inhibitor LiCl primes undifferentiated MSCs toward osteoblastic lineage [32]. In view of this observation and provided that in MDS-derived MSCs the canonical WNT signaling is downregulated, we hypothesized that the reduced osteoblastic lineage priming of patient MDSs might be attributed, at least in part, to the impaired canonical WNT signaling. In support of this hypothesis, treatment of undifferentiated patient MSCs with BIO led to a significantly increased expression of early osteoblastic genes. Irrespective of its cause, the lower differentiation potential in association with the defective proliferating capacity of MSCs in MDSs may have important implications in vivo; for example, these abnormalities may affect the efficient generation of the hematopoiesis-supportive cells in the niche.
To investigate the hematopoiesis-supporting capacity of BM MSCs from MDS patients, we recharged MSC stromal layers from patients and controls with the same normal CD34+ cells and assessed their clonogenic potential time-course. We observed a significant decrease in the myeloid and erythroid colony forming potential of CD34+ cells in cultures supported by MSCs from MDS patients compared with the respective from healthy subjects. The basis of this abnormality may concern the cellular structure of the MSC stromal layers and/or cellular products, such as soluble and membrane-bound cytokines, adhesion molecules, and extracellular matrix components. Assessment of soluble osteopontin, a negative regulator of hematopoietic stem and progenitor cell proliferation and differentiation [33,34], did not reveal significant differences between patient and normal cultures; therefore, the underlying mechanism for the impaired support of normal hematopoiesis by MDS-derived MSCs remains unclear and subject of further investigation. Interestingly, Jagged-1 mRNA levels were found to be significantly increased in patient-derived MSCs. Since the overexpression of soluble Jagged-1 protein in cocultures of human BM MSCs and BM mononuclear cells has been shown to significantly reduce the rate of cobble-stone-forming cells [36], we may hypothesize that the increased expression of Jagged-1 by patient-derived BM MSCs could be implicated in their defective hematopoiesis-supporting capacity. The potential association of Jagged-1 upregulation on one hand and insufficient hematopoietic support by MDS-derived MSCs on the other has not been studied. Further investigation is therefore warranted so as to clarify the possible mechanistic link.
Overall, this is the first study that indicates deregulated WNT signaling pathways in MSCs from MDS patients. This abnormality may have a role in the defective proliferative potential of patient MSCs and may reflect an abnormal functioning BM niche that fails to support normal hematopoiesis. Our data highlight further the altered properties of MSCs in MDSs and support the concept of a primary BM microenvironment defect that may have a contributory effect in MDS natural history.
Footnotes
Acknowledgments
This work was supported by the European Commission FP7 programme “Translational Potential” (TransPOT; EC contract number 285948), the “Manasaki post-graduate fellowship” by the University of Crete to K.P., and a grant by the Hellenic Society of Haematology to K.P. Part of this work has been presented at the Annual Hellenic Congress of Hematology and has been awarded the “Arkagathos Gouttas” price, instituted by the Hellenic Society of Hematology.
Author Disclosure Statement
No competing financial interests exist.