
Abstract
In mouse blastocysts, CDX2 plays a key role in silencing Oct4 and Nanog expression in the trophectoderm (TE) lineage. However, the underlying transcriptional and chromatin-based changes that are associated with CDX2-mediated repression are poorly understood. To address this, a Cdx2-inducible mouse embryonic stem (ES) cell line was utilized as a model system. Induction of Cdx2 expression resulted in a decrease in Oct4/Nanog expression, an increase in TE markers, and differentiation into trophoblast-like stem (TS-like) cells within 48 to 120 h. Consistent with the down-regulation of Oct4 and Nanog transcripts, a time-dependent increase in CDX2 binding and a decrease in RNA polymerase II (RNAPII) and OCT4 binding was observed within 48 h (P<0.05). To test whether transcriptionally active epigenetic marks were erased during differentiation, histone H3K9/14 acetylation and two of its epigenetic modifiers were evaluated. Accordingly, a significant decrease in histone H3K9/14 acetylation and loss of p300 and HDAC1 binding at the Oct4 and Nanog regulatory elements was observed by 48 h. Accompanying these changes, there was a significant increase in total histone H3 and a loss of chromatin accessibility at both the Oct4 and Nanog regulatory elements (P<0.05), indicative of chromatin remodeling. Lastly, DNA methylation analysis revealed that methylation did not occur at Oct4 and Nanog until 96 to 120 h after induction of CDX2. In conclusion, our results show that silencing of Oct4 and Nanog is facilitated by sequential changes in transcription factor binding, histone acetylation, chromatin remodeling, and DNA methylation at core regulatory elements.
Introduction
T
The current model for segregation of the ICM and TE proposes that CDX2 represses Oct4 and Nanog expression in the TE lineage, whereas OCT4 and NANOG down-regulate Cdx2 expression in the pluripotent ICM [4,6,7]. In support of this model, embryos that are deficient in CDX2 fail to repress Oct4 and Nanog expression in the TE lineage [4,8,9]. Studies in embryonic stem (ES) cells showed that forced expression of Cdx2 or ablation of Oct4 induces differentiation toward a TE cell fate via CDX2-OCT4 and CDX2-Oct4 enhancer interactions [6,8]. Alternatively, in trophoblast stem (TS) cells, forced expression of Oct4 alone or in combination with other reprogramming factors promotes an ES cell fate through suppression of Cdx2 and other TS cell regulators [10,11]. Collectively, these findings demonstrate that OCT4, NANOG, and CDX2 participate in a mutually exclusive antagonistic relationship to facilitate the first cell-fate decision in mouse blastocysts.
Previously, we demonstrated that CDX2-mediated repression of Oct4 expression in TE is facilitated by both transcriptional and epigenetic events in the mouse [8]. For example, in both preimplantation embryos and Cdx2-inducible ES cells, the chromatin remodeling protein Brahma related-gene 1 (BRG1) cooperates with CDX2 to down-regulate Oct4 transcription in the TE lineage. Interestingly, CDX2/BRG1-dependent repression of Oct4 expression in the blastocyst TE does not involve DNA methylation [8]. In support of this view, during early mouse embryogenesis, Oct4 and Nanog do not acquire DNA methylation until after implantation [12]. Combined, these data suggest that during blastocyst formation, other transcriptional and chromatin-based changes are involved in the repression of Oct4 and Nanog expression in TE.
To further investigate the transcriptional and chromatin-based processes that are associated with Oct4 and Nanog silencing in the emerging TE lineage, we utilized a well-characterized Cdx2-inducible ES cell line that differentiates into TS-like cells [13]. Here, we report that CDX2-mediated silencing of Oct4 and Nanog expression is associated with a well-orchestrated series of overlapping transcriptional and chromatin-based events at core regulatory elements, that is, the Oct-Sox motif, the proximal promoter regions, and the transcriptional start site (TSS). Major transcriptional and chromatin-based changes preceded the onset of DNA methylation, which occurred after Oct4 and Nanog were already down-regulated.
Materials and Methods
ES cell culture, differentiation, and TS cell culture
Cdx2-inducible ES cells were provided by Dr. Minoru Ko of the NIA and were cultured as previously described [8,13 –15]. In brief, cells were grown on a feeder layer of mitomycin-treated puromycin-resistant mouse embryonic fibroblasts in standard ES cell media, supplemented with 0.2 μg/mL of doxycycline and 1.0 μg/mL of puromycin. Before Cdx2 induction, cells were switched onto gelatin and cultured with 3.0 μg/mL of puromycin for 3 days. Cdx2 expression was induced by removal of doxycycline. Leukemia inhibitory factor was removed 48 h after induction. After 96 h, cells were cultured in TS cell medium containing fibroblast growth factor 4 (FGF4) [8,16]. TS cells were derived as previously described [8,16]. Cdx2 induction was verified by quantitative (q)RT-PCR and by western blot using a Flag antibody (Sigma-Aldrich, St. Louis, MO).
qRT-PCR analysis and western blot
Cells were harvested, flash frozen, and stored at −80°C until isolation. RNA isolation was performed using RNeasy Mini Kit (Qiagen, Valencia, CA). cDNA synthesis was then performed using SuperScript II reverse transcriptase (Invitrogen, Carlsbad, CA). qRT-PCR analysis was then performed with TaqMan probes, or gene-specific primers using SYBR green detection on a StepOne Plus thermocycler (Applied Biosystems, Foster City, CA). Eukaryotic translation elongation factor 1 alpha 1 (Eef1a1) was used as an endogenous control for gene expression analysis. Western blot analysis was performed as previously described [8]. In brief, whole cell lysates were size fractionated by SDS-PAGE and transferred to PVDF membrane. Antibodies used to detect the expression of Flag-CDX2, OCT4, NANOG, and β-ACTIN (as a loading control) are listed in Supplementary Table S1 (Supplementary Data are available online at
Chromatin-immunoprecipitation analysis
Chromatin-immunoprecipitation (ChIP) analysis was performed as previously described [8,14,15,17]. In brief, cells were fixed with 1% formaldehyde and then flash frozen. Chromatin lysate was prepared by sonication, and an extract equivalent to 2 million cells was used for each IP. ChIP was carried out using commercially available antibodies for RNAPII, acetyl histone H3K9/14, mouse IgG, rabbit IgG, histone H3, OCT4, p300, HDAC1, and Flag. These antibodies are listed in Supplementary Table S1. The BRG1 anti-serum was obtained from Dr. Anthony Imbalzano (UMASS, Medical School, Worcester, MA). ChIP data were analyzed by quantitative real-time PCR (qPCR) with SYBR green reagents (Applied Biosystems) using the percent input method.
Restriction endonuclease chromatin accessibility assay
Chromatin accessibility assay was adapted from methods developed earlier [18,19]. Five million fresh cells were washed in PBS, pelleted, and lysed for 5 min on ice in nuclear lysis buffer containing 10 mM Tris (pH 7.4), 10 mM NaCl, 3 mM MgCl2, 0.5% IGEPAL CA-630, 0.15 mM spermine, and 0.5 mM spermidine. After centrifugation, nuclei were washed in nuclear wash buffer containing 10 mM Tris (pH 7.4), 50 mM NaCl, 10 mM MgCl2, 0.2 mM EDTA, 0.2 mM EGTA, 1 mM β-mercaptoethanol, 0.15 mM spermine, and 0.5 mM spermidine. Nuclei were again pelleted and suspended in restriction enzyme buffer 4 (New England Biolabs, Ipswich, MA). Isolated nuclei were then treated with restriction endonucleases DdeI or MseI (New England Biolabs) that were specific for single-cut sites located within the amplicons for Oct4 and Nanog, respectively. The control intergenic region also contains a cut site for the restriction enzyme MseI, allowing monitoring of an unchangeable chromatin state for MseI digestion, as well as to test for nonspecific digestion by treatment with DdeI. The length of digestion as well as specificity of restriction enzymes for their respective amplicons was optimized before performing the assay (Data not shown). Samples were digested at 37°C for 10 and 40 min for DdeI and MseI, respectively. The reaction was stopped by adding SDS, and samples were then heated at 65°C for 20 min. DNA was then extracted, and compared with uncut genomic samples by qPCR analysis with 25 ng of template DNA. Data are presented as a percentage of the DNA cut by each restriction enzyme [18].
Bisulfite sequencing analysis of DNA methylation
DNA methylation was assessed as previously described [8]. Briefly, isolated genomic DNA was bisulfite treated using the EZ DNA Methylation-Gold Kit (Zymo Research, Orange, CA). Differentially methylated regions (DMRs) were evaluated by performing two successive rounds of PCR using nested primers. PCR products were then TA-cloned into the pCR2.1 TOPO vector (Invitrogen), and colonies were randomly picked for sequencing.
Statistical analysis
Data from qRT-PCR, ChIP, chromatin accessibility assay, and bisulfite sequencing were analyzed using Student's t-test to determine statistical differences between time points. A P value of<0.05 was considered significant.
Results
Experimental model for investigation of Oct4 and Nanog silencing in the TE lineage
To delineate the underlying transcriptional and epigenetic changes that accompany Oct4 and Nanog silencing in the TE lineage, a mouse Cdx2-inducible ES cell line was obtained from Ko and co-workers [13]. This cell line is tetracycline repressible and is engineered to express a Flag-CDX2 along with Venus via an IRES element. Previous work from multiple laboratories showed that Cdx2-inducible ES cells can be differentiated into TS-like stem cells that resemble native TS cells in terms of function and potential to contribute to placentas in chimeric embryos [6,13,20]. Moreover, the inducible ES cell line used in this study phenotypically resembles TS cells in terms of expression and function [13,14]. A major advantage with using Cdx2-inducible ES cells is that one can monitor transcriptional and epigenetic changes in an identical genetic background during the differentiation process. The design of our study was based on work by Ko and co-workers, where global microarray transcriptional profiling and western blot analyses were performed [13]. These data provided the framework for the experimental time points that we adopted to monitor silencing of Oct4 and Nanog. Three distinct cellular conditions were chosen: uninduced ES cells, partially differentiated Cdx2 induced cells at 48 h postinduction, and Cdx2 induced ES cells at 96 h. For each of these time points, cells were collected for qPCR, western blot, ChIP, chromatin remodeling assays, and bisulfite sequencing (Fig. 1A). In addition, intermediate collections were obtained at 72 and 120 h postinduction to monitor the kinetics of DNA methylation.

Cdx2-inducible ES cell model for Oct4 and Nanog silencing.
In preliminary experiments, qRT-PCR confirmed that the levels of Cdx2 transcripts were strongly induced, and the levels of Oct4 and Nanog transcripts progressively decreased at 48 and 96 h postinduction. Cdx2 transcripts were increased by ∼32- and 93-fold at 48 and 96 h, respectively, while Oct4 and Nanog were down-regulated at 3- to 4-fold at 48 h, but were strongly repressed (>20-fold) by 96 h postinduction (Fig. 1B). Furthermore, western blot analysis confirmed that Flag-CDX2 was strongly expressed at 48 h and remained constant at 96 h (Fig. 1C). Steady-state protein levels of NANOG and OCT4 seemed to differ slightly, despite the similarities in transcriptional regulation. For example, NANOG was completely depleted by 48 h postinduction, whereas OCT4 was partially reduced, but was then completely lost by 96 h (Fig. 1C, D). Consistent with the increase in CDX2 and the decrease in Oct4 and Nanog expression, several TS cell genes such as Eomes, Fgfr2, and Elf5 [21,22] were strongly induced at 48 and 96 h (Fig. 1E). In addition, other markers of TE epithelium such as Krt18, Cldn4, and Pard6b are up-regulated in these Cdx2-inducible ES cells [14]. These data in combination with previous work [6,8,13,20] demonstrate that Cdx2-inducible ES cells are a suitable cell-based system for investigating the underlying molecular changes which accompany TE development in mice.
Recruitment of CDX2 is associated with loss of OCT4 and RNAPII at Oct4 and Nanog
A critical aspect of transcriptional regulation within the core pluripotency circuitry is autoregulation and activation of other transcription factors within the network. With regard to both Oct4 and Nanog, these genes contain an upstream Oct-Sox cis-regulatory element [23,24]. Previously, we and others showed that CDX2 is recruited to the Oct-Sox binding motif in the Oct4 promoter within 24 h of Cdx2 induction [6,8]. Thus, we explored whether this binding was a common occurrence during the repression of both Oct4 and Nanog. To accomplish this, we performed a more extensive quantitative ChIP analysis of cells collected at 0, 48, and 96 h post CDX2 induction. Primers were designed that flanked the Oct-Sox binding motif ∼2,000 bp upstream of the TSS on Oct4 and ∼180 bp upstream the TSS on Nanog. An intergenic region not containing any known cis-elements was used as a negative control. Accordingly, we observed a significant increase in CDX2 binding at the Oct-Sox binding motif at 48 and 96 h postinduction (P<0.05). An increase in binding was observed neither at the intergenic control region nor in the IgG samples (P>0.05; Fig. 2A).
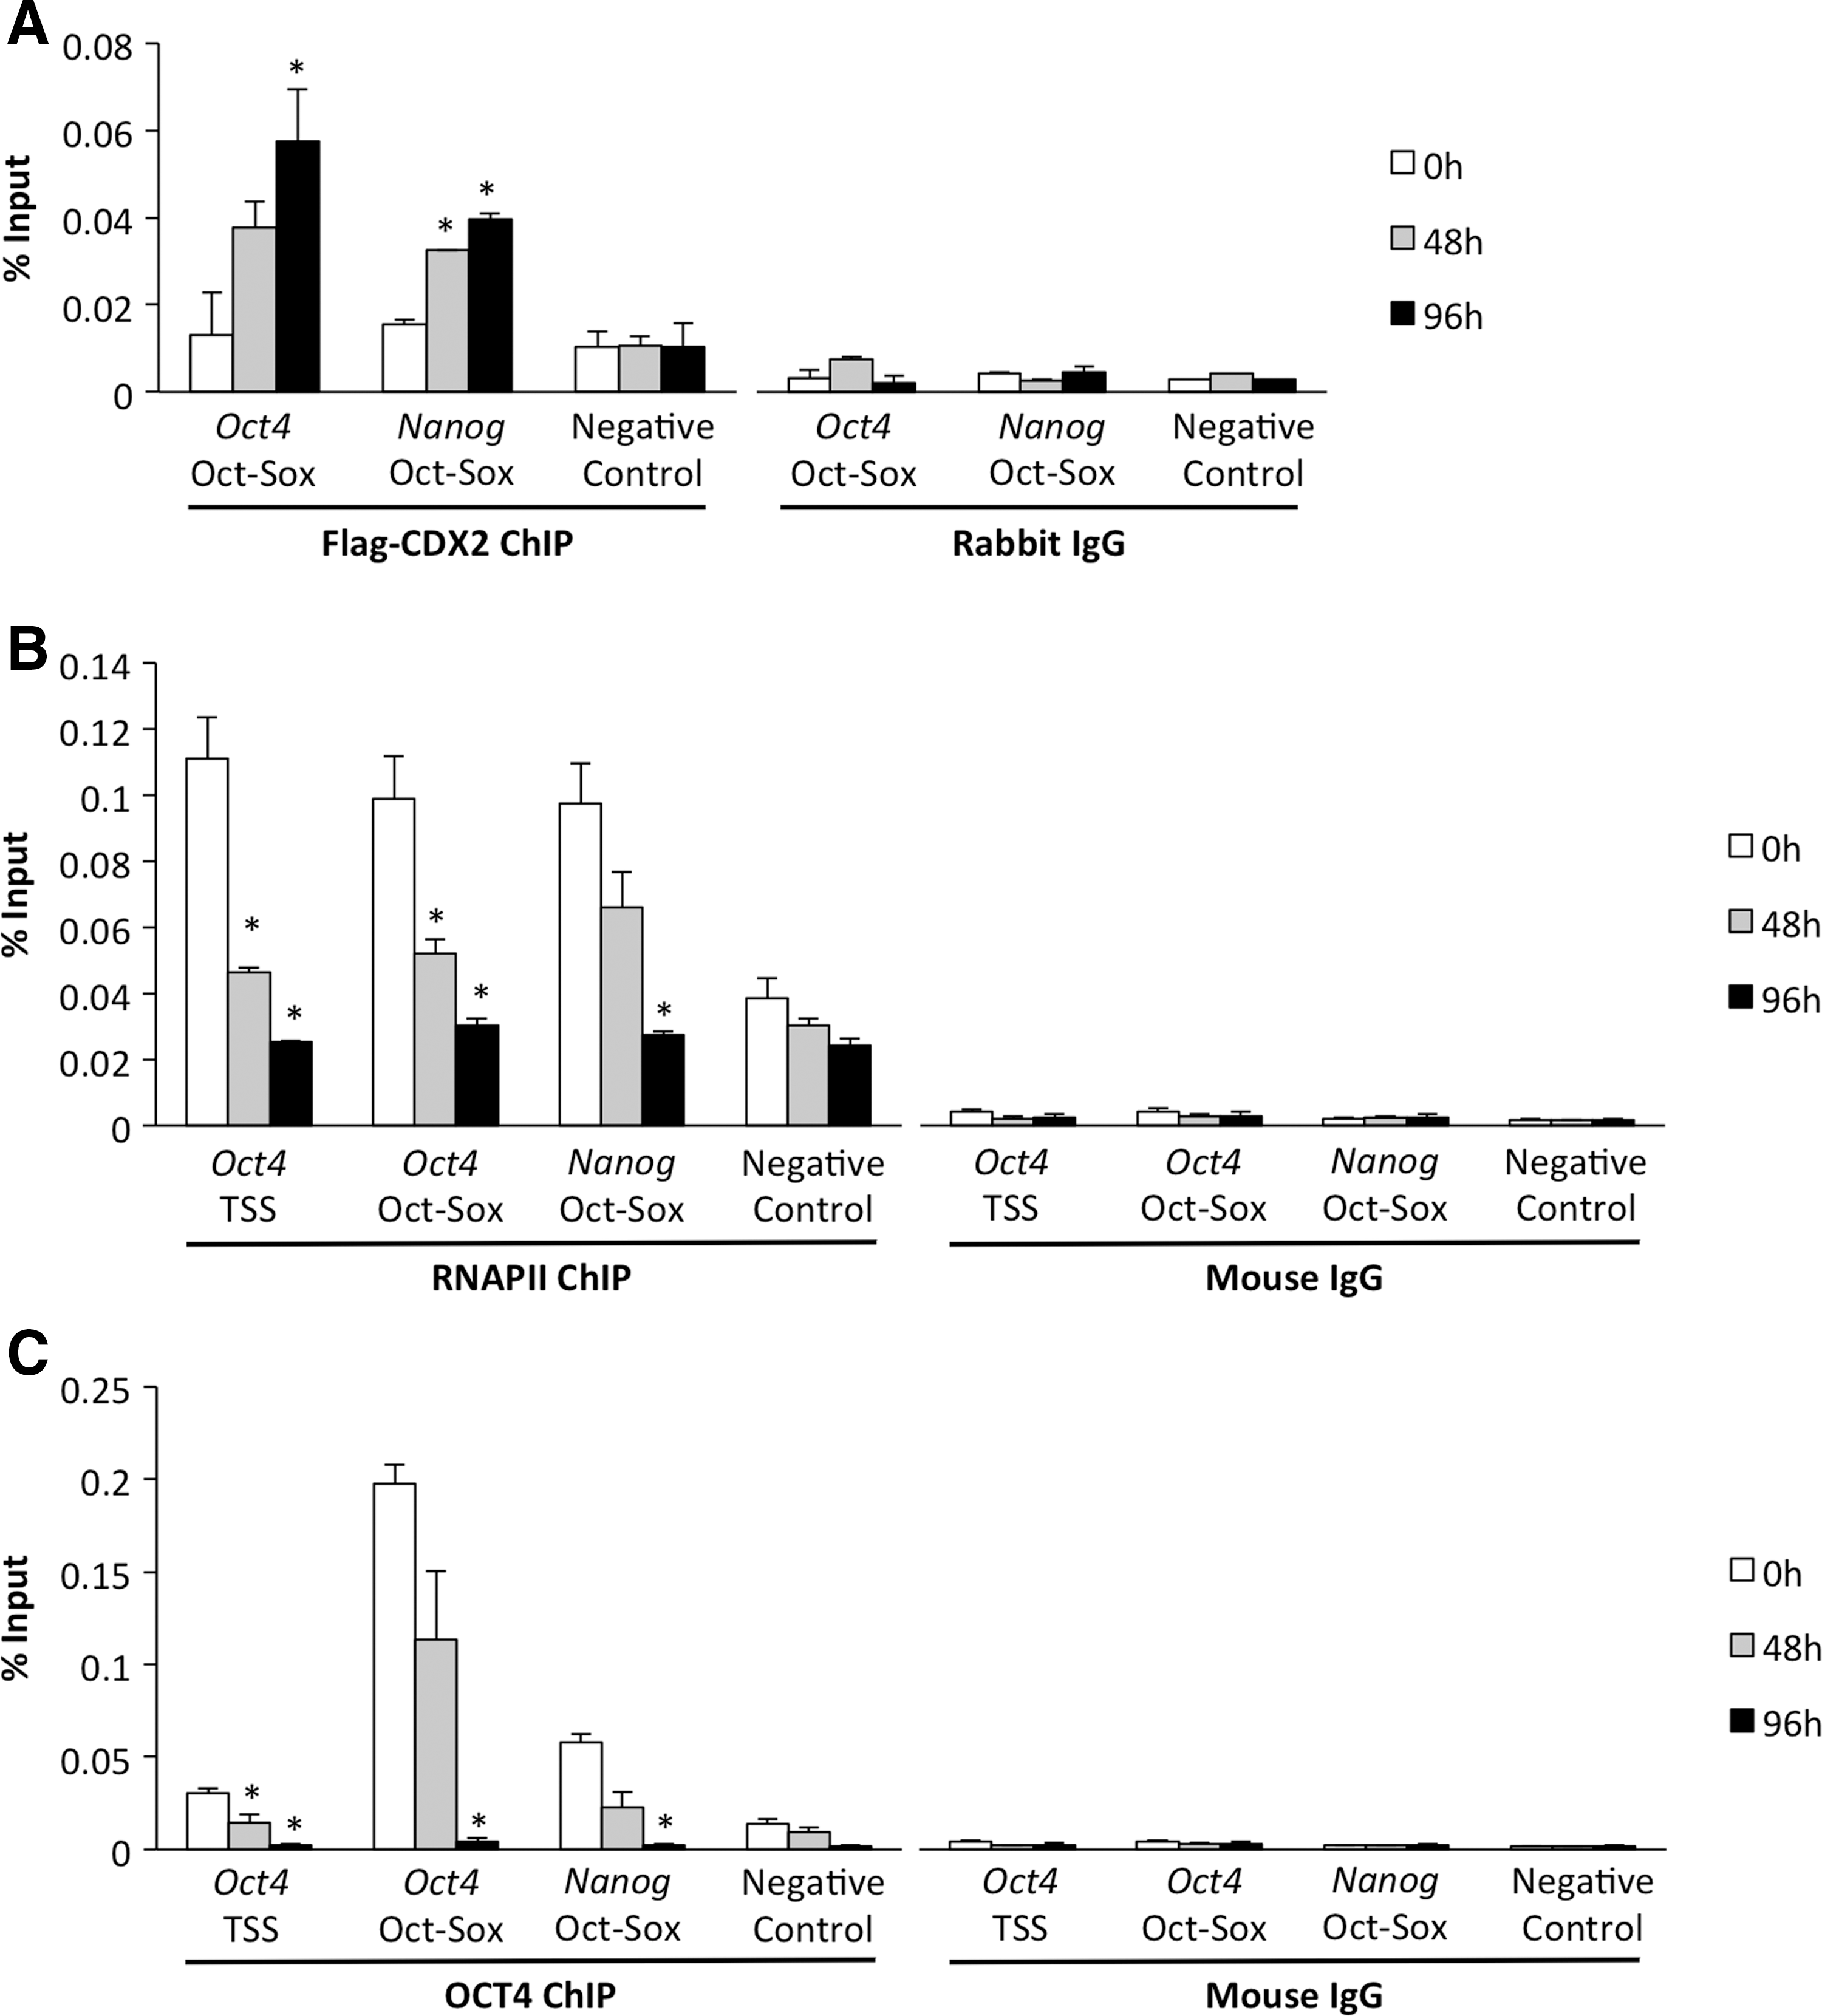
Recruitment of CDX2 and loss of RNAPII and OCT4 at Oct4 and Nanog.
To test whether the recruitment of CDX2 was associated with a loss of transcriptional machinery and/or core transcription factors, we utilized qChIP to monitor RNAPII and OCT4 occupancy during differentiation. In addition, we utilized a second primer set for the Oct4 proximal promoter/TSS region. The occupancy of RNAPII and OCT4 was rapidly lost at the Oct4 and Nanog regulatory elements as the cells underwent Cdx2 induced differentiation (P<0.05; Fig. 2B, C). Interestingly, the recruitment of CDX2 and the loss of RNAPII and OCT4 were tightly correlated with the decrease in Oct4 and Nanog transcripts at these time points (Figs. 1 and 2). Collectively, these experiments demonstrate that Oct4 and Nanog are bona fide targets of CDX2 and that their transcriptional repression is associated with the loss of OCT4 and RNAPII binding.
Changes in histone acetylation accompany Oct4 and Nanog silencing
To begin to investigate the chromatin-based mechanisms that are associated with Oct4 and Nanog silencing in the emerging trophoblast lineage, histone H3 lysine 9 and 14 (K9/14) acetylation was monitored, because it was largely associated with active transcription in eukaryotic cells [25]. We postulated that loss of H3K9/14 acetylation might be coupled with transcriptional silencing of Oct4 and Nanog in ES cells undergoing differentiation into TS-like cells. Previous studies demonstrated that differences in histone H3 acetylation levels exist between ES cells and TS cells in mice [26,27]; however, temporal changes in histone acetylation at the Oct4 and Nanog regulatory elements were not evaluated during differentiation. To address this qChIP, an analysis was conducted utilizing primers along the Oct4 and Nanog regulatory elements as described in the previous section. In uninduced ES cells, H3K9/14 acetylation was strongly enriched at both the Sox-Sox binding motif and TSS in these genes. However, at 48 and 96 h after Cdx2 induction, the levels of H3K9/14 acetylation were dramatically reduced (P<0.05; Fig. 3A). Changes in acetylation were not observed at a control intergenic region that exhibited low enrichment of H3K9/14 acetylation throughout differentiation (P>0.05; Fig. 3A).
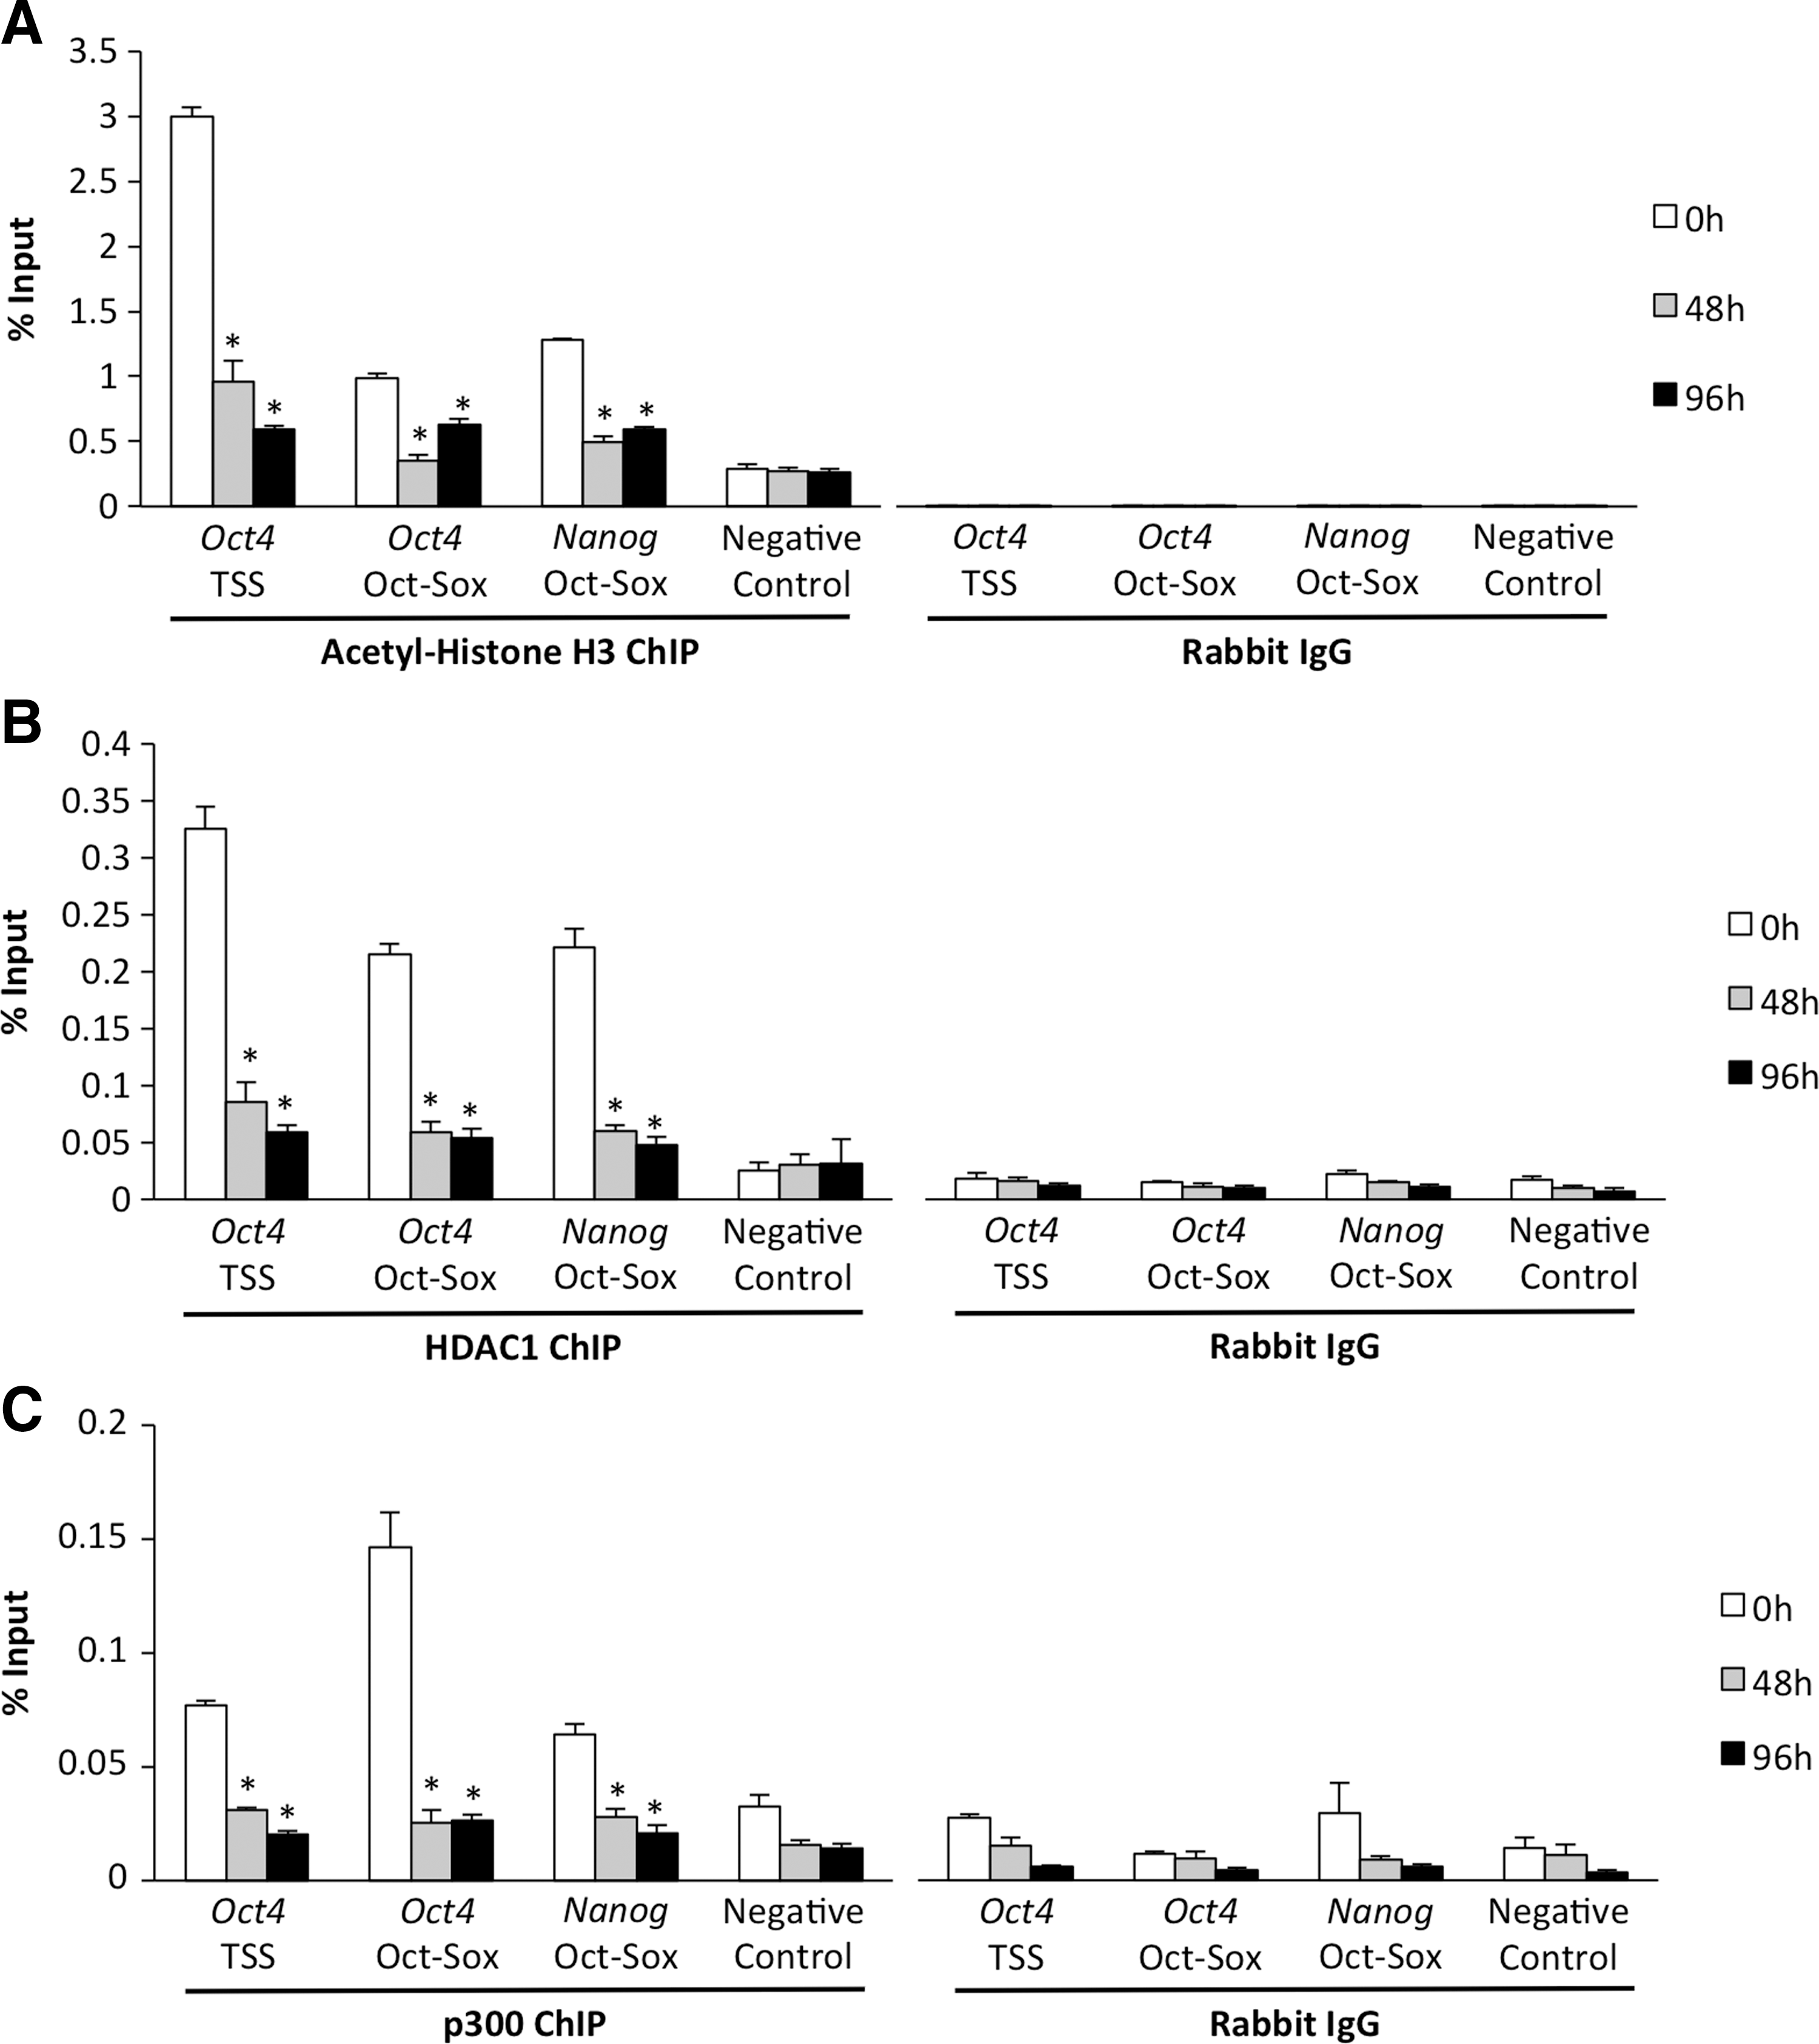
Loss of histone H3K9/14 acetylation, HDAC1, and p300 at Oct4 and Nanog.
Two types of epigenetic regulators that are known to either remove or deposit histone acetylation marks include histone deacetylases (HDACs) and histone acetyltransferases (HATs), respectively. HDAC1 and the HAT p300 were previously shown to bind to Oct4 and Nanog regulatory elements in mouse ES cells [28 –30]. Moreover, in Cdx2-inducible ES cells and other cellular contexts, CDX2 can interact with both HDAC1 and p300 [13,31,32]. Thus, we hypothesized that the recruitment of CDX2 and concomitant decrease in H3K9/14 acetylation was associated with either recruitment and/or loss of HDAC1 and p300 on Oct4 and Nanog. Interestingly, qChIP analysis revealed that HDAC1 and p300 were highly enriched at Oct4 and Nanog in uninduced ES cells, but their binding was rapidly lost during differentiation (P<0.05; Fig. 3B, C). Collectively, these results suggest that transcriptional repression of Oct4 and Nanog in Cdx2-inducible ES cells is associated with a decrease in histone H3K9/14 acetylation and loss of HDAC1 and p300 occupancy at key regulatory elements.
Changes in chromatin structure at core regulatory regions accompany Oct4 and Nanog silencing
It is well established that histone acetylation is an active transcription mark and accompanies more open chromatin structure to facilitate binding of transcription factors and core promoter machinery [33 –35]. Since histone H3K9/14 acetylation was markedly reduced at the Oct-Sox binding motif in Oct4 and Nanog during differentiation, we postulated that chromatin remodeling might accompany gene silencing. To address this, we utilized a well-established qPCR-based restriction enzyme chromatin accessibility assay [18]. ES cells were collected at 0, 48, and 96 h after Cdx2 induction, and isolated nuclei were exposed to restriction enzymes that were specific for a single cut site located proximal to the Oct-Sox2 motif in Oct4 and Nanog, or an intergenic region (no binding site) serving as a negative control (Fig. 4A). For both Oct4 and Nanog, restriction enzyme accessibility was the greatest in uninduced ES cells; however, at 48 and 96 h after Cdx2 induction, there was a progressive loss in chromatin accessibility indicative of chromatin remodeling (P<0.05; Fig. 4B). No changes in chromatin accessibility were observed in the control intergenic region (Fig. 4B).
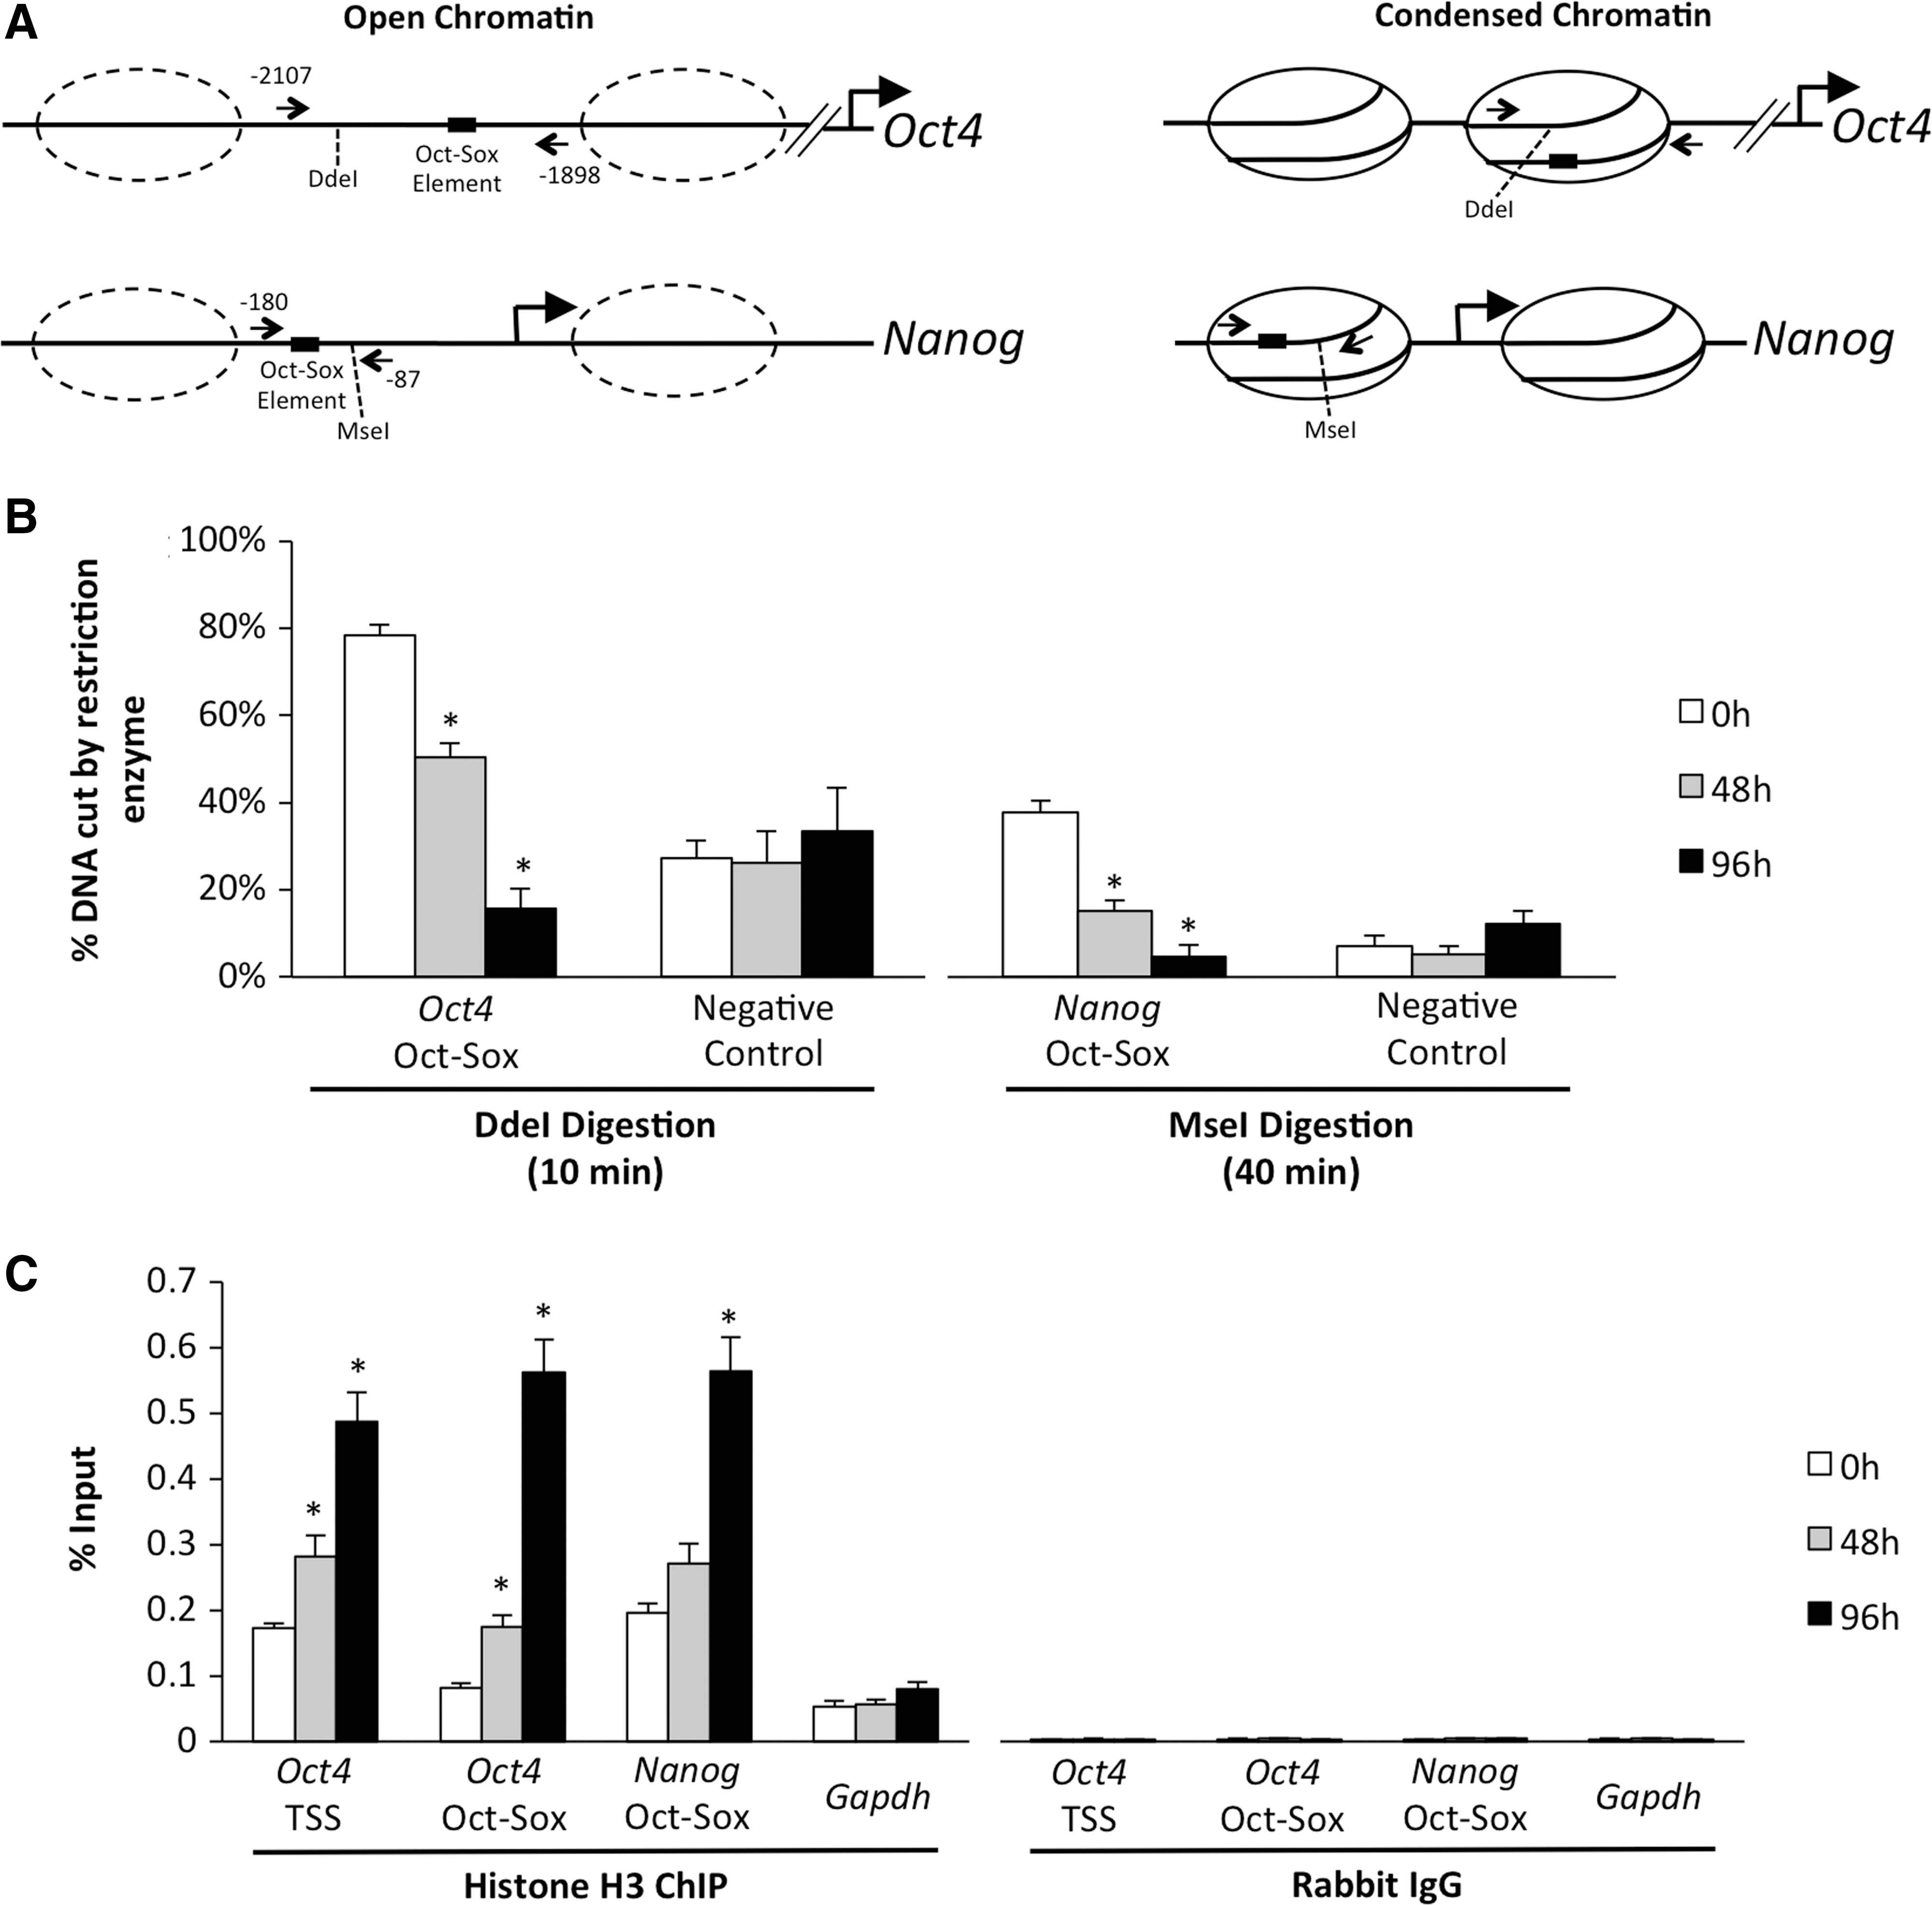
Chromatin remodeling at the Oct-Sox binding motif in Oct4 and Nanog.
To confirm that the loss of accessibility was due to a change in nucleosome occupancy, histone H3 enrichment was monitored by qChIP at the Oct-Sox binding motif in Oct4 and Nanog; histone H3 ChIP analysis is an excellent method for evaluating and/or confirming nucleosome occupancy at gene promoters [36]. In uninduced ES cells, the levels of histone H3 were low, however, as differentiation proceeded histone H3 levels dramatically increased (P<0.05; Fig. 4C). Analysis of Gapdh, a constitutively active gene whose expression does not change during differentiation, showed that histone H3 levels remained constant (P>0.05; Fig. 4C). These results demonstrate that transcriptional silencing of Oct4 and Nanog in the developing trophoblast lineage is accompanied with changes in chromatin structure at core enhancers. These findings are consistent with our previous work in which we demonstrated that the chromatin remodeling protein brahma-related gene 1 (BRG1) functions as a critical co-repressor of Oct4 and Nanog in blastocyst TE [8,17]; reviewed by [37]. In support of this, ChIP analysis revealed that BRG1 occupies the Oct-Sox binding motif in Oct4 and Nanog in Cdx2-induced ES cells [8] and (Supplementary Fig. S1). Additional functional studies are necessary to establish the chromatin-based mechanism by which BRG1 regulates Oct4 and Nanog silencing in the TE lineage.
CpG methylation of Oct4 and Nanog occurs later during differentiation
DNA methylation, a process known to accompany transcriptional silencing, has also been shown to be important for lineage-specific gene expression, genomic imprinting, and X-inactivation and is a common theme within mammalian development [38]. Oct4 and Nanog have been previously characterized to be hypo and hypermethylated in ES cells and TS cells, respectively [26,27]. Moreover, CpG methylation of Oct4 and Nanog in the TE lineage occurs after blastocyst formation in mice when Oct4 and Nanog are already transcriptionally repressed [8,12]. To examine whether major changes in CpG methylation are associated with Oct4 and Nanog silencing in Cdx2-inducible ES cells, we monitored the timing of DNA methylation at 0, 48, 72, 96, and 120 h after Cdx2 induction. Bisulfite sequencing was performed at two DMRs along the Oct4 gene (Fig. 5A). TS cells were used as a positive control. Accordingly, in Cdx2-induced ES cells, we observed a time-dependent increase in CpG methylation that occurred after 72 h. By 120 h, the pattern of CpG methylation resembled native TS cells (Fig. 5B, C). This embryonic-like pattern of DNA methylation occurred in a similar manner for a DMR located within the Nanog promoter (Supplementary Fig. S2). Altogether, these data suggest that Oct4 and Nanog silencing occurs in a step-wise fashion with changes in OCT4/RNAPII binding and histone acetylation occurring first, followed by major changes in chromatin structure and DNA methylation that transpire during the middle to late stages of silencing.
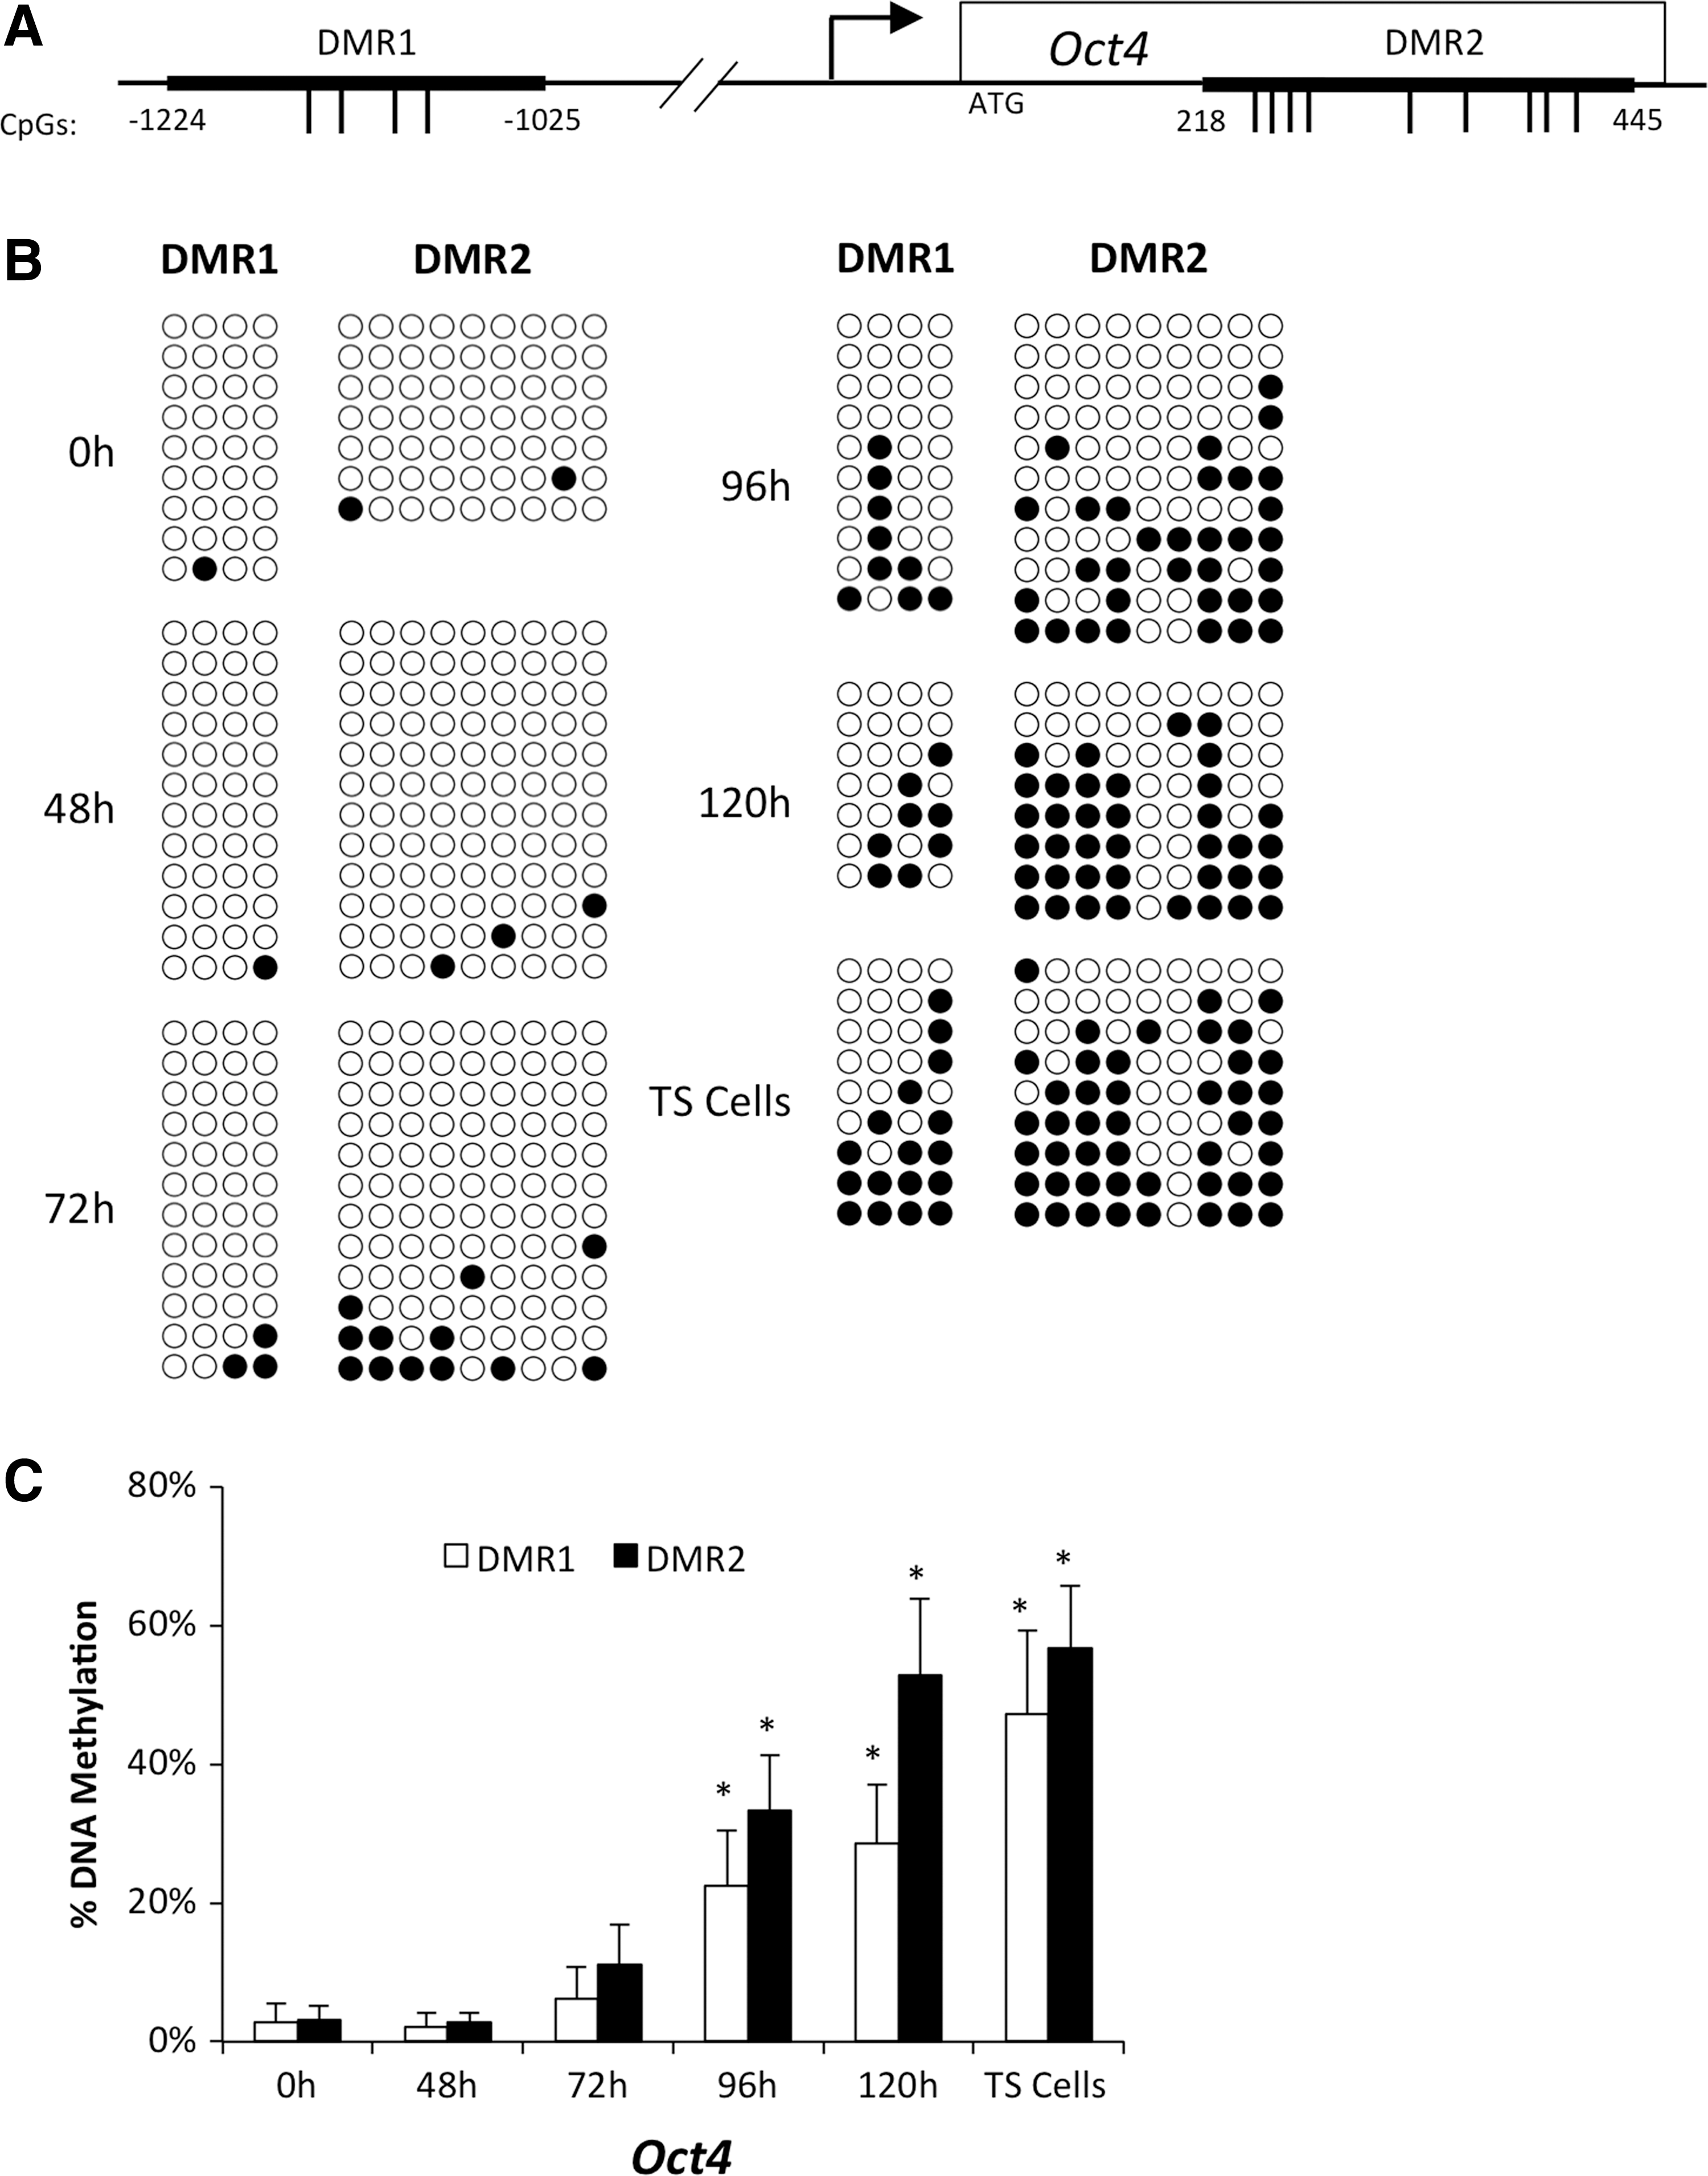
Acquisition of DNA methylation at Oct4 occurs later during differentiation.
Discussion
Results presented here provide new insights into fundamental transcriptional and chromatin-based changes that occur during silencing of Oct4 and Nanog in the emerging trophoblast lineage. To date, little is known about the role of chromatin remodeling during early trophoblast development in mice. Our results in ES cells show that after induction of CDX2 (i) the expression of Oct4 and Nanog are rapidly down-regulated; (ii) CDX2 is recruited and OCT4 and RNAPII are rapidly lost from core regulatory elements; (iii) there is a decrease in histone H3K9/14 acetylation and corresponding loss of P300 and HDAC1 binding at core regulatory elements; (iv) there is an increase in nucleosome density and loss of chromatin accessibility at core regulatory elements; and (v) the acquisition of DNA methylation occurs later during differentiation after down-regulation of Oct4 and Nanog expression. From the data obtained in this study, we propose a working model that describes a potential mechanism driving the silencing of Oct4 and Nanog in the trophoblast lineage (Fig. 6).
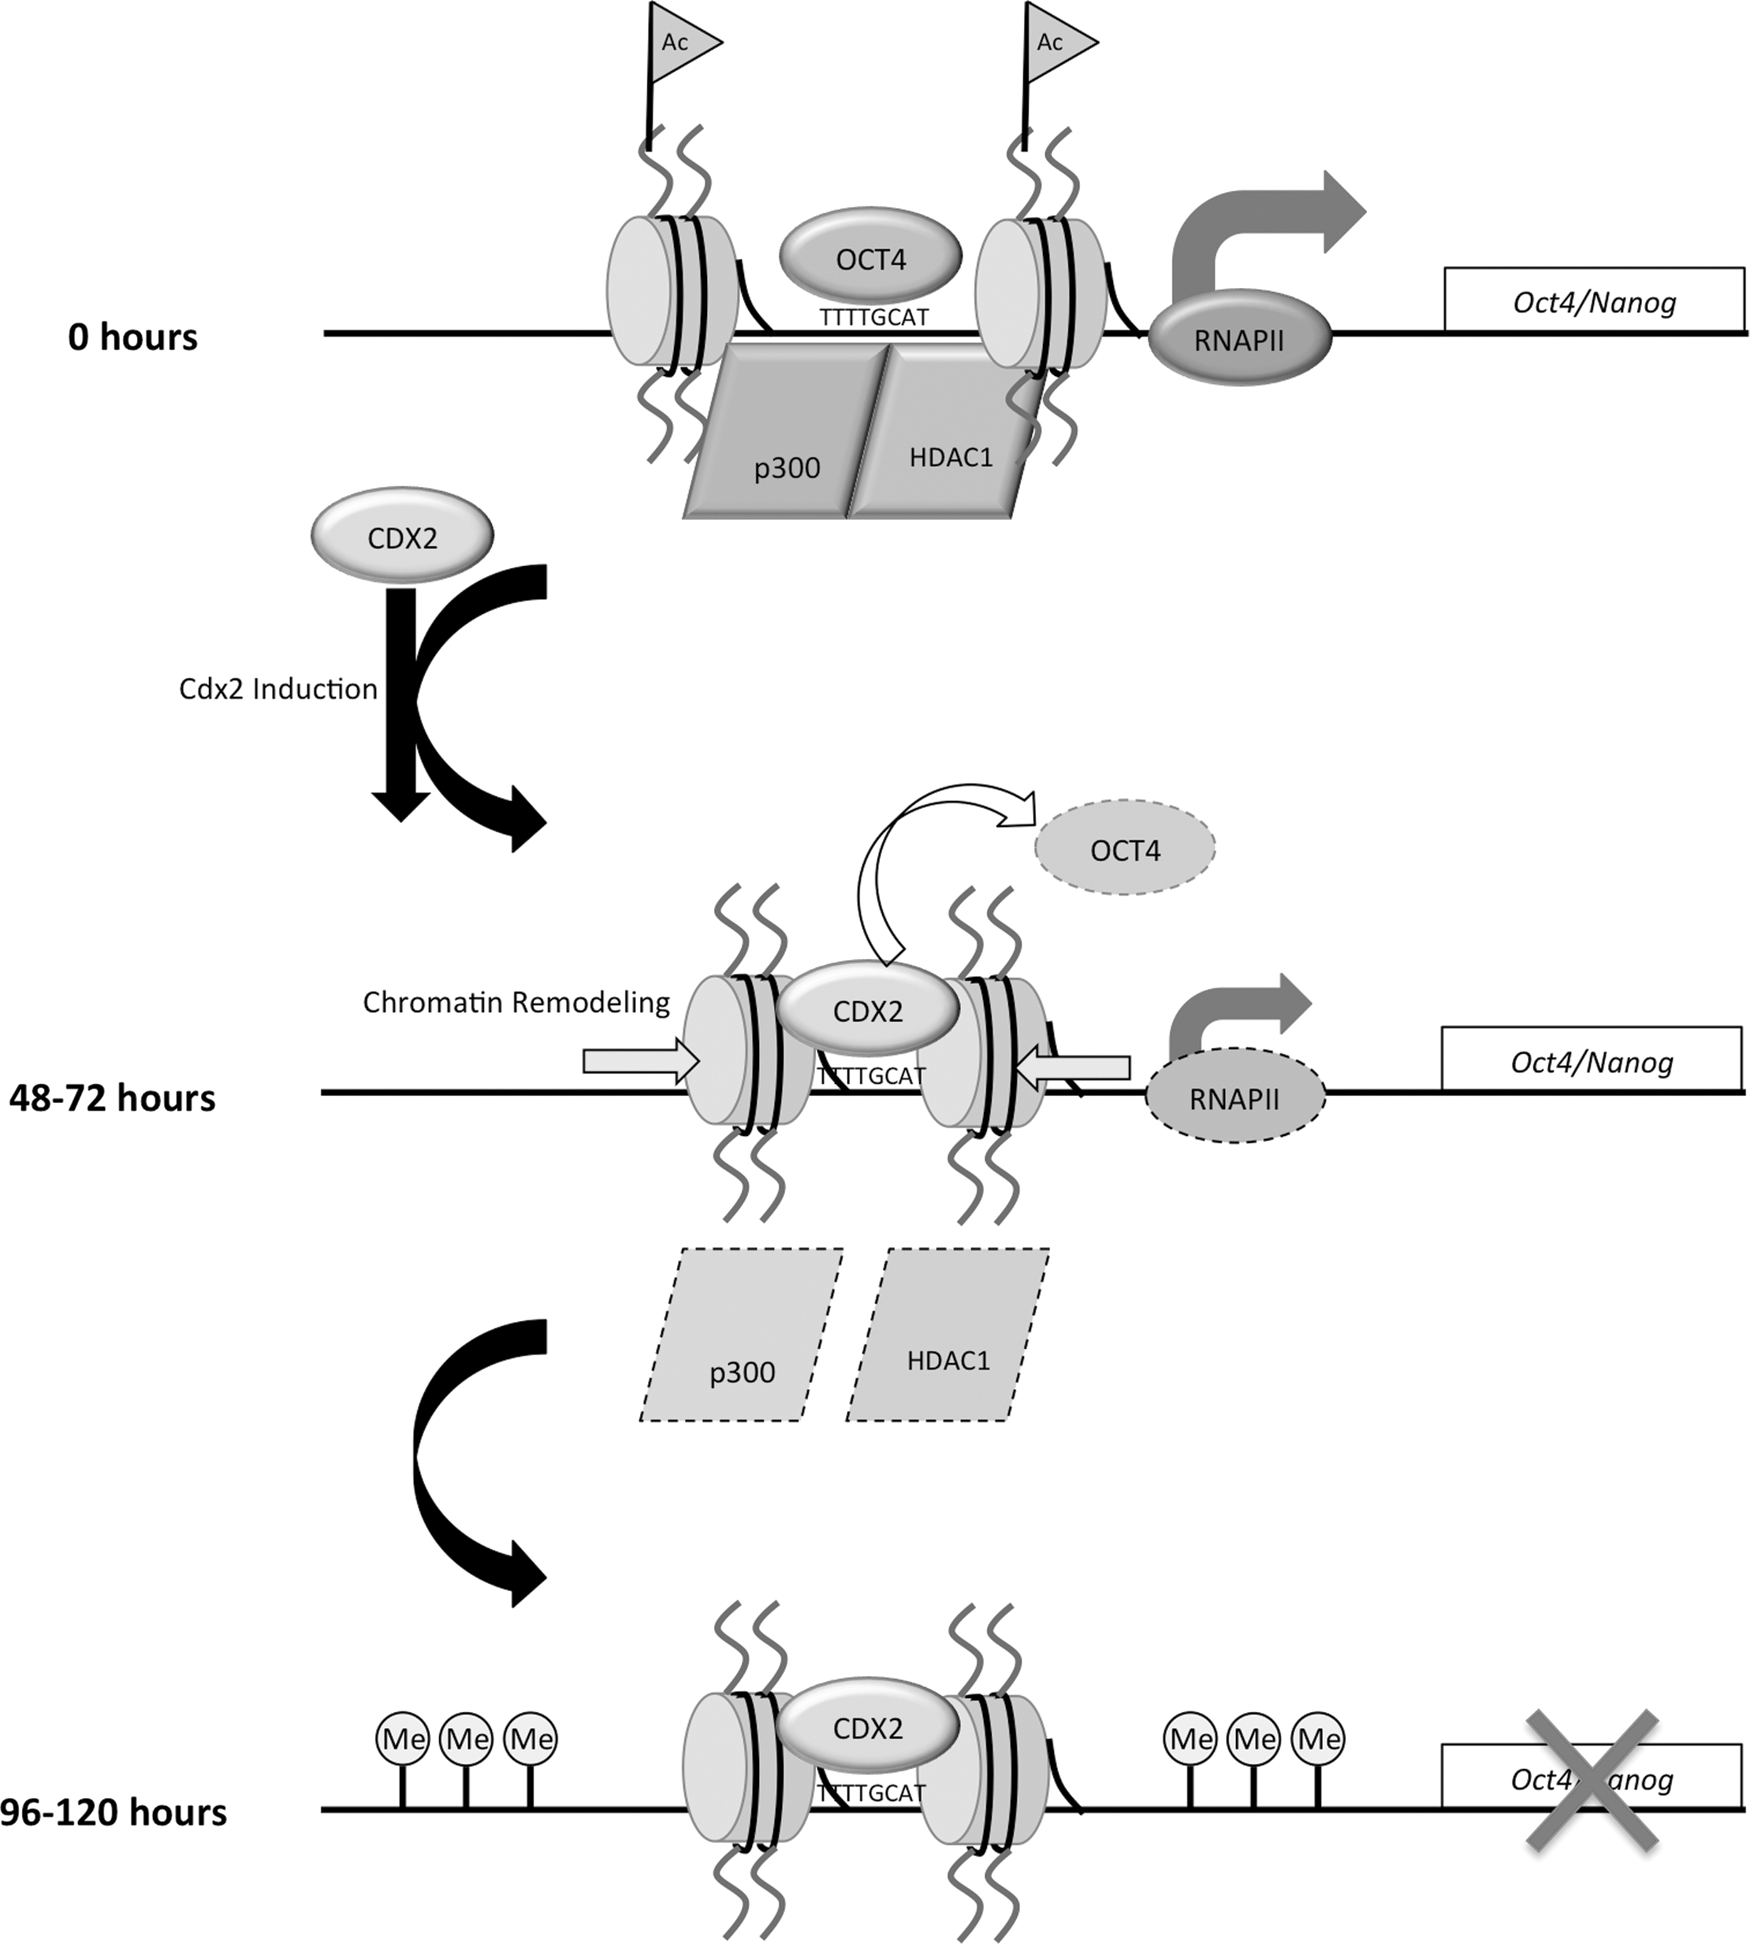
Transcriptional and chromatin-based model for silencing of Oct4 and Nanog in the trophoblast lineage. Concomitant with the recruitment of CDX2, the occupancy of OCT4 and RNAPII is lost at the Oct-Sox binding motif and TSS in Oct4 and Nanog during the early stages of transcriptional repression. Loss of histone H3K9/14 acetylation, HDAC, and p300 accompanies transcriptional reprogramming. In parallel with these changes, chromatin remodeling occurs at the Oct-Sox binding motif in Oct4 and Nanog. During the later stages of differentiation, DNA methylation occurs, facilitating transcriptional silencing.
In a previous work, we showed that CDX2-mediated silencing of Oct4 in mouse blastocysts requires coordinated epigenetic regulation [8]. Utilizing a Cdx2-inducible ES cell line as a model system for trophoblast lineage formation, we performed a time course analysis to build off of this work. This experimental approach allowed us to monitor differentiation within the same genetic background. From this study and our previous work [8], we established that CDX2 was recruited to the Oct-Sox binding motif in Oct4 and Nanog during the beginning stages of differentiation. Concomitant with the enrichment of CDX2, there was a loss of OCT4 and RNAPII binding. Since OCT4 functions as a key activator of Oct4 and Nanog expression in ES cells [23,24], it is probable that eviction of OCT4 represents an early event that is necessary for transcriptional repression of Oct4 and Nanog in the trophoblast lineage.
Accompanying the loss in OCT4 and RNAPII binding was a decrease in histone H3K9/14 acetylation, a well-established epigenetic marker of transcriptional activation. Recent studies showed that HATs and HDACs, modulators of histone H3 acetylation, occupy genes which are highly expressed in ES cells and T lymphocytes [28,39]. These include pluripotency genes such as Oct4 and Nanog in ES cells. Consistent with these findings, we observed enrichment of P300 and HDAC1 at Oct4 and Nanog in undifferentiated ES cells. After the induction of CDX2, the levels of histone H3K9/14 acetylation decreased accompanied by a loss of p300 and HDAC1. An interesting fact that we intend to further explore is the role of HDAC1 in regulation of Oct4 and Nanog in the trophoblast lineage. In this regard, genetic ablation of HDAC1 in ES cells results in increased levels of Nanog and abnormal differentiation [28,40]. Moreover, treatment of human and mouse ES cells with low doses of HDAC inhibitors promotes self-renewal in the absence of growth factors [41]. It will be interesting to determine whether HDACs play a central role in fine tuning and/or down-regulating Oct4 and Nanog expression in the trophoblast lineage. In this regard, CDX2 forms a complex with HDAC1 in Cdx2-induced ES cells [13], and both CDX2 and HDAC1 colocalize to the Oct-Sox binding motif in Oct4 and Nanog (this study). Thus, it is plausible that CDX2-dependent silencing of Oct4 and Nanog is mediated through HDAC1 and BRG1, while CDX2-dependent activation of trophoblast genes is mediated through interactions with specific co-activators.
A combination of restriction enzyme accessibility and histone H3 ChIP assays established that during differentiation, there was an increase in nucleosome density at the Oct-Sox binding motif in Oct4 and Nanog. Previous work in our laboratory demonstrated that the chromatin remodeling factor BRG1 cooperates with CDX2 to silence Oct4 expression in blastocyst TE [8]. The data presented here show that the transcriptional silencing of Oct4 and Nanog in Cdx2-inducible ES cells involves a chromatin remodeling activity that inserts/repositions a nucleosome at the Oct-Sox binding site when OCT4 binding is lost. In support of this notion, You et al. demonstrated that during retinoic acid (RA)-induced ES cell differentiation, there is a loss of OCT4 binding and an increase in nucleosome density at the Oct-Sox binding site in Oct4 and Nanog [42]. Since ablation of BRG1 in preimplantation embryos results in the failure to repress Oct4 and Nanog expression in the blastocyst TE [8,17], we postulate that BRG1 is providing a chromatin remodeling activity that cooperates with CDX2 to silence pluripotency genes in the TE. Ongoing experiments in our laboratory are implementing a combination of RNAi and higher resolution MNase mapping to functionally characterize the requirement of BRG1-containing SWI/SNF complexes in trophoblast development. This will be crucial to decipher whether CDX2/BRG1-dependent repression of Oct4 and Nanog involves chromatin remodeling, or perhaps whether BRG1 acts as a scaffold to recruit additional co-repressors to the Oct4 and Nanog promoters.
DNA methylation at CpG sites within the Oct4 and Nanog genes was acquired later within the time course employed in this article. This repressive modification appeared to be a final step during CDX2-mediated differentiation; at 96 and 120 h, the methylation profile was very similar to that observed in native TS cells. This finding is consistent with RA-induced ES cell differentiation, where Oct4 and Nanog silencing occurs in a step-wise manner with DNA methylation occurring after chromatin remodeling [42]. Interestingly, during early embryogenesis, DNA methylation does not occur in the trophoblast lineage until after implantation when Oct4 and Nanog are already down-regulated [12]. Combined, these data highlight the importance of other epigenetic modifications, such as covalent histone modifications and chromatin remodeling, in the specification of the trophoblast lineage during blastocyst formation when Oct4 and Nanog are transcriptionally repressed.
In summary, this study demonstrates that changes in histone H3K9/14 acetylation, chromatin remodeling, and CpG methylation accompany several transcriptional changes during silencing of Oct4 and Nanog in the trophoblast lineage. The timing of these changes, combined with our previous observations in the mouse preimplantation embryo [8,17], provide novel insights into potential mechanisms that may regulate pluripotency gene silencing in the trophoblast lineage. It will be important to establish whether BRG1-dependent chromatin remodeling at the Oct-Sox binding motif acts as a mechanism to displace OCT4 binding to mediate Oct4 and Nanog repression. A potential broader impact of this research is on understanding how perturbations in the trophoblast specification disrupt implantation and/or postimplantation development. This is especially important for enhancing the efficiency of methods utilized in human-assisted reproductive technologies, where a substantial proportion of embryos fail to development into live offspring [43].
Footnotes
Acknowledgments
The authors are grateful for Ms. Roya Oliai's assistance with the western blot analysis. Furthermore, they thank Dr. Minoru Ko of the NIA for providing them with the Cdx2-inducible ES cell line before it became commercially available. They express their gratitude to Dr. Anthony Imbalzano for providing them with the BRG1 anti-serum for ChIP. This work was supported by NIH grants GM095347 to J.G.K. and an MSU gene expression in development and disease (GEDD) fellowship to T.S.C.
Author Disclosure Statement
No competing financial interests exist.
References
Supplementary Material
Please find the following supplemental material available below.
For Open Access articles published under a Creative Commons License, all supplemental material carries the same license as the article it is associated with.
For non-Open Access articles published, all supplemental material carries a non-exclusive license, and permission requests for re-use of supplemental material or any part of supplemental material shall be sent directly to the copyright owner as specified in the copyright notice associated with the article.