
Abstract
Electrical stimulation (ES) of cells has been shown to induce a variety of responses, such as cytoskeleton rearrangements, migration, proliferation, and differentiation. In this study, we have investigated whether monophasic and biphasic pulsed ES could exert any effect on the proliferation and differentiation of human cardiac progenitor cells (hCPCs) isolated from human heart fragments. Cells were cultured under continuous exposure to monophasic or biphasic ES with fixed cycles for 1 or 3 days. Results indicate that neither stimulation protocol affected cell viability, while the cell shape became more elongated and reoriented more perpendicular to the electric field direction. Moreover, the biphasic ES clearly induced the upregulation of early cardiac transcription factors, MEF2D, GATA-4, and Nkx2.5, as well as the de novo expression of the late cardiac sarcomeric proteins, troponin T, cardiac alpha actinin, and SERCA 2a. Both treatments increased the expression of connexin 43 and its relocation to the cell membrane, but biphasic ES was faster and more effective. Finally, when hCPCs were exposed to both monophasic and biphasic ES, they expressed de novo the mRNA of the voltage-dependent calcium channel Cav 3.1(α1G) subunit, which is peculiar of the developing heart. Taken together, these results show that ES alone is able to set the conditions for early differentiation of adult hCPCs toward a cardiac phenotype.
Introduction
T
Indeed, c-kit/Sca-1 hCPCs isolated from atrial biopsies, which display stemness features [6 –8], were used to fabricate scaffoldless patches that were transplanted on the heart of mice and shown to engraft into the host tissue. The in vivo microenvironment provided important signals, since the transplanted cells acquired de novo expressions of some cardiomyogenic markers [6]. Cardiac commitment/differentiation of hCPCs in vitro has been usually approached by the application of exogenous biochemical factors [9 –13]. Physical signals, such as electrical stimulation (ES) of stem/progenitor cells, are known to induce a variety of responses, such as wound-healing and galvanotaxis [14], angiogenesis [15], neurogenesis, and myogenesis [16,17]. In particular, since the heart is composed of contractile cells driven by ion currents, the latter are recognized to play a key role in cardiomyogenesis in vivo [18]. In vitro ES can improve the functional assembly of neonatal mouse and rat cardiomyocytes into contractile engineered cardiac tissues [19 –21] and promote the differentiation toward the cardiac lineage of mouse embryonal stem cells [22]. However, few recent studies have been undertaken to elucidate the possible effects of ES as cardiopoietic signals in adult human stem cells [23 –26].
In this study, hCPCs were subjected to electric stimulation by means of an ad hoc designed bioreactor. In particular, the cardiomyogenic effectiveness of two protocols based on the application of pulsed monophasic and biphasic ES to induce precardiac differentiation in c-kit/Sca-1 hCPCs was evaluated.
Materials and Methods
Cell culture
hCPCs were obtained from biopsies provided by the Department of Cardiac Surgery of the Clinica San Gaudenzio, Novara (Italy) from patients undergoing cardiac surgery after signing a written informed consent according to a protocol approved by the Institutional Review Board (IRB) of Novara (Italy). Samples of right auricula were processed as described by Forte and colleagues [6]. Briefly, 1–3 mm3 specimens were mechanically minced and enzymatically digested; partially digested tissue fragments were then plated on 0.02% gelatin-coated dishes in 1/3 Claycomb (Sigma Aldrich) and 2/3 F12K (Invitrogen Life Technologies Italia), 10% fetal bovine serum (FBS; Lonza Biowittaker), 100 IU/mL penicillin, and 100 μg/mL streptomycin (Sigma Aldrich) and cultured at 37°C in 5% CO2, changing the medium every other day. After 7–14 days, the cells migrating from the fragments were harvested by trypsinization, expanded to obtain approximately 5×10⁶/each biopsy and were sorted by magnetic immunobeads using the anti-c-kit antibody (Miltenyi Biotec GmbH). Cells were used from the third until the seventh passage after immunselection.
The experiments reported in the present study were performed using five different preparations of hCPCs, AU110, AU572, AU1975, AU1778, and AU 2115, which, in this study, are named from 1 to 5, respectively.
Characterization of hCPCs
Cytofluorimetry
Cells from the third passage after immunoselection were detached with 5 mM ethylenediaminetetracetic acid (EDTA; Sigma-Aldrich), washed twice with phosphate-buffered saline (PBS), and incubated 20 min with PE-labeled antibodies against CD117, CD90, CD34, CD45 (Biolegend), and Sca-1 (BD Bio-sciences) and FITC-labeled CD105 and CD44 antibodies (Biolegend), following the manufacturer's instructions. Cells were then washed twice with ice-cold PBS and fixed in buffered 1% paraformaldehyde, 2% FBS for 15 min at 4°C, and analyzed with the FACScalibur flow cytometer (BD Bio-sciences) within 48 h.
RT-PCR and quantitative real-time PCR
For reverse transcription-PCR (RT-PCR), total RNA was extracted in the Trizol® reagent (Invitrogen), followed by DNAse treatment (DNAse I; Fermentas). Then, 1 μg of RNA was retrotranscribed into cDNA with the RevertAid™ H Minus First Strand cDNA Synthesis Kit (Fermentas) using the oligo(dT) primers listed in Table 1. PCR was performed using the PCR Master Mix 2× kit (Fermentas) in a final volume of 25 μL containing 50 ng of cDNA and 200 nM primers. The PCR conditions were 94°C for 2 min, 35 cycles 94°C for 30 s, annealing temperature for 30 s (see Table 1), 72°C for 30 s, and finally, 72°C for 7 min. For β-actin, 25 cycles were performed. The amplified products were resolved in 2% agarose gel electrophoresis, stained with ethidium bromide, and documented with the GelDoc system (Biorad Laboratories).
T.M., temperature of melting.
RT-PCR, reverse transcription-PCR; qRT-PCR, quantitative real-time PCR.
For quantitative real-time PCR (qRT-PCR), total RNA was extracted and retrotranscribed into cDNA as described above. Single gene expression was normalized to that of the ribosomal 18S rRNA housekeeping gene. Analyses were based on the methods previously described and adapted in our laboratory [8,27,28]. Briefly, assays were performed in triplicate for each treatment in a 20-μL reaction volume containing 1 μL of RT products, 10 μL EVA Green SMX (BioRad), and 300 nM of each forward and reverse primers, as indicated in Table 1. An automated CFX96 thermocycler was used (BioRad). The reaction conditions were 95°C for 3 min, followed by 35 cycles of data collection at 98°C for 5 s, and an anneal–extend step for 5 s at 60°C (Table 1), specific for each primer couple. At the end of these cycles, a melting curve (65°C to 95°C, with plate read every 0.5°C) was performed to assess the specificity of the amplification product by a single peak verification (eg, the 18S rRNA melting temperature peak was 86°C, the other genes ranged between 82°C and 88°C). Results were analyzed with BioRad CFX Manager and exported to Excel (Microsoft) for calculation and statistical analysis. For each data point, the Ct gene/Ct 18S rRNA value was calculated, where threshold cycle Ct values were determined from semilog amplification plots (log increase in fluorescence versus cycle number). The relative ratio of each target gene repeat copy number to the 18S rRNA copy number (ΔCt) for each time point was calculated as
[2Ct(target gene)/2Ct(18SrRNA)]−1=2−ΔCt, and related to the reference samples by using the formula: 2−(ΔCt treatment–ΔCt primary)=2−ΔΔCt. Samples with a 2−ΔΔCt greater than or lower than 1, had an average expression level greater or lower compared with the reference samples, respectively.
Electrical stimulation
We developed a bioreactor able to apply highly controlled ES protocols to the cultured cells. It is composed of a multichamber culture system with a set of two chassis hosting 12 independent silicone culture chambers (Fig. 2a left), and connected to a custom-made, computer-based, programmable electric stimulator for the pulse generation. Each chamber (30×15×12 mm), rectangularly shaped, is made of polydimethylsiloxane (PDMS, Sylgard 184®; Dow Corning). The production of the chambers was obtained by the mould casting technique. The bottom surface of the chambers and the covers are flat and transparent to allow optimal visualization of the cells. We included in each chamber a couple of parallel electrodes, fabricated with AISI 316 stainless steel rods (2.5 mm diameter) and placed 12 mm apart. Two spring connectors, mounted on the chassis, allow the electrical connection between the electrodes and the electric stimulator, which is able to generate monophasic and biphasic voltage stimulation with adjustable square waveforms (amplitude, pulse width, and frequency). The electric stimulator is designed and integrated in the culture system based on a low-cost and open source I/O board (Arduino UNO, Smart Projects), coupled with a National Instrument data acquisition board (PCMCIA, NI DaqCard6024E; National Instrument), the latter used to record the voltage signal delivered to the stimulating electrodes at a 25 kHz sampling rate. The whole system design was performed with advanced engineering techniques, including finite-element-method (FEM) simulations [29].
For ES, hCPCs were plated at a density of 5,000 cells/cm2 onto sterile, 0.1% gelatin-precoated glass slides (Marienfeld laboratory glassware), which provided a square surface of 2 cm2, and cultured for 24 h in standard conditions, before slides were transferred into PDMS chambers and placed in the bioreactor. Either monophasic (2 ms, 1 Hz, 5 V amplitude) or biphasic (2 ms, 1 Hz,±2.5 V) square-wave pulses were applied to the cultured cells (Fig. 2b). Cells were stimulated for up to 3 days and the medium was changed daily.
Cell viability and proliferation assays
MTT assay
After ES for the different periods of time (1, 2, and 3 days), slides were transferred to conventional plates and cell viability was evaluated by the 3-(4,5-dimethylthiazol-2-yl)-2,5-diphenyltetrazolium bromide colorimetric assay (MTT; Sigma Aldrich). Briefly, 60 μL of MTT solution (5 mg/mL in PBS) was added to each sample, which contained 300 μL of culture medium. Samples were then incubated at 37°C for 3 h. Afterward, the medium was eliminated and 0.2 N HCl in isopropanol was added to dissolve formazan crystals. The optical density was measured in a multiwell reader (2030 Multilabel Reader Victor TM ×4; Perkin Elmer) at 570 nm. Three different experiments were performed analyzing three replicates for each sample. Results are expressed as the percentage of proliferation of ES cells relative to T0 (cell number before ES application). Each experimental condition was assessed in triplicate in three separate experiments.
LIVE/DEAD assay
The cell viability of stimulated and unstimulated hCPCs was evaluated with the live/dead staining kit (Biovision) after 3 days of ES. In this assay, living cells are stained with the cell-permeable green fluorescent dye and nonliving cells are stained in red with propidium iodide (PI). Freshly stained cells were analyzed by a laser scanning confocal microscope (Leica TCS SP2).
Morphometric analysis
Images taken at 20× magnification with a microscope (Zeiss HB050 and Qimaging RETIGA 2000R camera) were analyzed by drawing cell outlines using the ImageJ software. The length of the major axis of the cell was taken as the cell length [26]. For each experimental time point (1 and 3 days), 50 to 60 cells were considered in each of the ten images taken from the three separate experiments. The ImageJ software was used also to define the angle of the major axis of the cells. The direction parallel to the electric field was assumed as 0° (Fig. 3a, top left). The degree of alignment and orientation of hCPCs were represented as a percentage of the total number of cells and referred to 10° angle intervals ranging from 0° to 90°.
Immunofluorescence analysis
Cells were fixed in 3% paraformaldehyde in PBS for 20 min, washed, permeabilized with 0.2% Triton ×100 in PBS for 10 min, washed, and incubated with rabbit antibodies (Abcam) against Cx43 (1/400) and GATA-4 (1/400) in PBS, 1% bovine serum albumin (BSA), and 4% goat serum for 2 h at room temperature, followed by secondary Alexa Fluor® 488 and tetramethylrhodamine isothiocyanate (TRITC)-labeled goat anti-rabbit IgG antibodies (1:500; Invitrogen) for 45 min at room temperature. Cell nuclei were counterstained with DAPI (1:200; Sigma-Aldrich). The expression of GATA-4 was quantified in control unstimulated and monophasic and biphasic stimulated cells by manual counting. The percentage of positive cells was calculated as the number of nuclei stained for GATA-4 versus the total nuclei stained with DAPI. For each experimental time point (1 and 3 days), a number ranging between 50 and 200 nuclei was considered in each of the ten images taken from three separate experiments. Images were taken with the fluorescence Leica DM5500B microscope.
Western blot analysis
Unstimulated and electrically stimulated hCPCs for 1 and 3 days were washed twice with cold PBS and lysed in the RIPA buffer (20 mM Tris-HCl pH 7.5, 150 mM NaCl, 50 mM HEPES, 0.1% SDS, 1 mM EGTA, 1% NP-40, 1% sodium deoxycholate, 2.5 mM sodium pyrophosphate, 10% glycerol, and a cocktail of protease inhibitors (Sigma-Aldrich)). Cell lysates were centrifuged at 13,000 rpm and 4°C for 15 min. Total cell extracts (20 μg of protein) were denatured by heating for 5 min at 95°C in a reducing Laemmli buffer; proteins were resolved by sodium dodecyl sulfate–polyacrylamide gel electrophoresis (SDS-PAGE) in two identical gels (except that 1/10 of each extract was used for probing for actin) and then transferred onto PVDF filters. Filters were blocked with methanol for 5 min, rinsed in water, and probed either with monoclonal antibodies against troponin T (1:1,000; Abcam) or β-actin (1:2,000; Thermo Scientific) diluted in Tris-buffered saline (TBS), 5% BSA, for 2 h at room temperature. After extensive washing, immunocomplexes were detected with horseradish peroxidase-conjugated secondary anti-mouse IgG antibodies followed by enhanced chemiluminescence (ECL kit; GE Healthcare Europe GmbH) and analyzed in a Versadoc instrument (Biorad).
Statistical analysis
Quantitative analyses are presented as mean±standard deviation (SD) and differences between samples were determined by the Student's t-test. One-way ANOVA and Bonferroni post-test analyses on selected pairs of groups were also performed with Prism (GrapPad software, Inc.; version 4.03). Values with a P≤0.05 or P≤0.01 were considered as statistically significant.
Results
Characterization of CPCs
Cells that migrated from digested fragments reached confluence after a few days, were expanded once and then enriched for the fraction expressing c-kit by an immunomagnetic procedure. The enriched population was expanded again and characterized for its immunophenotype in cytofluorimetry starting from passage 3. At this passage, most of the cells remained positive for mesenchymal stemness markers, Sca-1 and CD44, while the expression of the stemness marker c-kit was found to be decreased (Fig. 1a). Similar, somehow unexpected, data were already reported and explained by postulating that, rather than being different cell populations, c-kit(+)/Sca-1(+) cells and c-kit(−)/Sca-1(+) cells represent two phenotypic stages of the same original population. In such cells, c-kit could mark the more immature cell pool, and Sca-1 could mark a more mature actively growing cell population, resembling more, a transit-amplifying population [6]. Indeed, both cell populations displayed similar multipotency [6]. Cells were also positive for the mesenchymal markers, CD90 and CD105, while they were negative for the hematopoietic markers, CD34 and CD45. The expression of such markers was maintained through all the used cell cultures.
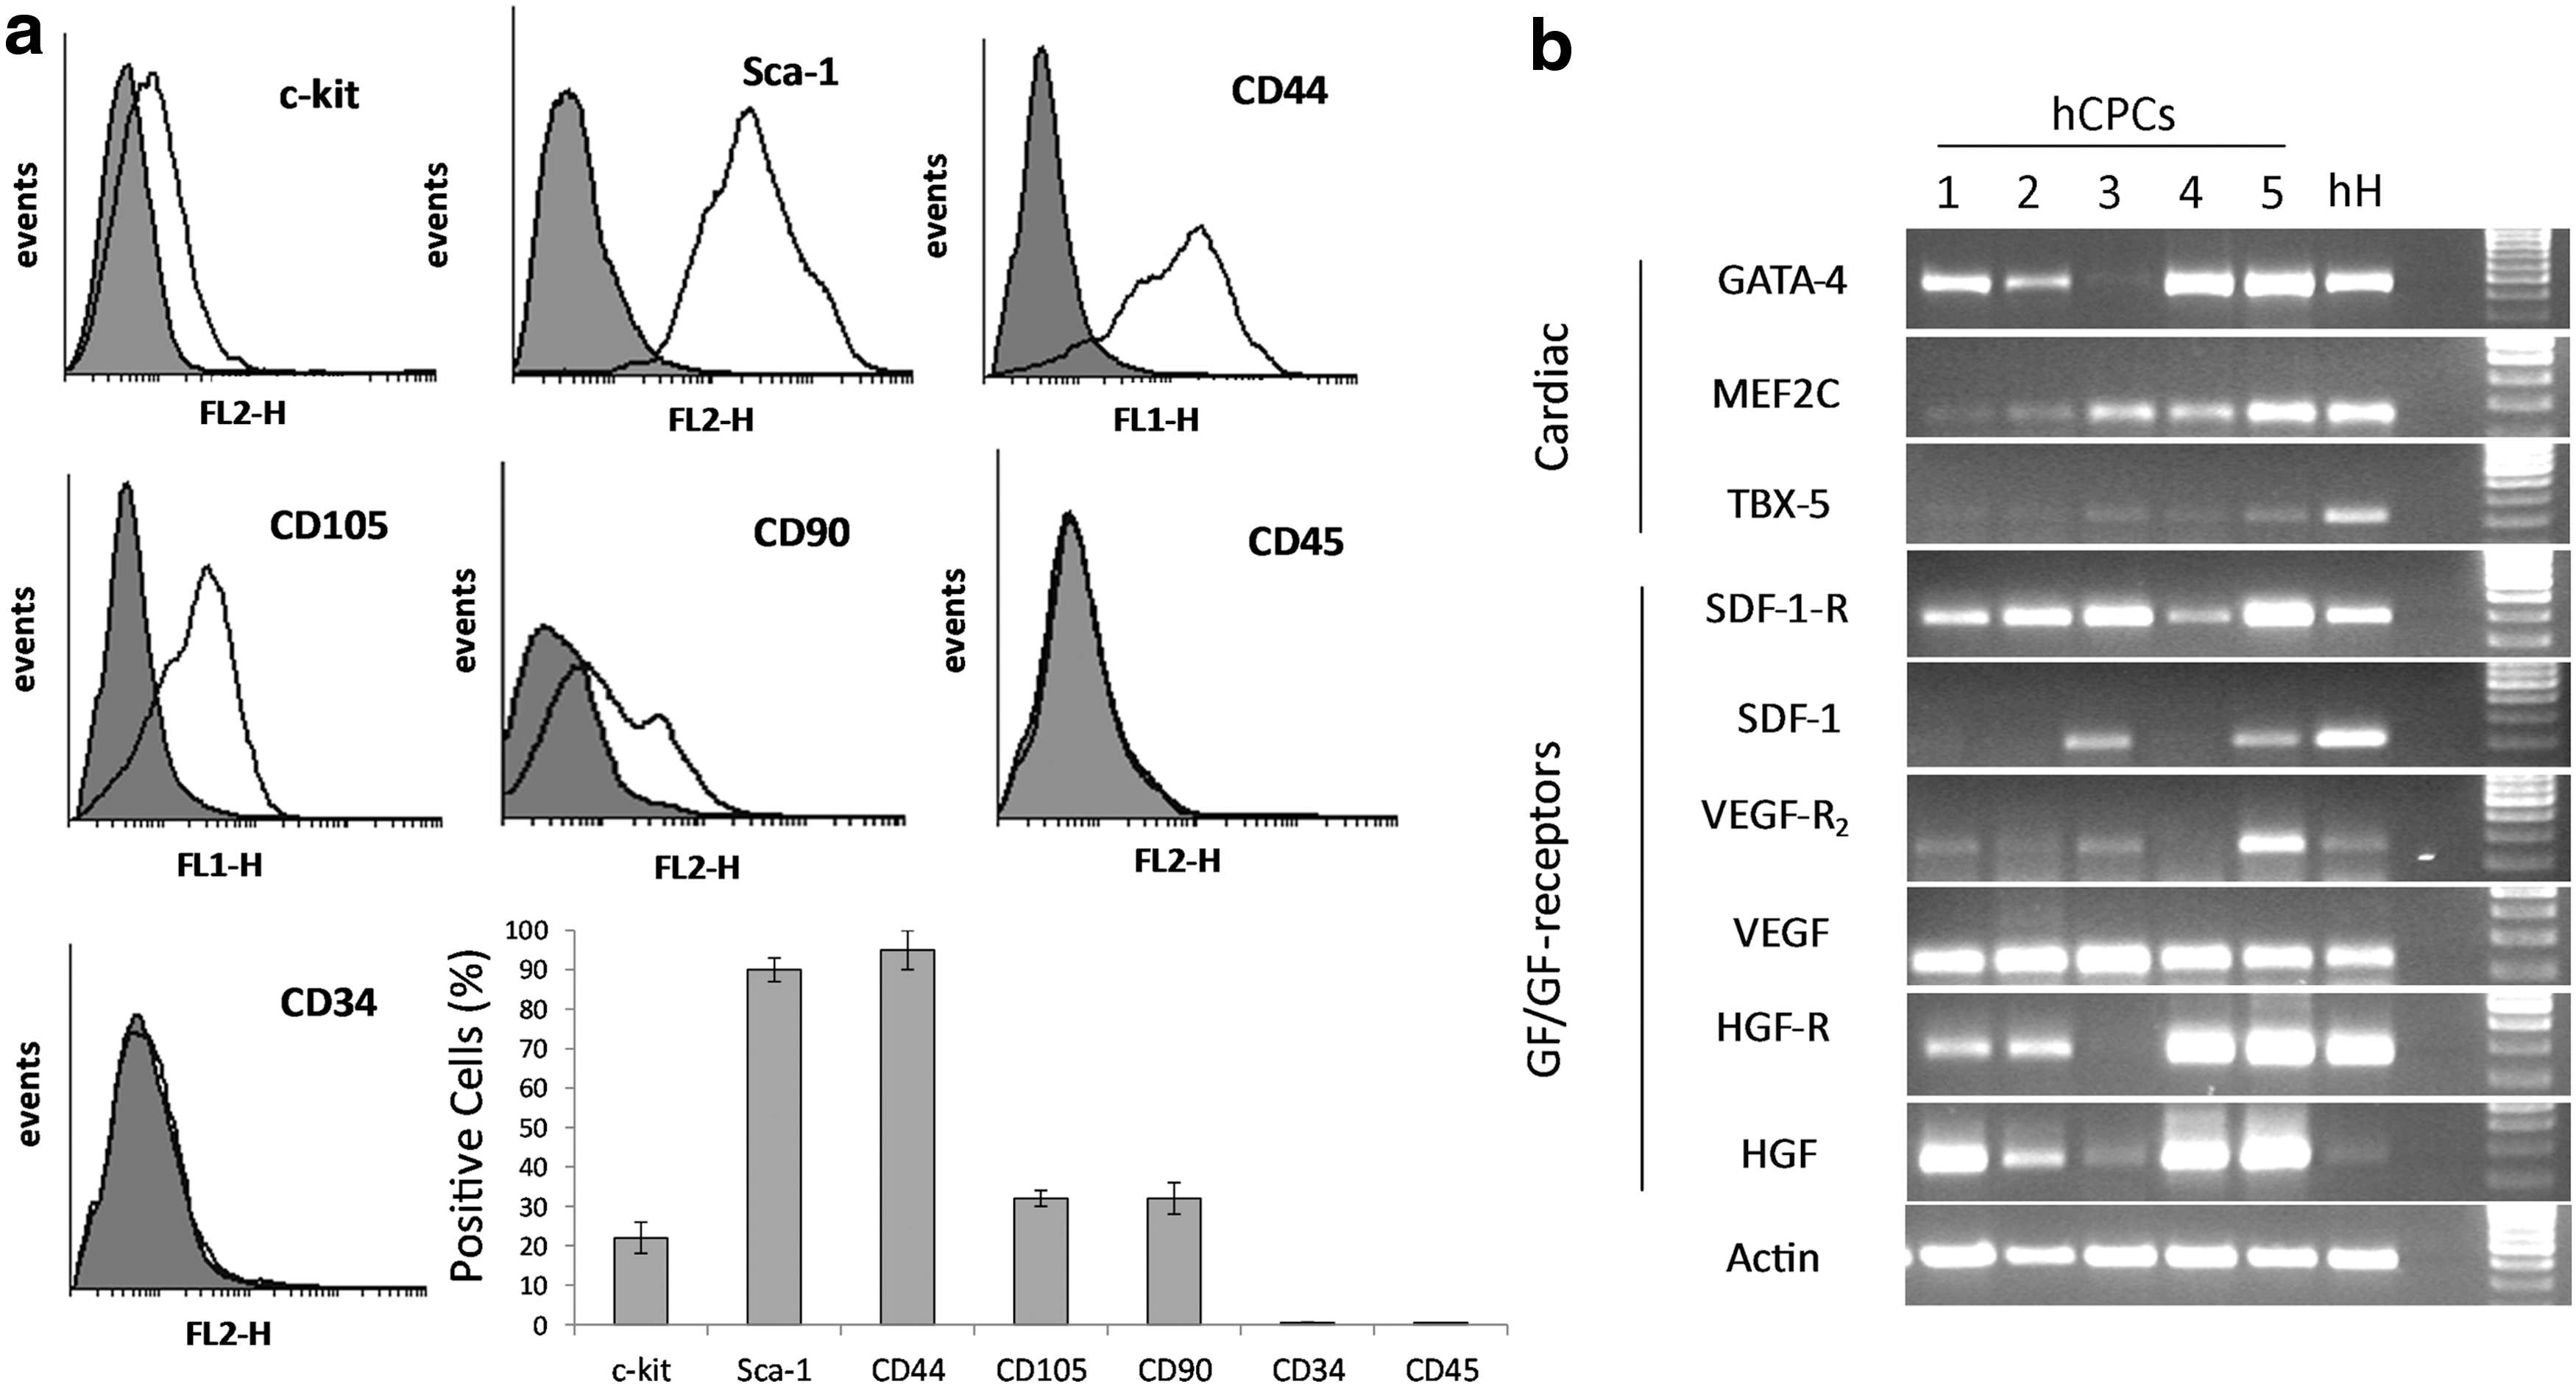
Characterization of human cardiac progenitor cells (hCPCs). The phenotype of hCPCs at passage 3 after immunomagnetic selection for c-kit.
The expression of early cardiac markers as well as growth factors and their receptors (GF/GF-R) was evaluated by reverse transcription-PCR (Fig. 1b) Human heart tissues derived from the same patients were used as reference controls. The early cardiac markers, GATA-4, MEF2C, and TBX-5, were detectable in samples from all the patients, although a significant variability was found. In addition, growth factors were expressed in all samples, while in few cases, the cognate receptors could not be detected.
Effects of ES on cell proliferation and viability
We first evaluated the effect of ES on hCPC proliferation and viability. The pulse duration and rate were selected to provide the stimulated cells with a biomimetic-like electric stimulation pattern: the selected values are indeed characteristic of the electric activity of the native myocardium of different animal species [30,31]. Additionally, the 2 ms pulse duration was adopted to dissipate the double-layer effect of the electrodes between subsequent pulses, as previously described in the literature [32,33], Furthermore, based on preliminary stimulation experiments on hCPCs (not shown), a 5 mV pulse amplitude (which, according to our FEM simulations [29], produced a 3.4 V/cm pulse amplitude of electric field in the cell culture region) demonstrated to be the maximum safe stimulation voltage amplitude not inducing cell death/apoptosis and/or cell detachment from the glass substrate. Figure 2b top depicts the voltage pulses recorded at the electrodes, whose shapes closely replicate pure square waves (superimposed noise<1% of the pulse amplitudes).
The proliferation rate of the cells exposed to both monophasic and biphasic ES, as determined in an MTT assay, was similar to that of the unstimulated cells in the first 2 days. On the third day, unstimulated and stimulated hCPCs with monophasic ES slowed down their proliferation rate. By contrast, biphasic ES completely stopped the cell growth (Fig. 2c). For both stimulation protocols (monophasic and biphasic pulses), cell viability, as determined by the qualitative Live/Dead assay after 3 days of ES, was similar to that of unstimulated cells, with few nuclei positive for PI staining, thus suggesting that the ES protocols did not affect hCPC viability (Fig. 2d).
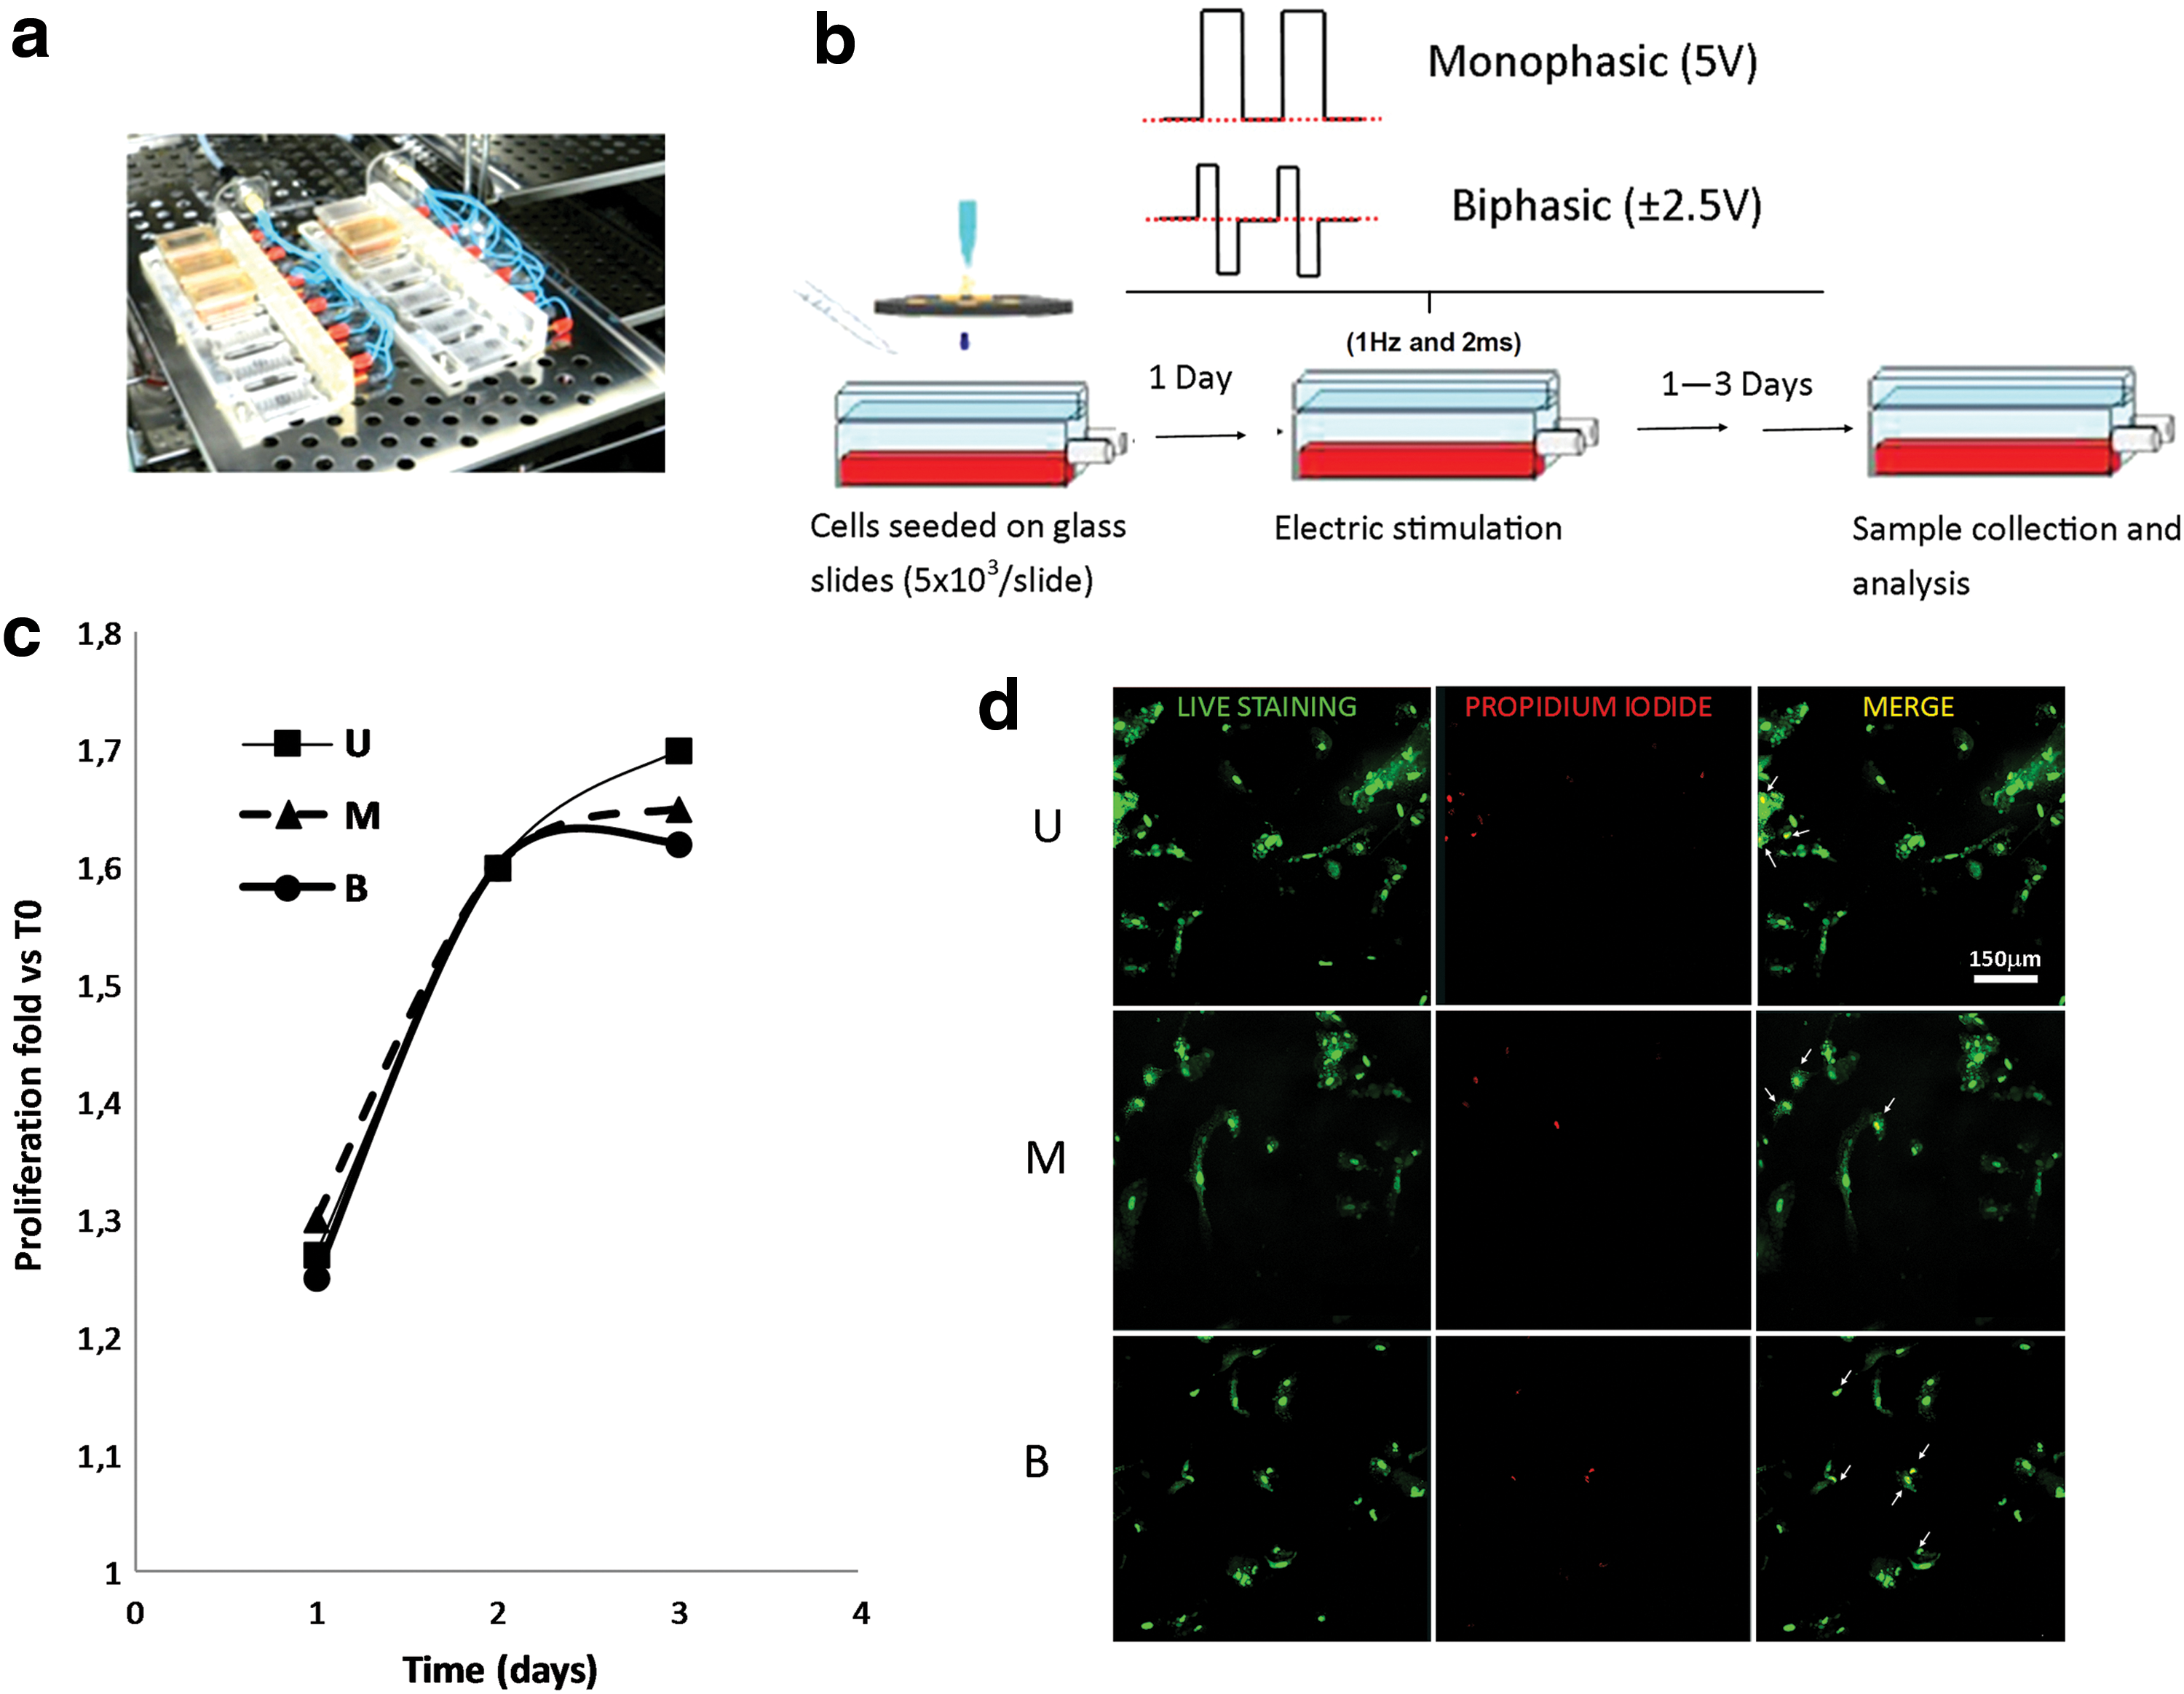
Electrical stimulation cell culture system and its validation in proliferation and viability tests.
Effects of ES on cell morphology and orientation
ES was responsible for evident modification of cell morphology that became spindle shaped (Fig. 3a). Biphasic stimulation effects were significantly evident already after 1 day of treatment and increased after 3 days. In the case of monophasic ES, these changes were observed only after 3 days of stimulation. Furthermore, cells increased their length around 70% and 100% after 1 and 3 days of biphasic stimulation, respectively (Fig. 3b). Monophasic stimulation affected the cell length to a lesser extent, since they increased their length by 30%, but only after 3 days of stimulation (Fig. 3b). Moreover, the random spatial orientation of the unstimulated hCPCs was replaced by an evident alignment of about 30% of the cells with an angle of 30–40° relative to the direction of the electric field within the chamber after 1 day of biphasic ES (Fig. 3c). A higher percentage of oriented cells were observed after 3 days of ES and, more interestingly, the angle interval increased up to 50–60°, with the final result that cells tend to align perpendicular to the direction of the electric field (Fig. 3d). A similar trend was observed also for hCPCs stimulated with monophasic pulses, although this effect was observed only after 3 days of ES and in a lower percentage of cells (oriented cells were around 22%) displaying an angle of only 30–40° (Fig. 3d).
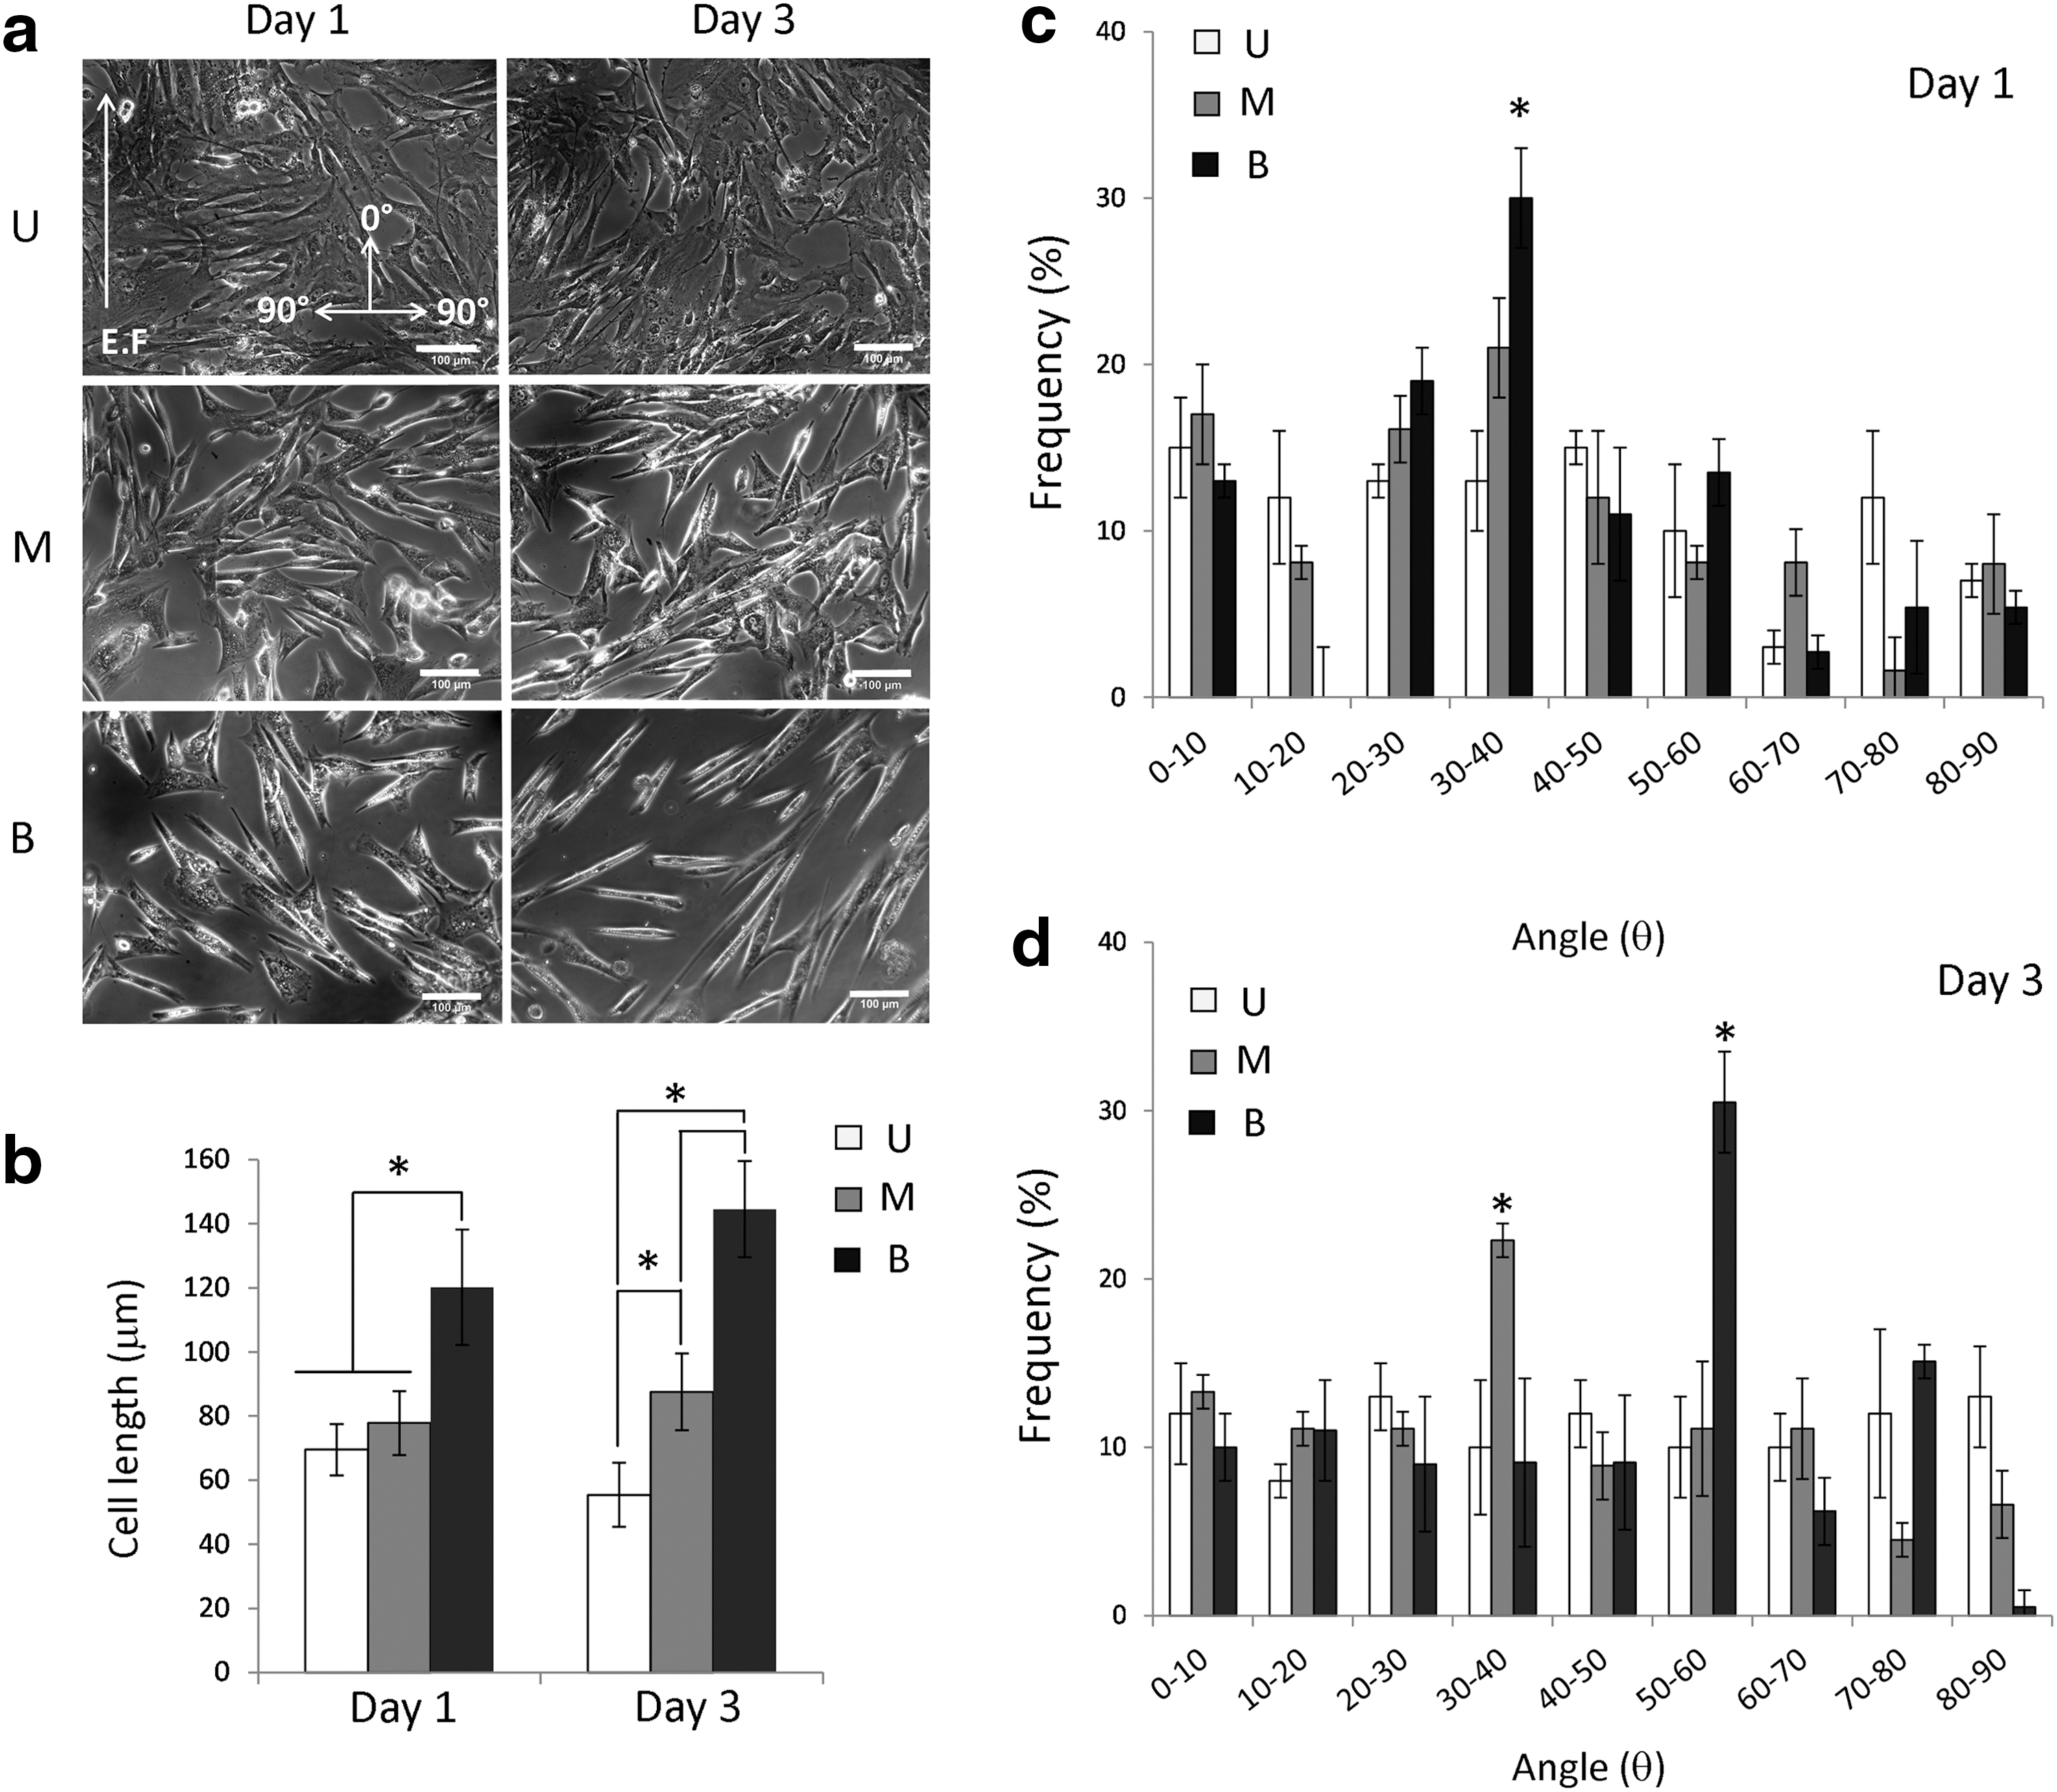
Effects of ES on hCPC elongation and alignment.
ES induces the upregulation of cardiac early commitment and delayed genes
hCPCs were found to express the GATA-4, MEF2C, and TBX-5 markers typical of early cardiac commitment (Fig. 1b). To evaluate whether ES induced a further stronger commitment toward a more mature cardiac phenotype, qRT-PCR experiments were performed to investigate whether ES could induce the upregulation of cardiac-related genes, such as MEF2D, GATA-4, Nkx2.5, Cx43, CAA (cardiac alpha-actinin), troponin T, SERCA 2a, and Cx43, which are known to be positively modulated during cardiac differentiation. The mRNA expression levels for the above-mentioned cardiac markers were referred to those of hCPCs (Fig. 4a). Biphasic protocol had a clear effect in modulating the expression of these genes. Indeed, the three early cardiac markers, MEF2D, GATA-4, and Nkx2.5, were upregulated after 3 days of ES, and in the case of MEF2D and GATA-4, their levels were already increased after a 1-day stimulation, although at a lower level, than at a 3-day treatment. The monophasic pulse was less efficient, since only a slight upregulation could be detected, which was evident only after 3 days. Both stimulation protocols upregulated the cardiac markers, Cx43, troponin T, CAA, and SERCA 2a. In particular, Cx43 expression was already increased after 1-day stimulations, reaching its higher levels after 3 days of biphasic stimulation, while the expression of the late markers, CAA and SERCA 2a, was upregulated only after 3 days of stimulation. The expression of the late marker troponin T was highly upregulated already after a 1-day biphasic stimulus and, intriguingly, was downregulated to basal levels after 3 days of treatment. As for the other markers, monophasic stimulation induced upregulation of the troponin T gene expression only after 3 days of treatments. The overall gene expression pattern time course normalized versus the culture cells before ES (day 0) showed no significant differences of gene expression between the untreated cells (U) at day 1 and day 3 (data not shown).
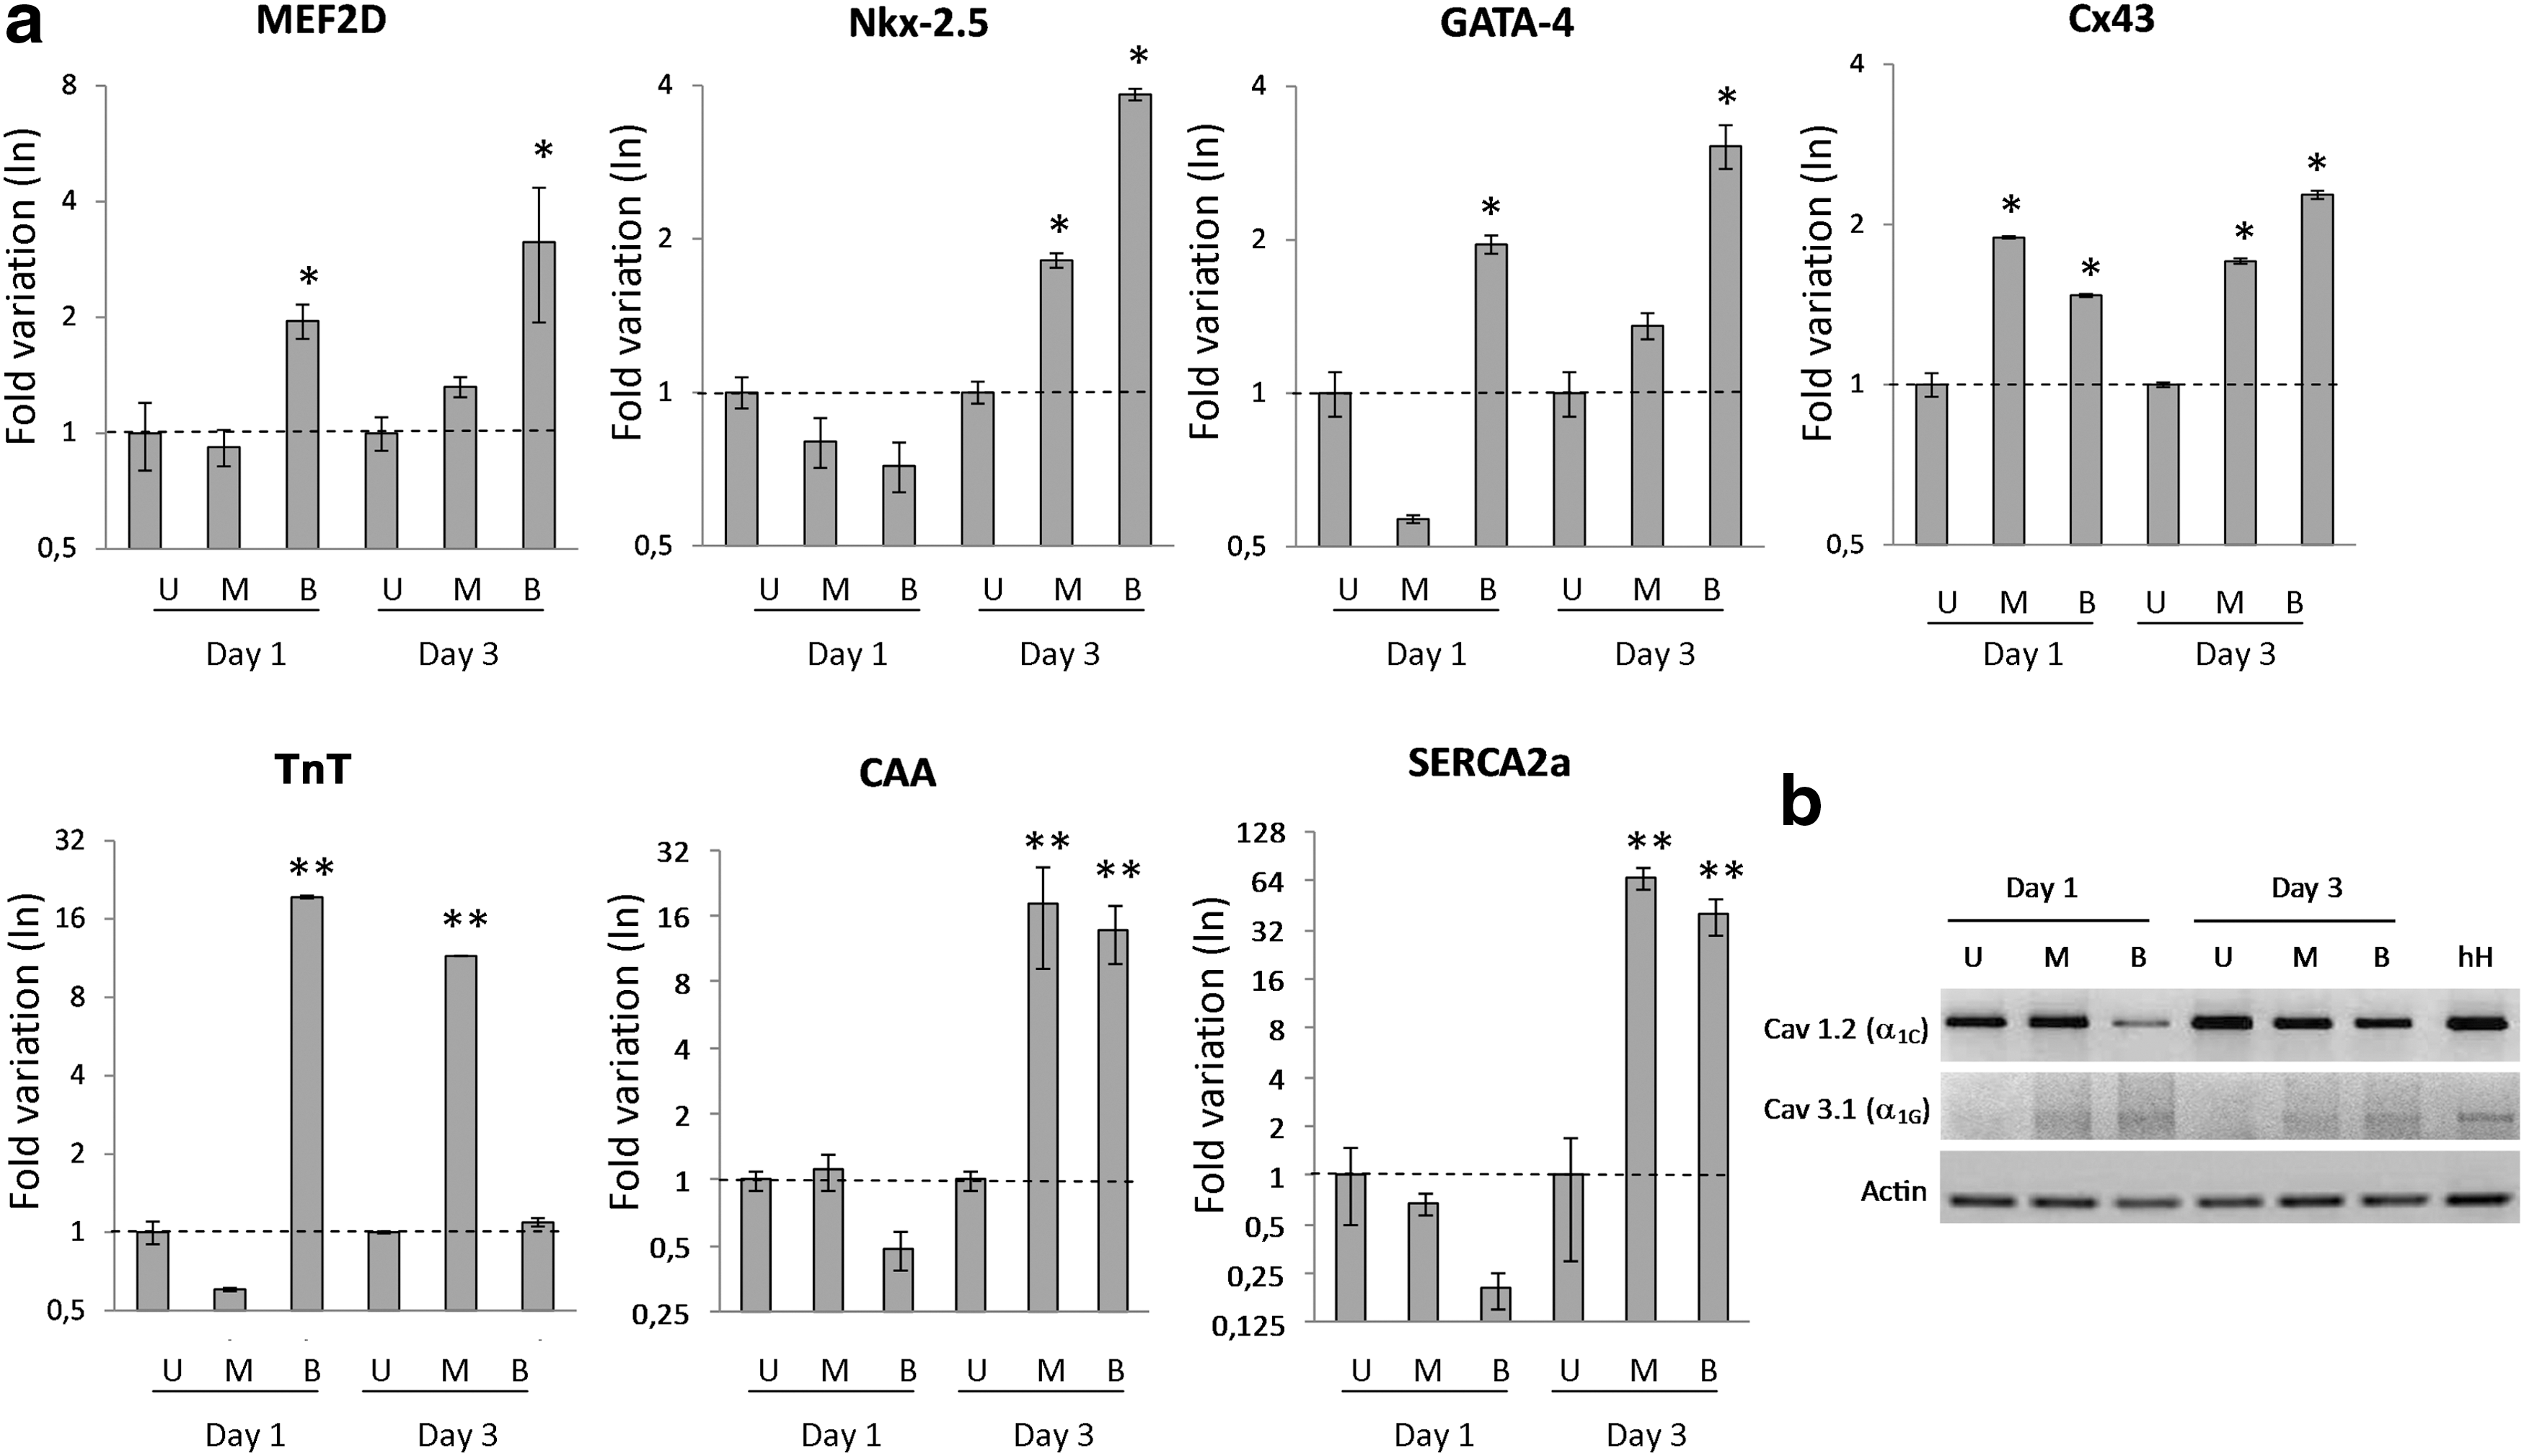
Effects of ES on gene expression.
It is thus clear that the biphasic stimulation is able to upregulate all the genes investigated, while the monophasic stimulus effect was always delayed and in many cases fainter.
ES induces the upregulation of cardiac early and late differentiation proteins
The effect of ES on the expression of the early cardiac commitment transcription factor GATA-4 and of two proteins involved in the functional maturation of cardiomyocytes, i.e., Cx43 and troponin T, was also evaluated by immunofluorescence or western blot. Unstimulated hCPCs expressed basal levels of GATA-4, which increased when cells were exposed to 1 day of monophasic or biphasic ES (Fig. 5a). This increased expression was even stronger after 3 days of ES, and biphasic stimulation was more efficient than monophasic stimulation (Fig. 5b).

Expression of cardiac markers (proteins) in electrically stimulated hCPCs.
qRT-PCR already indicated that ES upregulated the expression of Cx43. In line with this finding, this gap junction protein was detected also in immunofluorescence at higher levels upon both ES protocols carried on for 3 days. Moreover, whereas in unstimulated cells, it was mainly detectable as a diffuse and faint signal within the cytoplasm, Cx43 was found to be partially relocated at the plasma membrane upon both treatments. As in the case of the other markers, the biphasic treatment was more effective (Fig. 5c).
The troponin T expression was evaluated after a 3-day stimulation in western blot performed on total cell extracts. Indeed, a faint band with the expected molecular weight of 40 kDa was detected in the case of cells stimulated with biphasic ES (Fig. 5d).
Finally, in view of the fact that other crucial effectors in the development of excitation–contraction machinery are the voltage-dependent calcium-activated channels (VDCCs), the effect of ES on their expression was evaluated through the analysis of the mRNA expression by RT-PCR. We found that the cardiac-specific Cav 1.2 (α1C) subunit was constitutively expressed in human heart tissue (reference control) and in hCPCs, regardless of the applied ES. Interestingly, the mRNA levels of the Cav 3.1 (α1G) subunit, which is usually highly expressed in the developing heart, were induced in hCPCs exposed to both monophasic and biphasic ES, after both 1 and 3 days (Fig. 4b). The expression levels seem to be slightly higher in the case of biphasic ES rather than in the case of monophasic ES.
Discussion
Nowadays, adult stem/progenitor cells are envisioned as potential tools for regenerative medicine. In view of their possible application, the ability to mimic as much as possible the cells they should replace in vivo should be mandatory when manipulating/expanding them in vitro. In particular, they could be pushed toward a more mature phenotype, which, moreover, would eliminate the risk of tumorigenesis [34,35]. Most of the methods described for the effective differentiation of cardiac stem/progenitor cells rely on biochemical signals, such as the use of specific culture media, exogenously added growth factors, or coculture with neonatal cardiomyocytes [8,11,13,27,36], while very few adopt physical cues, such as ES. On the other side, direct currents induced through voltage difference are physiologically involved in cell migration during embryonic cardiac development, and pulsatile currents are mainly related to the functional cardiac syncytium development [30,37]. For the above reasons, pulsatile monophasic ES has been used by some researchers to improve cardiomyocytes alignment, electrical coupling, and maintenance of a differentiated phenotype [31]. So far, however, only one study analyzed the effects of different voltage waveforms (monophasic or biphasic) [20]. This was done on rat neonatal cardiomyocytes and on organoids composed of these cells in combination with cardiac fibroblasts and endothelial cells.
For the first time, in this study, we have investigated whether monophasic and biphasic pulsed electrical stimuli may influence the cardiac commitment of c-kit/Sca-1-expressing progenitor cells isolated from the human atrium and whether they can affect other parameters of cell behavior, such as growth and survival, cell elongation, and reorientation. The cells used were initially enriched for expressing the c-kit stemness marker, as already described [6]; however, as already reported, the expression of this marker declined rapidly, while cells maintained the expression of the other stemness-associated marker Sca-1. This cell population was already shown to be multipotent [6]. Cells were found to express different growth factors and cognate receptors, namely, SDF-1, VEGF, and HGF, which have already been shown to play a role during the heart development, both for the contractile and the vascular compartments and also during heart responses after injury [38 –40]. This study shows that ES induced CPCs toward cardiac differentiation, since these cells acquired the morphology of myogenic cells, an increased expression of early cardiac-associated proteins as well as the relocation of Cx43 to the cell membrane and, finally, the de novo expression of voltage-dependent calcium channel genes and of the sarcomeric proteins, troponin T, CAA, and SERCA 2a.
To produce precise voltage waveforms, we used a computer-assisted device. We designed a versatile and highly efficient apparatus as a cell culture platform, able to apply finely tuned and controlled ES to the cells. In particular, our system allowed to analyze the different cell responses to monophasic and biphasic ES. In line with other reports [20,21,31], we found that among the different pulse amplitudes analyzed, 5 V was the more appropriate, being compatible with cell survival and able to promote cell responses (not shown). We observed that both types of stimuli induced hCPCs to acquire a more spindled and elongated shape. Moreover, cells displayed the trend to orient perpendicular to the direction of the applied electric field; this possibly represents the response of the cells trying to minimize the electric field gradient across them, as originally suggested by Tandon [26] and reported also for other cell types, such as mouse fibroblasts, neonatal cardiomyocytes [19], human adipose-derived stromal cells [21], and human bone marrow-derived mesenchymal cells [25,41]. Noteworthy, in accord with Chiu, who analyzed the effects of monophasic and biphasic electric stimulation of rat neonatal cardiomyocytes [20], we demonstrated that biphasic stimulation induced more effective responses and these were enhanced with increasing stimulation times.
When the modulation of different cardiac markers was analyzed, a 3-day biphasic ES was found, in general, to be more effective than monophasic ES in inducing the upregulation of the MEF2D, GATA-4, and Nkx2.5 early genes and of the delayed Cx43, troponin T, and Cav 2.1 genes. Indeed, at a 1-day stimulation, only biphasic ES induced their upregulation, while monophasic ES was ineffective and only after 3 days of stimulation was this kind of ES able to upregulate troponin T mRNA. Three days of monophasic ES upregulated also Cx43, CAA, and SERCA 2a, which are other gene coding proteins associated with the structural/functional features of cardiomyocytes.
At the same time point (3 days), hCPCs stimulated with biphasic ES expressed higher levels of the GATA-4 protein and the de novo troponin T protein, as detectable in immunofluorescence or in western blot. Strikingly, at this time point, its corresponding mRNAs were downregulated to basal levels. The same apparently contradictory results have already been reported in the case of cardiac differentiation induced in mesenchymal stem cells upon the combined treatment with carbon nanotubes and ES [25]. The explanation was that, once the maximal effect was achieved, the corresponding genes were downregulated.
GATA-4, MEF2C, and Nkx2.5 are among the earliest transcription factors expressed in the developing heart [42] and may be considered as master genes controlling the cardiac differentiation program by activating a cascade of downstream delayed genes, such as, for example, the troponin T, CAA, SERCA 2a, Cx43, and calcium channel genes analyzed in this study. Among these genes, Cx43 and troponin T are upregulated precociously, while SERCA 2a and CAA are upregulated only after 3 days.
Gap junctions allow the rapid electrical signaling between myocytes necessary for synchronous cardiac contraction. Cx43 is the predominant isoform of gap junction channel in ventricular myocytes. We showed that both monophasic and biphasic ES induce an enhanced expression of Cx43 and its relocalization to the cell–cell contact area, thus suggesting a possible formation of gap junctions between adjacent cells. This effect was observed for both ES protocols, but it was stronger after 3 days of biphasic stimulation. Our data are in line with those of Chiu and colleagues, who reported that a pulsed electrical biphasic stimulus induced a significant increase in the expression of Cx43, and that this correlated with an increase in the cell excitability in neonatal rat cardiomyocytes [20]. The acquisition of electrical competence is also related with the expression of voltage-gated ion channels. In the heart, the low-voltage-activated calcium channel (L type) represents the most abundant type and it is responsible for myocyte contraction induced by calcium currents [43,44]. In addition, the T-type low-voltage-activated Ca2+channels significantly contribute to many physiologic processes, namely, cardiac automaticity, development, and excitation–contraction coupling in normal cardiac myocytes [44]. Among the different L- and T-type Ca2+ channels, we have found that the expression of the subunit Cav 1.2 (α1C) (L-type channel), which is already basally expressed in the adult heart [45], was not affected by the ES, in line with what has been reported [45]. Interestingly, for the first time, we report that both monophasic and biphasic ES were able to induce the de novo expression of the subunit Cav 3.1 (α1G) (T type). This observation is noteworthy since T-type Ca2+ channels play a pivotal role in the cardiac development [44]. Indeed, T-type calcium currents (ICa,T) are regulated throughout the differentiation of mouse cardiomyocytes derived from embryonic stem cells, and Cav 3.1 (α1G) was found to be responsible for ICa,T in these cells. ICa,T was suggested to play a key role in the contractile activity in the developing heart [46] and in the pacemaker apparatus [47,48]. The fact that the transcription factor Nkx2.5 is involved in the upregulation of T-type Ca2+ channels in mouse cardiomyocytes [49] suggests that this pathway could be activated also in electrically stimulated hCPCs. The same holds also for the other genes involved in the cardiac differentiation. In conclusion, we show that ES can be a tool for training hCPCs to become more differentiated toward the cardiomyocytic phenotype.
Whereas both ES protocols were able to promote a differentiation program in hCPCs, the biphasic stimulation resulted to be more effective, when the total duration of monophasic and biphasic pulses was set to be equal. Similar observations were reported also when ES was used to stimulate rat neonatal cardiomyocytes [20] and were explained assuming that the two phases of the biphasic pulse act synergistically [50,51]. The fact that the cellular responses triggered in hCPCs were induced solely by physical stimuli, which can readily be incorporated and finely tuned into bioreactors to substitute for exogenously added expensive bioactive molecules, is particularly important in view of a possible translation to clinical applications.
Footnotes
Acknowledgments
The authors would like to thank Silvia Simonini (Clinica San Gaudenzio - Novara, Italy) for her technical support in editing the manuscript. This study was supported by grants from the Fondazione Cariplo (grant no. 2008–2459), Telethon (grant no. GGP09280) and ERC (grant no. 261178). Stefano Pietronave is the recipient of a fellowship from Clinica San Gaudenzio - Novara (Gruppo Policlinico di Monza).
Author Disclosure Statement
The authors have no conflicts of interest or financial interests.