
Abstract
Glycogen synthase kinase 3 (GSK3) acts as an important regulator during the proliferation and differentiation of neural progenitor cells (NPCs), but the roles of the isoforms of this molecule (GSK3α and GSK3β) have not been clearly defined. In this study, we investigated the functions of GSK3α and GSK3β in the context of neuronal differentiation of murine NPCs. Treatment of primary NPCs with a GSK3 inhibitor (SB216763) resulted in an increase in the percentage of TuJ1-positive immature neurons, suggesting an inhibitory role of GSK3 in embryonic neurogenesis. Downregulation of GSK3β expression increased the percentage of TuJ1-positive cells, while knock-down of GSK3α seemed to have no effect. When primary NPCs were engineered to stably express either isoform of GSK3 using retroviral vectors, GSK3β, but not GSK3α, inhibited neuronal differentiation and helped the cells to maintain the characteristics of NPCs. Mutant GSK3β (Y216F) failed to suppress neuronal differentiation, indicating that the kinase activity of GSK3β is important for this regulatory function. Similar results were obtained in vivo when a retroviral vector expressing GSK3β was delivered to E9.5 mouse brains using the ultrasound image-guided gene delivery technique. In addition, SB216763 was found to block the rapamycin-mediated inhibition of neuronal differentiation of NPCs. Taken together, our results demonstrate that GSK3β, but not GSK3α, negatively controls the neuronal differentiation of progenitor cells and that GSK3β may act downstream of the mammalian target of rapamycin complex1 signaling pathway.
Introduction
G
GSK3 exists in cells in a constitutively active form, and its kinase activity is regulated by phosphorylation. The activity of GSK3 is downregulated when serine 21 of GSK3α and serine 9 of GSK3β are phosphorylated, and upregulated when tyrosine residues (tyrosines 279 and 216 of GSK3α and GSK3β, respectively) are phosphorylated [10]. Many kinases and phosphatases, such as protein kinase B, MAPK-activated protein kinase 1, protein phosphatase (PP) 1, and PP2A, are known to influence the activity of GSK3 [11 –13]. The mammalian target of rapamycin complex1 (mTORC1) is a kinase that has been reported to be involved in the serine phosphorylation of GSK3. In lipopolysaccharides (LPS)-stimulated monocytes and tuberous sclerosis complex (TSC) 1 or TSC2 mutant embryonic fibroblasts, rapamycin has been found to block the serine phosphorylation of GSK3β [14,15]. Although the relationship between GSK3 and mTORC1 is well defined in various situations such as cancer and inflammation, this relationship has not yet been delineated in the context of NPC differentiation. The activation of mTORC1, induced by insulin treatment or deletion of the TSC1 gene in embryonic telencephalic NPCs, results in premature differentiation, and rapamycin (a mTORC1 inhibitor) treatment inhibits these effects; these results suggest that mTORC1 has a role in neuronal differentiation [16,17]. However, the downstream mechanism of mTORC1 in neurogenesis remains to be determined.
In this study, both in vitro and in vivo experiments showed that GSK3β inhibited NPC differentiation. Downregulation of GSK3β was found to derepress the rapamycin-mediated inhibition of neuronal differentiation. Taken together, our findings suggest that GSK3β, but not GKS3α, is the isoform that negatively affects the differentiation of NPCs as the downstream target of the mTORC1 signaling pathway.
Materials and Methods
Cell culture
293T cells were maintained in Dulbecco's modified Eagle's medium (DMEM) supplemented with 10% fetal bovine serum (FBS; Cellgro). NIH3T3 cells were cultured in DMEM supplemented with 10% bovine serum (Gibco). All cells were incubated in 5% CO2, 37°C chamber.
Isolation and in vitro culture of mouse NPCs
The ganglionic eminences in E14.5 embryonic brains were dissected and washed twice in phosphate buffered saline (PBS). Samples were triturated using a fire-polished Pasteur pipette, and run through a 40-μm cell strainer (Falcon). Cells were cultured in DMEM/F12 (Gibco) with B27 supplement [2% (v/v), 17504-044; Gibco], N2 supplement [1% (v/v), 17502-048; Gibco], Pen Strep Glutamine [1% (v/v), 10378-016; Gibco], 2 μg/mL heparin (H3393; Sigma), 20 ng/mL fibroblast growth factor basic (100-18B; Pepro Tech), and 10 ng/mL epidermal growth factor (AF-100-15; Pepro Tech) and incubated in 5% CO2, 37°C chamber.
In vitro differentiation of primary NPCs
Primary NPCs were prepared from E14.5 embryonic brains and allowed to form neurospheres for 1 day. Neurospheres were then dissociated into single cells and transduced with retroviral vectors as described below. Two days later, neurospheres were dissociated and seeded on poly-
Retroviral vectors and transduction procedure
The MS vector containing the long terminal repeat from a murine stem cell virus was described previously [18]. The mouse GSK3α sequence was synthesized (Bioneer), and the mouse GSK3β sequence was amplified from Raw 264.7 cDNA using primers listed in Table 1. The mouse Notch1 intracellular domain (NICD) sequence was amplified from the plasmid called GNIA [19] as a template. These sequences were cloned into pGEM®-T Easy (A1360; Promega), resulting in pGEM®-T Easy-GSK3α, -GSK3β, and NICD. To construct the mutant GSK3β (Y216F) sequence, site-directed mutagenesis (Stratagene) was employed using pGEM-T Easy-GSK3β as a template, according to the manufacturer's instructions. pGEM-T Easy-GSK3β and mutant plasmid were confirmed by sequencing. The BglII fragments of pGEM-T Easy-GSK3α, -GSK3β, -GSK3β (Y216F), and NICD were cloned into the BamHI site of MS-IRES-eGFP, generating MS-GSK3α-IRES-eGFP, MS-GSK3β-IRES-eGFP, MS-GSK3β (Y216F)-IRES-eGFP, and MS-NICD-IRES-eGFP, respectively.
GSK3, glycogen synthase kinase 3; NICD, Notch1 intracellular domain.
The shRNA sequences (Table 2) targeting mouse GSK3α and GSK3β were cloned into pSIREN-DsRed (Clontech) vector, which was manipulated by site-directed mutagenesis to contain HA tag. The shRNA sequence targeting luciferase was used as the control.
Retroviral vector plasmids were transfected into 293T cells with gag-pol (pCA-gag-pol) and env-expressing vectors (pCA-VSV-G) using Lipofectamine (18324-012; Invitrogen) and PLUS reagent (10964-021; Invitrogen), according to the manufacturer's instructions. Supernatants were collected 48 h after transfection, filtered through a 0.45-μm filter and frozen at −80°C until used. Concentrated viral stocks were prepared by ultracentrifugation for 2 h in a SW32 rotor (Beckman-Coulter) at 20,000 rpm at 4°C. Pellets were resuspended in 50 μL of PBS at 4°C for about 12 h, and aliquots of virus were stored at −80°C. For transduction, NIH3T3 cells were seeded at 1×10⁵ in six-well plates on the previous day. Viral supernatants were added in the presence of polybrene (final concentration 8 μg/mL). In the case of mouse primary NPCs, ultracentrifuge-concentrated virus particles were added in the absence of polybrene and incubated at 37°C for 3 h. After incubation, the cells were washed and cultured in the NPC medium as described above. The viral titer was determined by measuring the percentage of eGFP or dsRED-positive NIH3T3 cells transduced with different dilutions of virus stock. When fluorescence-activated cell sorting (FACS) analysis was needed, the percentages of GFP+ cells were analyzed using FACS Calibur flow cytometer (BD Biosciences).
Western blot
NIH3T3 cells or primary NPCs were lysed using RIPA buffer with protease and phosphatase inhibitor cocktail. Equal amounts of protein were resolved by 10% (w/v) sodium dodecyl sulfate-polyacrylamide gel electrophoresis and transferred to polyvinylidene difluoride membranes (GE Healthcare). The membranes were blocked with TBST [150 mM NaCl, 10 mM Tris/HCl, and 0.1% (v/v) Tween 20, pH 8.0] containing 1% (w/v) bovine serum albumin (Invitrogen-Gibco), and they were incubated with primary antibodies diluted in blocking solution at 4°C overnight. The membranes were then incubated with horseradish peroxidase-conjugated goat anti-mouse or rabbit immunoglobulin G (IgG) secondary antibody (Sigma) at room temperature. The bands were visualized with the enhanced chemiluminescence system (WBKLS0500; Millipore), and quantified using Image J software. The following primary antibodies were used: anti-GSK3α (1:100, sc166116; Santa Cruz), anti-GSK3β (1:1,000, ab93926; Abcam), anti-phospho-GSK3 (pY216) (1:1,000, 612313; BD Bioscience), anti-phospho-GSK-3α/β (Ser21/9) (1:500, 9331; Cell Signaling), anti-phospho-p70S6K (Thr389) (1:1,000, 9205; Cell Signaling), anti-p70S6K (1:1,000, 2708; Cell Signaling), and anti-β-actin (1:5,000, A-5441; Sigma). When needed, blots were stripped using stripping buffer (NCI1059KR; Thermo Scientific) with vigorous shaking for 30 min at room temperature.
In vivo injection into the ventricle of the embryonic brain
All animal procedures were approved by the Institutional Animal Care and Use Committee of Seoul National University. Timed pregnant CD-1 mice (Orient-Bio) were used for viral injections. Male and female mice were placed together overnight for mating, and embryos were considered 0.5 days old when a vaginal plug was detected the following morning. Virus delivery was performed into the telencephalic ventricle at E9.5 using the ultrasound-guided imaging as described previously [20]. Briefly, pregnant mice were anesthetized with Zoletil 50 (Virbac) and rompun (Bayer Korea). The uterus was exteriorized, and the fetuses were scanned using the ultrasound biomicroscopic imaging system (Vevo660; VisualSonics). Ultracentrifuge-concentrated virus particles were injected into the telencephalic ventricle of E9.5 embryos.
Brain harvest and fixation
E14.5 brains from embryos were harvested and fixed in 4% paraformaldehyde for 2 h at 4°C and cryoprotected with 30% sucrose at 4°C until they dropped to the bottom. Brains were then frozen in embedding matrix (Cell Path) and stored at −80°C until they were cryosectioned.
Immunofluorescence and immunohistochemistry assays
Immunofluorescence (IF) and immunohistochemistry (IHC) assays were performed using the following primary antibodies; rabbit anti-GFP (1:500, A11122; Invitrogen), rat anti-HA tag (1:400, 11-867-423-001; Roche), mouse anti-class III β-tubulin (TuJ1, 1:500, MMS-435P; Covance), mouse anti-Nestin (1:200, MAB353; Millipore), mouse anti-GFAP (1:200, MAB3402; Millipore), rabbit anti-GSK3α (1:250, ab28833; abcam), and mouse anti-GSK3β (1:300, ab93926; abcam). The secondary antibodies used in this study were as follows; Alexa Fluor® 488-donkey anti-rabbit IgG (A21206; Invitrogen), Alexa Fluor 488 donkey anti-mouse IgG (A21202; Invitrogen), Alexa Fluor® 555-donkey anti-mouse IgG (A31570; Invitrogen), Alexa Fluor 555 goat anti-rat IgG (A21434; Invitrogen), and Alexa Fluor® 488 goat anti-rat IgG (A11006; Invitrogen) (1:1,000 for IF and 1:500 for IHC). For IF, cells were fixed with 4% paraformaldehyde, permeabilized with PBS containing 0.5% Triton X-100, and then blocked for 1 h with PBS containing 10% FBS. The samples were incubated first with primary antibodies diluted in blocking solution overnight at 4°C, and then incubated with secondary antibodies diluted in PBS for 1 h at room temperature. Hoechst staining was done with 1 μg/mL Hoechst 33258 (09460; Polyscience). For IHC, sections were washed in PBS, and then blocked for 1 h with PBS containing 1% FBS and 0.2% Triton X-100. Sections were incubated first with primary antibodies diluted in blocking solution overnight at 4°C, and then incubated with secondary antibodies diluted in blocking solution for 1 h at room temperature. Hoechst staining was done with 1 μg/mL Hoechst 33258. The stained cells or sections were visualized and their images were acquired using Zeiss LSM 510 or LSM700 confocal microscope. Cells were counted using Image J software. Signal intensity was quantified using ZEN 2012 (blue edition) software.
TUNEL assay
Cells were fixed with 4% paraformaldehyde, permeabilized with PBS containing 0.5% Triton X-100, and then blocked for 1 h with PBS containing 10% FBS. TUNEL staining was performed using the in situ Cell Death Detection Kit TMR red (Roche), according to the manufacturer's instructions. The stained cells were visualized and their images were acquired using Zeiss LSM 510 confocal microscope. Cells were counted using Image J software.
Statistical analysis
All values are presented as mean±standard deviation from three independent experiments. Differences between values were determined by a one-way analysis of variance, followed by Tukey's post-hoc test using GraphPad Prism software (Version 5; GraphPad Software). Differences in the signal intensity from IF assays and the band intensity from western blot analysis were determined by unpaired t-test and paired t-test, respectively using GraphPad Prism software. P-values less than 0.05 were considered to be statistically significant.
Results
Effects of GSK3 inhibition on the neuronal differentiation of NPCs
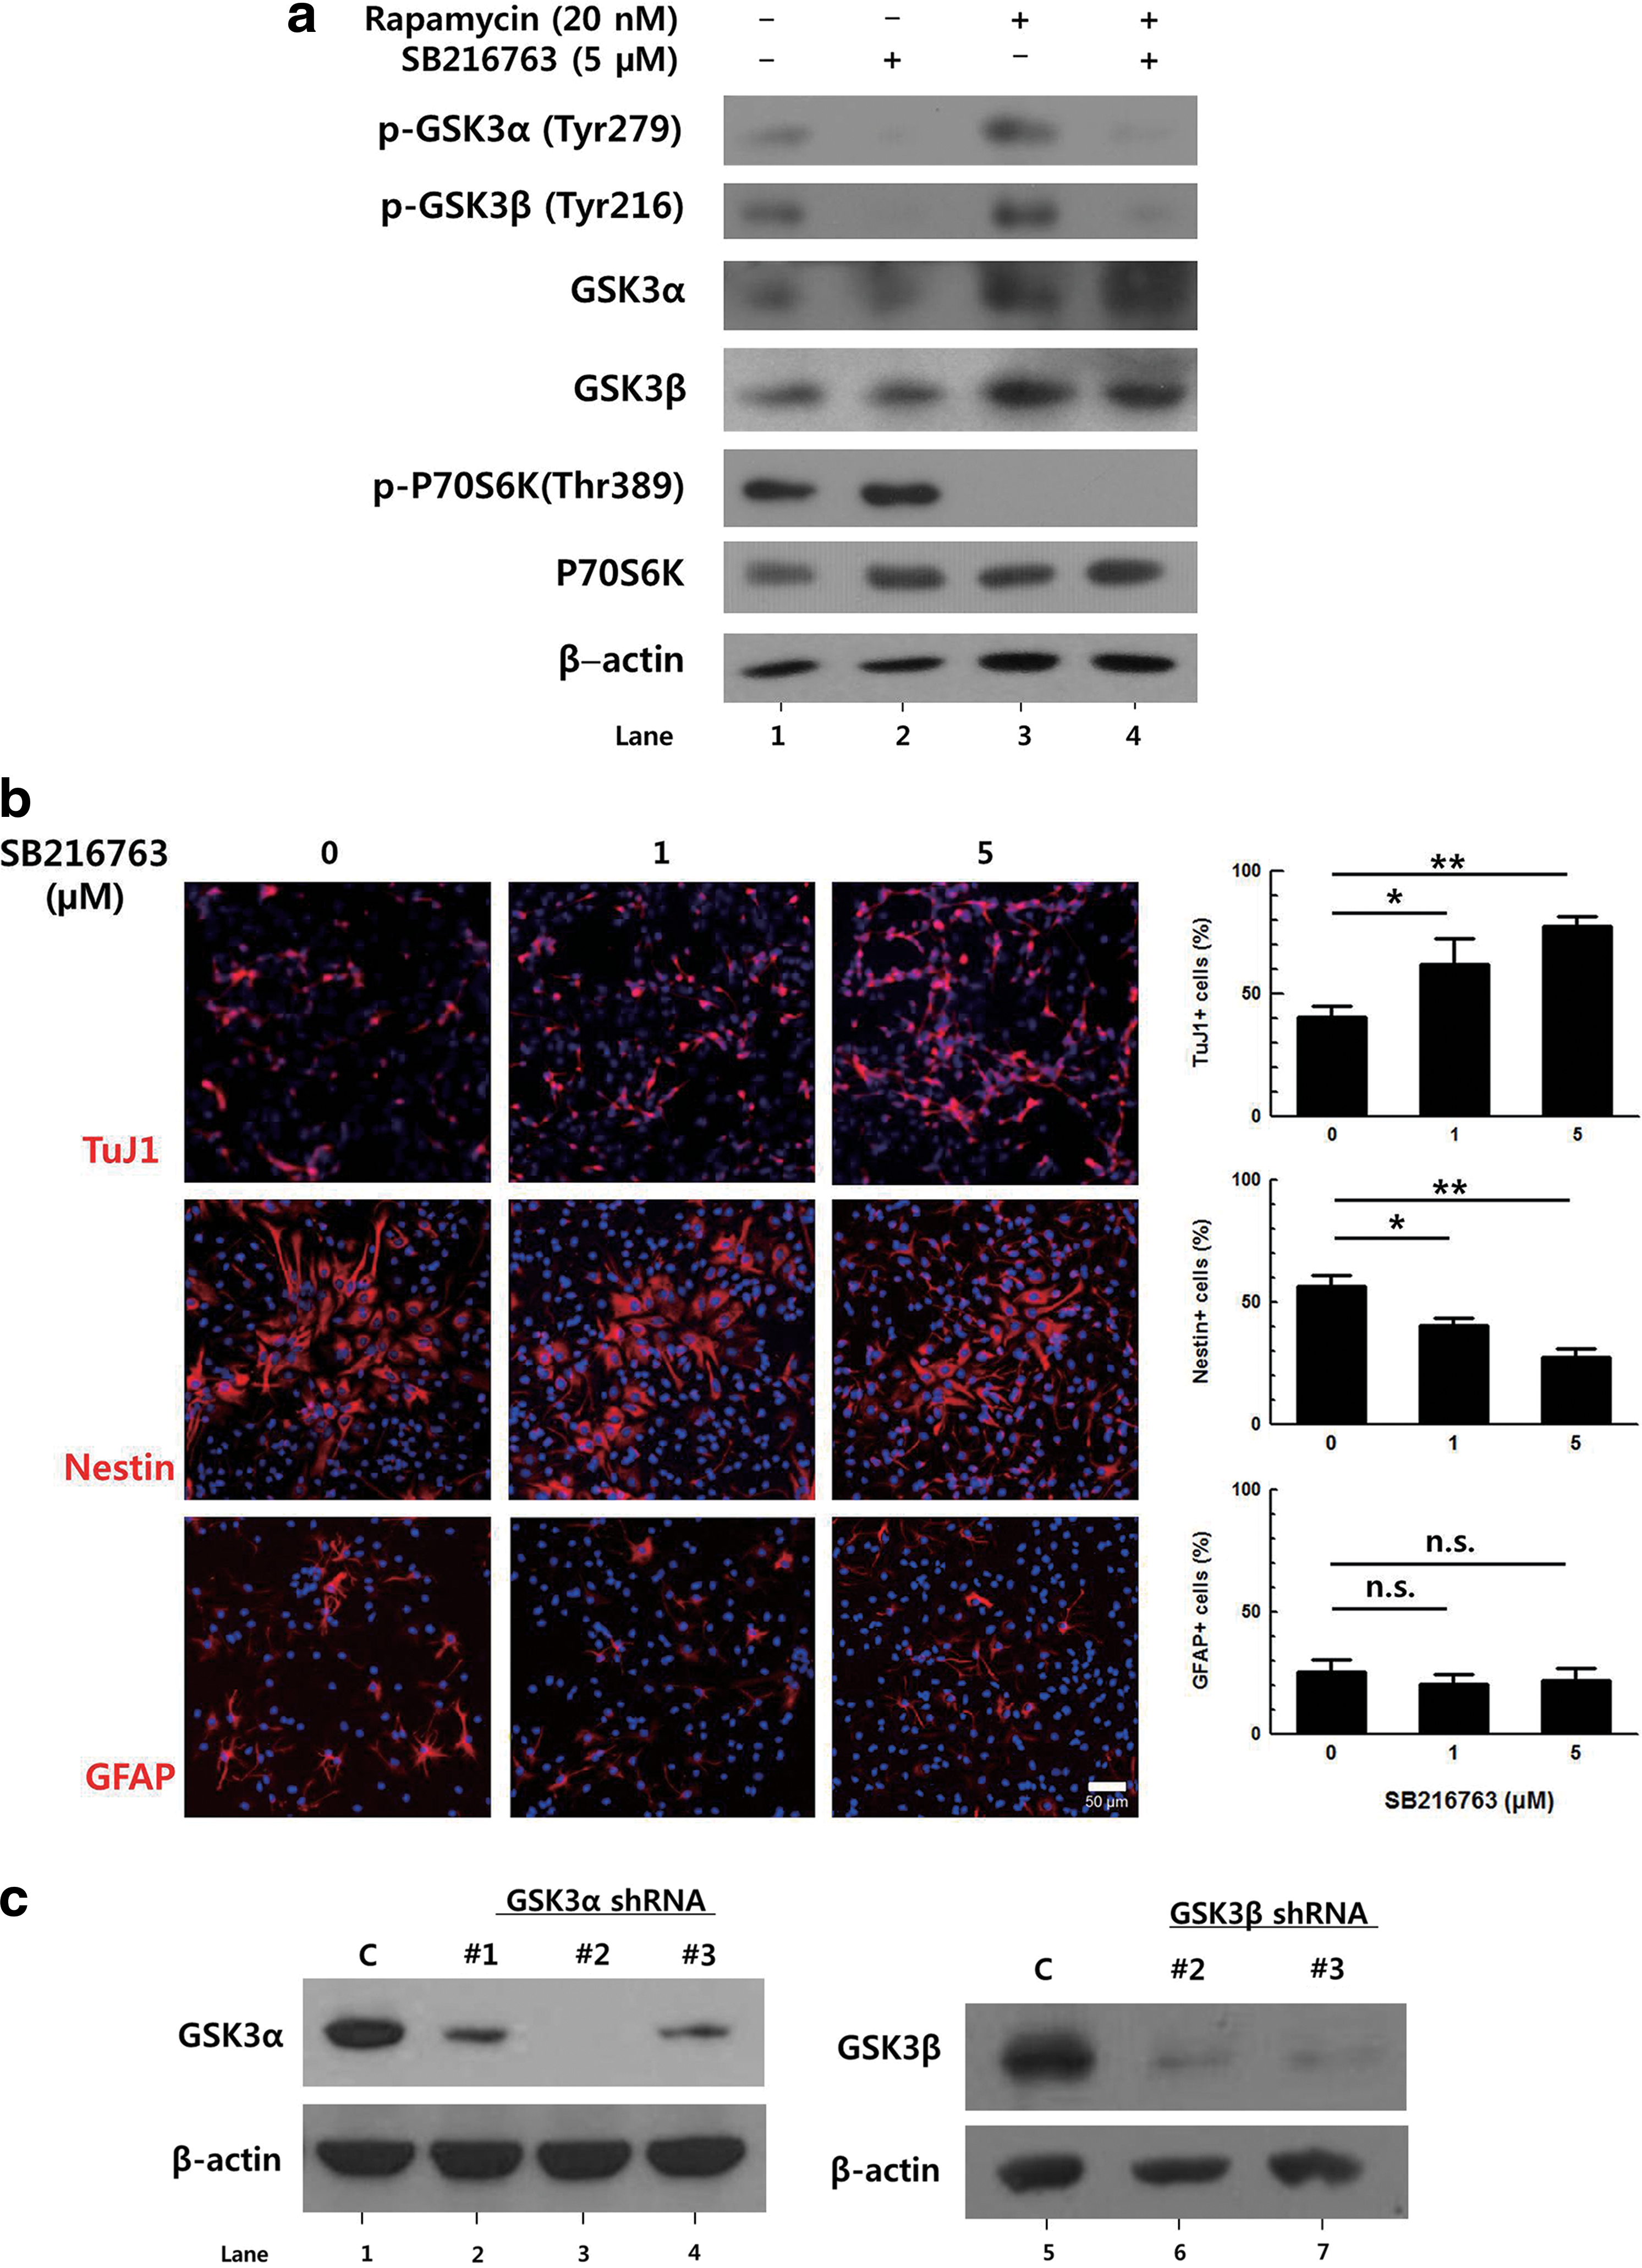
In several previous studies, chemical inhibitors of GSK3 have been used in attempts to define the roles of GSK3 [7 –9]. To confirm the effect of GSK3 inhibition on the differentiation of NPCs, we used SB216763, an ATP-competitive inhibitor of GSK3 [21]. Primary NPCs were prepared from E14.5 mouse embryos and differentiated with DMEM containing 2% FBS and treated with 5 μM SB216763 for 3 days. The effects of SB216763 on the tyrosine phosphorylation (an indicator of active GSK3) of each isoform [3,22,23] were observed by western blot (Fig. 1a, compare lanes 1 and 2). The level of tyrosine phosphorylation of both GSK3α and GSK3β were decreased 3 h after 5 μM SB216763 treatment, indicating the decreased activity of GSK3. Differentiated cells were then stained with specific markers including antibodies to TuJ1 (immature neurons), Nestin (NPCs), and GFAP (astrocytes). Upon treatment with 5 μM SB216763, the percentage of TuJ1-positive cells increased from 40% to 77%, but the percentage of Nestin-positive cells decreased from 57% to 28% (Fig. 1b). GFAP-positive cells were also counted to determine the effect of GSK3 on the formation of astrocytes, and no significant effect was observed. These data are consistent with previous results in that the inhibition of both GSK3α and β isoforms via chemical inhibitors enhanced the neuronal differentiation of progenitor cells, suggesting that GSK3 has a negative effect on neurogenesis.
Downregulation of glycogen synthase kinase 3 (GSK3)β, but not GSK3α, increases the neuronal differentiation of primary neural progenitor cells (NPCs).

To investigate which isoform of GSK3 contributes to the inhibition of neuronal differentiation, retroviral vectors expressing three different shRNA sequences against GSK3α or GSK3β, together with HA-tagged dsRED, were constructed. To determine knock-down efficiency, GSK3α-overexpressing NIH3T3 cells and NIH3T3 cells were transduced with retroviral vectors expressing GSK3α or GSK3β shRNA, respectively. GSK3α-overexpressing NIH3T3 cells were used because the basal expression level of GSK3α in NIH3T3 cells was undetectable. When the protein level of each isoform was measured after 2 days using western blot, it was found that GSK3α shRNA sequence No. 2 (Fig. 1c, lane 3) and GSK3β shRNA sequence No. 3 (Fig. 1c, lane 7) produced the highest knock-down efficiencies (98.9±1.5% and 71.3±10.9% reduction compared to the control, respectively).
To be certain, knock-down efficiency was also tested using primary NPCs. Cells were transduced with a retroviral vector expressing respective shRNAs, and 2 days later, the protein level was analyzed by immunostaining (Fig. 1d). When signal intensity was measured, the protein level of GSK3α and GSK3β was decreased by 30.6±12.7% and 63.5±15.2%, respectively.
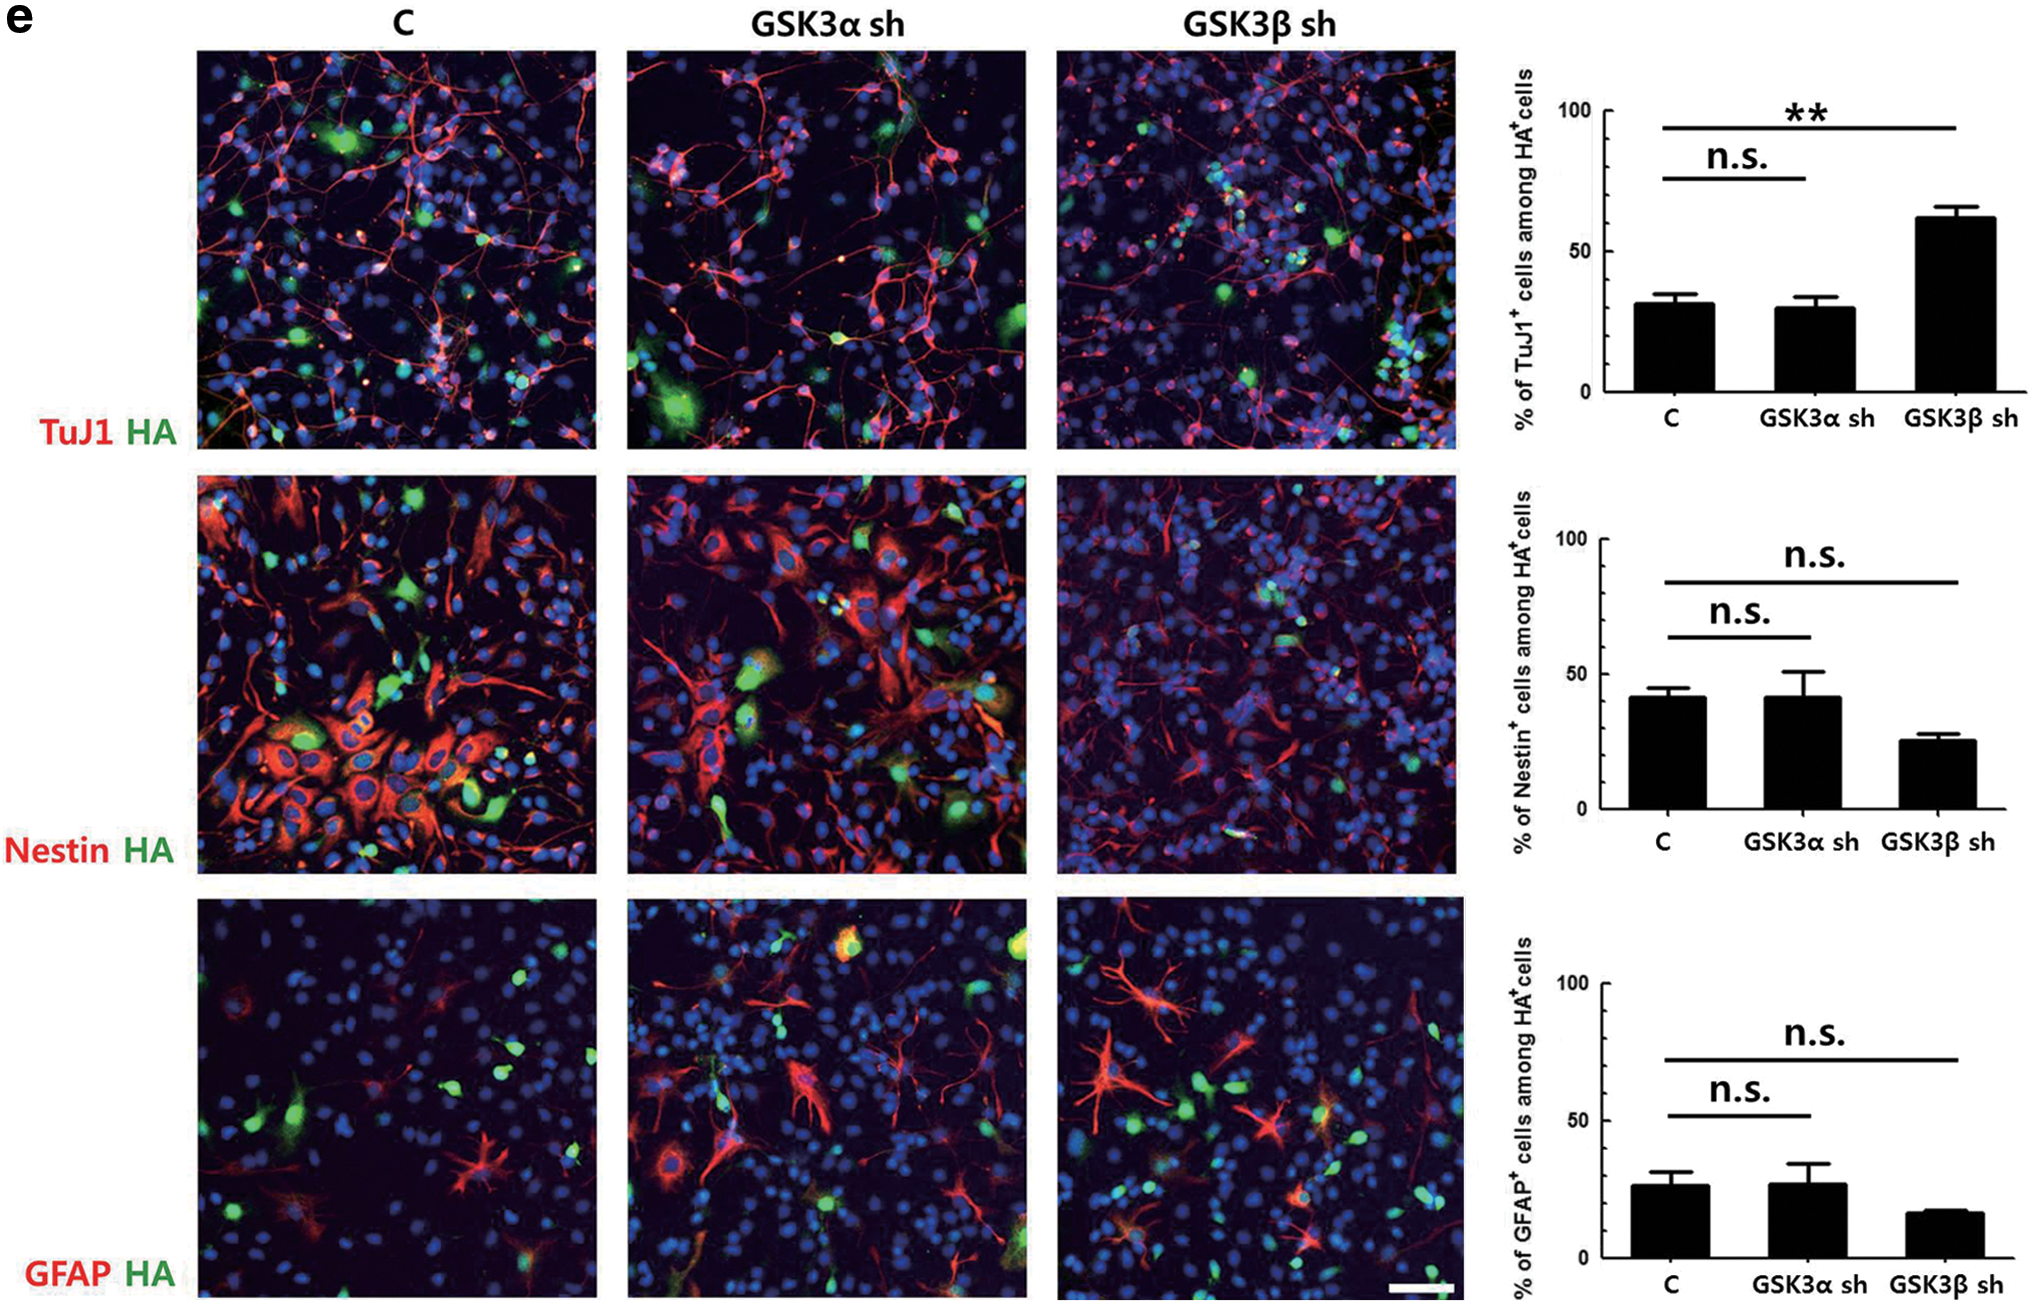
To investigate the effect of downregulation of GSK3α and GSK3β on cell differentiation, primary NPCs were transduced with the same titer of the retroviral vectors expressing respective shRNAs and then induced to differentiate for 2 days. As DsRed fluorescence was too weak to be identified using a fluorescent microscope, the HA tag was stained, and the percentages of different cell markers among HA-positive cells were calculated (Fig. 1e). In cells transduced with a control vector, ∼31% of the transduced cells were TuJ1-positive. Interestingly, the number of TuJ1-positive cells among cells transduced with GSK3α shRNA-expressing vector was similar to that of controls, while this number increased by ∼2-fold in the GSK3β shRNA-expressing cells. Similarly, the proportion of Nestin-positive NPCs was decreased by nearly half when the expression of GSK3β was knocked-down. The changes in the percentages of GFAP-positive cells were not statistically significant. These data suggest that GSK3α and GSK3β might have different effects on neuronal differentiation.
Effects of GSK3 overexpression on the neuronal differentiation of NPCs
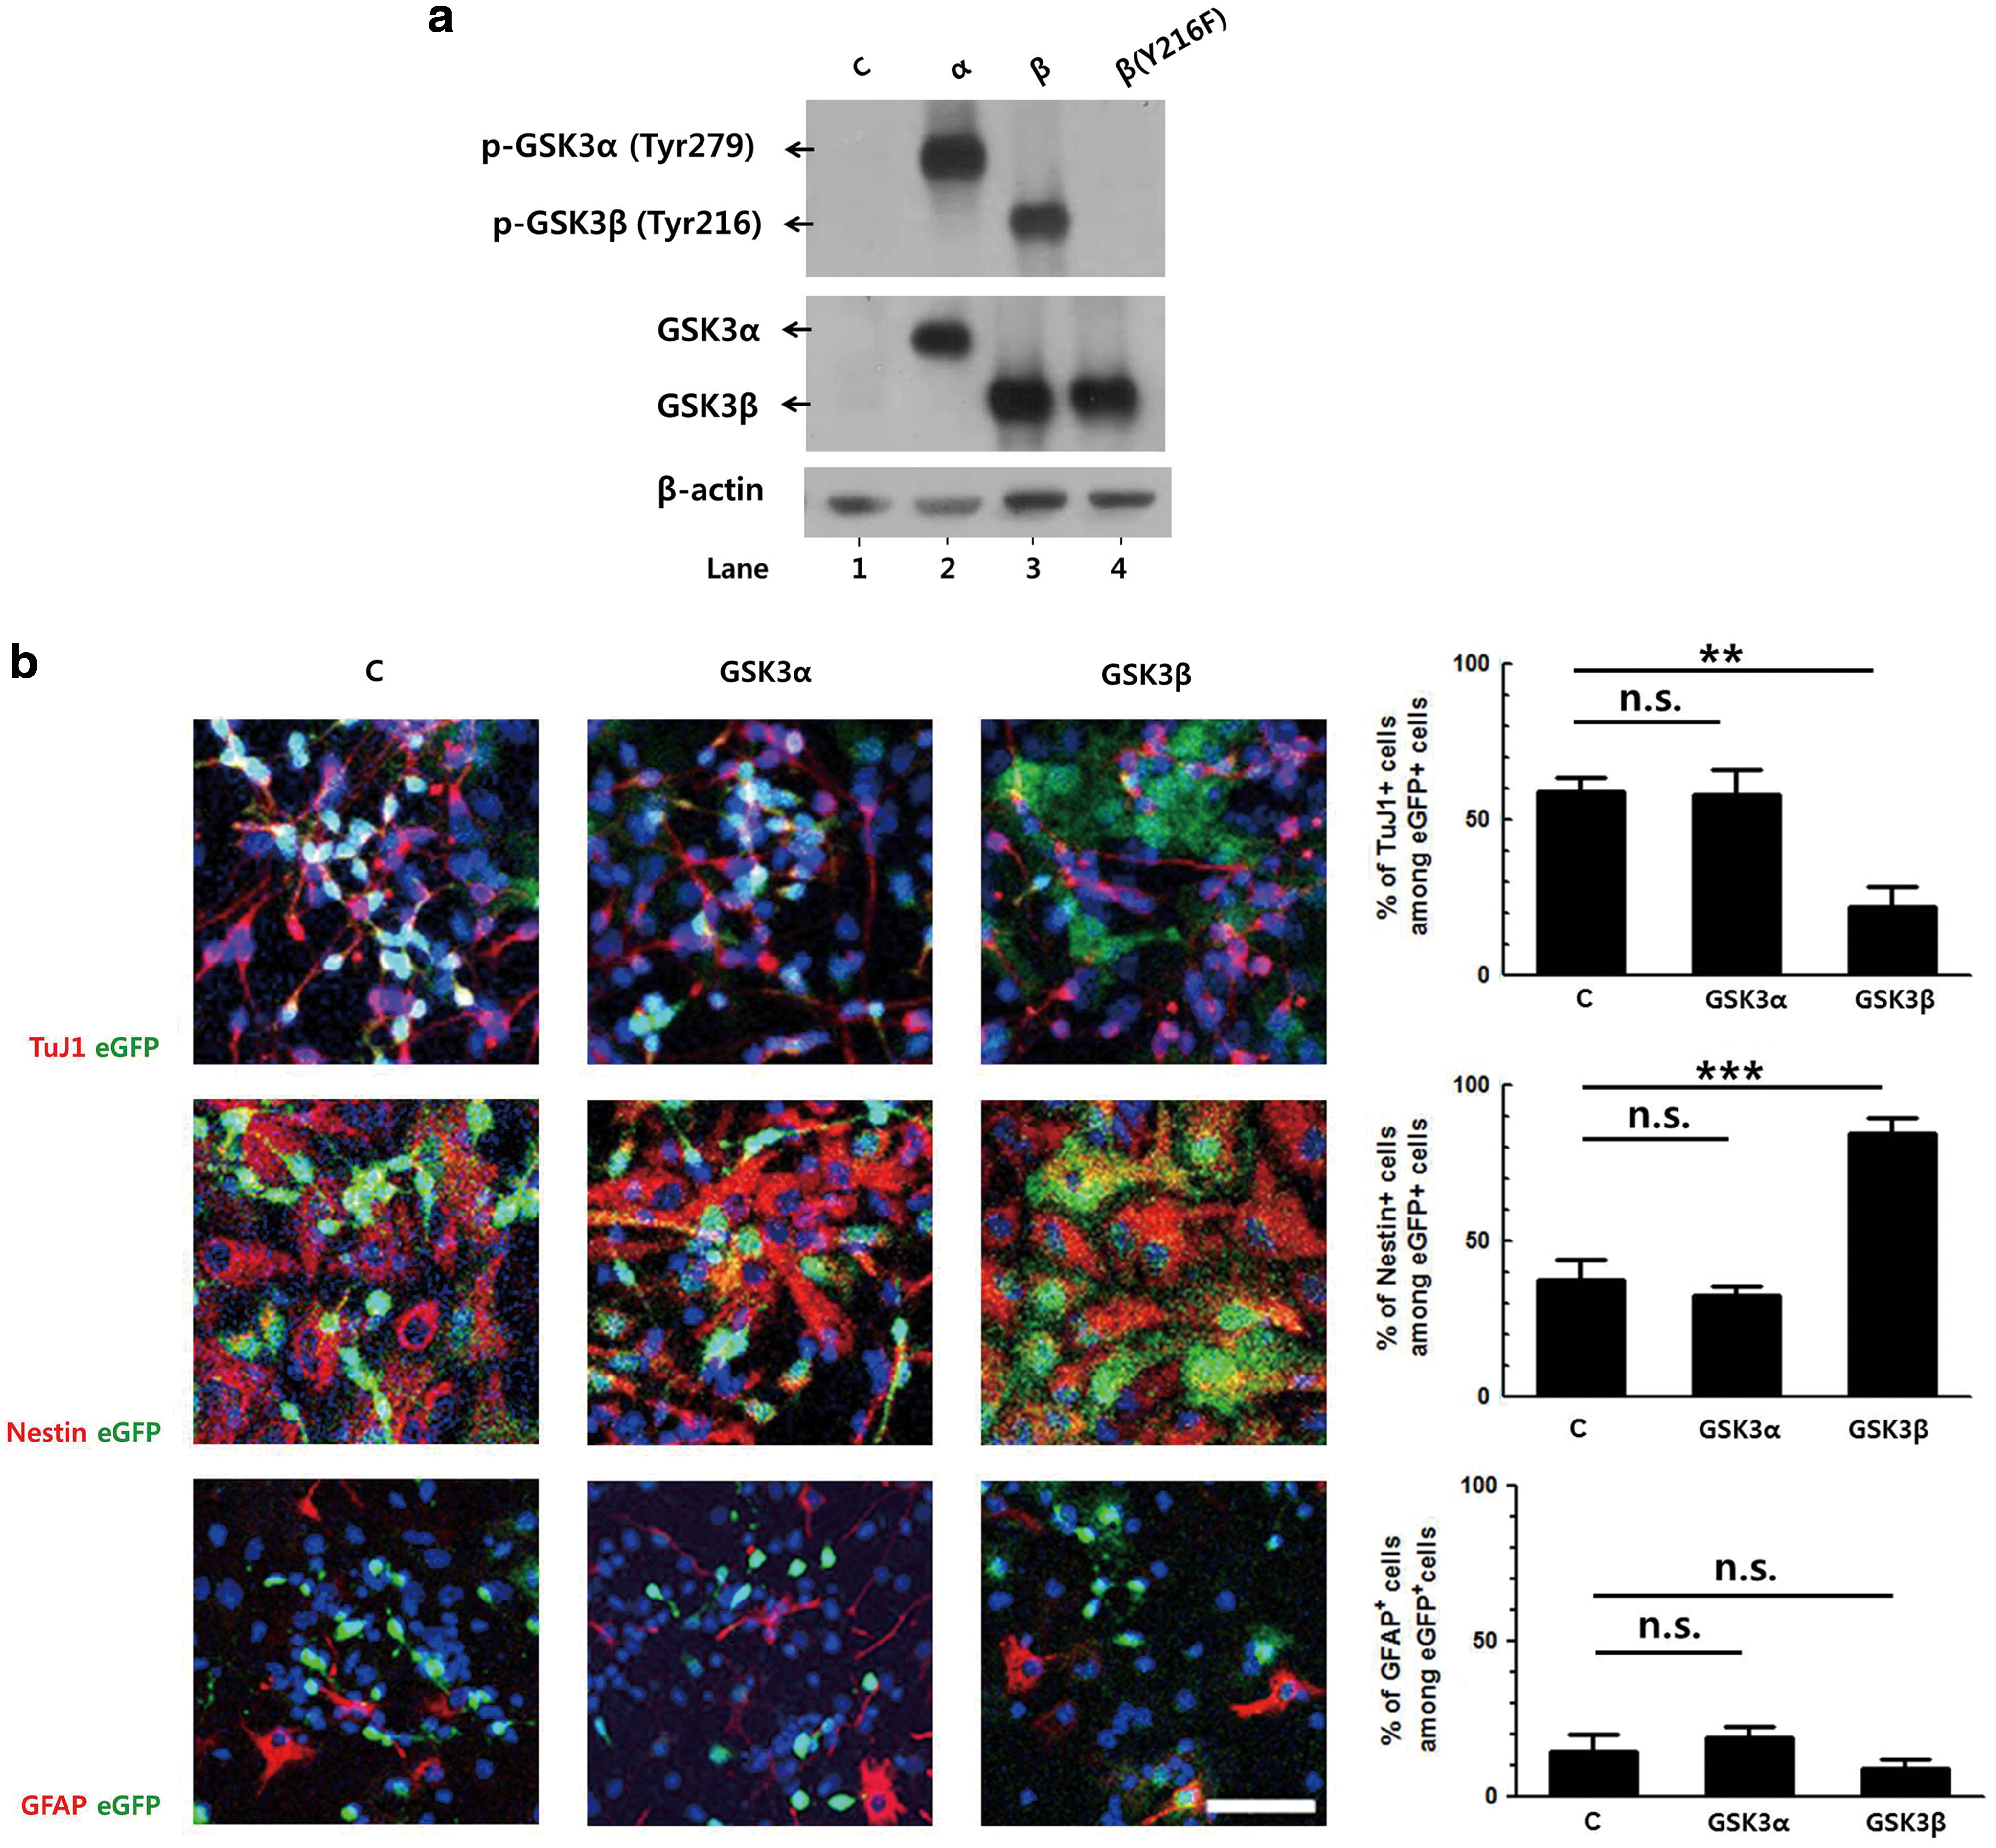
To confirm the different roles of the two isoforms in neuronal differentiation, the effects of constitutive overexpression of GSK3 were studied. Retroviral vectors expressing GSK3α or GSK3β, together with eGFP as a bicistronic message, were constructed. The expressions of the respective isoforms were determined by western blot using NIH3T3 cells. The endogenous GSK3β was detectable only at longer exposure times. The levels of tyrosine phosphorylation of GSK3 were measured as an indication of GSK3 activity (Fig. 2a).
GSK3β, but not GSK3α, suppresses the neuronal differentiation of NPCs.
Primary NPCs were transduced with the same titer of retroviral vectors and then induced to differentiate for 3 days. In cells transduced with a control vector expressing eGFP only, ∼60% of eGFP-positive cells were positive for TuJ1. A similar level of TuJ1-positive cells was observed in GSK3α-transduced cells, while this level was reduced to 20% in GSK3β-transduced cells (Fig. 2b). Similar to the control, ∼40% of the GSK3α-transduced cells were positive for Nestin. However, constitutive expression of GSK3β increased the percentage of Nestin-positive cells to 80%. The numbers of GFAP-positive cells were similar in all three groups.
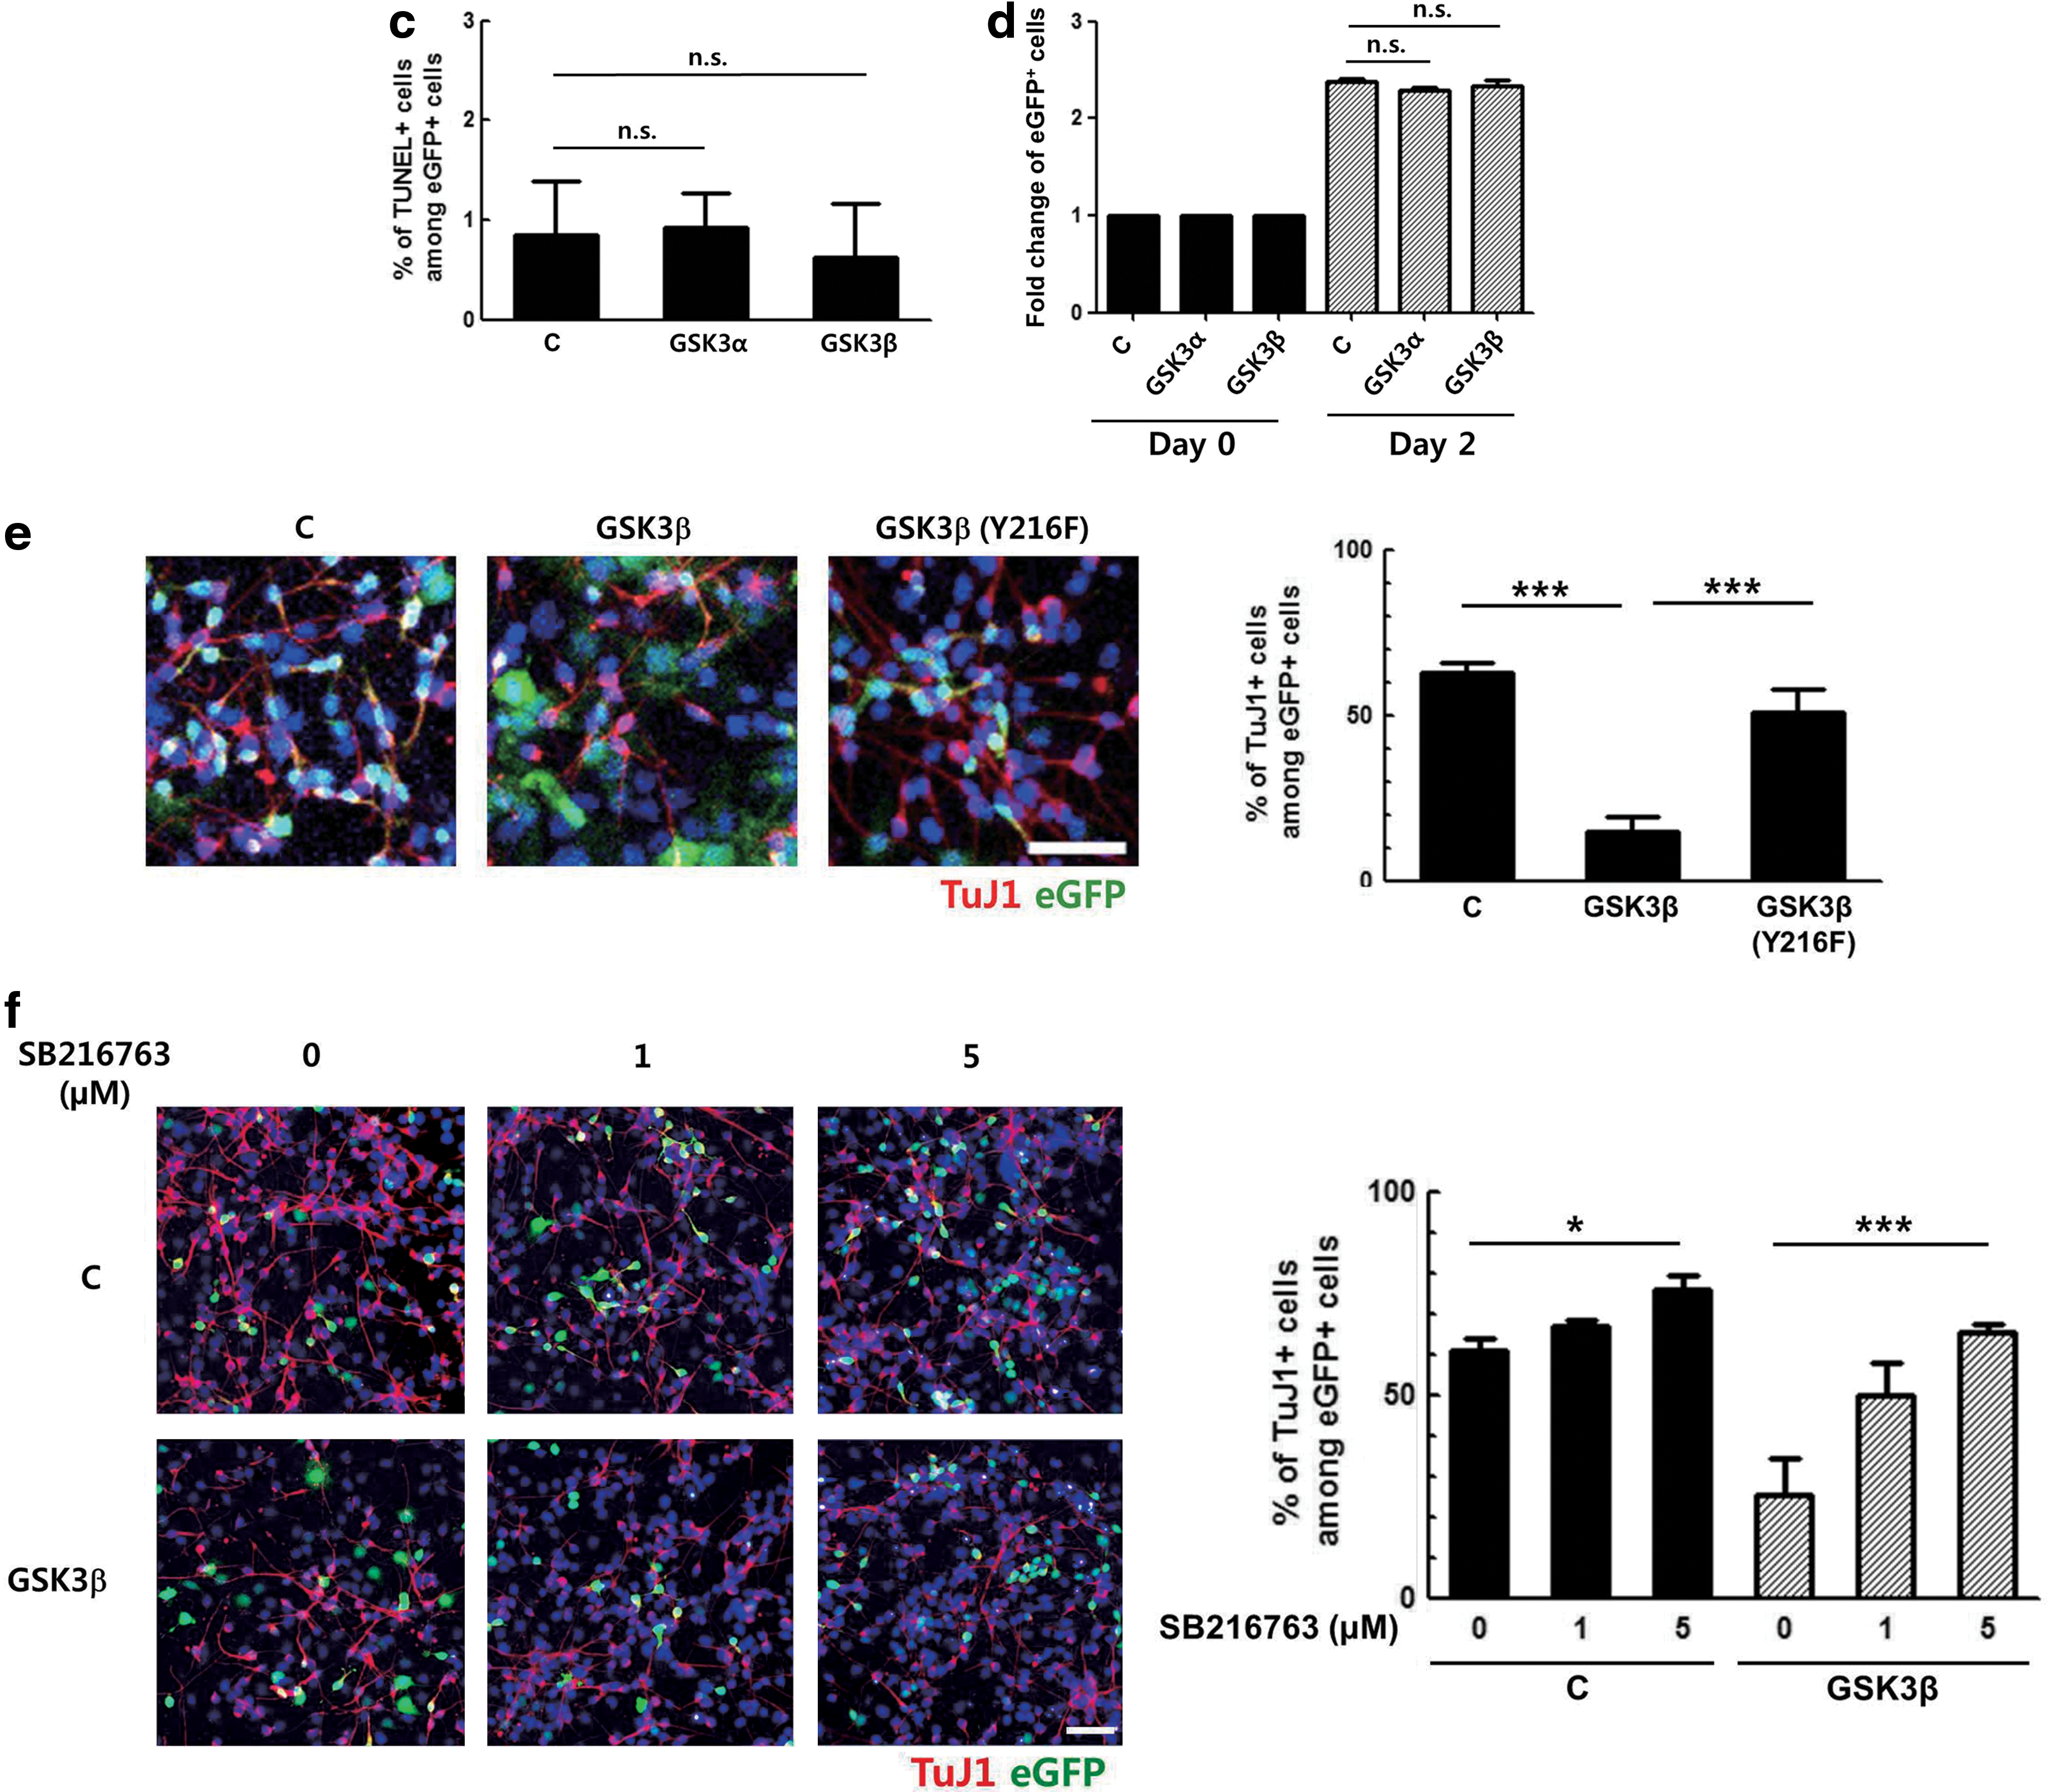
To test whether the decrease in the percentage of TuJ1-positive cells resulted from NPC death, apoptotic cell death was analyzed. NPCs were transduced with GSK3α- and GSK3β-overexpressing vectors for 2 days and differentiated for 3 days. The cells were then subjected for a TUNEL assay. As shown in Fig. 2c, the numbers of TUNEL-positive cells were comparable between the control, GSK3α-, and GSK3β-transduced cells, indicating that apoptosis did not have a significant influence.
The effect of GSK3 isoforms on the proliferation of NPCs was also examined by FACS analysis. Primary NPCs were transduced with respective retroviral vectors, and 2 days later, changes in the number of GFP+ NPCs were measured (Fig. 2d). In all three groups, the number of GFP+ cells was doubled to a similar level by day 2, and there was no significant difference between the control and GSK3α- and GSK3β- overexpressing cells. These data indicate that GSK3 does not influence the proliferative potential of NPCs. Taken together, above-mentioned results corroborate the notion that GSK3β, but not GSK3α, inhibited neuronal differentiation and helped NPCs to maintain their stemness.
To determine whether kinase activity of GSK3β is involved in the inhibition of neuronal differentiation, a retroviral vector expressing a mutant form of GSK3β that contains phenylalanine in the place of tyrosine at the 216th codon was constructed. This mutant form has previously been shown to exhibit reduced kinase activity [22], and its expression was confirmed by western blot as shown in Fig. 2a (lane 4). Primary NPCs were transduced with retroviral vectors expressing the wild type or this mutant sequence of GSK3β and induced to differentiate for 3 days. Retroviral expression of this mutant form resulted in a significantly greater number of TuJ1-positive cells compared with cells expressing the wild-type protein (Fig. 2e). When GSK3β-expressing progenitor cells were induced to differentiate in the presence of SB216763 for 3 days, the GSK3β-mediated inhibition of neuronal differentiation was abrogated in a dose-dependent manner (Fig. 2f). These data demonstrate that GSK3β negatively controlled the neuronal differentiation of progenitor cells and that kinase activity of GSK3β was essential for this inhibition.
Effects of GSK3β on neuronal differentiation in the embryonic brain
To test the effect of GSK3β on neuronal differentiation during brain development in vivo, a retroviral vector expressing GSK3β and eGFP as a bicistronic message was delivered to the ventricles of E9.5 embryonic brains using the ultrasound image-guided gene delivery technique [20], and the brains were analyzed at E14.5. Under this experimental condition, NPCs in the ventricular zone (VZ) are transduced with retroviral vectors, and the neurons produced from these NPCs migrate away from the VZ during neurogenesis. Because the NICD is well known to strongly inhibit neuronal differentiation [19,24], this sequence was used as a positive control. When a control vector expressing only eGFP was injected into embryonic brains, ∼86% of eGFP-positive cells were found in the TuJ1-stained region, while NICD-transduced cells were predominantly localized in the VZ (Fig. 3a, b). In the case of GSK3β, ∼31% of cells were positive for TuJ1, and this percentage was significantly lower than that of the control. These data suggest that GSK3β could indeed suppress neuronal differentiation and that it was involved in maintaining the characteristics of NPCs in embryonic brains.

GSK3β inhibits neuronal differentiation in vivo. Retroviral vectors expressing Notch1 intracellular domain (NICD) or GSK3β, together with eGFP, were injected into E9.5 embryonic brains (n=3/group), and then the brains were immunostained with antibodies to eGFP and TuJ1 at E14.5.
Regulation of GSK3 by the mTORC1 signaling pathway
Rapamycin, an mTORC1 inhibitor, has been reported to repress the neuronal differentiation of NPCs [16,17,25,26]. In the following experiments, it was tested whether mTORC1 is involved in the regulation of GSK3 in NPCs using chemical inhibitors. Primary E14.5 NPCs were differentiated with DMEM containing 2% FBS and treated with 20 nM rapamycin alone or with 5 μM SB216763 for 3 days. The activities of SB216763 and rapamycin were confirmed by measuring the phosphorylation level of their downstream target proteins, p-GSK3α (Tyr279), p-GSK3β (Tyr216), and p-P70S6K (Thr389), using western blot analysis (Fig. 1a, lanes 2 and 3). Upon SB216763 and rapamycin treatment for 3 h, tyrosine phosphorylation of both GSK3 isoforms and p-P70S6K levels were decreased, respectively. When cells were treated with both inhibitors, the level of the downstream targets of both inhibitors was decreased. These data showed that rapamycin did not influence the inhibitory effect of SB216763 or vice versa (Fig. 1a, lane 4). Upon 20 nM rapamycin treatment, the percentage of TuJ1-positive cells was reduced from 51% to 8%, but 5 μM SB216763 completely reversed this effect (Fig. 4a). A similar observation was made in the C17.2 murine immortalized neural stem cell line using SB216763 and LiCl (another well-known GSK3 inhibitor) (data not shown). Again, the proportion of Nestin-positive cells increased from 55% to 73% after rapamycin treatment, and the extent of this increase was reduced by SB216763 co-treatment. The percentage of GFAP-positive cells was not affected by rapamycin or SB216763. These data suggest that GSK3 might inhibit neuronal differentiation as a downstream target of mTORC1.

Mammalian target of rapamycin complex1 (mTORC1) inhibits GSK3β by serine9 phosphorylation.
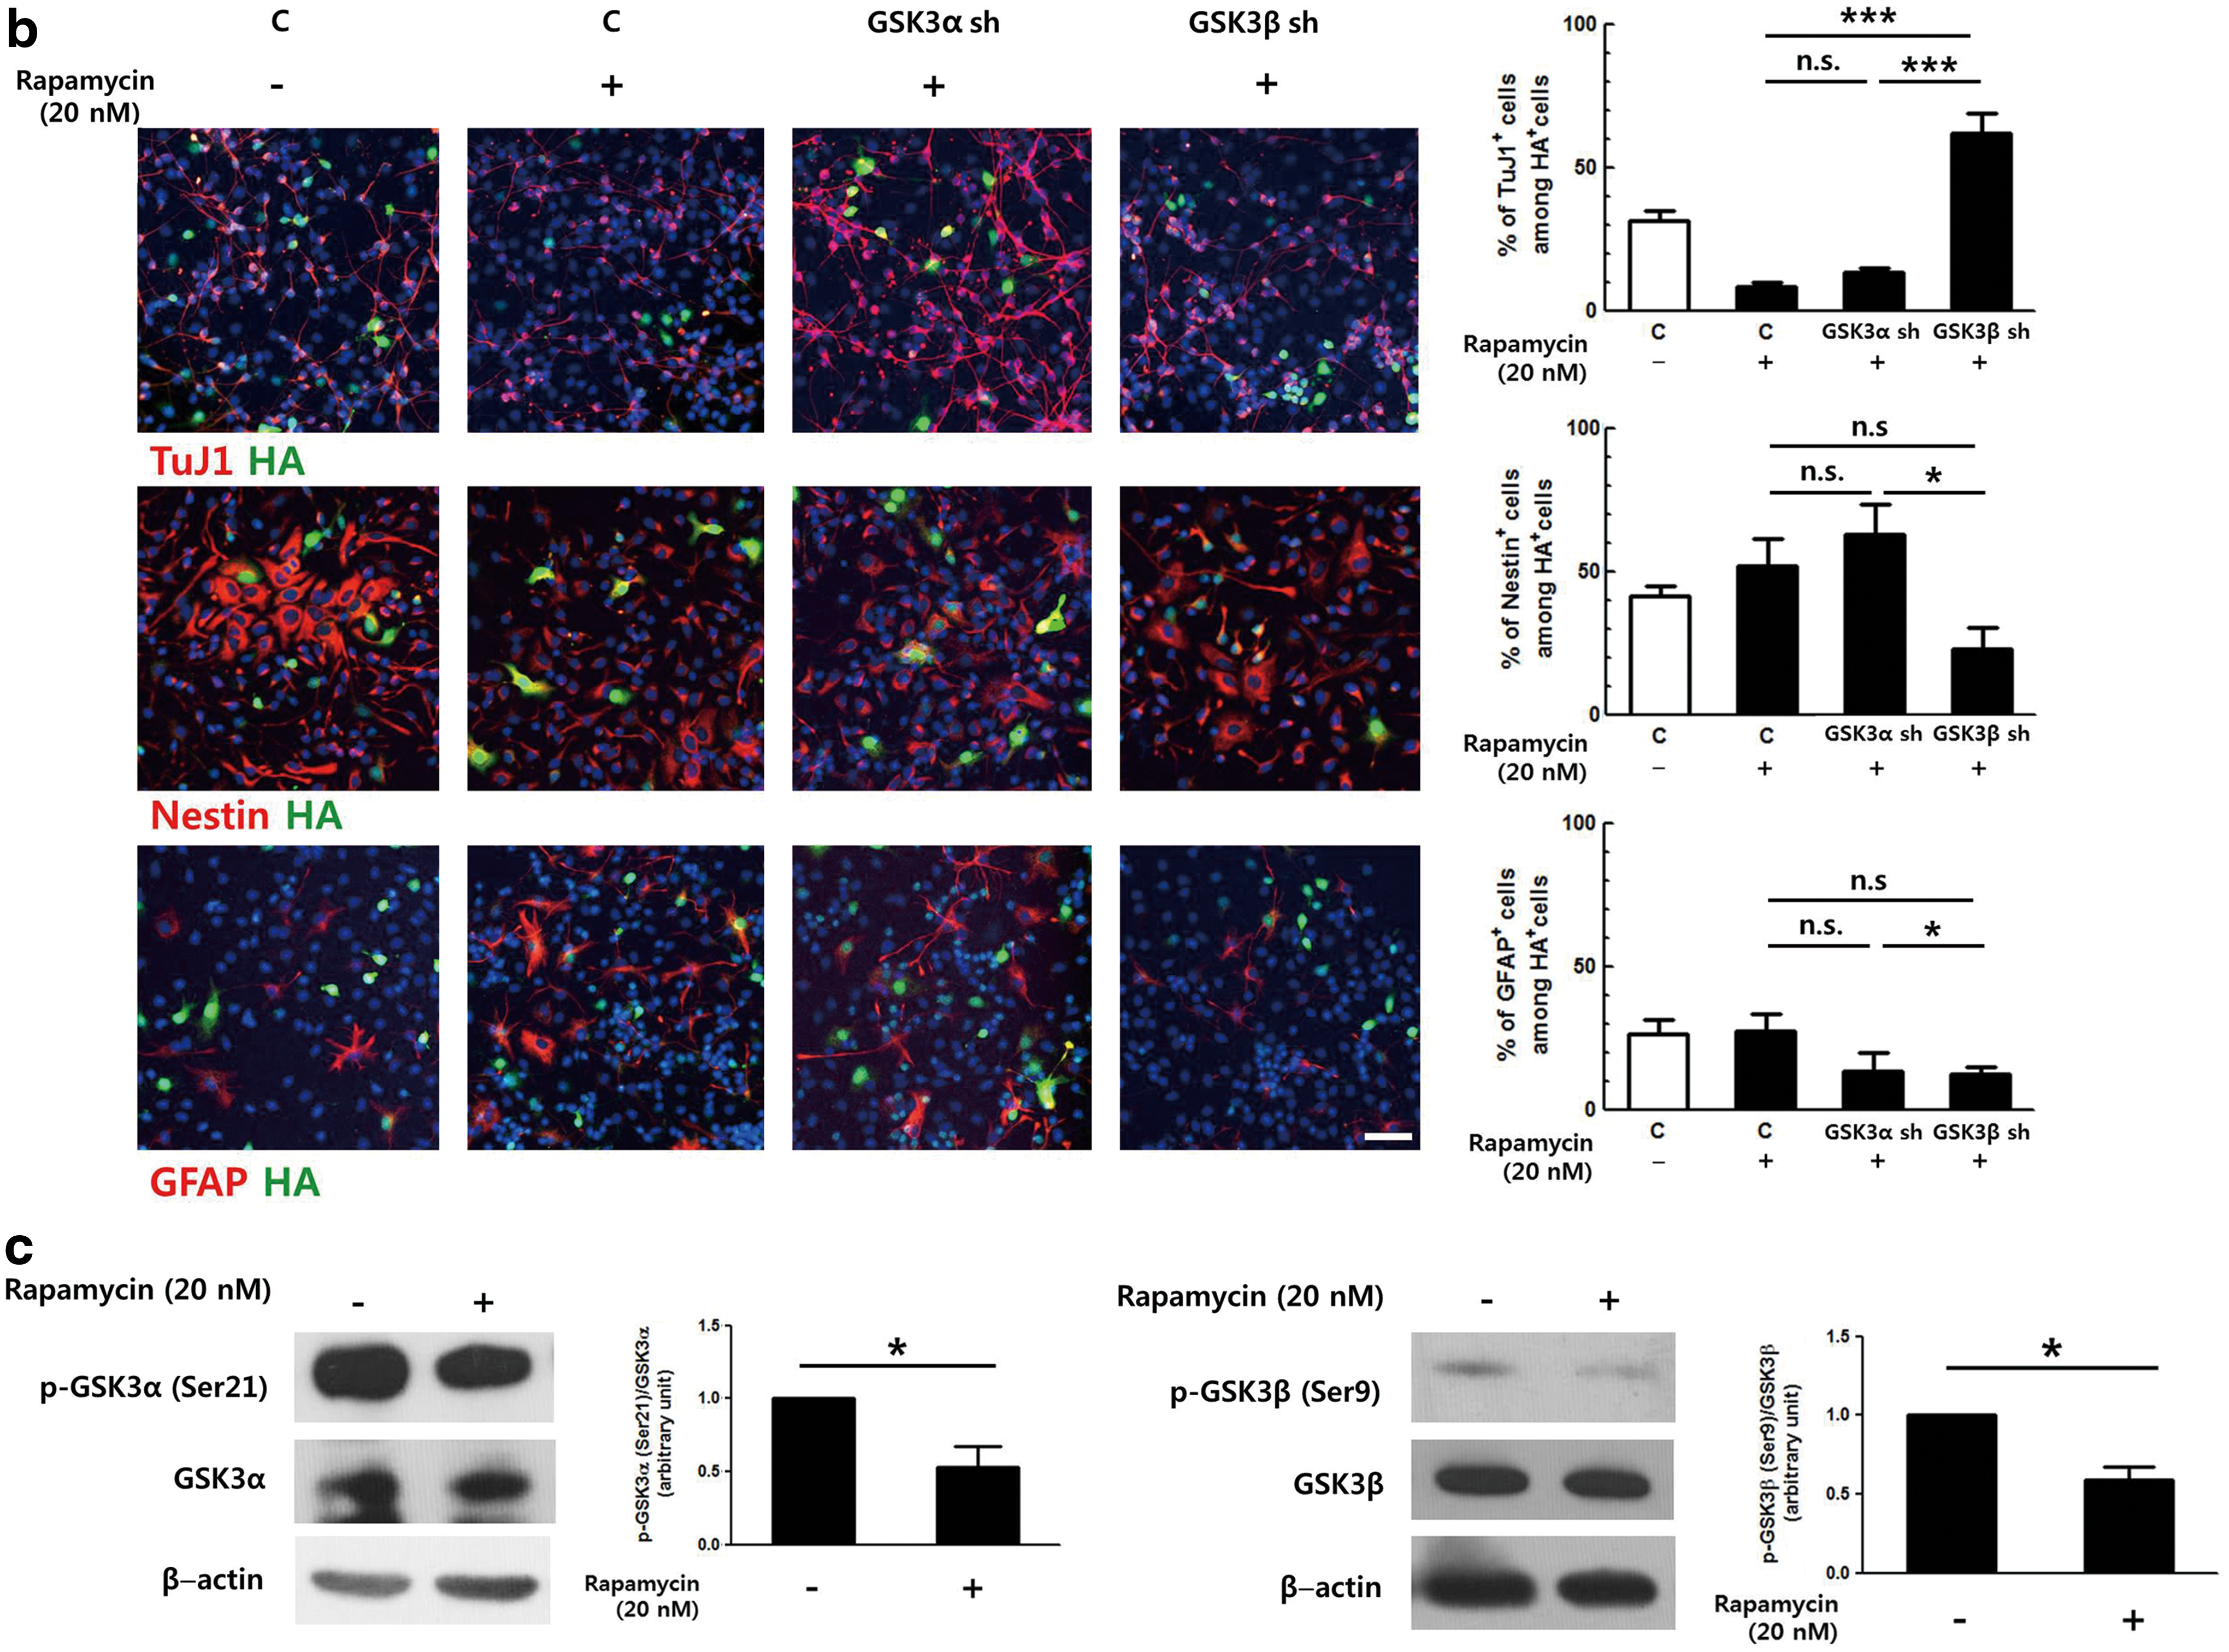
We hypothesized that GSK3α and GSK3β might be differentially regulated by mTORC1. Because SB216763 inhibits both GSK3α and GSK3β, shRNAs targeting each isoform were employed to test the effect of mTORC1 on each isoform. Primary NPCs were transduced with retroviral vectors expressing shRNA against GSK3α or GSK3β and induced to differentiate in the presence of 20 nM rapamycin for 2 days (Fig. 4b). Similar to the above results, rapamycin treatment reduced the number of immature neurons by ∼65% in the control group (from 31.5% to 11.2%). The level of reduction was similar when GSK3α shRNA-expressing cells were treated with rapamycin. However, this reduction was not observed in the GSK3β shRNA-expressing group. As expected, knock-down of the expression of GSK3β produced a proportion of TuJ1-positive cells that was greater than that of the control group (Fig. 4b, white bar), similar to the result shown in Fig. 1e. The proportion of Nestin-positive cells was increased ∼1.5-fold when control and GSK3α-silenced cells were treated with rapamycin. When GSK3β expression was lowered by shRNA, this increase was significantly reduced, and only ∼23% of the GSK3β shRNA-expressing cells remained as NPCs. Therefore, these data not only confirm that rapamycin inhibited neuronal differentiation by blocking the repression of GSK3 activity but also clearly demonstrate that GSK3α and GSK3β were differentially affected by the upstream regulator mTORC1.
As mTORC1 is known to regulate GSK3 via phosphorylation of the inhibitory serine residue [14,15], the effects of mTORC1 on serine phosphorylation of GSK3α and GSK3β were investigated in NPCs. Primary NPCs were treated with 20 nM rapamycin for 24 h and proteins were prepared and analyzed by western blot. The serine phosphorylation levels of both GSK3α and GSK3β were decreased by 50.7% and 37.6% upon rapamycin treatment, respectively (Fig. 4c). These data indicate that the inhibition of mTORC1 resulted in reduced serine phosphorylation of both GSK3α and GSK3β, suggesting that other regulatory mechanisms might be involved in controlling the activity of GSK3 isoforms downstream of mTORC1.
Discussion
Prior to our study, the roles of the two isoforms of GSK3, GSK3α and GSK3β, in the differentiation of NPCs were unclear. To identify the functions of each isoform in brain development, expression levels of GSK3α and GSK3β were separately manipulated in NPCs through the downregulation or overexpression of each isoform. Knock-down of the expression of GSK3β led to increased neurogenesis, while stable expression of GSK3β suppressed neurogenesis and helped to maintain NPC characteristics both in vitro and in vivo. In contrast, GSK3α alone did not produce any noticeable effect. Our data are in agreement with the results of experiments involving Drosophila that are defective in the shaggy gene, a GSK3 homologue, which exhibit bristle hyperplasia on the thorax [6].
Our results contrast with the findings of a double knock-out study by Kim et al. [5], which showed that the loss of GSK3 induces hyperproliferation of NPCs and decreases neuronal differentiation. Although the reason for the discrepancy between these two studies is not clear, the germ-line deletion of GSK3α might have caused indirect effects, as GSK3 is an important regulator during embryogenesis [27]. Both GSK3α and GSK3β are known to be expressed from the two-cell stage embryo, and their activities are tightly controlled as the embryo develops [28]. Therefore, germ-line manipulation of either form of GSK3 may have produced unexpected outcomes in the later stages of development, especially when the other form, which could have compensated for the loss, was deleted. In our experiment, we controlled the expression level of each isoform at a relatively late stage of embryonic development and demonstrated that GSK3β acts as a negative regulator during embryonic neurogenesis.
Our study suggests that the two isoforms can have two different consequences in the context of neuronal differentiation. Considering the different life spans of GSK3α and GSK3β single knock-out mice [5,29,30], it is possible that GSK3α may not be able to complement all the defects caused by the absence of GSK3β. This possibility could indicate that the two isoforms target different populations of cellular proteins. GSK3 has been shown to play a role in many different signaling pathways that are involved in neural cell proliferation and differentiation including Wnts, Sonic Hedgehog, Notch, and c-Myc [31 –35]; however, all studies demonstrating these effects were performed with GSK3β only. GSK3α might not target the same proteins as GSK3β, and even if it does, the regulatory activities of each isoform may be differentially manipulated.
The exact mechanisms by which GSK3α and GSK3β are regulated require further investigation. In our study, rapamycin failed to suppress neuronal differentiation in GSK3β-, but not GSK3α-, knock-down cells, indicating that mTORC1 might not affect the activity of GSK3α. Other investigators have indicated that the functions of GSK3α and GSK3β can be regulated independently. For example, dephosphorylation of the N-terminal regions of the two isoforms has been shown to be regulated by different phosphatases, PP2A for GSK3α and PP1 for GSK3β [13]. It was also reported that GSK3α was preferentially localized in the nucleus compared with GSK3β, which might allow GSK3α to be more competent in phosphorylating its target protein [36]. Whatever the case, our data unequivocally demonstrate that GSK3β, but not GSK3α, is a key mediator of NPC differentiation.
A recent publication showed that the selective silencing of either GSK3α or GSK3β leads to different consequences in mouse models of Alzheimer's disease [37]. GSK3α-, but not GSK3β-, silenced amyloid precursor protein transgenic mice exhibited reduced levels of amyloid β formation in the adult hippocampus, which indicates the characteristic roles of GSK3α and GSK3β in neurodegenerative disease. GSK3 is known to be a critical protein involved in numerous central nervous system diseases, including bipolar disorder, Alzheimer's disease, and schizophrenia [38 –40]. The study of GSK3 isoforms is critical not only for the understanding of these serious human disorders but also for the development of new and effective therapeutic strategies.
Footnotes
Acknowledgments
This work was supported in part by grants given to S.K. by the Brain Research Center of the 21st Century Frontier Research Program (no. 2012K001130) and the Basic Science Research Program through the National Research Foundation of Korea (NRF) (no. 2012R1A1A2008018), both of which are administered by the Ministry of Education, Science, and Technology.
Author Disclosure Statement
No competing financial interests exist.