
Abstract
Skeletal dysplasias (SDs) are caused by abnormal chondrogenesis during cartilage growth plate differentiation. To study early stages of aberrant cartilage formation in vitro, we generated the first induced pluripotent stem cells (iPSCs) from fibroblasts of an SD patient with a lethal form of metatropic dysplasia, caused by a dominant mutation (I604M) in the calcium channel gene TRPV4. When micromasses were grown in chondrogenic differentiation conditions and compared with control iPSCs, mutant TRPV4-iPSCs showed significantly (P<0.05) decreased expression by quantitative real-time polymerase chain reaction of COL2A1 (IIA and IIB forms), SOX9, Aggrecan, COL10A1, and RUNX2, all of which are cartilage growth plate markers. We found that stimulation with BMP2, but not TGFβ1, up-regulated COL2A1 (IIA and IIB) and SOX9 gene expression, only in control iPSCs. COL2A1 (Collagen II) expression data were confirmed at the protein level by western blot and immunofluorescence microscopy. TRPV4-iPSCs showed only focal areas of Alcian blue stain for proteoglycans, while in control iPSCs the stain was seen throughout the micromass sample. Similar staining patterns were found in neonatal cartilage from control and patient samples. We also found that COL1A1 (Collagen I), a marker of osteogenic differentiation, was significantly (P<0.05) up-regulated at the mRNA level in TRPV4-iPSCs when compared with the control, and confirmed at the protein level. Collagen I expression in the TRPV4 model also may correlate with abnormal staining patterns seen in patient tissues. This study demonstrates that an iPSC model can recapitulate normal chondrogenesis and that mutant TRPV4-iPSCs reflect molecular evidence of aberrant chondrogenic developmental processes, which could be used to design therapeutic approaches for disorders of cartilage.
Introduction
S
The TRPV4 gene encodes the transient receptor potential vanilloid family member 4, calcium channel protein. Heterozygous mutations in this gene result in a spectrum of dominantly inherited SD phenotypes [3 –8]. TRPV4 is a tetrameric calcium-permeable ion channel that plays a role in chondrocyte differentiation [9 –13]. The first molecular defect in TRPV4 was described for brachyolmia, a relatively mild condition characterized by short stature, a short trunk, and scoliosis [3]. Next, other distinct mutations were found in TRPV4 for the moderate severity spondylometaphyseal dysplasia Kozlowski type (SMDK) and the nonlethal and lethal forms of metatropic dysplasia [4,5]. The perinatal lethal form of metatropic dysplasia has an extremely severe phenotype, including severe shortening of the long bones and a small chest with perinatal death resulting from cardiopulmonary compromise [5]. The majority of the TRPV4 mutations seen in SDs are single amino-acid substitutions. In vitro electrophysiological studies have shown that these mutations activate the calcium channel with an increased basal activity [3 –5,12]. This leads to the loss of normal ion pore gating and increased intracellular calcium levels [11,12], consistent with a gain-of-function mechanism. However, reduced channel activity was reported for TRPV4 mutations in the mild disorder, familial digital arthropathy-brachydactyly (FDAB), which is primarily characterized by osteoarthropathy in the hands [7]. TRPV4 mutations, sometimes in the same region of the gene, can show highly variable phenotypes that affect the skeleton, the peripheral nervous system, or both [6,8,13]. Several mechanisms for such phenotypes have been suggested, including: defects in Ca2+ homeostasis in chondrocytes or in motor and sensory neurons, abnormal protein-protein interactions, or dysregulation of gene expression during chondrocyte differentiation [13]. The mechanism by which TRPV4 mutation causes SD is unclear, and a major limitation of current cellular models is that they cannot replicate the range of TRPV4 activity during chondrogenesis, as they are transfection models which result in overexpressed homotetrameric mutant channels [3 –5,7,12].
Historically, induced pluripotent stem cells (iPSCs) were first established from mouse fibroblasts using defined factors [14] and subsequently from human adult fibroblasts [15,16]. The iPSC technology that replicates human disease in the culture dish [17] has already been used to model phenotypes of several disorders [18], including ALS [19,20], muscular dystrophy, Huntington's disease [21], Parkinson's disease [22], spinal muscular atrophy [23], Marfan syndrome [24], and osteogenesis imperfecta [25]. Recently, using an in vitro cartilage defect model system, it has been shown that differentiated mouse iPSCs can be used for functional cartilage repair [26]. In addition, using different in vitro techniques, it has been reported that human embryonic stem (ES) cells [27,28] and human iPSCs [29 –31] could be directed toward chondrogenic differentiation. We focused on the development of a human in vitro iPSC model of chondrogenesis to identify molecular pathways that might be altered in a neonatal lethal form of metatropic dysplasia. This approach utilizes the natural heterozygous state of the mutation in each iPSC line to understand the impact of specific mutations on signaling during chondrogenic differentiation.
Here, we report for the first time that patient-derived iPSCs can recapitulate dysregulated processes of cartilage development and that markers of cartilage growth plate formation, including the transcription factor SOX9 [32,33], type II collagen [34 –36] Aggrecan, and type X collagen [37,38], were significantly down-regulated over time in patient TRPV4-iPSCs when compared with the control. In addition, both bone morphogenetic protein 2 (BMP2) and transforming growth factor beta 1 (TGFβ1), two key regulators of chondrogenesis [39,40], cartilage repair [41] and used to obtain direct chondrogenic differentiation of human ES cells in vitro [28], showed abnormal signaling in patient iPSCs. This is the first indication that developmental processes, beyond activation of the calcium channel, could underlie this lethal form of metatropic dysplasia and provide proof-of-concept evidence that in vitro iPSC models can be used to dissect molecular mechanisms in cartilage disorders, an important first step toward potential treatment.
Materials and Methods
SD TRPV4-iPSC generation using nonintegrating episomal vectors
Human neonatal skin fibroblasts were obtained from the International Skeletal Dysplasia Registry (ISDR) of Cedars-Sinai Medical Center. Fibroblasts from a patient (R08-023) with lethal metatropic dysplasia, caused by a mutation (I604M) in the calcium gene TRPV4, were reprogrammed by the iPSC core (
Sequencing of TRPV4-iPSC clones
Heterozygous mutation of TRPV4 was confirmed in the iPSC clones. Briefly, bidirectional sequence analysis was performed as described [5], and the resulting sequences were compared with the reference for TRPV4, with nucleotide numbering starting from the A of the ATG initiation codon. The I604M substitution, in case R08-023, occurs in the cytoplasmic loop between the TM4 and TM5 domains [5].
Immunofluorescence of pluripotent markers
As reported [44], iPSCs grown on coverslips coated with Matrigel (BD Biosciences) were incubated with antibodies for OCT4, SSEA-4, and SOX2 (Millipore) and with Alexa-Fluor-conjugated secondary antibodies AF488 and/or AF594 (Molecular Probes). Nuclei were counterstained with Hoechst 33258. Images were captured using a fluorescence microscope (Olympus BX51).
Embryoid-body formation and reverse transcription polymerase chain reaction
To determine germ layer formation capacity, iPSCs were plated in poly-HEMA coated flasks with embryoid-body (EB) media [20]. Spontaneous EB differentiation was assayed at 0, 14, and 28 days. Total RNA was extracted from EBs, according to the manufacturer's protocol (Qiagen), and 1 μg was reverse transcribed into cDNA, using a High-Capacity Reverse Transcription kit (Applied Biosystems). Reverse transcription polymerase chain reaction (RT-PCR) reactions were carried out using 400 nM of specific forward and reverse primers (Supplementary Table S1; Supplementary Data are available online at
Alkaline phosphatase staining
Alkaline phosphatase (AP) staining was done using the Alkaline Phosphate II staining kit (StemGent) according to the manufacturer's protocol with positive staining showing pink/purple for AP.
Karyotyping
It was performed at Cedars-Sinai by the Cytogenetics Lab. Ten high-resolution G-banded metaphase cells from each iPSC clone were assessed for chromosomal rearrangements, using standard techniques [46].
Chondrogenic differentiation of iPSC micromasses on matrigel
Chondrogenic differentiation of pluripotent stem cells was induced under serum-free conditions using a modified version of a protocol previously described [47]. The iPSCs were grown on Matrigel (BD Biosciences) as a micromass (200,000 cells/each) using chondrogenic media (CM) with BMP2 (CMB) or TGFβ1 (CMT), (Peprotech). Normal fibroblast-derived iPSC lines 83i-n1 and 14i-n6 were obtained from the iPSC Core at Cedars-Sinai. iPSCs were cultured to confluency in mTeSR1 media, trypsinized using TryPLE Express (Life Technologies) for 5 min at 37°C, spun for 1 min at room temperature (RT), washed in 1× phosphate buffered saline (PBS), and resuspended in mTeSR1 to obtain a single cell suspension. A 24-well plate (Fisher Scientific) for each iPSC line and/or clone was used by coating the center of each well with 10 μL Matrigel for 1 h at RT. Cells were replated at a density of 2×10⁵ cells as a “micromass” using 10 μL of mTeSR1 per well. After 2 h at 37°C in a humidified 5% CO2, 0.4 mL of the same medium was slowly added to each well. After 24 h, the media was replaced, only in samples used for chondrogenic differentiation, with Dulbecco's modified Eagle's medium (DMEM) high glucose containing 10% fetal bovine serum, 10% knockout serum replacement (KSR) and 1% Pen/Strep (Life Technologies). At day 1, the cultures were supplied with CM consisting of DMEM high glucose with sodium pyruvate and L-glutamine and containing 1% KSR, 1% Pen/Strep, 1% MEM Nonessential Amino Acids, 1% ITSX (Life Technologies), 10 μg/mL BSA, 50 μg/mL Ascorbic acid, 40 μg/mL L-Proline, and 10−7 M Dexamethasone (Sigma), or CM supplemented with either 100 ng/mL of recombinant human BMP2 (CMB) or 10 ng/mL of recombinant human TGFβ1 (CMT). Media (mTSeR1, CM, CMB, or CMT) was changed every 3 days throughout the treatment. Total RNA, protein, and micromass sections (described next) were prepared, and the media was also collected at 7, 14, and 21 days.
Alcian blue and Alizarin red staining
Micromass wells and cartilage tissue sections were fixed in 4% Paraformaldehyde, washed with 1× PBS, and incubated for 1 h with 0.5% Alcian Blue (Sigma) in 3% glacial acetic acid (pH 1.0). After incubation, the samples were washed with 3% glacial acetic acid (pH 1.0) once, followed by 3% glacial acetic acid (pH2.5) twice. Cartilage tissue sections were incubated for 1 h with 0.5% Alizarin red S (Sigma) at pH 4.2 and washed twice with distilled water. All samples were allowed to dry before imaging. Stained samples were imaged with a digital inverted microscope, EVOS xl core (AMG-Life Technologies).
PluriTest: bioinformatics based assay for pluripotency
A gene-chip and bioinformatics assay, PluriTest [48], using Illumina HT12 arrays, representing 23,000 genes, was utilized to determine TRPV4-iPSC clone pluripotency. The array was run at the UCLA genomics core (
Quantitative real-time polymerase chain reaction
Total RNA and cDNA were prepared as described earlier. All quantitative real-time polymerase chain reaction (qPCR) reactions were performed in triplicate in 10 μL reactions containing 10 ng cDNA, 400 nM forward and reverse primers, and 2× POWER SYBR Mix (Applied Biosystems). Reactions were run on a Viia7 System (Applied Biosystems) with the following parameters: 95°C for 8 min, followed by 40 cycles of 95°C for 15 s, 60°C for 1 min, and 72°C for 5 min. Results were analyzed using the 2−ΔΔCt method, with GAPDH as the endogenous control and iPSCs (control or SD) at day 0 as the reference sample set to a value of 1. Statistical analysis was performed using an unpaired Student t-test and chi square test. A probability (P) value ≤0.05 was considered statistically significant.
Western blot analysis for type I (COL1) and type II (COL2) collagens
Conditioned Media (1 mL) was collected from micromass differentiation experiments at specific time points. Media was concentrated to 10× using Amicon Ultra 20K centrifuge spin columns according to the manufacturer's protocol (Millipore). Samples were loaded and run on a 4%–12% Tris-glycine stacking gel (Novex) with SDS buffer using the XCell SureLock Mini cell unit (Life Technologies). The blots were transferred, blocked in 5% milk, and incubated with COL2 monoclonal Ab3092 (Abcam) or with COL1 polyclonal 600-401 (Rockland) antibodies. Bands were visualized using an ECL Plus kit (Thermo Fisher Scientific).
Immunofluorescence of cartilage and bone markers
Micromasses were fixed in 4% PFA, followed by 30% sucrose, removed from tissue culture plates, frozen in OCT, sectioned in 10 μm sections using a cryostat 1850 (Leica), and incubated with polyclonal antibodies for COL2 (COL2A1) Ab300 (Abcam) or COL1, 600-401 (Rockland).
Results
Generation and characterization of iPSCs from an SD patient with a neonatal lethal form of metatropic dysplasia and mutation in TRPV4
To study abnormal cartilage formation in vitro, we utilized cells from an SD patient with a mutation (I604M) in TRPV4. The mutation results in perinatal lethal disease caused by the disruption of normal cartilaginous growth plate development [5]. To develop an in vitro model of chondrogenesis, we reprogrammed skin fibroblasts from the patient carrying the lethal TRPV4 mutation, using six factors (OCT3/4, SOX2, KL4, L-MYC, LIN28, and P53 shRNA) in three episomal plasmids [43]. We then generated integration-free SD TRPV4-iPSC lines derived from the patient's cells and three clones (23i: n1F, n12F, and n14F) were selected and characterized for pluripotency (Fig. 1). Figure 1A displays the formation of several iPSC colonies (white spots) seen at day 12 in culture where a larger colony is circled. The phase-contrast image taken at day 40 in culture shows the characteristic morphology of a typical human iPSC colony after its initial passages: a homogenous, flat appearance with well-defined edges [15,16]. Figure 1B presents a DNA sequence analysis of the three iPSC clones where both a C and a G peak are seen on standard sequencing, confirming that the heterozygous mutation in exon 11 of TRPV4, C1812>G (I604M) [5] is present in all of the patient 23i TRPV4-iPSC clones used for further experiments. Control human DNA sequence for TRPV4 is shown for a comparison in the bottom panel. Figure 1C, pluripotency is confirmed by evaluating the expression of the OCT4, SSEA4, and SOX2 markers using specific immunofluorescence staining. In Figure 1D, we show that all three 23i TRPV4-iPSC clones stained positive for AP, consistent with undifferentiated iPSCs [20]. EB formation was also assessed in vitro and Figure 1E displays the expression of genes from all three germ layers: Ectoderm (MSX1 and PAX6), Mesoderm (HAND1, BMP4), and Endoderm (AFP, GATA4, and SOX17). TDGF was used as a marker of pluripotency [45], and GAPDH was used as a housekeeping control for these experiments. Figure 1F confirms absence of the episomal vector [43] in the newly generated 23i TRPV4 clones using a genomic PCR assay for the Epstein-Barr nuclear antigen 1 (EBNA1) gene (Supplementary Table S1). A faint band seen in the n12F clone in these early passage iPSCs did not appear in later passages (after passage 20). The primers utilized for expression, integration analysis, and their band sizes are presented in Supplementary Table S1. Genomic stability was assessed by karyotyping and was normal for all three clones. A normal karyotype for one representative clone (23i-n14F) is shown (Supplementary Fig. S1). To further confirm the pluripotency of the iPSC clones, we next tested gene expression profiles using a recently developed PluriTest assay [48]. As shown in Table 1 and in Supplementary Fig. S2, all three 23i TRPV4 clones passed the PluriTest, with a Pluripotency raw score >20 and Novelty score thresholds <1.6, and were therefore employed for all of the differentiation experiments performed in these studies.
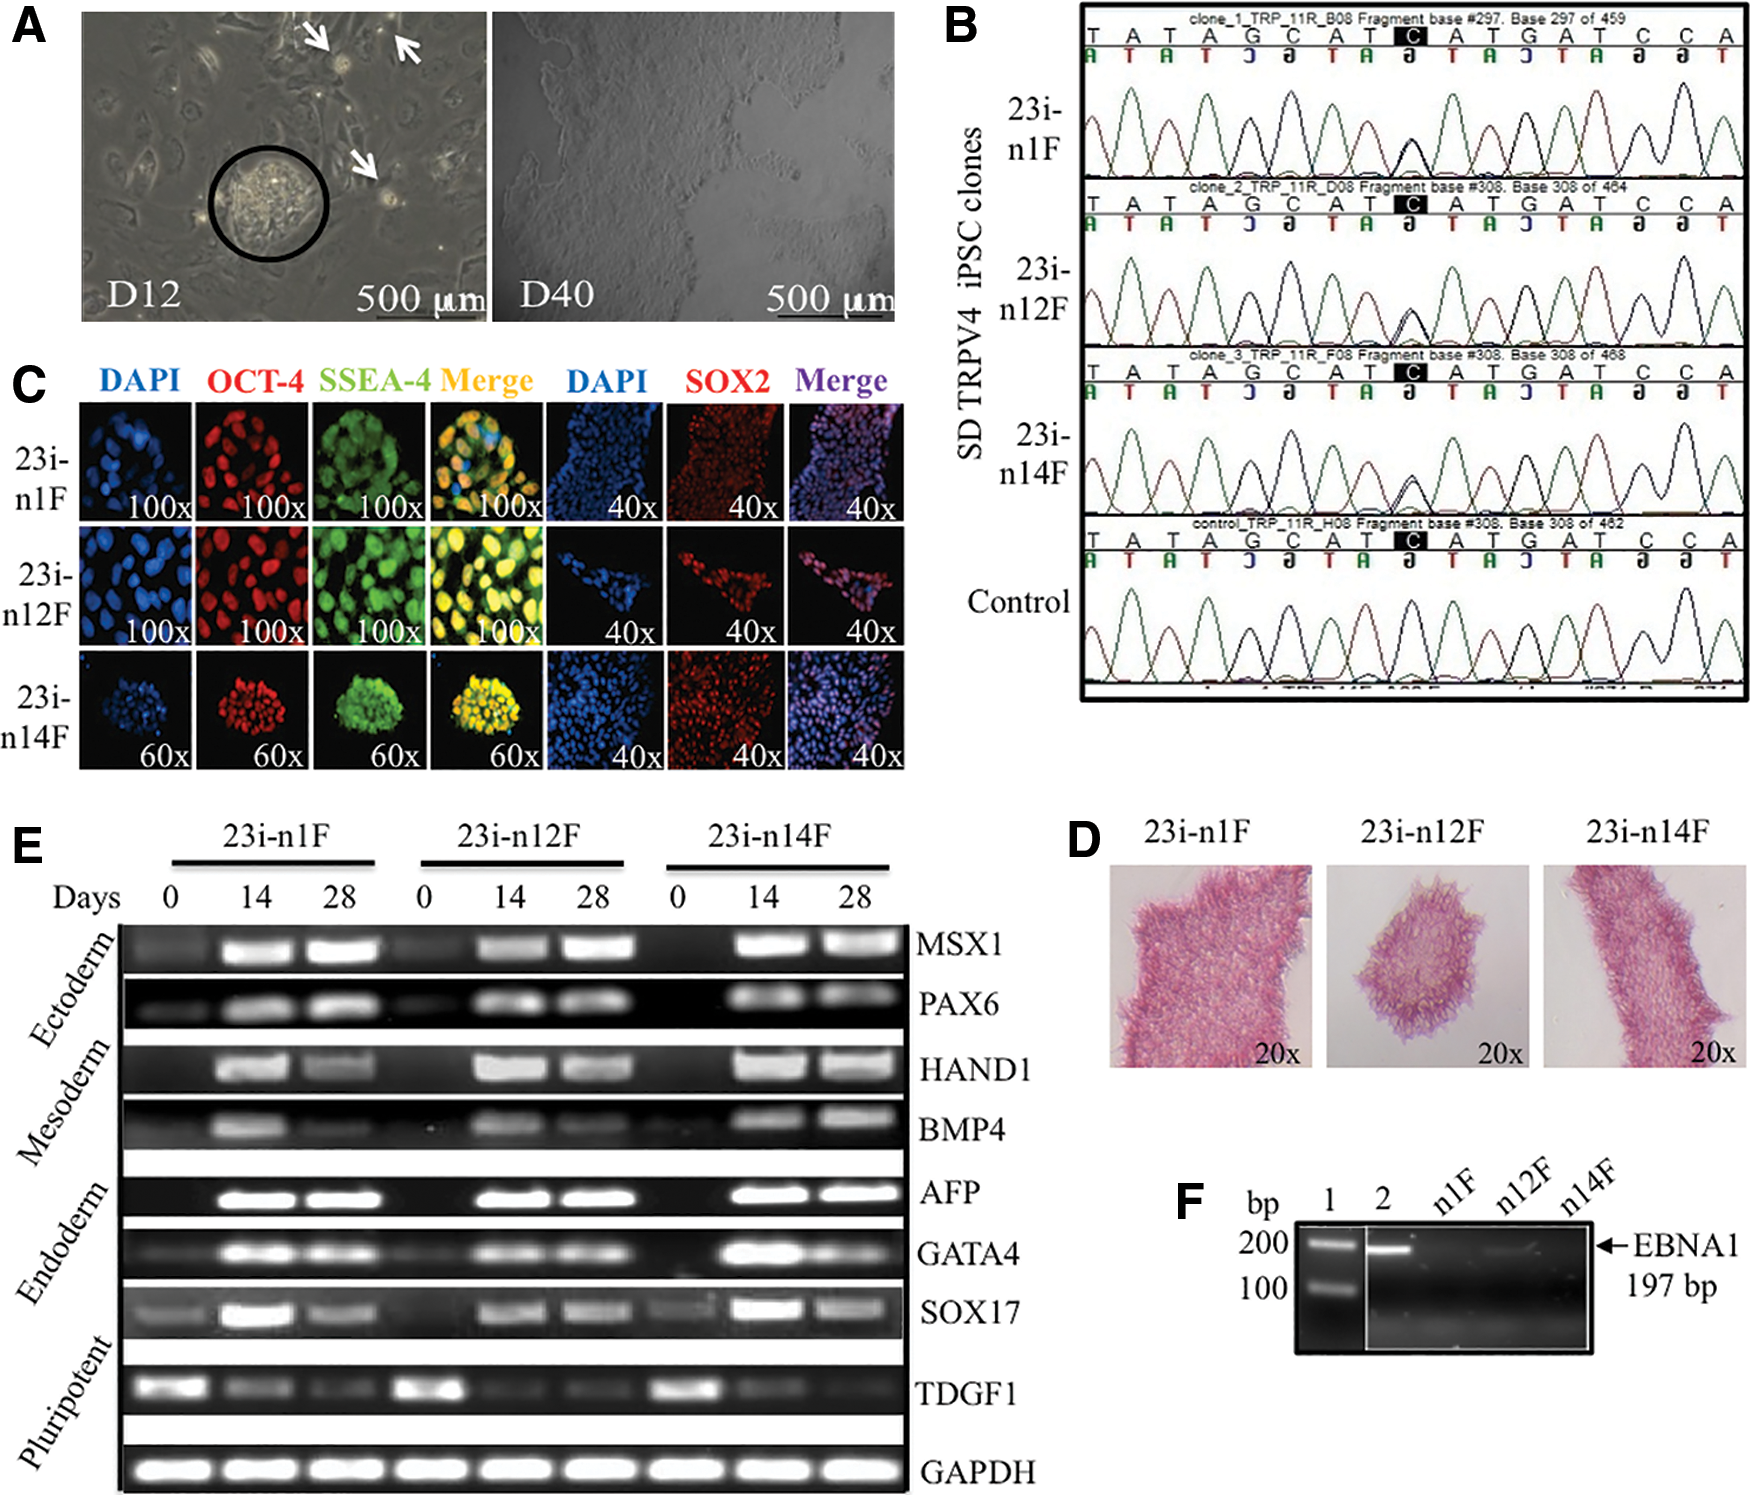
Generation and pluripotency characterization of three independent TRPV4-iPSC clones isolated from nucleofected fibroblasts of a skeletal dysplasia (SD) patient with neonatal lethal metatropic dysplasia.
iPSC, induced pluripotent stem cell.
The potential and limitations of the PluriTest, and its comparison with the teratoma assay to determine whether a specific iPSC line is pluripotent, have been discussed in depth [48]. Overall, these data demonstrate successful reprogramming of three independent 23i TRPV4-iPSC clones derived from skin fibroblasts of an SD patient with lethal metatropic dysplasia. Using standard assays for pluripotency [20] and a bioinformatics based-assay, PluriTest [48], we determined the expression of appropriate pluripotent markers and that the disease-causing mutation was present in every characterized 23i TRPV4-iPSC clone (Fig. 1).
Direct differentiation of control and SD TRPV4-iPSCs micromasses into chondrogenic lineages
Next, to establish an in vitro method for direct differentiation of iPSCs into lineages that can recapitulate progression of chondrogenesis [38], we used the distinct 23i TRPV4-mutant clones and the control iPSC lines 83i-n1 and 14i-n6 generated from reprogrammed control human fibroblasts and previously described [20]. For chondrogenic differentiation, control and SD TRPV4-iPSC lines were grown on Matrigel as micromass cultures in either iPSC medium (mTeSR; mT) [49], CM [47] or CM supplemented with 100 ng/mL of BMP2; (CMB) or with 10 ng/mL of TGFβ1; (CMT) [28], for 7, 14, or 21 days before whole mount staining with Alcian blue. This vital dye stains sulfated proteoglycans, which are characteristic of developing cartilage, as first described in micromass cultures of chondroprogenitor cells [50]. It has been used to determine accumulation over time of proteoglycan-rich matrix in human ES cells [28], in human iPSCs, and in iPSC-derived mesenchymal stem cells [31], all of which are grown as micromasses. Figure 2A and B shows micromasses stained with Alcian blue, where the accumulation of proteoglycans over time was evidenced by positive staining of iPSC micromasses grown in CM, with BMP2 (CMB) or TGFβ1 (CMT), but not in iPSC media (mT), demonstrating that chondrogenic differentiation can be reproduced in this model system. However, when comparing control versus TRPV4 mutant iPSC lines at 14 and 21 days (grown in CM, CMB, or CMT), we found that while Alcian blue staining in controls (Fig. 2A) was seen throughout the sample, the mutant showed focal areas of stain (Fig. 2B). These differences were clearer in CM and CMB conditions where a more intense staining was observed compared with the CMT condition.
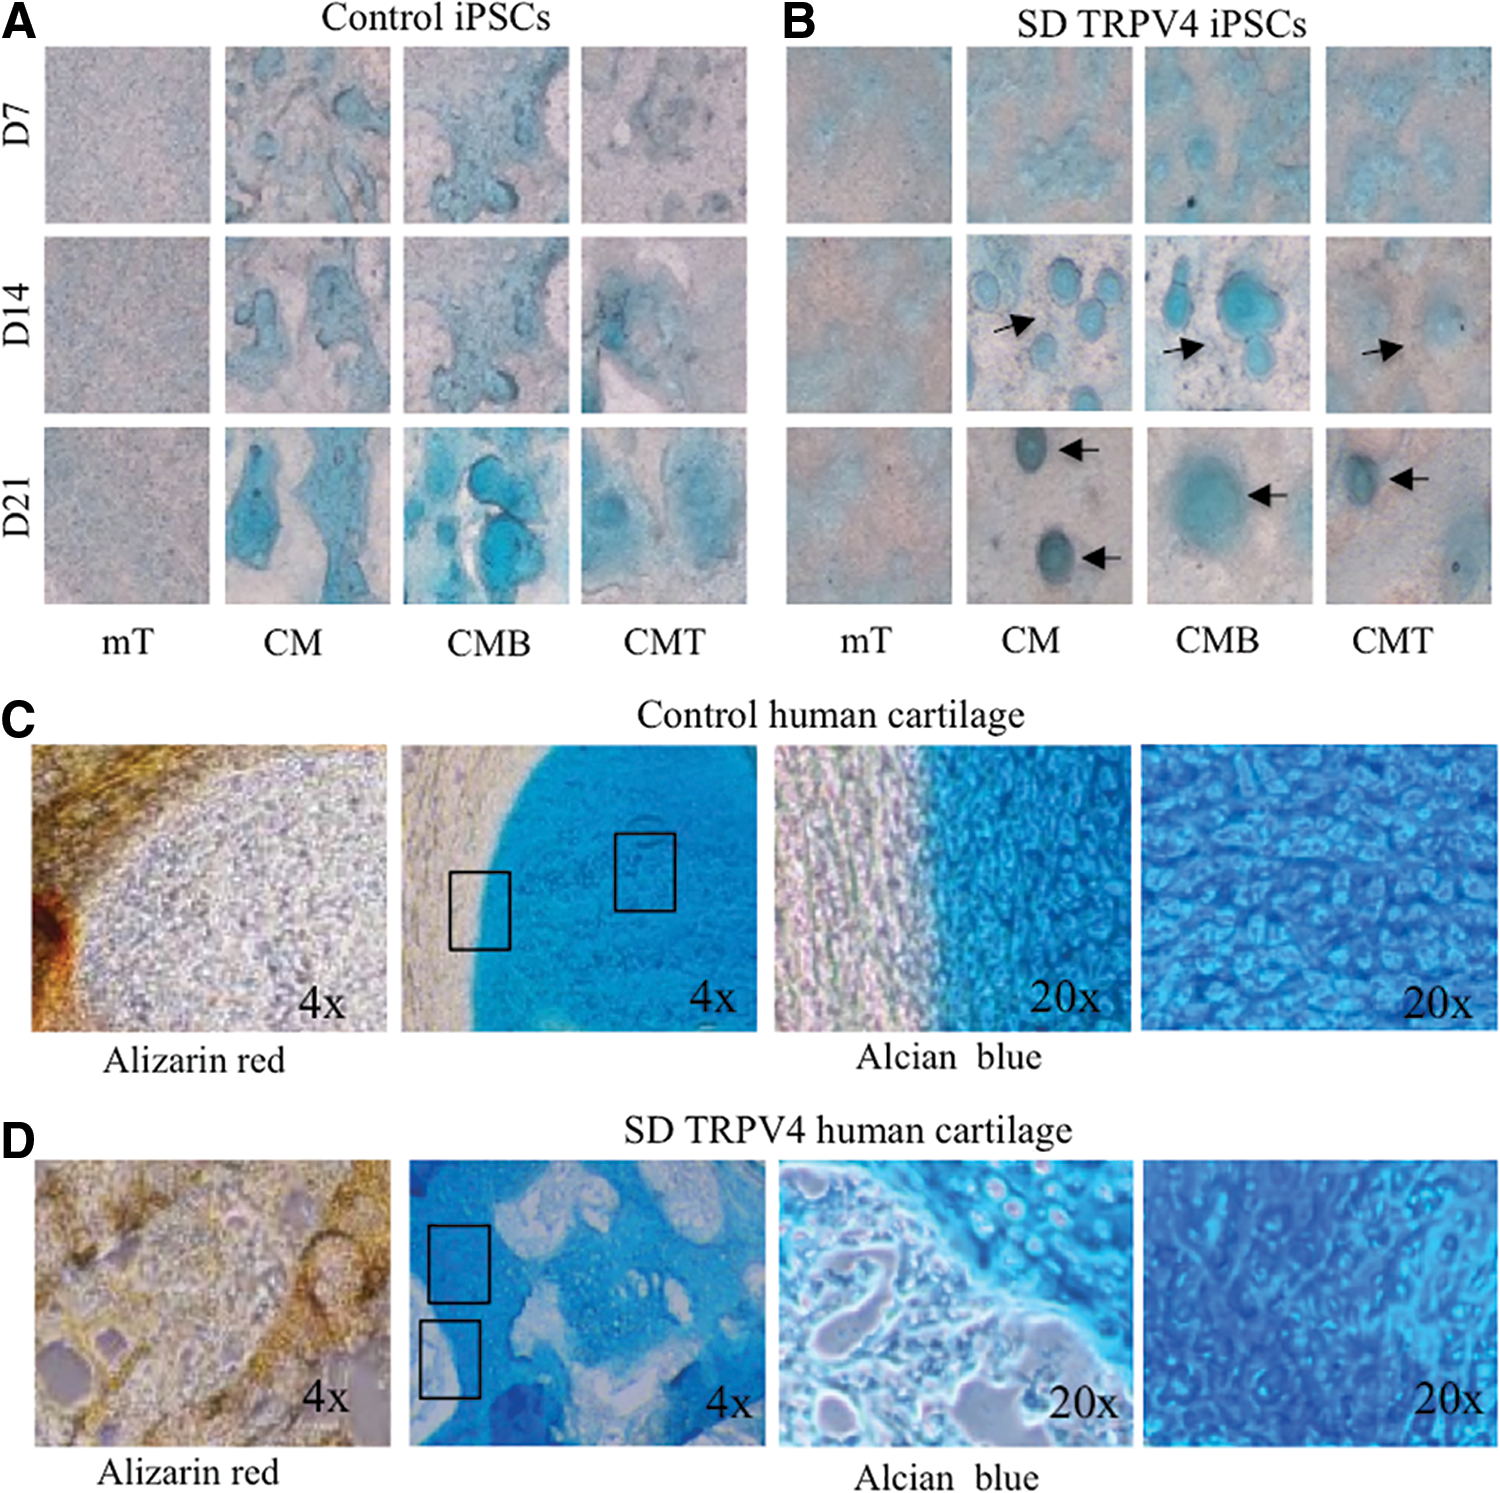
Alcian blue and Alizarin red tissue-specific staining of control and TRPV4-iPSC micromass cultures and neonatal cartilage from control human and TRPV4 patient samples.
To compare our in vitro chondrogenic model with actual human cartilage tissue, we used the biobank resources of the ISDR, curated for decades by the late Dr. Rimoin and colleagues, to compare the micromass iPSC model with samples of neonatal cartilage taken from the patient whose fibroblasts were used for generating the TRPV4-iPSCs. Figure 2C shows normal neonatal cartilage, while Figure. 2D shows the patient's neonatal cartilage sections stained with Alizarin red for developing bone [51] or Alcian blue for cartilage [50]. In control sections, Alizarin red staining was uniform and localized to the periphery of the invading ossification margin (Fig. 2C, left panel). This staining was abnormal in the TRPV4 patient's tissue and was not limited to the peripheral ossification area (Fig. 2D, left panel), but “islands” of positive staining were seen within the cartilage, suggesting altered chondrocyte differentiation in the growth plate, as reported for this disorder [5]. Overall, TRPV4 patient cartilage shows irregular Alcian blue and Alizarin red staining compared with the control cartilage. This finding corroborates the staining seen for the control and TRPV4-iPSC lines, where Alcian blue staining from control and TRPV4 lines show differences in morphology.
Impaired up-regulation of cartilage growth plate markers (SOX9, COL2A1, Aggrecan, COL10A1, and RUNX2), in TRPV4-iPSCs during chondrogenic differentiation in vitro
Type II collagen (COL2) is the characteristic and most abundant fibrillar collagen of cartilage, synthesized as a procollagen homotrimeric [(α1)II]3 structural protein, which consists of a triple-helical domain flanked by N-and C-propeptides [34]. During fibril assembly, the propeptides are removed by specific proteases to generate the native COL2 molecules [52]. Its gene, COL2A1, encodes two main alternatively spliced procollagen forms defined by the inclusion (IIA) or exclusion (IIB) of exon 2 of 207 bp [35]. Expression of these procollagen isoforms is developmentally regulated and chondroprogenitor cells express mainly IIA, while differentiated chondrocytes express predominantly IIB [53]. To confirm that early stages of chondrogenesis were represented in our iPSC chondrogenic model, we used qPCR to examine the expression of the IIA and IIB spliced forms of COL2. We found that COL2A1, form IIA (Fig. 3A), and form IIB (Fig. 3B) significantly (P<0.05) increased over time at 7, 14, and 21 days in culture in both controls and TRPV4-iPSCs. However the increase of IIA from day 0 to 21 was more than 200-fold in control iPSCs, while a maximal 80-fold increase was seen in the mutant. The IIB form was up-regulated 25-fold in control iPSCs and 15-fold in TRPV4-iPSCs from day 0 to 21 (Figz. 3B). The stronger expression of form IIA compared with form IIB suggests that early stages of chondrogenic differentiation are represented in our iPSC micromass model during this time frame in culture. Further, we found distinct differences between control and TRPV4-iPSCs in their response to BMP2 (CMB) stimulation. As shown in Fig. 3A, a steady increased expression of COL2A1 form IIA is observed when control iPSCs are treated with BMP2 (CMB), while mutant TRPV4-iPSCs show a down-regulation of IIA when compared with CM. Overall, in control iPSCs, the strongest expression of IIA (about 120-fold at day 14 and 210-fold at day 21) was seen in the presence of BMP2 (CMB). Instead in TRPV4-iPSCs, the highest expression of IIA (about 50-fold at day 14 and 80-fold at day 21) was observed in CM alone, and the addition of BMP2 (CMB) at day 14 and 21 resulted in decreased expression of the IIA form. Similar effects of BMP2 were seen on the expression of form IIB (Fig. 3B), which is up-regulated by BMP2 (CMB) at 21 days in controls, but instead appears down-regulated in TRPV4-iPSCs.
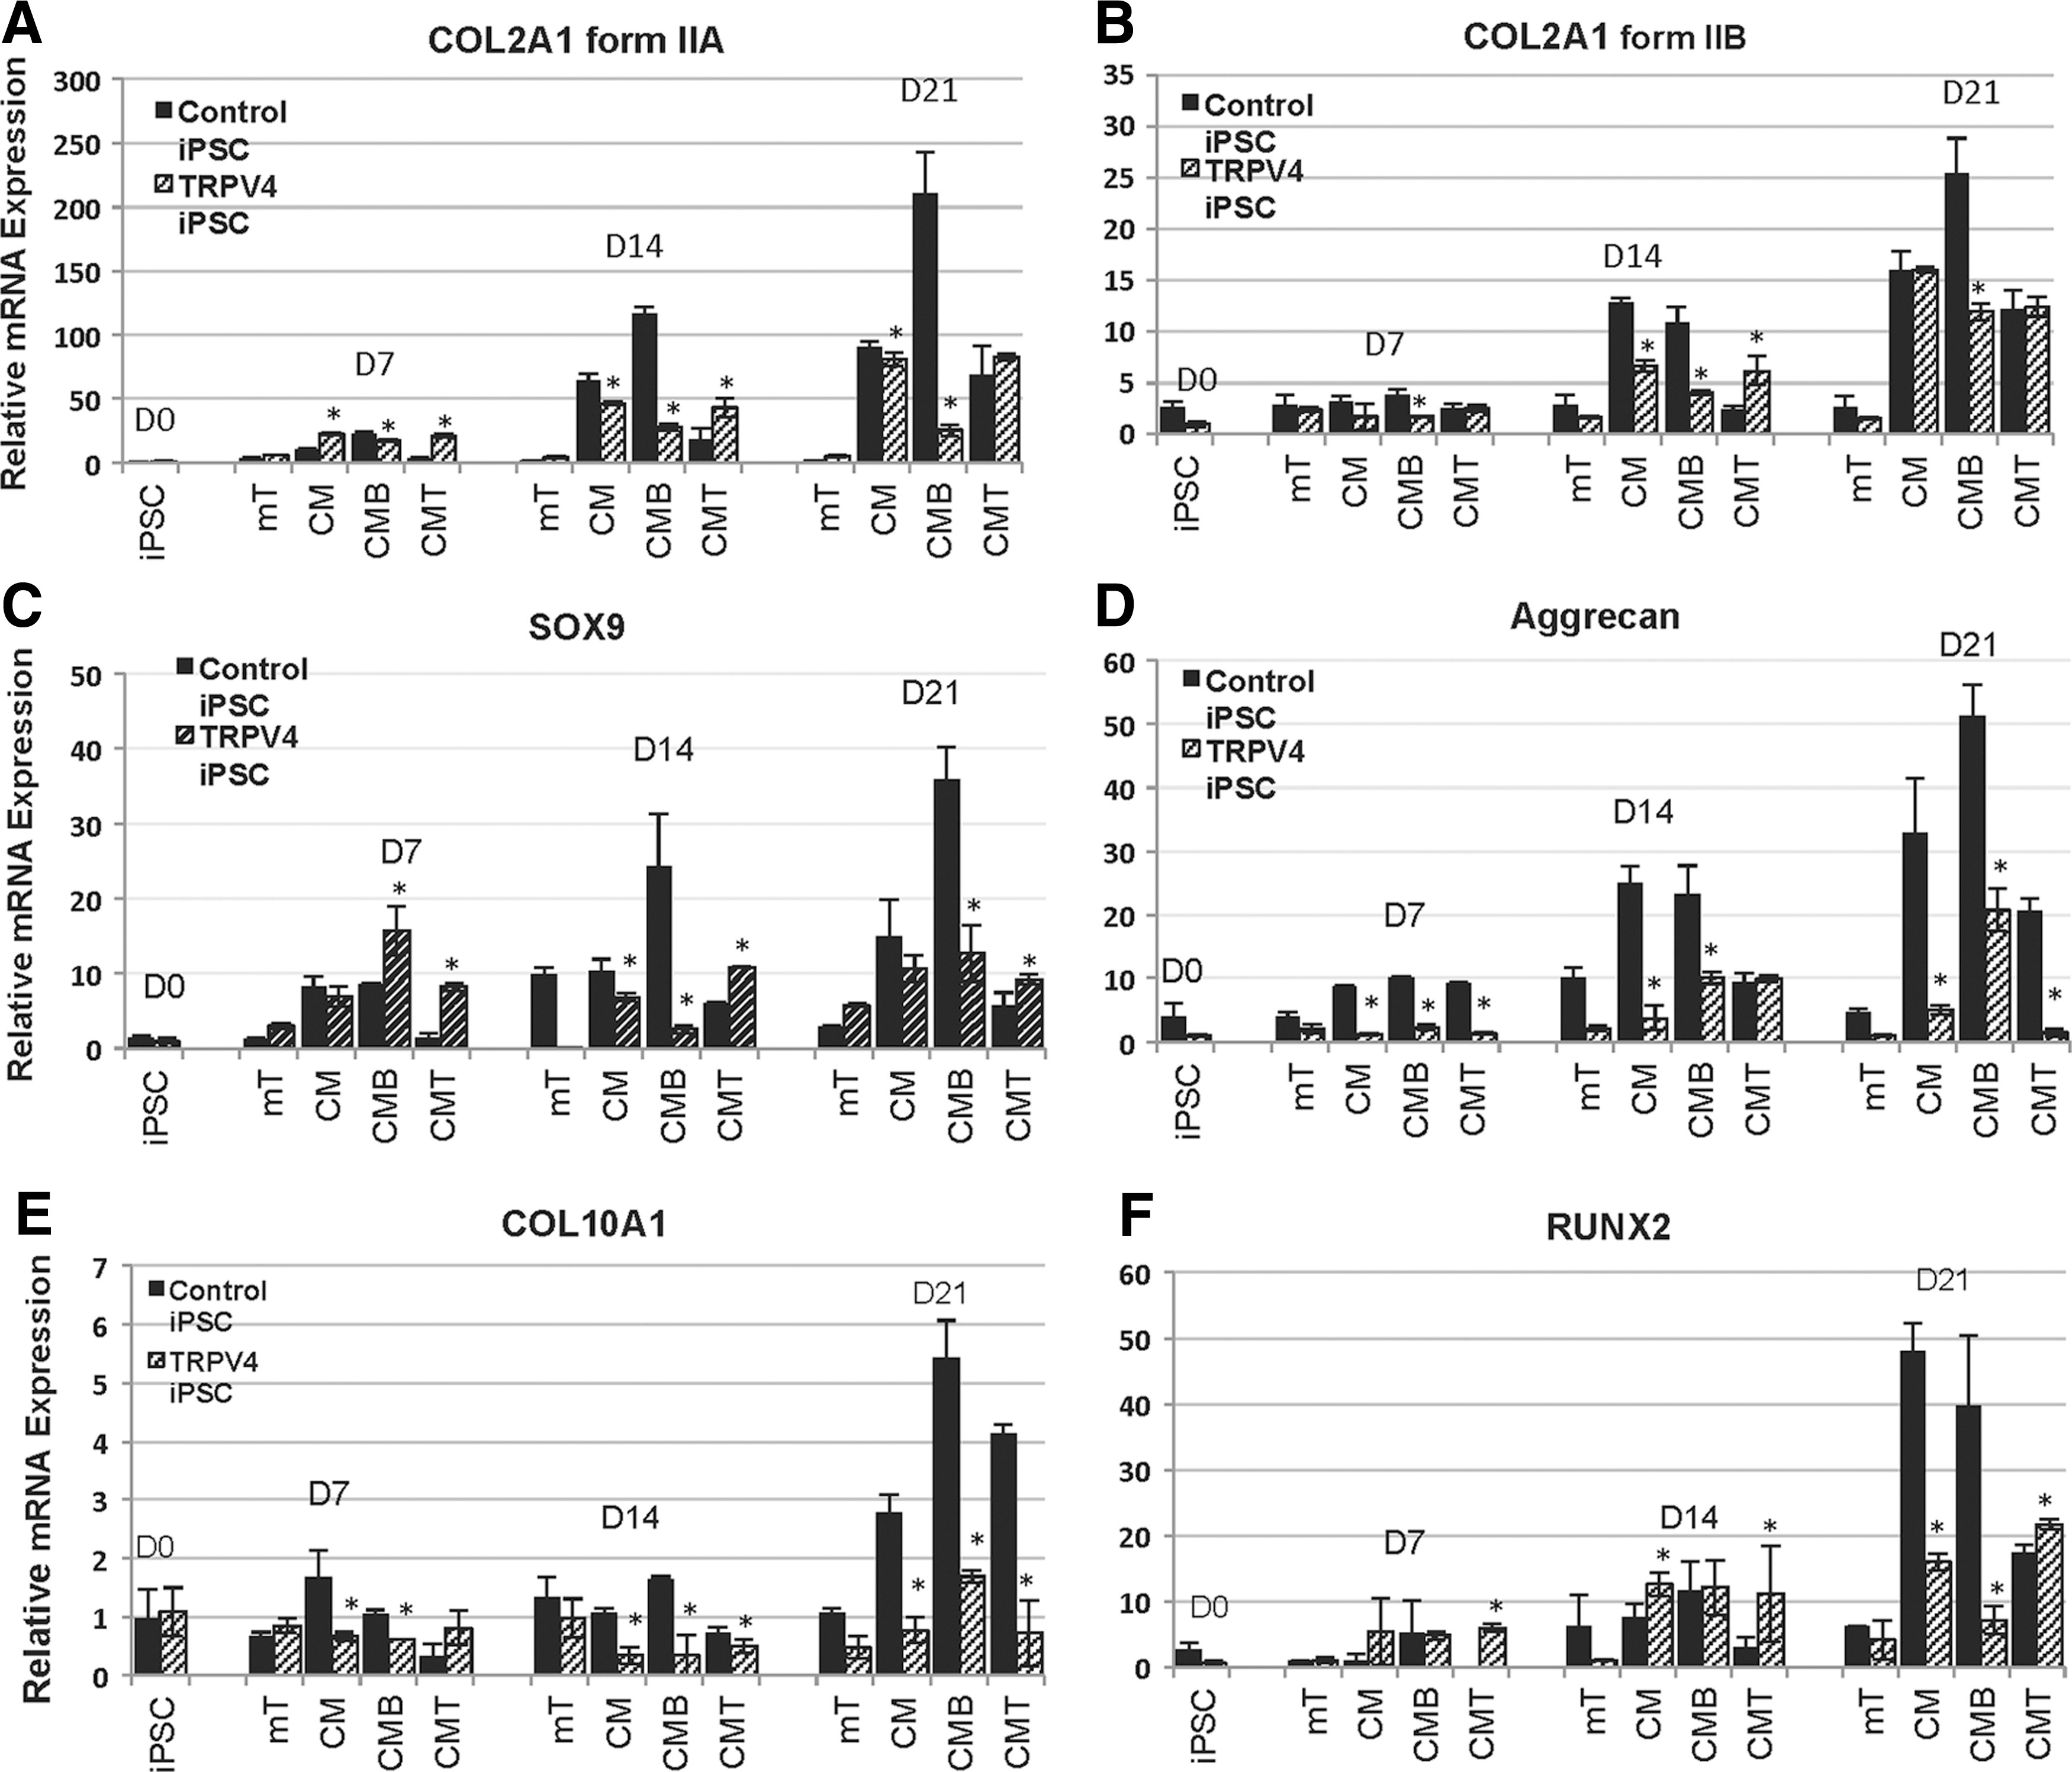
Quantitative real-time polymerase chain reaction of chondrogenic marker mRNA expression at days 7, 14, and 21 in the iPSC micromass culture model. COL2A1 encodes two main alternatively spliced forms (IIA and IIB) of this cartilage-specific extracellular matrix protein, type II collagen. In panel
A statistical analysis of COL2A1 (form IIA and form IIB) expression at each time point and over time, with calculated P values of comparisons between control and TRPV4-iPSCs, was performed and compared only under chondrogenic conditions (CM, CMB, and CMT). Using an unpaired Student t-test and chi square test, we found that COL2A1 IIA has significantly decreased expression in the TRPV4 iPSCs at 7 (P<0.005), 14 (P<0.0001), and 21 (P<0.0005) days, when compared with control iPSCs in CMB conditions. In addition, the IIB form in CMB was significantly (P<0.01) decreased at 7 (P<0.005), 14 (P<0.001), and 21 (P<0.01) days. However, the expression of form IIA at 21 days (in CMT but not in CM or CMB) and IIB (in CM and CMT, but not in CMB) was comparable in control and TRPV4 iPSCs. Since IIA and IIB are expressed at different stages of chondrogenesis [38], it is possible that the CMT and/or CM conditions have similar responses in both normal and mutant iPSCs. In addition, the observed increased (P<0.05) expression in control iPSCs of COL2A1 (IIA and IIB) in CMB, but decreased in CMT, when compared with their respective CM conditions at 7, 14, and 21 days, confirms the opposing effects of BMP2 and TGFβ1 during chondrogenesis as previously observed by others [40].
Together, these results suggest that BMP2 stimulates COL2A1 in control iPSCs, as expected [10,36,38], but acts aberrantly in TRPV4-iPSCs, resulting in the inhibition of COL2A1 expression, rather than stimulation. These findings are of interest as in prechondrogenic tissue, IIA binds BMP2 [36], and BMP signaling is required during condensation in prechondrogenic cells [54,55]. COL2A1 is a cartilage-specific collagen gene that is usually up-regulated by BMP signaling through the transcription factor SOX9, a master regulator of chondrogenesis [56]. SOX9 is required for cartilage formation [32] and for directing hypertrophic maturation of chondrocytes [33]. Here, qPCR of SOX9 shows a significant (P<0.05) increase of approximately 35-fold expression, in control iPSCs at day 21 when grown with BMP2 (CMB); while in the same conditions, no increase was observed in TRPV4-iPSCs (Fig. 3C, CM vs. CMB). At day 7 in CMB, there appears to be higher expression in TRPV4-iPSCs, which may be due to abnormal regulation of its expression. It is possible that the maximum level of expression was reached at this time point and did not significantly increase at the later time points, as instead was seen in control iPSCs at 14 (P<0.05) and 21 (P<0.005) days, compared with their respective CM. This is in agreement with previously reported works showing that TRPV4 regulates the SOX9 pathway, contributing to the normal process of chondrogenesis [9].
Aggrecan, a marker of differentiated chondrocytes [38], shows significantly (P<0.005) greater expression in controls (up to 50-fold in CMB) versus TRPV4-iPSC (up to 20-fold in CMB) over 21 days, with overall higher expression in control iPSCs also at 7 (CM, CMB, and CMT) and 14 days (mT, CM, and CMB), as shown in Fig. 3D. We also found, in TRPV4 compared with control iPSCs, significantly decreased expression at day 7 (P<0.0001) in CM, CMB, and CMT; at day 14 (P<0.005) in CM and CMB; and at day 21 (P<0.005) in CM, CMB, and CMT.
The expression of additional chondrogenic growth plate markers was tested, including COL10A1 (Collagen X) shown in Fig. 3E and the transcription factor RUNX2 seen in Fig. 3F. These last two molecules are specific for the hypertrophic zone of the growth plate [33]. We observed that while COL10A1 and RUNX2 were significantly (P<0.05) up-regulated for approximately 6 (CMB) and 50 (CM) fold in controls at 21 days, respectively, a very modest increase for COL10A1 (<2-fold, CMB) and about 20-fold for RUNX2 (CMT) was seen in TRPV4-iPSCs (Fig. 3E, F). We noted statistically significant changes in COL10A1 at day 7 (P<0.05) in CM and CMB, and at 14 (P<0.05) and 21 (P<0.05) days in CM, CMB, and CMT. Significant changes were noted for RUNX2 at day 21 (P<0.005) in CM and CMB.
These data show that key late markers (COL10A1 and RUNX2) of the cartilage growth plate are not expressed at similar levels in mutant iPSCs compared with controls, potentially impacting chondrocyte maturation [33]. RUNX2 is a late marker of chondrogenesis and, as expected, has low levels of expression at 7 and 14 days of chondrogenic differentiation of the iPSC micromasses. This is the likely reason that there is no difference in the expression between control and TRPV4 iPSCs for this marker at these early time points.
The findings may correlate with the severely reduced hypertrophic zone seen in the cartilage of lethal metatropic dysplasia patients, including the patient used for this study with a I604M mutation [5].
During endochondral ossification, BMP and TGFβ signaling pathways display antagonistic effects on chondrocyte proliferation and differentiation in vivo [40]. We also noted opposing effects of TGFβ1 and BMP2 on chondrogenic marker expression in both control and TRPV4-iPSCs (Fig. 3). Our iPSC model shows that the addition of TGFβ1 (CMT) to control iPSCs resulted in significantly decreased expression of both COL2A1 forms, IIA and IIB, at days 7 and 14 (Fig. 3A, B); of SOX9 at days 7, 14, and 21 (Fig. 3C); and of Aggrecan (Fig. 3D) and RUNX2 (Fig. 3F) at days 14 and 21, when compared with their respective CM time points. However, in the presence of BMP2-supplemented medium (CMB), the earlier chondrogenic markers show up-regulation in control iPSCs (Fig. 3A–D, F). In TRPV4-iPSCs, the addition of TGFβ1 (CMT) at 14 days did not produce a significant change in the level of expression of the earlier chondrogenic markers, while the addition of BMP2 (CMB) resulted in down-regulation of COL2A1 (both forms), SOX9, COL10A1, and RUNX2 (Fig. 3A–C, E, F; CM vs. CMT or CMB). Instead, Aggrecan and COL10A1 at 21 days were up-regulated in CMB, but not in CMT (Fig. 3D, E).
Overall, the qPCR data indicate that the necessary up-regulation of critical chondrogenic molecules, such as SOX9, COL2A1 spliced form IIA, expressed in chondroprogenitor cells, and the hypertrophic marker COL10A1, are impaired in TRPV4-iPSCs at early stages of cartilage development. In addition, altered BMP2 and TGFβ1 signals are present in mutant iPSCs during chondrogenic differentiation in vitro. Finally, our iPSC model confirms that opposing effects of BMP2 and TGFβ1 on the regulation of chondrogenic marker expression are present.
Immunofluorescence and western blot assays confirm an abnormal production of the cartilage protein COL2 and the bone protein COL1 in TRPV4-iPSC micromasses
Next, studies at the protein level were consistent with the qPCR results (Fig. 3), showing that COL2 stains strongly in control iPSCs (Fig. 4A, top panels CM, CMB but not in mT or in CMT). In TRPV4-iPSC micromasses, weak staining was seen in CM and CMT, but no positive staining was seen in mT and CMB (Fig. 4A, bottom panels). We then compared micromass staining with human neonatal control cartilage sections (Fig. 4B, left panels) and with mutant TRPV4 cartilage (Fig. 4B, right panels). Decreased staining for COL2 and decreased cell density (shown by less DAPI staining) was seen in the patient sample compared with control cartilage. DAPI- and COL2-positive cells were counted in triplicate for both control and patient samples. The results showed 62% fewer cells in patient cartilage compared with control cartilage, but the overall ratio of COL2-positive cells was very similar (∼40%).

Immunofluorescence microscopy and western blot analysis of iPSC micromass cultures and human neonatal cartilage for type II collagen (COL2) protein expression. Primary anti-human COL2A1 monoclonal antibody (Ab300, Abcam) with secondary Alexa-Fluor 488 antibody staining (green) is shown in panels
Western blot of culture media collected from the different micromass conditions assessed secreted proteins and showed that the cartilage-specific chondroprogenitor form of COL2, the unprocessed pro-collagen alpha IIA [pro-α1(IIA)] chain, was secreted and detected in both control and TRPV4-iPSCs (Fig. 4C, CM, CMB, and CMT). However, there were weaker bands of pro-α1(IIA), shown at ∼160 kDa, and in its processed form α1(II), of ∼120 kDa, in TRPV4-iPSCs versus those of control iPSCs. In the presence of BMP2 (CMB), the α1(II) processed form of pro-α1(IIA) was almost undetectable, while a strong intense band (also at ∼120 kDa) was seen in controls (CMB), confirming the qPCR data of inhibition of COL2A1-IIA expression in TRPV4-iPSCs and its up-regulation in controls (Fig. 3A, CMB). No COL2A1 bands for pro-α1(IIA), pro-α1(IIB) or their identical processed form α1(II) were seen in mT, as seen at the mRNA level by qPCR (Fig. 3A, C, mT). In addition, no bands were seen for pro-α1(IIB) in either control or TRPV4-iPSCs, probably due to the very low expression of form IIB (Fig. 3C). In contrast, in the culture media from primary human chondrocytes (Ch) used as a control, we detected the unprocessed form pro-α1(IIB), but not pro-α1(IIA), shown at ∼150 kDa and its cleaved form α1(II) at ∼120 kDa (Fig. 4C, Ch), as expected for mature differentiated chondrocytes [36,38,57]. Overall, immunofluorescence staining from micromasses and western blot data using micromass culture media for COL2 confirm at the protein level, the abnormal regulation of COL2A1 expression in TRPV4-iPSCs, seen by qPCR assays. We also found that BMP2 and TGFβ1 signaling, two key regulators of chondrogenesis [39,40], is abnormal in iPSCs derived from the SD TRPV4 patient with lethal metatropic dysplasia (Figs. 3 and 4).
We found that (i) TRPV4-iPSC micromasses showed abnormal Alcian blue staining and for Alizarin red (also present in the cartilage of the TRPV4 patient) when compared with controls (Fig. 2); (ii) the hypertrophic chondrogenic marker COL10A1 and the transcription factor RUNX2, highly expressed during the late stages of chondrogenesis before ossification [37,38] were down-regulated in TRPV4-iPSC clones but not in control lines (Fig. 3); and (iii) COL2 protein secretion was significantly reduced and dysregulated by BMP2 and TGFβ1 in patient-derived iPSCs (Fig. 4). To better understand the significance of these findings, we examined the expression of type I collagen (COL1), the major collagen of bone [58]. COL1 is a heterotrimer molecule formed by two identical α1 chains and one α2 chain [α12(I) α2(I)], with slightly different amino-acid sequences. We found abnormal expression and staining of COL1 in TRPV4-iPSCs and in the neonatal cartilage sections of patient tissue compared with controls, respectively (Fig. 5). Analysis by qPCR of iPSC chondrogenic micromass at day 14 (mT and CM) showed significantly (P<0.05) increased expression of COL1A1 in TRPV4-iPSCs when compared with control iPSCs and also at day 21 in all media tested (Fig. 5A). COL1A1 is a late marker of chondrogenesis; as expected, has low levels of expression at day 14 compared with day 21; and probably is not yet regulated by the addition of BMP2 (CMB) or TGFβ1 (CMT), as we instead observed at 21 days of chondrogenic differentiation of the iPSC micromasses. This is the most likely reason that there is no difference in the expression between control and TRPV4 iPSCs in the earlier conditions for this marker at the 14 day timepoint. Of note, even in nonchondrogenic media (mT), this difference between control and TRPV4 iPSCs was seen at both time points (Fig. 5A, mT).

COL1A1 mRNA and protein expression at days 14 and 21 in the iPSC micromass culture model using qPCR, immunofluorescence microscopy, and western blot analysis of type I collagen (COL1).
Figure 5B compares immunofluorescence staining COL1A1 (green) and nuclei (blue) of the micromasses grown in the various media for 21 days, and stronger staining of this osteogenic marker in all conditions (mT, CM, CMB, and CMT) was observed in the TRPV4-iPSCs compared with the control (Fig. 5B). Figure 5C shows human neonatal cartilage sections stained for COL1A1 (green) and nuclei (blue). The control seen in the upper image shows that COL1A1 staining is confined to the peripheral zone; while in the patient cartilage sections, “islands” of COL1A1 staining are seen. This is consistent with Alizarin red staining for developing bone (Fig. 2D) and further supports the concept that developmental progression of chondrogenesis and osteogenesis is abnormal with a mutation in TRPV4. Figure 5D shows western blot data of secreted protein from the iPSC micromass culture media at day 21. The antibody detects the secreted and assembled monomer of the COL1 heterotrimer native protein. The monomer of COL1 with both chains at ∼350 kDa is detected in nondenaturing conditions (as described in Material and Methods), using the same antibody employed for the immunofluorescence (Fig. 5B, C), and stronger bands were noted in TRPV4-iPSCs media compared with the control. These findings are in agreement with the significantly increased expression of COL1A1 (Fig. 5A) and increased staining for COL1 observed in TRPV4-iPSCs (Fig. 5B, bottom panel) compared with the control (Fig. 5B, top panel).
Discussion
The iPSC technique reprograms differentiated cells (fibroblasts and others) to a pluripotent state for induction toward a chosen tissue [59]. This enables recapitulation of the biochemical and molecular pathways of that tissue at early developmental stages to model human disease in the culture dish [17,60]. We developed an iPSC model that is capable of recapitulating developmental markers of chondrogenesis from the early steps of mesenchymal cell condensation and confirmed the data at the mRNA and protein levels. The BMP2 and TGFβ1 signaling pathways appear to be recapitulated in the control iPSCs but show abnormal signaling in the patient-derived iPSCs. We compared the actual patient's cartilage and control to validate our findings in the chondrogenic-induced iPSC micromasses derived from this same patient's fibroblasts. We found that the patient cartilage showed irregular Alcian blue and Alizarin red staining compared with the control cartilage. This finding supports the abnormal staining observed in the chondrogenic micromasses of the mutated iPSC lines.
Specifically, we studied the effects of a mutation (I604M) causing lethal metatropic dysplasia, the most severe known phenotype of TRPV4 mutations. Published data do not demonstrate a strict genotype:phenotype correlation in SD-TRPV4 disorders [5,6], raising the question of why some mutations are lethal while others are not. Earlier studies showed that both lethal and nonlethal mutations constitutively activate the TRPV4 calcium channel, suggesting that increased calcium influx affects normal cartilage formation but they were unable to quantitatively correlate them to disease severity [3 –5]. However, a recent report suggests a strong correlation between increased basal activity and severity of SD caused by TRPV4 mutations [12]. These opposing findings could be explained by the use of different cellular models and/or their limitations in studying TRPV4 activity, as they are transfection models resulting in overexpressed homotetrameric mutant channels [3 –7,12]. Instead, the chondrogenic iPSC model enables us to study the natural heterozygous state of the mutation, where the majority of channels likely reflect a composite of normal and mutant chains [13,61]. This approach provides a true genetic model of this disorder and the opportunity to discern the effects of a heterozygous mutation during chondrogenic differentiation.
To verify that early stages of chondrogenesis were represented in our model, we used qPCR to examine the differentially spliced form IIA of COL2, a cartilage-specific protein, expressed during vertebral development in distinct cells surrounding the cartilage [53], and deposited in the extracellular matrix of prechondrogenic tissue [36]. Our data indicate that the necessary up-regulation of this important marker of chondrogenesis is impaired in the TRPV4 mutant. Recently characterized homozygous Col2a1 +ex2 knock-in mice, where the IIA form is exclusively expressed, showed that cartilage tissue assembled into thin-banded fibrils [57], indicating that functional cartilage can be formed with only the IIA form of COL2 [62]. In addition, the relatively higher expression of IIA compared with IIB suggests that early, rather than late, stages of chondrogenesis are represented in our iPSC model during this time frame in culture.
The long bones of the limbs, vertebrae, and ribs develop through endochondral ossification [63], where prechondrogenic mesenchyme condensation triggers the steps of chondrogenic differentiation, forms cartilage [38,56], and is affected in SDs [1]. In vitro and in vivo studies have shown that BMP signaling plays a central role in the formation of precartilaginous condensations and in the differentiation of chondroprogenitors into chondrocytes [64]. Studies of conditional knockout mice showed that BMP2, but not BMP4, was critical for chondrocyte proliferation and maturation during endochondral development [65]. The mice exhibited extensive disorganization of chondrocytes within the growth plate and defects in chondrocyte proliferation, resulting in a severe chondrodysplasia phenotype. In addition, very recently, it was shown that TRPV4 expression is under the control of BMP2 during osteoblast differentiation of primary osteoblast-enriched cell cultures [66], and that bone marrow- and adipose-derived mesenchymal stem cells from Trpv4-deficient mice have an altered adipogenic, osteogenic, and chondrogenic differentiation potential [67].
When we examined BMP2 in our system, we found distinct differences in the response to BMP2 stimulation. Control iPSCs treated with BMP2 showed a significant increase of form IIA of COL2, as well as form IIB at 21 days, while the mutant TRPV4-iPSCs showed down-regulation. Overall, BMP2 is expected to show a stimulatory effect on COL2A1 expression [10,36,39] that was seen in control iPSCs, but an inhibitory outcome was reproduced in our TRPV4-iPSCs. These findings are of interest as in prechondrogenic tissue, IIA binds BMP2 [36]. BMP2 in normal human iPSCs and in iPSC-derived mesenchymal stem cells was shown to promote chondrogenic differentiation by the enrichment of COL2A1 [31], consistent with our data. Further, BMP signaling in prechondrogenic cells and in growth plate chondrocytes stimulates SOX9, COL2A1, and COL10A1, molecules that are progressively associated with chondrogenic differentiation and maturation toward hypertrophic chondrocytes [37,56].
We found that mutant iPSCs treated with BMP2 lack increased expression of SOX9, COL2A1, COL10A1, and RUNX2 over time. This increase was observed in control iPSCs, suggesting that an aberrant BMP2 signal could be related to abnormal chondrogenesis. SOX9, in particular, is considered a master regulator of chondrogenesis and directly stimulates COL10 expression in maturing chondrocytes [32,33]. In vitro studies of mouse mesenchymal cells transiently transfected with normal mouse TRPV4 cDNA showed increased levels of SOX9-dependent reporter activity, and increased steady-state levels of SOX9 mRNA [9]. The authors concluded that TRPV4 regulates the SOX9 pathway, contributing to the process of chondrogenesis. Their data validate, to some extent, our TRPV4-iPSC model as no increased expression of SOX9 was observed over time in the mutant, as was seen in control iPSCs. However, since no mutant TRPV4 cDNA was used in the published mouse study, our results cannot be fully compared with their findings. When we tested COL10A1 and the transcription factor RUNX2, both of which were specific for the hypertrophic zone [33], and late-stage markers, we observed that both were significantly increased in controls but not in TRPV4-iPSCs at the later days in culture, suggesting failure of the mutant iPSCs to progress through these later stages of growth plate development.
Studies show that during endochondral ossification, BMP and TGFβ signaling pathways can have antagonistic effects on chondrocyte proliferation and differentiation in vivo and on prechondrogenic condensation in vitro, showing that TGFβ signaling can inhibit chondrocyte proliferation and differentiation of proliferating chondrocytes to hypertrophic chondrocytes, while BMP2 has opposite effects [40]. We also found that while TGFβ1 in control iPSCs resulted in decreased expression of COL2A1 IIA and IIB, SOX9, Aggrecan, and RUNX2 in TRPV4-iPSCs, the addition of TGFβ1 did not produce a significant change. We also confirmed this at the protein level for COL2, showing that BMP2 and TGFβ1 have opposing effects on key cartilage and bone marker expression during early stages of in vitro chondrogenesis. Of note, the addition of BMP2 led to almost undetectable COL2 secretion in TRPV4-iPSCs, while the TGFβ1 treated micromasses were unaffected. Taken together, these results indicate that the patient-derived iPSC model appropriately recapitulates multiple sequential molecular markers of human growth plate development.
To further explore the abnormal mineralization detected by Alizarin red, we studied expression of type I collagen, the major structural matrix protein of bone [58]. Interestingly collagen I (COL1A1), an osteogenic marker restricted to the perichondrium when the process of endochondral ossification is advanced [63], showed significantly higher expression in TRPV4-iPSCs compared with the control at 14 and 21 days with or without the addition of growth factors. In addition, COL1A1 was the only marker increased in the presence of BMP2 at 21 days in the disease iPSC model; while all the others (COL2A1, SOX9, Aggrecan, COL10A1, and RUNX2) were at significantly lower levels compared with control iPSCs. Together, the mRNA expression data correlate with the western and immunofluorescence data from the micromasses showing aberrantly increased COL1 expression and an abnormally decreased response of COL2 to BMP2 under chondrogenic induction in the TRPV4-iPSCs.
In summary, our data suggest that TRPV4 mutation causing lethal metatropic dysplasia disrupts the normal sequence of differentiation which occurs during endochondral bone formation, showing inappropriate expression of COL1, a marker typical of late stages of chondrogenesis with very low expression of the earlier markers of growth plate formation [38]. For example, SOX9, a crucial regulator of chondrogenesis that controls COL2 expression, directs the maturation of hypertrophic chondrocytes and blocks osteoblast differentiation of the growth plate [33], was inadequately expressed in the mutant iPSCs. It is possible that the abnormally high COL1 expression in TRPV4-IPSCs reflects premature initiation of bone differentiation, precluding normal growth plate and chondrocyte development. This hypothesis would correlate with the shortened and immature growth plates seen in this disorder [5], but requires further directed investigation.
This work describes the first development of an iPSC chondrogenic model of SD, an in vitro demonstration that abnormal processes can be investigated at the molecular level. A major limitation in the field of cartilage biology is the availability of primary cultured cells that maintain a chondrogenic phenotype during expansion. Our novel approach reflects the disease state in the appropriate developing cell type and enables analysis of critical chondrogenic regulators across a phenotypic spectrum of this disorder, laying the foundation for targeted therapies. The advancement of a human “disease in a dish” model system reflects a major improvement in the field and creates a novel paradigm to answer key questions in cartilage development and disease.
Footnotes
Acknowledgments
This study was supported in part by funds from the Medical Genetics Institute and the Regenerative Medicine Institute at the Cedars-Sinai Medical Center, the Broad Stem Cell Research Center, the Orthopedic Institute for Children and the Orthopedic Hospital Research Center at UCLA, the ISDR, grants from the National Institutes of Health (DE019567 and AR062651 to D.H.C.), and the National Center for Advancing Translational Sciences, grant UL1TR000124. The content is solely the responsibility of the authors and does not necessarily represent the official views of the NIH. The authors also wish to thank the iPSC core for their assistance in generating the TRPV4-iPSCs, the Cedars-Sinai Genomics Core and Cytogenetics Core for the qPCR and the fluorescence microscopy, respectively, and Lisette Nevarez at UCLA for sequencing the iPSC clones. The authors would like to thank William Wilcox and Michael Weinstein for helpful discussions and Sulagna C. Saitta for a critical reading of this article.
Author Disclosure Statement
The authors declare no conflict of interest. No competing financial interests exist.
References
Supplementary Material
Please find the following supplemental material available below.
For Open Access articles published under a Creative Commons License, all supplemental material carries the same license as the article it is associated with.
For non-Open Access articles published, all supplemental material carries a non-exclusive license, and permission requests for re-use of supplemental material or any part of supplemental material shall be sent directly to the copyright owner as specified in the copyright notice associated with the article.