
Abstract
Recent research has demonstrated critical roles of a number of microRNAs (miRNAs) in stem cell proliferation and differentiation. miRNA-9 (miR-9) is a brain-enriched miRNA. Whether miR-9 has a role in retinal progenitor cell (RPC) proliferation and differentiation remains unknown. In this study, we show that miR-9 plays an important role in RPC fate determination. The expression of miR-9 was inversely correlated with that of the nuclear receptor TLX, which is an essential regulator of neural stem cell self-renewal. Overexpression of miR-9 downregulated the TLX levels in RPCs, leading to reduced RPC proliferation and increased neuronal and glial differentiation, and the effect of miR-9 overexpression on RPC proliferation and differentiation was inhibited by the TLX overexpression; knockdown of miR-9 resulted in increased TLX expression as well as enhanced proliferation of RPCs. Furthermore, inhibition of endogenous TLX by small interfering RNA suppressed RPC proliferation and promoted RPCs to differentiate into retinal neuronal and glial cells. These results suggest that miR-9 and TLX form a feedback regulatory loop to coordinate the proliferation and differentiation of retinal progenitors.
Introduction
R
An accumulating body of evidence has revealed that both transcriptional and posttranscriptional regulation is important for regulating stem cell proliferation and differentiation [4 –6]. microRNAs (miRNAs) are a class of naturally occurring, small, noncoding RNAs that regulate protein-coding mRNAs by causing mRNA degradation or repressing translation [7]. miRNAs have emerged as potentially key regulators in diverse biological processes, including development, proliferation, differentiation, apoptosis, and cancer pathogenesis [8,9]. Distinct sets of miRNAs have been found to be specifically expressed in tissue-specific cells [10 –12]. Several brain-specific miRNAs have also been identified. Among them, miRNA-9 (miR-9) is expressed specifically in the neurogenic regions of the brain and serves as an important regulator in neural stem cell fate determination [13,14]. The retina is a part of the central nervous system and miR-9 is indicated to play an important role in the development of retinal progenitors [15], but whether miR-9 plays a role in RPC proliferation and differentiation in vitro is still unknown.
TLX, one of miR-9's targets, belongs to a member of orphan nuclear receptors that are involved in many aspects of neural development in the central nervous system. It is expressed in the neurogenic areas of the brain and is an essential regulator involved in maintaining the undifferentiated and self-renewable cell state of neural stem cells [14,16]. TLX is highly expressed in neural stem cells, but is repressed upon differentiation [17]; it is also expressed in retinal progenitors and is required for the generation of appropriate numbers of retinal neuronal progenies [18]. However, how TLX contributes to the regulation of the proliferation and differentiation of RPCs also remains unknown.
In this study, we investigate the reciprocal actions of miR-9 and TLX in the proliferation and differentiation of RPCs and find that miR-9 was expressed at low levels in undifferentiated RPCs, but its expression level increased upon differentiation, whereas the expression levels of TLX were downregulated gradually during differentiation. Increased expression of miR-9 downregulated the level of TLX in RPCs, leading to reduced RPC proliferation and increased neuronal and glial differentiation, whereas the inhibition of miR-9 resulted in upregulated TLX expression as well as enhanced RPC proliferation. Moreover, inhibition of TLX led to increased miR-9 expression and enhanced RPC differentiation. This study suggests that miR-9 and TLX serve as important regulators that govern the proliferation and differentiation of RPCs.
Materials and Methods
Isolation and culture of RPCs
RPCs were derived from the fresh retinal tissue of postnatal day 1 GFP transgenic C57BL/6 mice (a gift from Dr. Masaru Okabe, University of Osaka, Japan) and then plated in T25 flasks in a standard medium (SM), which consisted of advanced DMEM/F12 (Invitrogen), 1% N2 neural supplement (Invitrogen), 2 mM
Differentiation of RPCs in vitro
RPCs were seeded into T25 flasks for 7 days. EGF in the SM was removed and replaced with 10% fetal bovine serum (Invitrogen). The differentiation media were changed every 2 days. The cells were collected for protein and total RNA extraction at the indicated time points.
Transfection
miR-9 oligonucleotides [pre-miR-9 (a microRNA-9 precursor molecule, whose structure is similar to intracellular miR-9 precursor, but with chemical modification and optimization. It could be processed into mature miRNA by mimicking miR-9 natural shearing process), anti-miR-9 and negative control], small interfering RNAs (siTLX and negative control) were synthesized by Biomics Biotech Co., Ltd. and Myc-DDK-tagged ORF cDNA clone of TLX were synthesized by OriGene Technologies, Inc. For transient transfections, pre-miR-9, anti-miR-9, siTLX or cDNA clone of TLX were mixed with the Lipofectamine 2000 reagent (Invitrogen) in Opti-MEM medium, and the mixture was directly added to cells in six-well plates at 70%–90% confluence, normally 2 days later. For long-term detection under differentiation culture conditions, miR-9 oligonucleotides, small interfering RNAs or cDNA clone were retransfected 3 days later. The cells were harvested 48 h after transfection for total protein or RNA extraction. The oligonucleotide sequence of siTLX was as follows: 5′-GAGGAGCAUUCGAAGGAAUTT-3′.
Immunocytochemistry
RPCs were grown on glass coverslips (VWR) coated with laminin (Sigma-Aldrich) in 12-well plates. Following transfection with pre-miR-9, anti-miR-9, siTLX or TLX clone, cells were fixed with 4% paraformaldehyde (Sigma-Aldrich), permeabilized with 0.3% Triton X-100 (Sigma-Aldrich) in phosphate-buffered saline, and blocked with 10% normal goat serum (Invitrogen) [20]. Then, the cells were subjected to immunofluorescent staining using rabbit polyclonal anti-TLX antibody (Santa Cruz Biotechnology; 1:50), mouse monoclonal anti-nestin (BD; 1:200), mouse monoclonal anti-Ki-67 (BD; 1:200), rabbit monoclonal anti-microtubule-associated protein-2 (MAP-2) (Epitomics; 1:200), mouse monoclonal anti-protein kinase C alpha (PKC-α) (BD; 1:200), mouse monoclonal anti-rhodopsin (Chemicon; 1:100) or mouse monoclonal anti-glial fibrillary acidic protein (GFAP) (Chemicon; 1:200). Fluorescent-labeled secondary antibodies (Alexa Fluor546-goat anti-mouse/rabbit, BD; 1:800) were used. After washing, cell nuclei were counterstained with 4′,6-diamidino-2-phenylindole (DAPI; Invitrogen, Molecular Probes). Negative control samples were processed in parallel, but without the primary antibody. Immunoreactive cells were visualized and images recorded using a fluorescent microscope (Olympus BX51). The percentage of positive cells was determined by dividing the number of immunopositive cells by the number of nuclei stained with DAPI. The data were collected by the Image-Pro Plus 6.0 (Media Cybernetics), which is an automated software for counting. Five hundred to one thousand cells for each RPC culture were counted in random fields.
Western blot analysis
The cells were harvested at the indicated time points, and total proteins were extracted and their concentrations were determined using a BCA Kit (Pierce) according to the manufacturer's protocol. Proteins were separated by sodium dodecyl sulfate–polyacrylamide gel electrophoresis and then transferred onto polyvinylidene fluoride membranes (Millipore). After blocking with 5% nonfat milk, the membranes were incubated with rabbit polyclonal anti-TLX (Santa Cruz Biotechnology; 1:200), mouse monoclonal anti-nestin (BD; 1:500), mouse monoclonal anti-Ki-67 (Abcam; 1:1,000), mouse anti-β-actin (Sigma; 1:1,000) or rabbit anti-β-actin (Sigma; 1:1,000) at 37°C for 2 h, followed by incubation with horseradish peroxidase-conjugated secondary antibodies (1:5,000; Sigma). Protein expression images were visualized using the Odyssey V 3.0 image scanning (LI-COR). Semi-quantification of the protein concentrations was determined on the basis of three independently performed experiments. The densitometric intensities of the protein bands were quantified using the Bandscan 5.0 software, and the values were normalized against β-actin for each sample.
Total RNA isolation and quality controls
Total RNA was extracted from the cultured cells with Trizol (Invitrogen) according to the manufacturer's instructions. DNaseI was used to avoid genomic DNA contamination. The concentration and purity of the total RNA were determined spectrophotometrically at OD260 nm and OD280 nm. The samples with OD260/280 nm ratios between 1.9 and 2.1 were used for cDNA synthesis.
Reverse transcription and quantitative polymerase chain reaction
One microgram of total RNA was reverse transcribed into cDNA in a final reaction volume of 10 μL using the PrimeScript™ RT reagent kit (Perfect Real Time; TaKaRa) or the miRcute miRNA first-strand cDNA synthesis kit (Tiangen Biotech Co., Ltd.). The resulting cDNAs were diluted 20-fold in nuclease-free water (Invitrogen) and used as templates for quantitative polymerase chain reaction (qPCR). qPCR was carried out in a 20 μL solution containing 10 μL of 2×SYBR Premix EX Taq™ (TaKaRa) or 10 μL of 2×miRcute miRNA premix (Tiangen Biotech Co.), 2 μL of cDNA, 300 nM of gene-specific primers, including TLX (forward primer: 5′-cgattagacgccactgaa-3′, reverse primer: 5′-ggtatctggtatgaatgtagc-3′), forkhead box protein G1 (FOXG1) (forward primer: 5′-ttcagctacaacgcgctcat-3′, reverse primer: 5′-agcacttgttgagggacagg-3′), nuclear factor-kappa B1 (NF-κB1) (forward primer: 5′-actggaagcacggatgacag-3′, reverse primer: 5′-atctccttggtctgctgcac-3′), Nestin (forward primer: 5′-aactggcacctcaagatgt-3′, reverse primer: 5′-tcaagggtattaggcaagggg-3′), Ki-67 (forward primer: 5′-cagtactcggaatgcagcaa-3′, reverse primer: 5′-cagtcttcaggggctctgtc-3′), paired box 6 (PAX6) (forward primer: 5′-agagaagacaggccagcaac-3′, reverse primer: 5′-aaggaggagacaggtgtggt-3′), MAP-2 (forward primer: 5′-agaaaatggaagaaggaatgactg-3′, reverse primer: 5′-acatggatcatctggtaccttttt-3′), PKC-α (forward primer: 5′-cccattccagaaggagatga-3′, reverse primer: 5′-ttcctgtcagcaagcatcac-3′), Rhodopsin (forward primer: 5′-tcaccaccaccctctacaca-3′, reverse primer: 5′-tgatccaggtgaagaccaca-3′), Brn3a (forward primer: 5′-cgctctcgcacaacaacatga-3′, reverse primer: 5′-ttcttctcgccgccgttga-3′), GFAP (forward primer: 5′-agaaaaccgcatcaccattc-3′, reverse primer: 5′-tcacatcaccacgtccttgt-3′), and β-actin (forward primer: 5′-agccatgtacgtagccatcc-3′, reverse primer: 5′-ctctcagctgtggtggtgaa-3′). qPCR was conducted using a 7500 Real-Time PCR Detection System (Applied Biosystems). The PCR efficiency of the reaction was measured with primers by using serial dilutions of the cDNA (1:1, 1:5, 1:25, 1:125, 1:625, and 1:3,125). Each sample was tested in triplicate. The relative mRNA or miRNA expressions were analyzed using the Pfaffl method [21]. Data are expressed as fold change relative to untreated controls, after normalizing to the expression of β-actin or 5S, respectively.
Cell viability
RPC proliferation capacity was evaluated using the cell counting kit (CCK8; Dojindo) [22]. In general, the cells treated with pre-miR-9, anti-miR-9, negative controls, TLX clone, or siTLX, respectively were suspended at a final concentration of 1×10⁴ cells/well and cultured in 96-well plates. After that, CCK8 solution was added to each well at days 0, 1, 2, and 3 of the culture period. The plates were incubated for another 4 h at 37°C. The absorbance at 450 nm was measured using an ELISA microplate reader (ELX800; BioTeK). Cell viability was directly proportional to the absorbance at 450 nm; therefore, the viability was expressed as the A450 value [23].
Statistical analyses
The experimental statistics presented in this study are expressed as the mean±the standard derivation. Each experiment was performed at least three times, unless otherwise specified. Statistical analyses were performed using Student's t-test, and the difference was considered significant when the value of P≤0.05.
Results
The expression levels of miR-9 and its target genes in RPC cultures
To investigate whether miR-9 and its targets, including TLX, FoxG1, and NF-κB1, are expressed in RPCs and their differentiated progenies, qPCR analysis was performed. Our data revealed that the expression of miR-9 was upregulated gradually over time during differentiation (Fig. 1A). Meanwhile, the expression of TLX was downregulated over time under differentiation conditions (Fig. 1B). This conclusion is consistent with the western blot results, which demonstrated that the protein levels of TLX decreased during the duration of RPC differentiation (Fig. 1E, F), while neither FoxG1 nor NF-κB1 expression levels showed obvious changes during RPC differentiation (Fig. 1C, D). Moreover, the proliferation marker Ki-67 gradually reduced, in contrast, the differentiation marker MAP-2 significantly increased during the differentiation of RPCs (Fig. 1G, H), suggesting that the differentiation process is working. These results indicate that miR-9 and TLX, but not FoxG1 and NF-κB1, may play an important role in RPC differentiation.
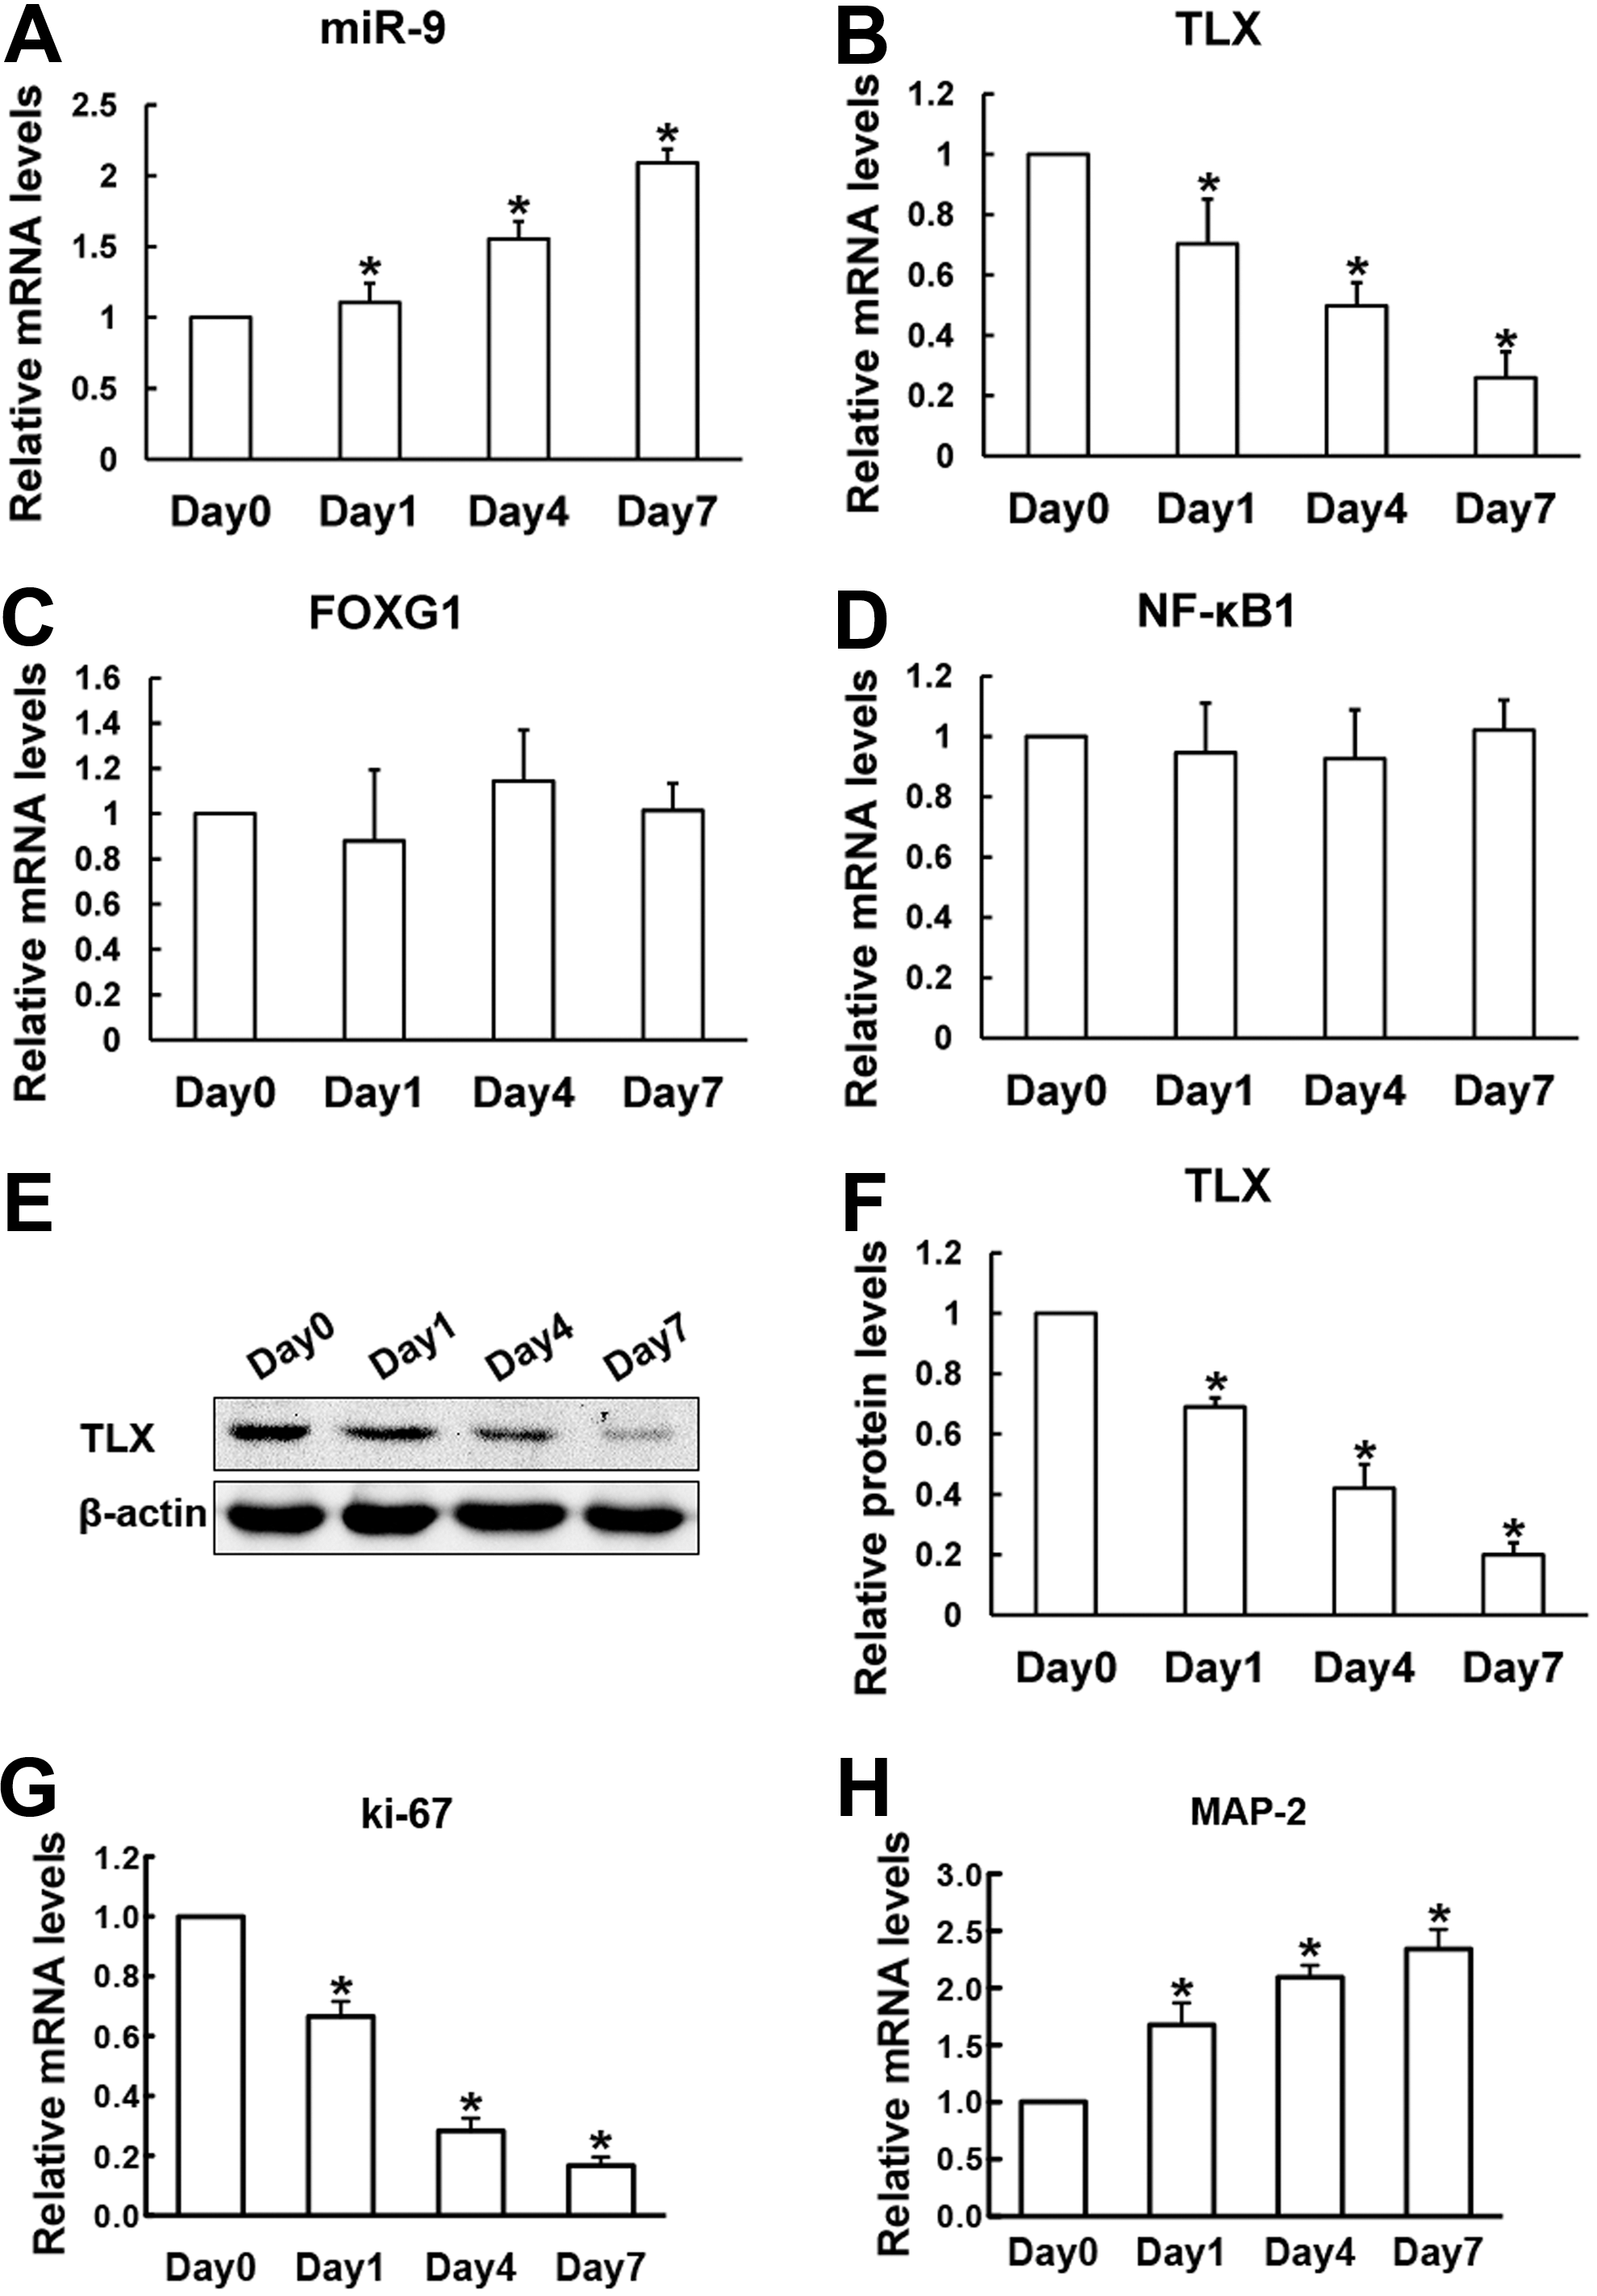
The expression of miR-9 and its target genes in RPC cultures during differentiation on a 7-day course. The expression level of miR-9 in RPCs increased
The effect of miR-9 on TLX expression in RPC cultures
The expression level of miR-9 in RPCs treated with pre-miR-9 or anti-miR-9 was monitored by qPCR. The expression level of miR-9 was elevated ∼40-fold in RPC cultures exposed to pre-miR-9 treatment (Fig. 2A) and reduced more than 90% in RPCs exposed to anti-miR-9 treatment when compared with those in the control cells (Fig. 2B). The expression level of TLX was downregulated in pre-miR-9-treated RPCs (Fig. 2C), whereas the level was increased in anti-miR-9-treated RPC cultures (Fig. 2D), which is consistent with the immunostaining results (Fig. 2E–H). These data were further supported by western blot analysis, which revealed that the expression of TLX was obviously repressed in pre-miR-9-treated RPC cultures, while the expression increased ∼1.5-fold in the RPC cultures treated with anti-miR-9 (Fig. 2I, J). However, there is no obvious effect on the expression level of FoxG1 or NF-κB1 in RPC cultures with miR-9 expression regulation (Fig. 2C, D). These data suggest that miR-9 negatively regulates TLX expression in RPC cultures.

Effects of overexpression or inhibition of miR-9 on TLX expression in RPC cultures. The expression of miR-9, in RPCs transfected with pre-miR-9 or anti-miR-9, was assayed by qPCR. The expression level of miR-9 was sharply upregulated in RPC cultures with pre-miR-9 transfection and significantly downregulated in RPCs with anti-miR-9 transfection compared with the controls
The effect of miR-9 on RPC proliferation
To elevate the effect of miR-9 on RPC proliferation in vitro, RPCs treated with pre-miR-9 or anti-miR-9 were cultured for 4 days under proliferation conditions before the cells were used for immunostaining, western blotting, and qPCR analysis. The immunostaining results revealed that the positive percentages of retinal progenitor marker nestin (Fig. 3A–C) and cell proliferation marker Ki-67 (Fig. 3D–F) in pre-miR-9-treated RPCs were lower than those in the control cells (75.8%±4.9% vs. 83.0%±5.0% and 32.9%±7.0% vs. 44.0%±4.0%, respectively) (Fig. 3G). The protein levels of nestin and Ki-67 were found to be repressed by 39.8% and 33% in the RPC cultures with pre-miR-9 treatment by western blot analysis (Fig. 3H, I). qPCR data showed that the expression levels of nestin, PAX6 (a marker for retinal progenitors), and Ki-67 also decreased in the pre-miR-9-treated RPC cultures (Fig. 3J–L).
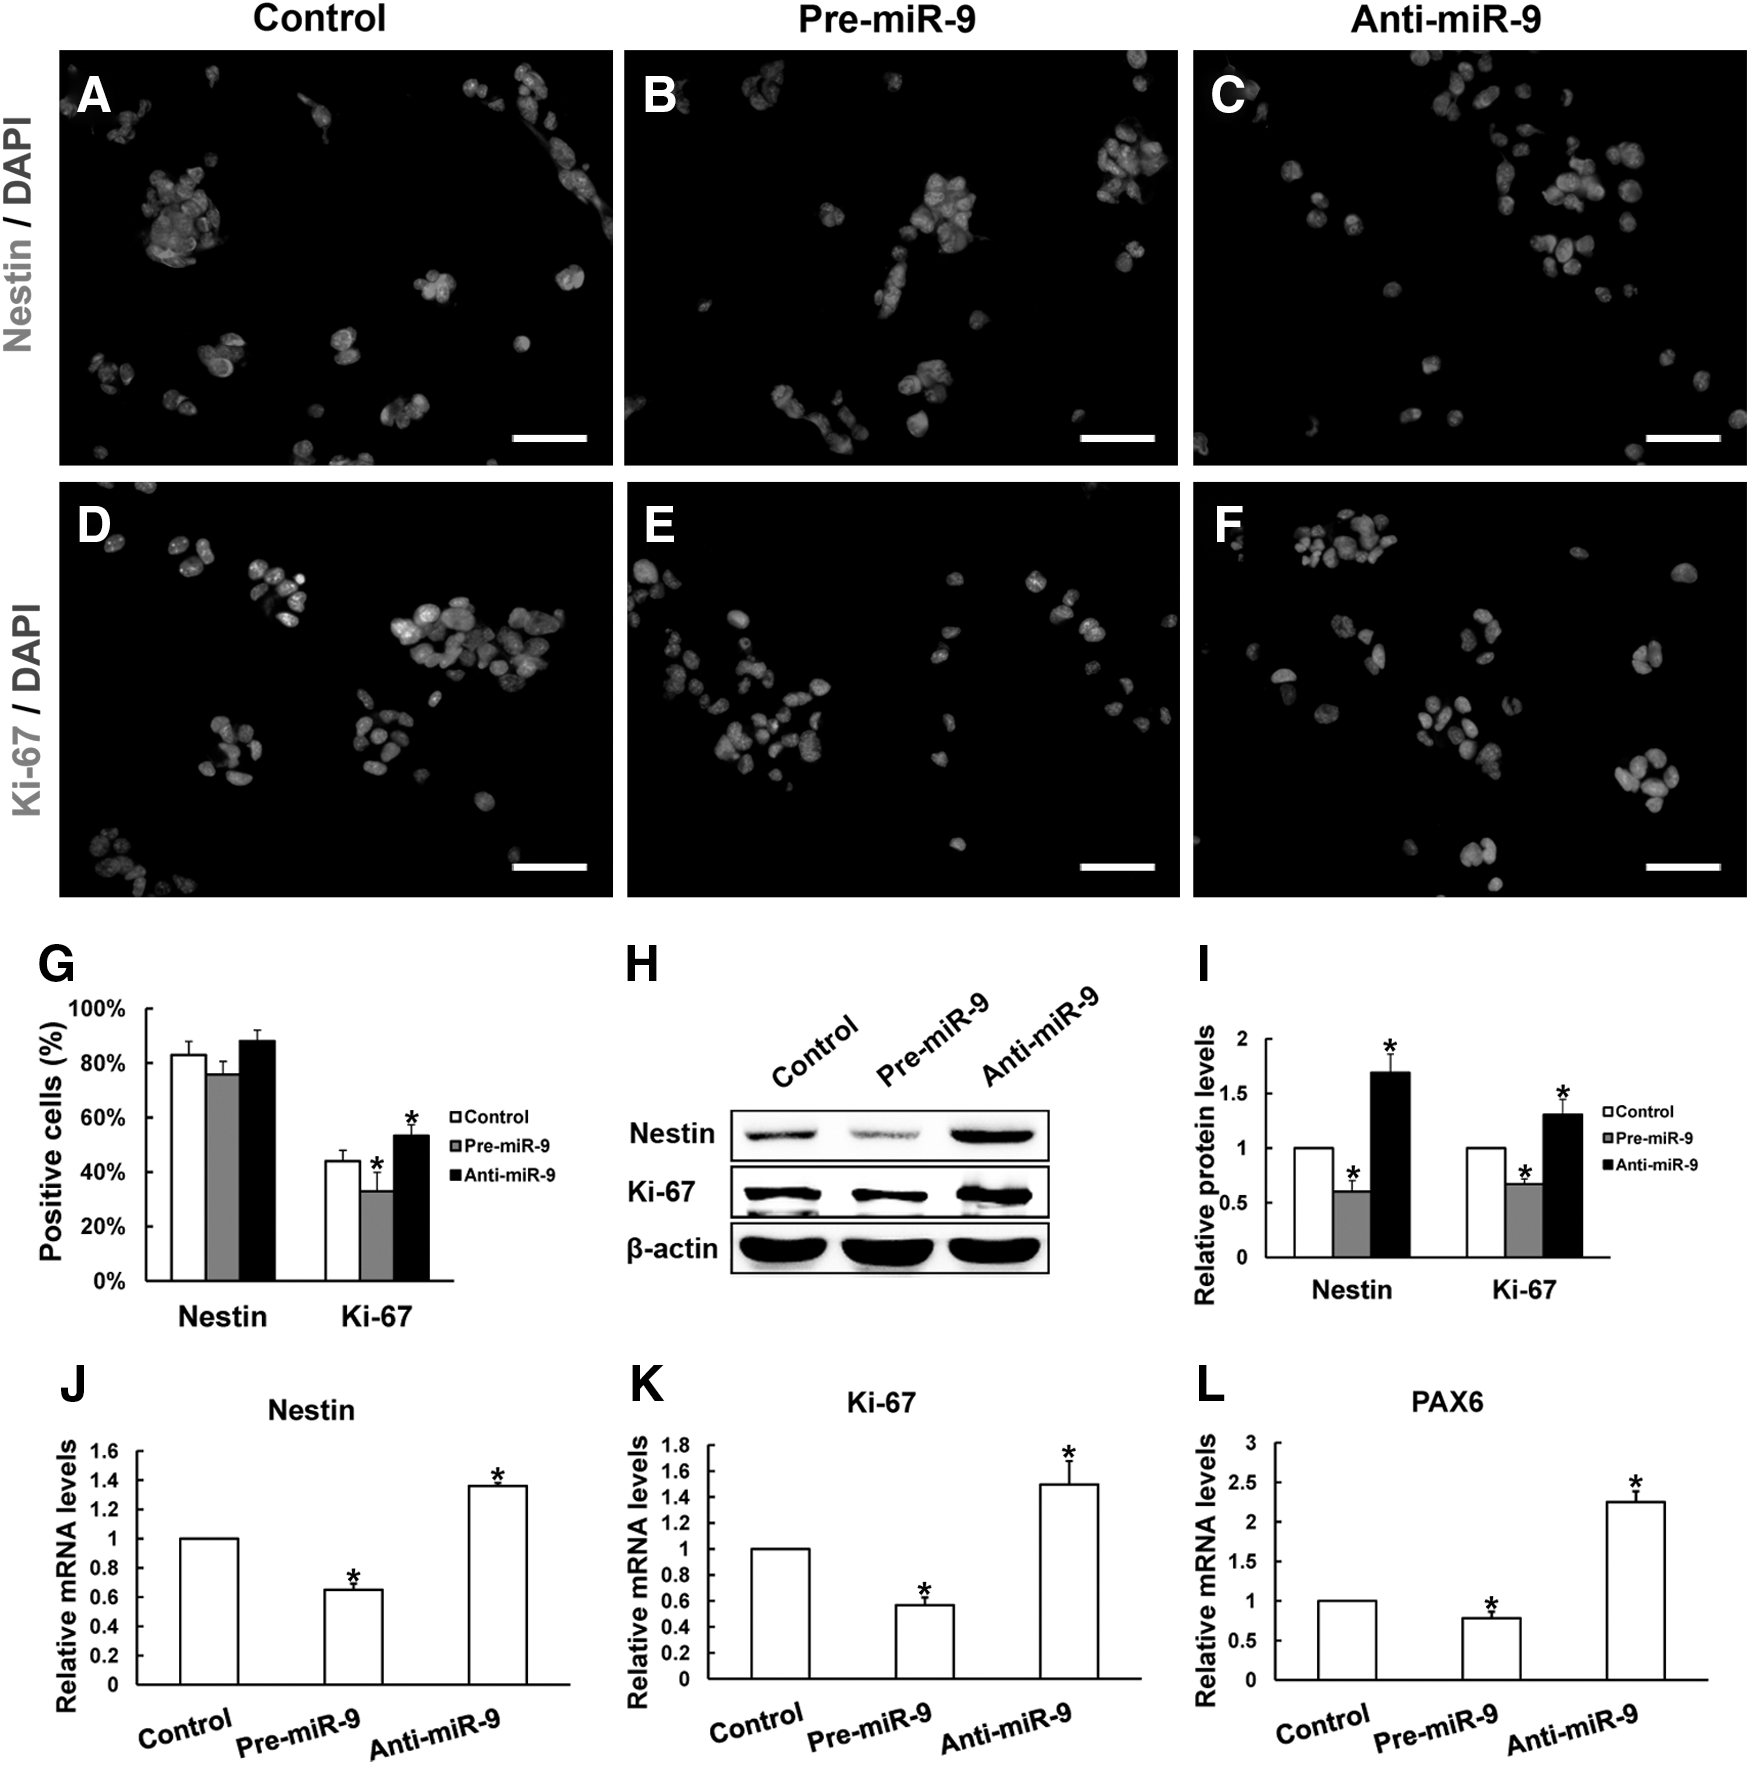
Effects of miR-9 on the proliferation of RPCs. The retinal progenitor marker nestin
In the anti-miR-9-treated RPC cultures, the proportions of nestin- and Ki-67-positive cells were greater than those in the control cultures (Fig. 3G), which is consistent with the results from the western blot analysis (Fig. 3H, I) and qPCR analysis (Fig. 3J–L).
The proliferation capacity of RPCs was also assessed by CCK8 analysis. RPCs treated with anti-miR-9 showed stronger proliferation capacity than the control groups (Supplementary Fig. S1A; Supplementary Data are available online at
These data showed that upregulating miR-9 expression repressed RPC proliferation, and downregulating miR-9 expression enhanced RPC proliferation, suggesting that miR-9 serves as a potentially important regulator in RPC proliferation.
The effect of miR-9 on RPC differentiation
Seven days after the RPCs were cultured under differentiation conditions, the cells were fixed and immunostained with antibodies against nestin (Fig. 4A–C), MAP-2 (Fig. 4D–F), PKC-α (Fig. 4G–I), rhodopsin (Fig. 4J–L), and GFAP (Fig. 4M–O). The proportion of nestin-immunoreactive cells was 5.12%±1.4% in pre-miR-9-treated RPC cultures, which was lower than that in the control cells, at 8.8%±1.6% (Fig. 4P). However, both neuronal and glial differentiation were significantly increased in the pre-miR-9-treated RPC cultures compared with the control cells, as indicated by immunostaining analyses of MAP-2 (31.6%±4.3% vs. 21.1%±3.8%), PKC-α (15.0%±2.4% vs. 10.4%±1.4%), rhodopsin (12.0%±1.7% vs. 6.2±0.6%), and GFAP (35.2%±4.8% vs. 24.0±4.4%) (Fig. 4Q, R). The qPCR results on day 4 showed that the pre-miR-9-treated RPCs exhibited lower expression levels of nestin (0.57-fold), but higher levels of MAP-2 (1.7-fold), PKC-α (2.0-fold), rhodopsin (1.8-fold), Brn3a (2.0-fold), and GFAP (2.4-fold) than the control cells (Fig. 4S). With time to day 7, the expression of nestin continued to decrease, whereas the levels of other differentiation markers keep on rising with pre-miR-9-treatment (Fig. 4T). However, the effect of the enhanced neuronal and glial differentiation caused by pre-miR-9-treatment was inhibited by TLX overexpression (Fig. 4S, T).
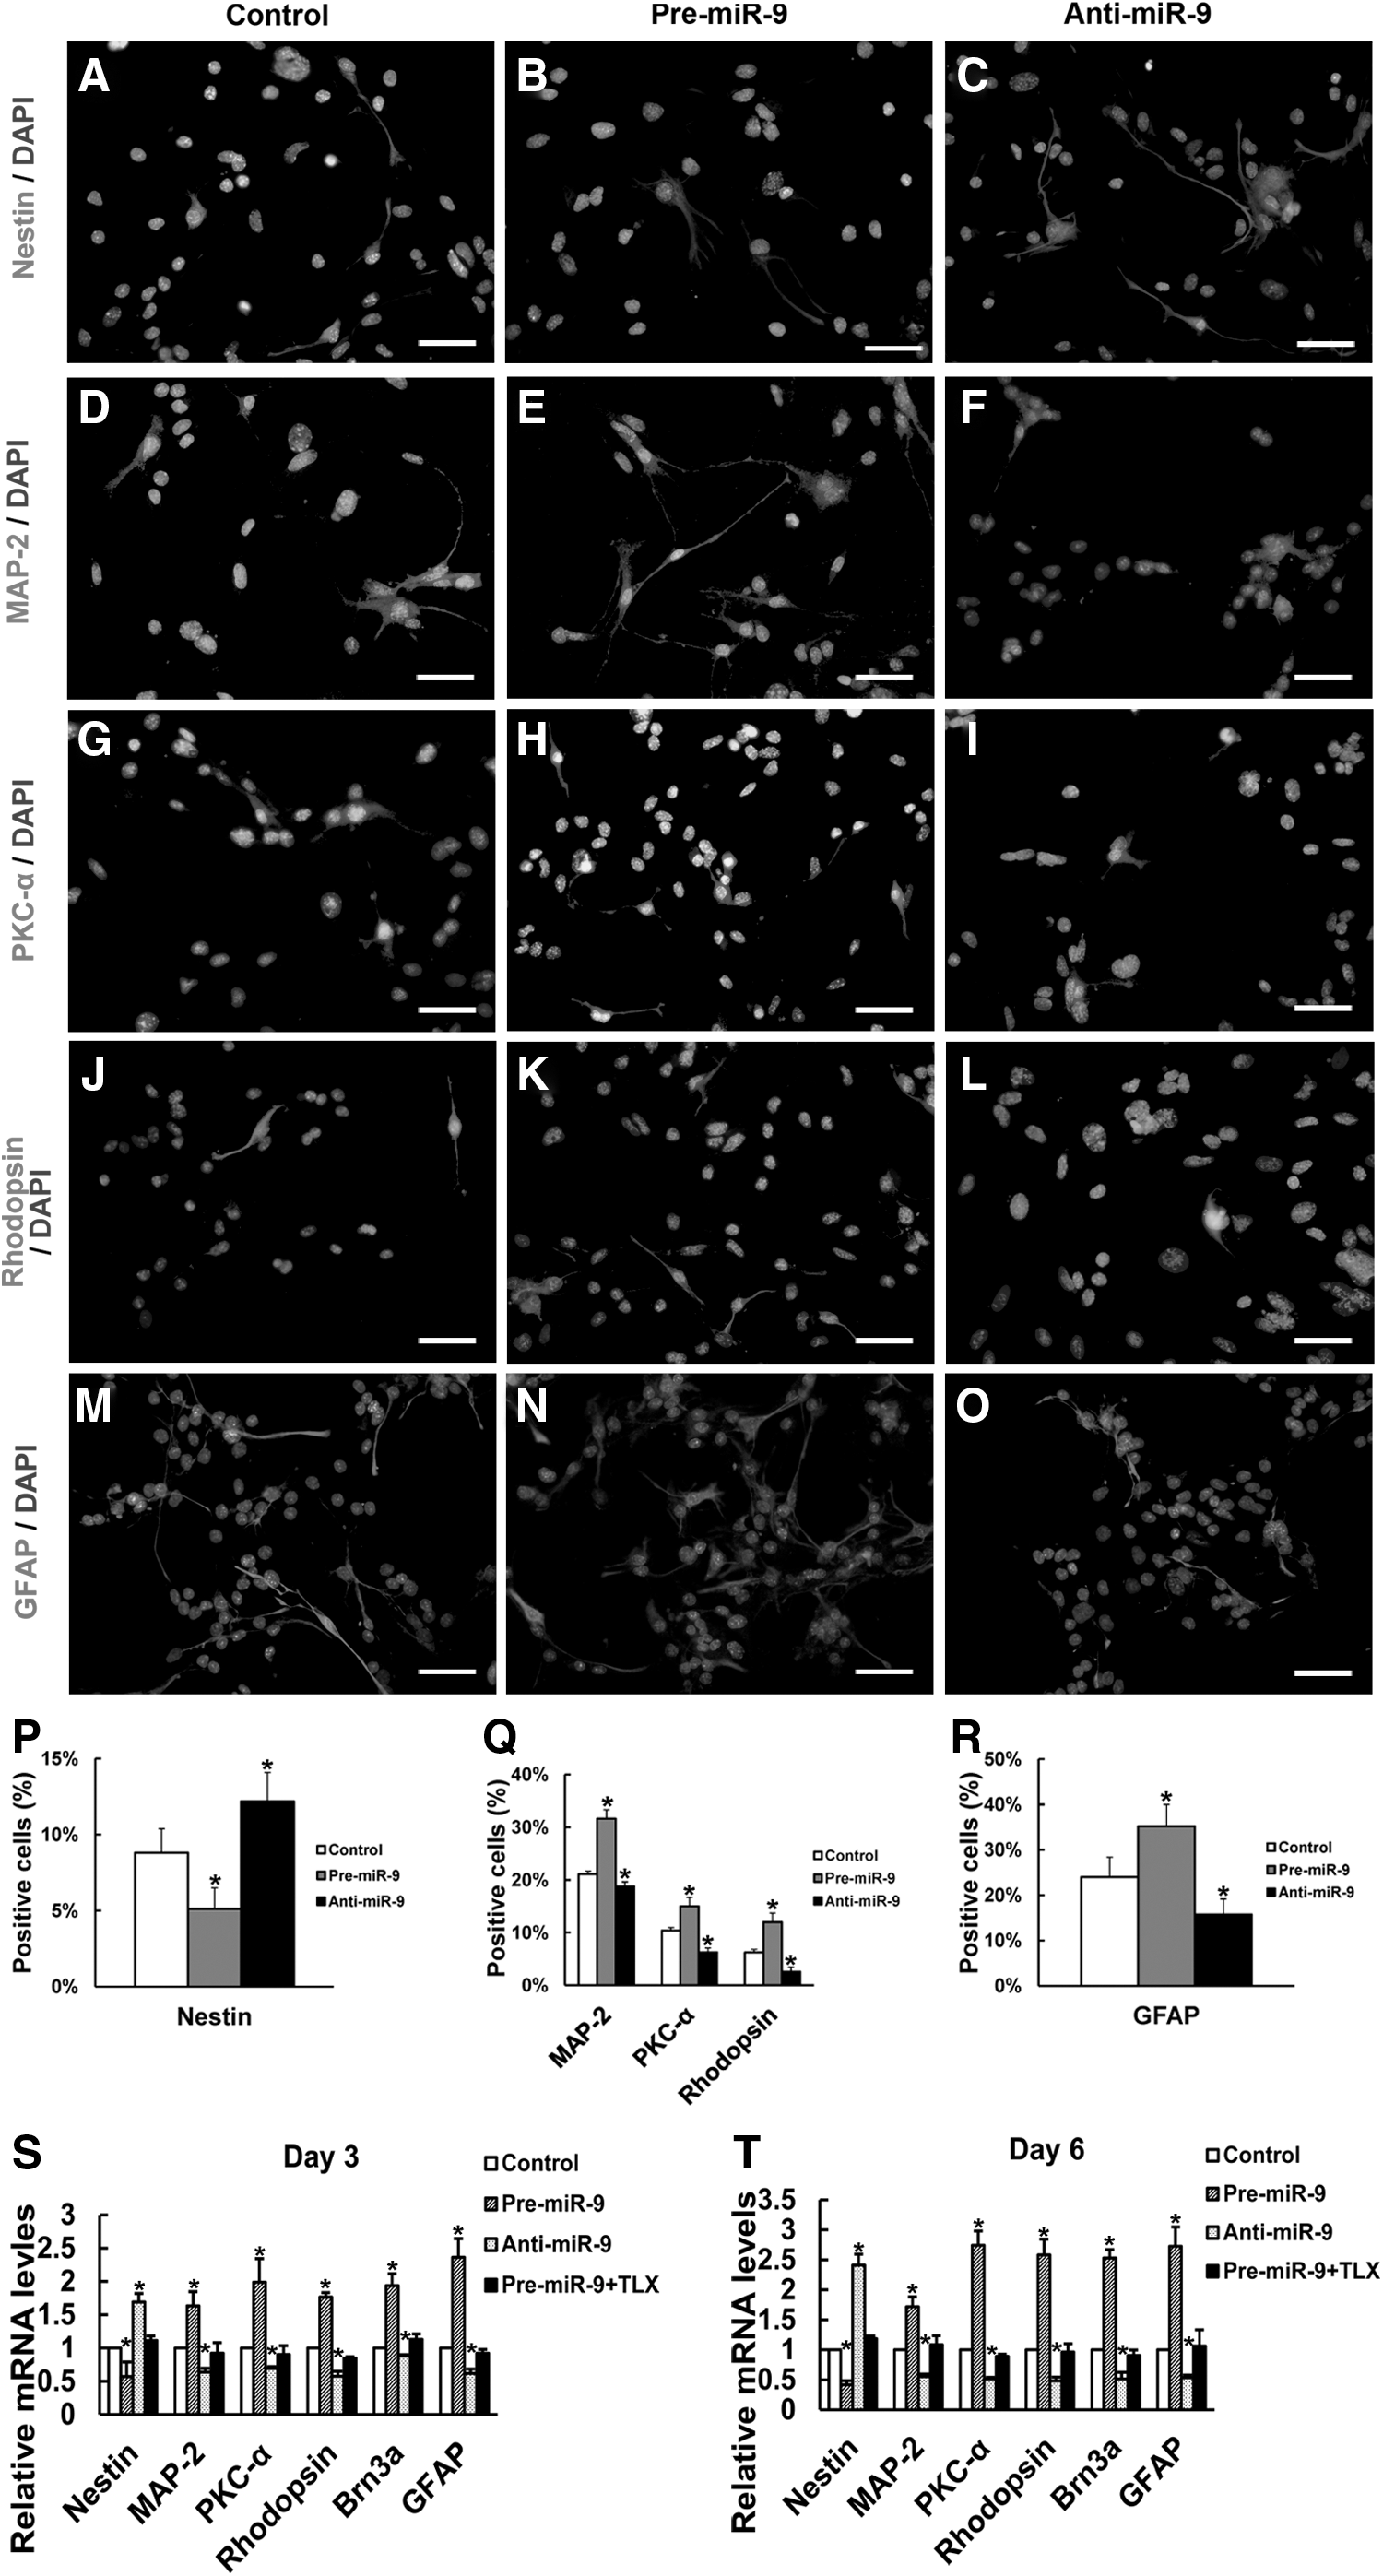
Effects of miR-9 on the differentiation of RPCs. The expression of retinal progenitor marker nestin
When RPCs were treated with anti-miR-9, the percentage of nestin-positive cells was 12.2%±1.9%, which was greater than the 8.8%±1.6% measured in the control cells. Meanwhile, the proportions of MAP-2-, PKC-α-, rhodopsin-, and GFAP-positive cells were all decreased (18.8%±1.9% vs. 21.1%±3.8%, 6.3%±1.2% vs. 10.4%±1.4%, 2.6%±0.9% vs. 6.2%±0.6%, and 15.7%±3.5% vs. 24.0%±4.4%, respectively) compared with those in the control cells (Fig. 4P–R). These results are consistent with the qPCR data and demonstrated that the expression level of nestin was upregulated, whereas the levels of MAP-2, PKC-α, rhodopsin, Brn3a, and GFAP were downregulated in anti-miR-9-treated RPC cultures compared with the control cells (Fig. 4S, T). All these data show that miR-9 has the potential to accelerate neuronal and glial differentiation, indicating that miR-9 plays an important role in RPC differentiation.
TLX regulates RPC proliferation and differentiation
To investigate the effects of TLX on the proliferation and differentiation of RPCs, the gene and protein expression levels of RPC proliferation- and differentiation-related markers were elevated. In the present study, RPC cultures were treated with siTLX or cDNA clone of TLX. Our data showed that the expression level of miR-9 was obviously upregulated in the siTLX-treated RPC cultures, but declined by 80% as compared with the control cells when the cells were treated with TLX clone (Fig. 5B); in contrast, the levels of TLX were significantly downregulated when treated with siTLX, but rose about 42-fold by TLX clone treatment, as shown by qPCR (Fig. 5A). Western blot analysis further demonstrated the results as above (Fig. 5C, D).
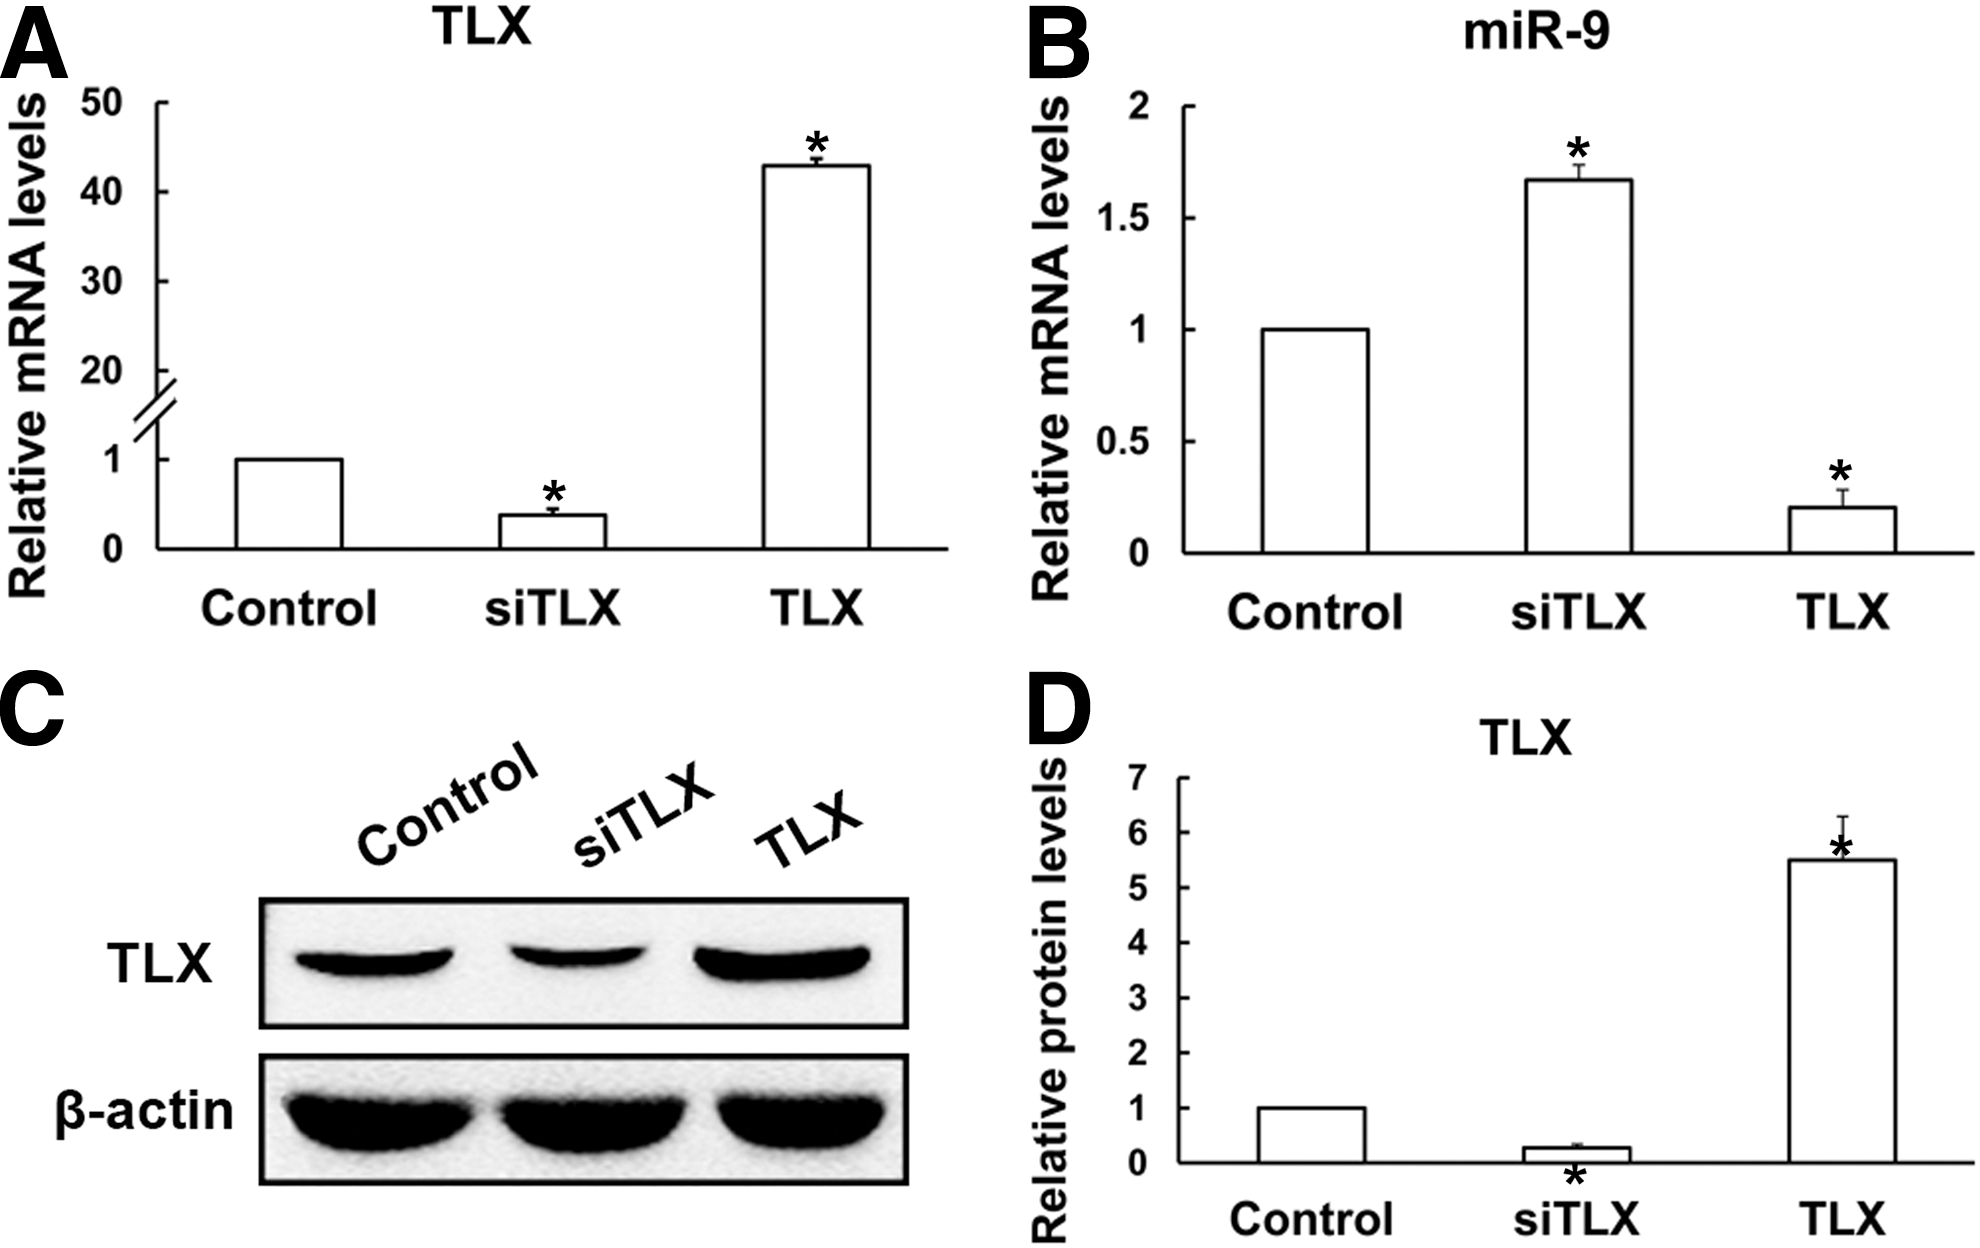
The expression levels of TLX and miR-9 in the RPC cultures treated with siTLX or TLX clone. The qPCR results revealed that when compared with the control, the expression level of TLX decreased sharply with siTLX treatment, but rose about 42-fold with the addition of TLX clone
Under proliferation conditions, the immunostaining data revealed that siTLX-treated RPCs displayed fewer nestin- and Ki-67-positive cells than the control cells (73.2%±5.5% vs. 85.6%±6.0%, 32.6%±4.3% vs. 43.3%±4.0%, respectively); while in TLX clone-treated RPCs, both nestin- and Ki-67-positive cells increased, and the effect could be offset by the addition of pre-miR-9 (Fig. 6I, J). The gene expression levels of nestin, PAX6, and Ki-67 were obviously downregulated in the siTLX-treated RPCs, but upregulated in the TLX clone-treated cells, compared with the control cultures (Fig. 6L–N). Moreover, the CCK8 results showed that TLX could promote the proliferation capacity of RPCs (Supplementary Fig. S1B); in contrast, siTLX inhibited the expansion of RPCs during proliferation (Supplementary Fig. S1B). siTLX- and TLX clone-treated RPC cultures were fixed and immunostained with antibodies against MAP-2 (Fig. 7A–C), PKC-α (Fig. 7E–G), rhodopsin (Fig. 7I–K), and GFAP (Fig. 7M–O), and these data revealed that the percentages of MAP-2-, PKC-α-, rhodopsin-, and GFAP-immunoreactive cells increased under differentiation conditions treated with siTLX (33.3%±2.3% vs. 24.1%±3.5%, 15.6%±1.7% vs. 11.71%±1.4%, 10.0%±1.1% vs. 7.2%±0.8%, 34.2%±5.4% vs. 25.4%±4.0%, respectively) compared with the controls, but decreased under TLX clone treatment (Fig. 7D, H, L, P). In addition, qPCR results revealed that the expression levels of MAP-2, PKC-α, rhodopsin, and GFAP in the RPC cultures with siTLX treatment rose by 1.43-fold, 1.67-fold, 1.92-fold, and 2.08-fold, respectively, but their expression levels were decreased in the TLX clone-treated groups (Fig. 7Q–T). These results indicate that the nuclear receptor TLX may play an important role in regulating RPC cell fate determination.

Effects of TLX on RPC proliferation. Under proliferation conditions, the immunostaining results revealed that the proportions of
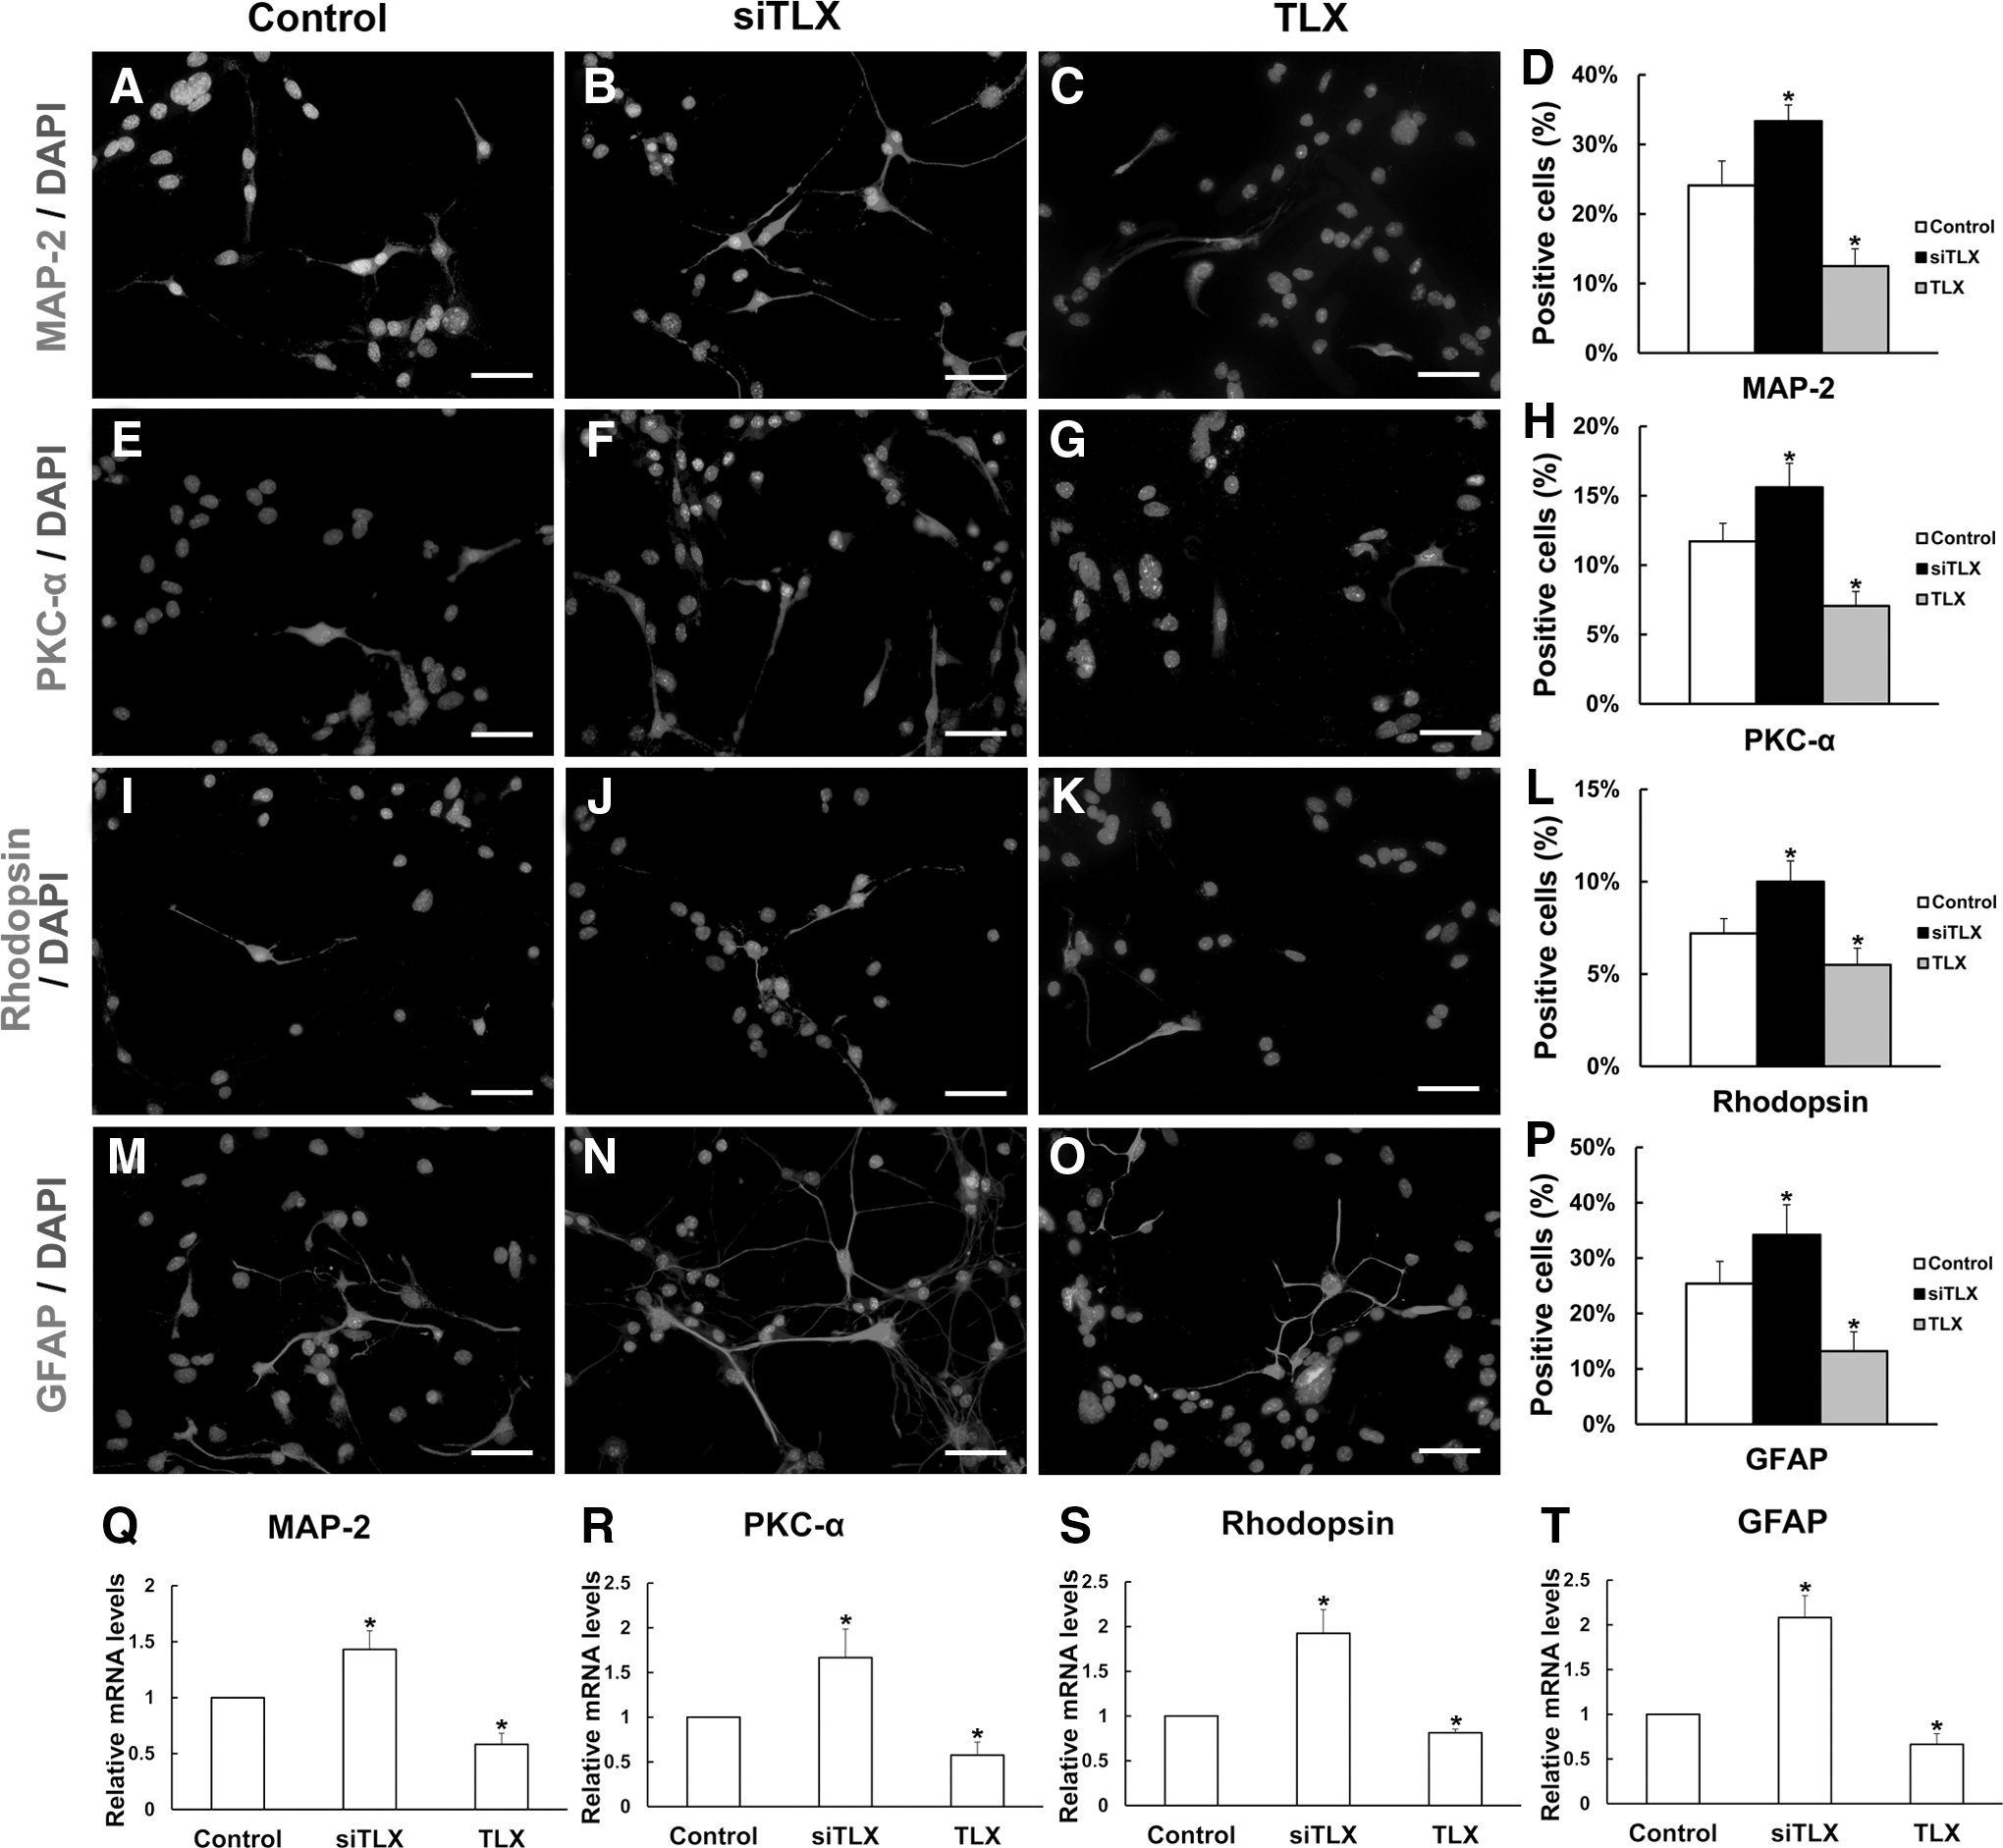
Effects of TLX on the differentiation of RPCs. Seven days after the RPCs were cultured under differentiation conditions, the cells were fixed and immunostained with antibodies against MAP-2
Overall, our data show that miR-9 suppresses TLX expression to negatively regulate RPC proliferation and accelerate differentiation, whereas TLX had the opposite effect, suggesting that miR-9 and TLX serve as important regulators in regulating RPC proliferation and differentiation.
Discussion
miR-9 is specifically expressed in the brain and, especially, is broadly expressed in neuronal precursors and at lower levels in some postmitotic neurons [24]. The expression of miR-9 is upregulated during the in vitro neural differentiation of embryonic stem cells and neural stem/progenitor cells [14,25]. During the maturation of neural progenitor cells derived from embryonic stem cells, the level of the miR-9 also increases upon differentiation. Increased miR-9 expression in neural progenitor cells results in promoting their neuronal differentiation and suppressing their proliferation [13,14,26]. There is also another report indicating that the miR-9 has an important role in the development of retinal progenitors [15]. These results identify miR-9 as a novel regulator that coordinates the proliferation and differentiation of stem cells. Since miR-9 is specifically expressed in the brain and is an important regulator of neural stem cell fate determination, we first asked whether this miRNA serves as a potential regulator in RPC proliferation and differentiation.
Our results showed that the expression level of miR-9 markedly increases during the differentiation of RPCs. We detected enhanced differentiation upon miR-9 overexpression in RPCs during differentiation, although we failed to induce neural differentiation by overexpressing miR-9 alone in cultured RPCs. As each miRNA potentially targets hundreds of different mRNAs [27], recent evidence suggests that miRNAs often fine-tune gene expression to coordinate cell behaviors, rather than primarily regulate genes [28]. The expression of MAP-2 (a marker for pan-neurons), PKC-α (a marker for bipolar neurons), rhodopsin (a marker for photoreceptors), and Brn3a (a marker for ganglion cells) increased in RPC cultures that overexpressed miR-9 during differentiation, indicating that miR-9 could increase the neuronal differentiation of RPCs. In the present study, we also examined whether miR-9 plays a role in glial differentiation in vitro. GFAP has long been associated with the glial population [29], and we found that its expression level was upregulated in pre-miR-9-treated RPC cultures, indicating that increasing miR-9 expression also promotes glial differentiation of RPCs in vitro. However, inhibition of miR-9 reversed these effects. These results suggest that miR-9 plays an important role in accelerating the neuronal and glial differentiation of RPCs.
In the current study, the expression levels of retinal progenitor markers such as nestin and PAX6 declined when RPCs were treated with pre-miR-9 under proliferation conditions. Furthermore, the expression of the cell proliferation marker Ki-67 was also decreased, indicating that increased miR-9 expression repressed RPC proliferation. Conversely, when antisense knockdown of miR-9 in RPC cultures was performed, expression levels of these markers increased, indicating enhanced RPC proliferation. These findings suggest that miR-9 negatively regulates RPC proliferation.
One miRNA usually has multiple target genes, and indeed, several target genes for miR-9 have been investigated, including TLX, FOXG1, NF-κB1, and others [14,30 –33]. TLX is structurally and functionally homologous to the Drosophila terminal/gap gene tailless. Expression of TLX is restricted to the fore- and midbrain, neuroepithelium, retina, and nasal epithelium [34,35]. Studies have suggested that TLX may be required in early neural progenitor cells to regulate proliferative divisions and, therefore, prevent neurogenesis [17,36]. Moreover, it has been indicated that TLX is expressed by RPCs and involved in the process of retinal development [18]. In addition, miR-9 has been reported to target FOXG1 to regulate Cajal-Retzius cell production [31] and to target tumor-related gene NF-κB1 to suppress tumor activity [30,32]. However, whether these miR-9 targets serve as potential regulators in RPC proliferation and differentiation is still being unraveled.
In this study, we failed to detect obvious changes in the FOXG1 or NF-κB1 expression level during RPC differentiation, and neither miR-9 overexpression nor miR-9 knockdown in RPCs affected the expression of these genes. These results indicate that FOXG1 or NF-κB1 may not be essential regulators in RPC proliferation and differentiation. Additionally, our data indicate that the nuclear receptor TLX may serve as a potentially important regulator in RPC proliferation and differentiation.
In the present study, the expression level of TLX was high under proliferation conditions and declined during the differentiation of RPCs, which was accompanied by increased expression of miR-9. The temporal relationship between miR-9 and TLX expression resembles that between miR-124 and its target gene REST [37,38]. In both instances, miRNA targets are preferentially expressed at high levels when the targeting miRNA expression is low. Conversely, the expression of these targets is downregulated as their targeting miRNAs accumulate. In this case, TLX is preferentially expressed at high levels when the targeting miR-9 expression is inhibited, and the expression of TLX is downregulated as miR-9 accumulates. The expression level of TLX in RPCs is high under proliferation conditions, but is reduced dramatically upon differentiation; in contrast, the level of miR-9 increases significantly upon differentiation. These data support the concept that miRNAs that are induced during differentiation suppress stem cell regulators to ensure proper cell fate transition [39].
In our study, miR-9 overexpression in RPCs downregulated the expression of TLX at the protein and mRNA levels, conversely, antisense knockdown of miR-9 increased TLX expression. These results indicated that miR-9 positively regulated neural differentiation and negatively regulated proliferation in RPCs and suggest that TLX is an excellent candidate as a miR-9 molecular target in RPCs.
The role of miR-9 in the proliferation and differentiation of RPCs was further supported by determining the effect of TLX on the proliferation and differentiation of RPCs. In fact, miR-9 has been indicated to negatively modulate TLX expression by directly targeting its 3′-UTR in neural stem cells [14]. In this study, our data showed that downregulation of TLX using RNA interference increased RPC differentiation and inhibited RPC proliferation. In addition to being a direct target of miR-9, TLX also inhibits miR-9 expression, suggesting a negative feedback loop between TLX and miR-9 in regulating RPC cell fate determination.
Overall, our study suggests that miR-9 plays an important role in RPC proliferation and differentiation. Increased expression of miR-9 decreased TLX levels in RPCs, leading to reduced RPC proliferation and accelerated neuronal and glial differentiation, while decreased expression of miR-9 resulted in upregulated TLX levels and enhanced RPC proliferation. Furthermore, inhibition of TLX led to enhanced miR-9 expression and RPC differentiation. In summary, miR-9 and TLX form a feedback regulatory loop to regulate the proliferation and differentiation of RPCs. However, the role of miRNAs and their targets in the brain- and eye-derived stem/progenitor cell fate determination is only beginning to be uncovered. How miRNAs orchestrate the control of RPC proliferation and differentiation through precise transitions between the progenitors and their differentiated cells remains to be explored.
Footnotes
Acknowledgments
The authors would like to thank Dr. Henry Klassen and Dr. Michael J. Young for the original mouse RPCs. This research was supported by the National Natural Science Foundations of China (81070737), Science and Technology Commission of Shanghai (13DZ0500303), the Education Commission of Shanghai (11YZ47) and the Scientific Research Foundation for Returned Overseas Chinese Scholars.
Author Disclosure Statement
The authors report no conflict of interests. The authors alone are responsible for the content and writing of the article.
References
Supplementary Material
Please find the following supplemental material available below.
For Open Access articles published under a Creative Commons License, all supplemental material carries the same license as the article it is associated with.
For non-Open Access articles published, all supplemental material carries a non-exclusive license, and permission requests for re-use of supplemental material or any part of supplemental material shall be sent directly to the copyright owner as specified in the copyright notice associated with the article.