
Abstract
Mesenchymal stems or stromal cells (MSCs) are rare multipotent cells with potent regenerative and immunomodulatory properties. Microglial cells (MGs) are specialized tissue macrophages of the central nervous system (CNS) that continuously survey their environment with highly motile extensions. Recently, several studies have shown that MSCs are capable of reprogramming microglia into an “M2-like” phenotype characterized by increased phagocytic activity and upregulated expression of anti-inflammatory mediators in vitro. However, the precise polarization states of microglia in the presence of MSCs under physiological or under inflammatory conditions remain largely unknown. In this study, we found that MSCs induce a mixed microglia phenotype defined as Arg1-high, CD86-high, CD206-high, IL-10-high, PGE2-high, MCP-1/CCL2-high, IL-1β-moderate, NALP-3-low, and TNF-α-low cells. These MSC-elicited MGs have high phagocytic activity and antigen-presenting ability. Lipopolysaccharide is able to shape this microglia phenotype quantitatively, but not qualitatively in the presence of MSCs. This unique polarization state resembles a novel regulatory microglia phenotype, which might contribute to the resolution of inflammation and to tissue repair in the CNS.
Introduction
M
Mononuclear phagocytes are now not only recognized as crucial cellular components of tissue repair and regeneration in each organ, but can also contribute to tissue damage. They can adopt a variety of functional phenotypes in response to environmental cues. The classical M1 and M2 (pro- and anti-inflammatory, respectively) polarization states represent two ends of a functional spectrum of cell activation [28].
Under stress or injury, the activation of microglial cells (MGs), the resident mononuclear phagocytes within the central nervous system (CNS), can result in the production of pro-inflammatory mediators that are toxic to neurons and contribute to the pathology of many neurodegenerative diseases. In contrast, under normal physiological conditions, MGs serve an important role in immune surveillance and homeostasis within the CNS by continually surveying their microenvironment [29,30]. Therefore, modulating microglia polarization state may limit inflammation and tissue damage within the CNS.
Recently, several studies have shown that MSCs are capable of reprogramming MGs into an “M2-like” phenotype characterized by increased phagocytic activity and upregulated expression of anti-inflammatory mediators in vitro. However, the precise polarization states of microglia in the presence of MSCs under physiological or inflammatory conditions remain largely unknown. In most studies, xenogenic experimental systems were used; that is, cocultures of human MSCs with mouse or rat MGs [26,31 –33] and primary microglia were frequently replaced with neoplastic cell lines (BV2 or N9) [34 –36] or with hippocampal slices [37]. Only two laboratories used autologous mouse [35] or rat [38] primary MGs and MSCs. The different experimental approaches may explain the sometimes conflicting results obtained by different groups.
Our recent work was focused on the in vitro interactions of autologous BM-derived MSCs with primary MGs. The surface phenotype, phagocytic activity, pro- and anti-inflammatory mediator secretion ability, and antigen-presenting capacity of resting and endotoxin-stimulated mouse MGs were studied in the presence or absence of mouse BM-derived MSCs. We found that MSCs elicit a mixed microglia phenotype characterized by anti-inflammatory activity but increased phagocytic and antigen-presenting ability. Lipopolysaccharide (LPS) is able to shape this MG phenotype quantitatively, but not qualitatively in the presence of MSCs enhancing pro-inflammatory mediator production while not inducing a typical M1 phenotype.
Materials and Methods
Animals
Adult (10–12 weeks old) C57BL/6 (H-2b) (National Institute of Oncology, Budapest, Hungary) and neonatal (1–3 days old) CD1, C57Bl/6, and CX3CR1+/GFP transgenic mice (on C57BL/6 background) (Institute of Experimental Medicine, Budapest, Hungary) were used according to the guidelines of the Animal Care and Use Committee of the National Blood Service (Budapest, Hungary). CX3CR1+/GFP animals [39] were obtained from the European Mouse Mutant Archive (EMMA cx3cr1tm1Litt MGI:2670351) and backcrossed for more than 10 generations to C57Bl/6.
Isolation and culturing of MSCs
We established MSC cultures from the BM of adult C57Bl/6 (H-2b) mice. The isolation and characterization of these cells were carried out according to Hegyi et al. [40]. Briefly, after the decapitation of the animals, mononuclear cells were isolated by flushing the femurs with complete medium (CM) containing DMEM/Ham's F-12 medium (Invitrogen), 10% fetal bovine serum, 5% horse serum (Invitrogen), 50 U/mL penicillin, 50 μg/mL streptomycin (Sigma-Aldrich), and 2 mM
Preparation of mixed glial cell cultures and isolation of microglia
The preparation of mixed glial cell cultures and the isolation of microglia were carried out according to Saura et al. [41] with some modifications. The brains of neonatal (P1–P3) CD1 mice were isolated and then the meninges and choroid plexus were removed. The forebrain tissue was cut into mm3 size pieces and digested (10 min, 37°C) by 0.05% trypsin in phosphate-buffered saline (PBS) containing 400 μg/mL DNAse (Sigma-Aldrich). Cells were suspended in CM without horse serum and seeded into poly-
Flow cytometric analysis
1–2×10⁵ cells were stained in FACS buffer (PBS with 0.5% v/w bovine serum albumin) for 20 min at 4°C with monoclonal antibodies for Sca-1, CD11b, CD34, CD44, CD45, CD73, CD86, CD206, F4/80, Gr1, Ter119, and MHC-II purchased from BD Pharmingen. After incubation, samples were washed with FACS buffer and analyzed on an FACScan flow cytometer using CellQuest software (Becton Dickinson).
In vitro stimulation of MGs
MGs were seeded at 105 cells/mL in 24-well flat-bottom plates (BD Falcon) in CM with or without 104 MSCs in the presence or absence of 1 μg/mL LPS and cultured for 48 h at 37°C. To investigate the effect of spatial separation, we prepared transwell experiments, where 104 MSCs were plated into transwell chambers with 1 μm pore-sized membrane suitable for 24-well plates (BD Falcone) and 105 MGs were added into the lower compartment.
Immunocytochemical staining and cell area calculations
105 MGs were incubated at 37°C for 48 h in the presence or absence of 104 BM-derived MSCs and/or 10 μg/mL LPS. The cultures were fixed with 4% paraformaldehyde in PBS solution at room temperature for 20 min and were then incubated with the cell surface marker Isolectin B4 (Sigma L-2140; biotin conjugated) diluted (1:500) overnight in PBS containing 5% fetal calf serum at 4°C. For fluorescent detection, after washing with PBS, Alexa 488-conjugated avidin (Invitrogen; 1:1,000) was used for 60 min at room temperature. The preparations were covered with bis-benzimidazole (Sigma-Aldrich) containing Mowiol (Merck KGaA). For each individual culture, independent images (n=15) of random fields of view were taken with a Nikon A1R confocal laser-scanning system built on a Ti-E inverted Nikon microscope, having a 0.45 NA 20× CFI Super Plan Fluor ELWD (Nikon GmbH) objective and NIS elements (Nikon) software. Cell number was calculated by counting bis-benzimide (Hoechst)-stained nuclei. Individual cell areas were measured by Zeiss AxioVision 4.8 software.
Yeast phagocytosis of MGs
Saccharomyces cerevisiae cells were heat inactivated by boiling for 30 min and then resuspended in PBS at the final concentration of 5×10⁷cell/mL. From this solution, 0.1 mL (5×10⁶ yeast cells) was added to the wells containing microglia and/or MSCs and incubated at 37°C for 1 h. Subsequently, noningested yeast cells were removed by repeated washing with PBS, and the cultures were fixed with 8% formalin (v/v in PBS) solution for 10 min. After three additional washes with PBS, Giemsa solution was added to the specimens for 1 h. Then, we took images of 10 random microscopic fields per sample using a 20× objective of an Olympus CK2 inverted microscope (Olympus) and a Nikon Coolpix 4500 digital camera (Nikon). In the photographs, the number of incorporated yeast particles by single MGs were counted (n=100 in each experimental group). Averages and standard deviations were calculated, and the significance was estimated by Student's t-test.
Phagocytosis of apoptotic thymocytes by MGs
Thymuses were obtained from 10 to 12 week-old C57BL/6 mice and minced to get a single cell suspension. To induce apoptosis, cells were incubated in CM supplemented with 2 μM dexamethasone (Sigma-Aldrich) at a concentration of 5×10⁶ cells/mL for 8 h. After washing, 5×10⁶ thymocytes were added to the wells containing microglia and/or MSCs and incubated for an additional 48 h at 37°C.
Detection of secreted proteins in cell culture supernatants
The amounts of CCL2 [monocyte chemoattractant protein-1 (MCP-1)], TNF-α, IL-1β, IL-10, and PGE2 in various cell culture supernatants were measured with ParameterTM quantitative ELISA Kits (R&D Systems, Inc.) that were specific for the respective cytokine. Mouse arginase 1 ELISA Kit was obtained from the Hölzel Diagnostika GmbH. The experiments were carried out according to the supplier's instructions.
Quantitative real-time polymerase chain reaction
Total RNA was isolated with GeneAid Total RNA Mini Kit from microglia and MSC mono-cultures and from MG/MSC cocultures at 5 h after plating. The purity of RNA samples was checked, and concentrations were determined by a Nano Drop 2000 spectrophotometer (Thermo Scientific). One hundred fifty nanograms of RNA samples were converted to cDNA with High-Capacity cDNA Reverse Transcription Kit (Applied Biosystems). Real-time polymerase chain reaction (PCR) was performed with Power SYBR Green PCR Master Mix (Applied Biosystems) on ABI StepOne instrument according to the manufacturer's instructions. Primer sequences were designed by Primer Express 3.0 software:
GAPDH:
(f ) TGACGTGCCGCCTGGAGAAA;
(r) AGTGTAGCCCAAGATGCCCTTCAG
TNF-α:
(f ) CAGCCGATGGGTTGTACCTT
(r) GGCAGCCTTGTCCCTTGA
IL-10:
(f ) AGTGAGAAGCTGAAGACCCTCAGG
(r) TTCATGGCCTTGTAGACACCTTGGT
IL-1β:
(f ) TTGACGGACCCCAAAAGATG
(r) TGGACAGCCCAGGTCAAAG
NLRP3:
(f ) CAGAGCCTACAGTTGGGTGAA
(r) ACGCCTACCAGGAAATCTCG
Arg1:
(f ) GTCTGGCAGTTGGAAGCATCT
(r) GCATCCACCCAAATGACACA
MCP-1:
(f ) CCAGCACCAGCACCAGCCAA
(r) TGGATGCTCCAGCCGGCAAC
Gene expression was analyzed by ABI StepOne program. GAPDH was used as an internal control. To confirm the identity of PCR products, a melting curve analysis had been performed with StepOne instrument's Software v.2.0.
Antigen presentation
For testing the effect of MSCs on the antigen presentation of MGs toward T cells, 104 MSCs, 105 MGs, and 2×10⁵ in vivo primed T cells were cultured along with different concentrations of ovalbumin (OVA) in the indicated combinations (see Results section) at 37°C for 5 days. T cells were obtained from the lymph nodes of C57Bl/6 mice at 7 days after a subcutaneous injection of a mixture of complete Freund's adjuvant and OVA (in a ratio of 1:1). After the incubation, cultures were pulsed with 1 mCi 3H-thymidine (Amersham) for 18 h. Cells were harvested, and thymidine incorporation was quantified in counts per minute (cpm±SD; n=3). The amount of regulatory T cells was determined by FACS using the Mouse Regulatory T-Cell Staining Kit #1 (eBioscience).
T-cell proliferation
5×10⁴ MSCs were seeded in 96-well flat-bottom plates (BD Falcon) and cultured for 24 h at 37°C. After 24 h, nonadherent cells were washed off. To isolate T lymphocytes, splenocytes derived from adult C57Bl/6 (H-2b) and Balb/c (H-2d) mice were isolated by disaggregation of spleens; then, erythrocytes were depleted by NH4Cl lysis (0.15 M NH4Cl in 0.01 M Tris–HCl buffer, pH=7.5). To purify T lymphocytes, SpinSep Mouse CD3+ T-Cell Enrichment Kits were used according to the manufacturer's protocol (Stem Cell Technologies). In mitogen-driven proliferation assays, 106 T lymphocytes (>95% CD3+ cells by flow cytometry) were seeded in 200 μL CM in the presence of 5 μg/mL concanavalin A (ConA; Sigma-Aldrich) (n=3). 2–3×10⁵ responder and 2–3×10⁵ irradiated (30 Gy) stimulator splenocytes per well were seeded in a total volume of 200 μL medium to prepare mixed lymphocyte reactions (MLR). After an incubation of 2 (for mitogen-driven cultures) or 4 (for MLR) days, cultures were pulsed with 1 μCi 3H-thymidine (Amersham Pharmacia Biotech Export GmbH) for 8 h. Thymidine incorporation of harvested cells was measured in a Packard Tricarb beta counter (Perkin-Elmer), to indicate proliferation in cpm. Results were expressed as mean values±SD.
Statistical analysis
Data are expressed as mean±SD. The differences between groups were evaluated by a two-tailed Student's t-test. The significance level was set at P<0.05.
Results
Characterization of MSCs and MGs
MSCs derived from the BM of adult C57Bl/6 mice were positive for MSC markers (Sca-1, CD44, and CD73), but negative for several hematopoietic markers (CD34, CD45, CD11b, F4/80, Gr1, Ter119, and CD206), and could differentiate into adipocytes and osteoblasts in vitro (data not shown), as previously described [40,42].
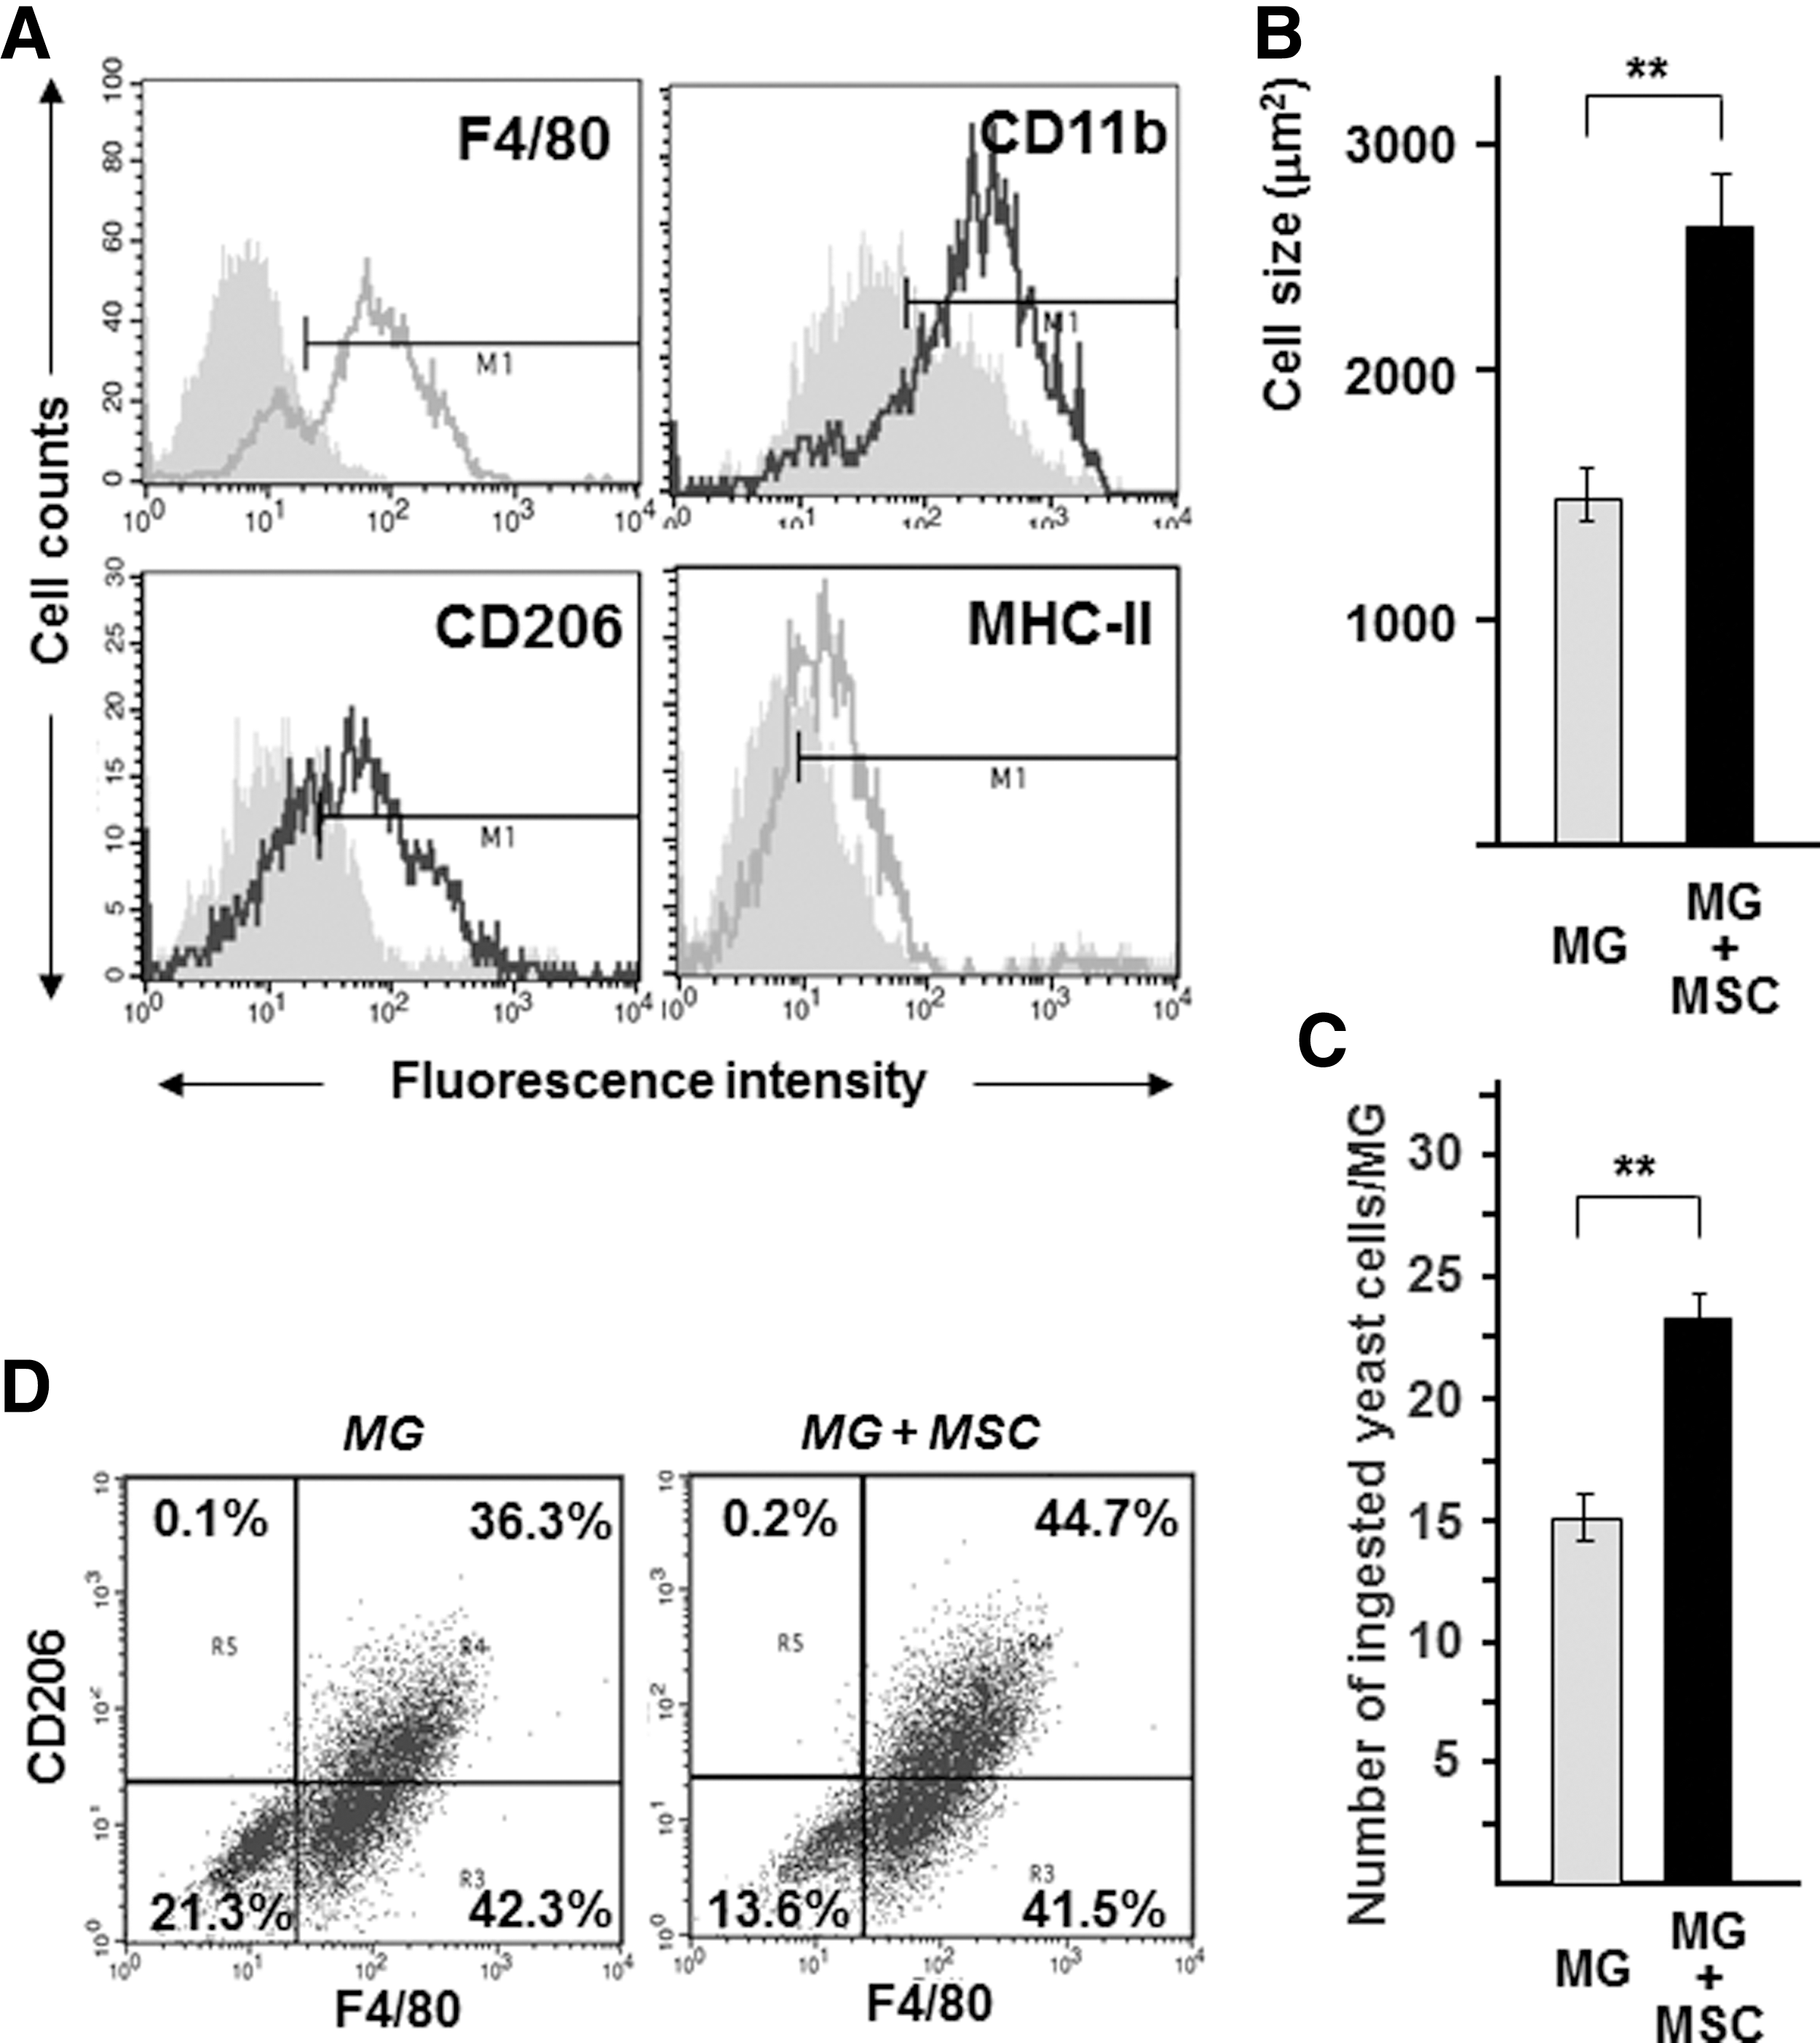
The majority (70%–80%) of cultured MGs derived from neonatal CD1 or C57Bl/6-CX3CR1+/GFP mice were positive for F4/80, a marker for murine microglia, and partially positive for CD11b and CD206. However, only a very low level of MHC class II antigen expression was observed on the surface of MGs, indicating that they are mainly in resting state (Fig. 1A). The identity of MGs was further confirmed by a yeast phagocytosis assay (see next paragraph).
MSCs induce morphological and functional changes on microglia.
MSCs induce morphological and functional changes in microglia
To test whether MSCs can induce morphological changes of MGs, cocultures of MGs with MSCs (ratio=10:1) were established. The shape, size, and phagocytotic activity of MGs were compared between pure MG cultures and MSC-MG cocultures. In mono-type cultures, the majority of MGs (Supplementary Fig. S1A, C; Supplementary Data are available online at
Furthermore, the presence of MSCs markedly increased the yeast phagocytosis of microglia (Fig. 1C and Supplementary Fig. S2A, B). Since the recognition of yeast cells involves a number of receptors, including the CD206 mannose receptor, we analyzed the expression of CD206 on the surface of MGs in the presence or absence of MSCs. We found that, after 48 h of coculturing with MSCs, the expression of CD206 significantly increased in F4/80-positive MGs compared with microglia cultured alone (45.1%±2.8% vs. 34.9%±3.1%, n=5, P<0.001) (Fig. 1D).
The release of pro- and anti-inflammatory mediators by MGs was assessed after yeast cell and apoptotic thymocyte phagocytosis, in the presence and absence of MSCs. In nonphagocytotic MSC/MG cocultures, slightly elevated levels of TNF-α and PGE2, and highly (by about two magnitude orders) increased levels of IL-10 were measured in comparison to both MG and MSC mono-cultures. In response to 24- and 48-h exposure to yeast cells, mono-cultured MGs showed a more than 6- and 25-fold increase of TNF-α (Fig. 2A, D) and an about 3- and 5-fold elevation in IL-10 (Fig. 2B, E) production, respectively. As expected, apoptotic thymocytes alone did not evoke measurable changes in either TNF-α or IL-10 production in MG mono-cultures. In the cocultures, however, they caused a significant increase in the production of IL-10 and PGE2. In MG/MSC cocultures, yeast loading resulted in a much higher increase in the production of TNF-α and PGE2 (in comparison to yeast-loaded mono-MG cultures), while the high IL-10 generation of MG/MSC cocultures was not further increased by yeast loading. The data indicated that the presence of MSCs can alter the cytokine production of MGs, shifting the TNF-α/IL-10 ratio toward an anti-inflammatory cytokine status. It should be noted that no production of cytokines was observed when MSCs were cultured alone.

The cytokine production of MGs is different after phagocytosis of yeast or apoptotic thymocytes. 105 MGs were incubated for 24 h
Since PGE2 seems to play a key role in MSC–macrophage interaction in several other experimental systems [12,43], we also measured the level of this lipid mediator in the collected supernatants of our cultures. As shown in Fig. 2C and F, PGE2 production was detected in all cultures, especially when MGs were cultured in the presence of MSCs. The highest PGE2 level was found in cocultures containing yeast phagocytosing microglia, although MSCs and MGs alone were also able to produce significant amounts of PGE2. Therefore, these results might indicate some relevance of PGE2 in the MG–MSC interaction.
MSCs modulate the release of cytokines and PGE2 by LPS-stimulated microglia
Next, we assessed whether MSCs affect the TNF-α, IL-10, and PGE2 production of microglia when activated by bacterial endotoxin for 48 h. LPS-stimulated MGs produced significantly higher amounts of TNF-α compared with resting microglia (Fig. 3). A concomitant moderate increase in IL-10 and PGE2 levels was also observed in response to LPS. Interestingly, neither TNF-α nor IL-10 was detected in the supernatants of LPS-stimulated MSC monocultures (data not shown). When MGs were cocultured with MSCs in the absence of LPS, IL-10 and PGE2 levels significantly increased in the culture media; whereas the production of TNF-α remained unchanged compared with microglia mono-cultures. When MGs and MSCs were cocultured in the presence of LPS, the amount of all three mediators increased dramatically. In LPS-treated transwell cultures, the MSC-induced IL-10 and PGE2 increase was significantly reduced, but not completely eliminated; whereas the amount of TNF-α was unchanged in comparison to contact cocultures. The data indicated that both soluble mediator(s) and direct cell-to-cell contact(s) play crucial roles in MG–MSC interaction.
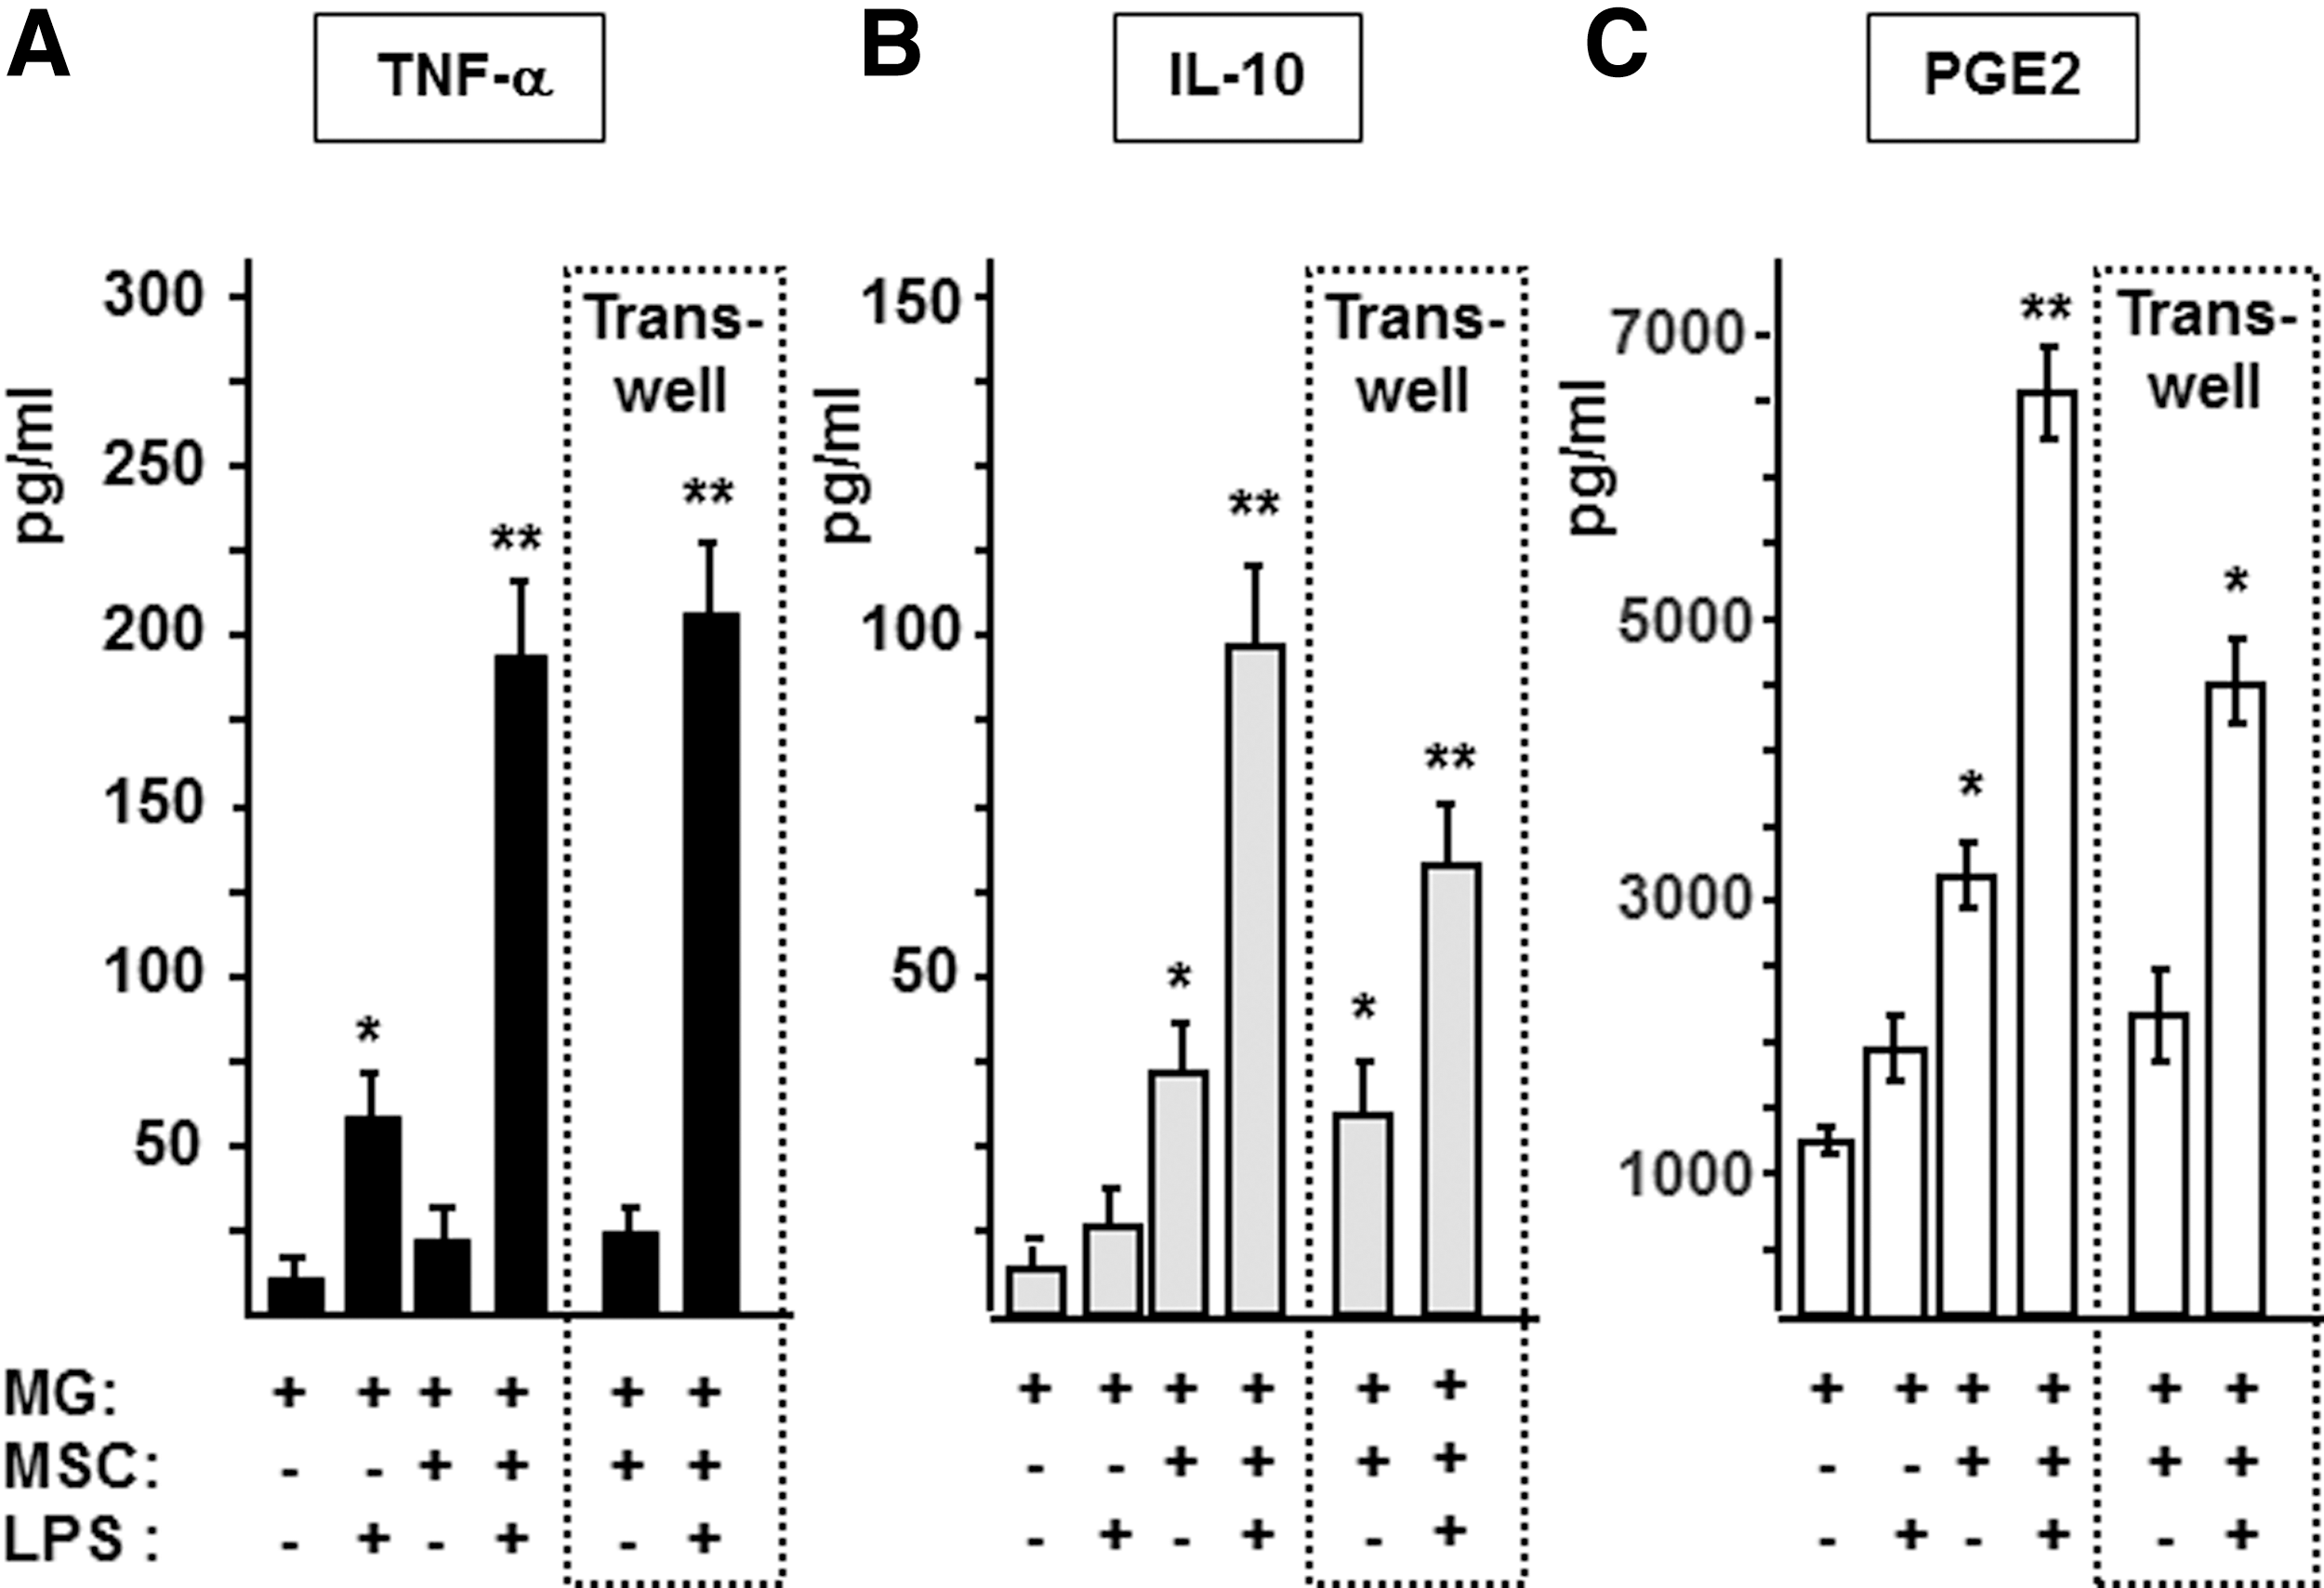
MSCs modulate the release of cytokines and PGE2 by LPS-stimulated microglia. MGs (105/well) were incubated alone or with MSCs (104/well) in the presence or absence of 10 μg/mL LPS in the indicated combinations for 48 h. In transwell experiments, the two cell types were separated from each other by a 1 μm pore-sized semi-permeable membrane. The concentrations of TNF-α
In order to further clarify the earlier findings, we used a two-step transwell culture system. In the first step, MGs and MSCs were cocultured in the presence or absence of LPS in transwell plates, enabling only humoral cell contacts. After 48 h, the MSC-containing inserts were transferred into new wells without microglia and fresh media was added to all MSC and MG cultures. After an additional incubation for 24 h, the TNF-α, IL-10, and PGE2 concentrations were measured in the media by ELISA. As shown in Fig. 4, only MGs secreted significant amounts of TNF-α (Fig. 4A) and IL-10 (Fig. 4B) regardless of the presence or absence of LPS. In contrast, PGE2 was produced by both cell types (MG and MSC) and the production increased in response to LPS stimulation (Fig. 4C). To further validate these results, we measured the TNF-α and IL-10 gene expression by quantitative reverse transcription-PCR. In accordance with the ELISA data, no TNF-α or IL-10-specific mRNAs were detected in MSCs, whereas high levels of these messages were observed in MGs (data not shown). Thus, MSCs were unable to produce TNF-α or IL-10 in our experimental system.
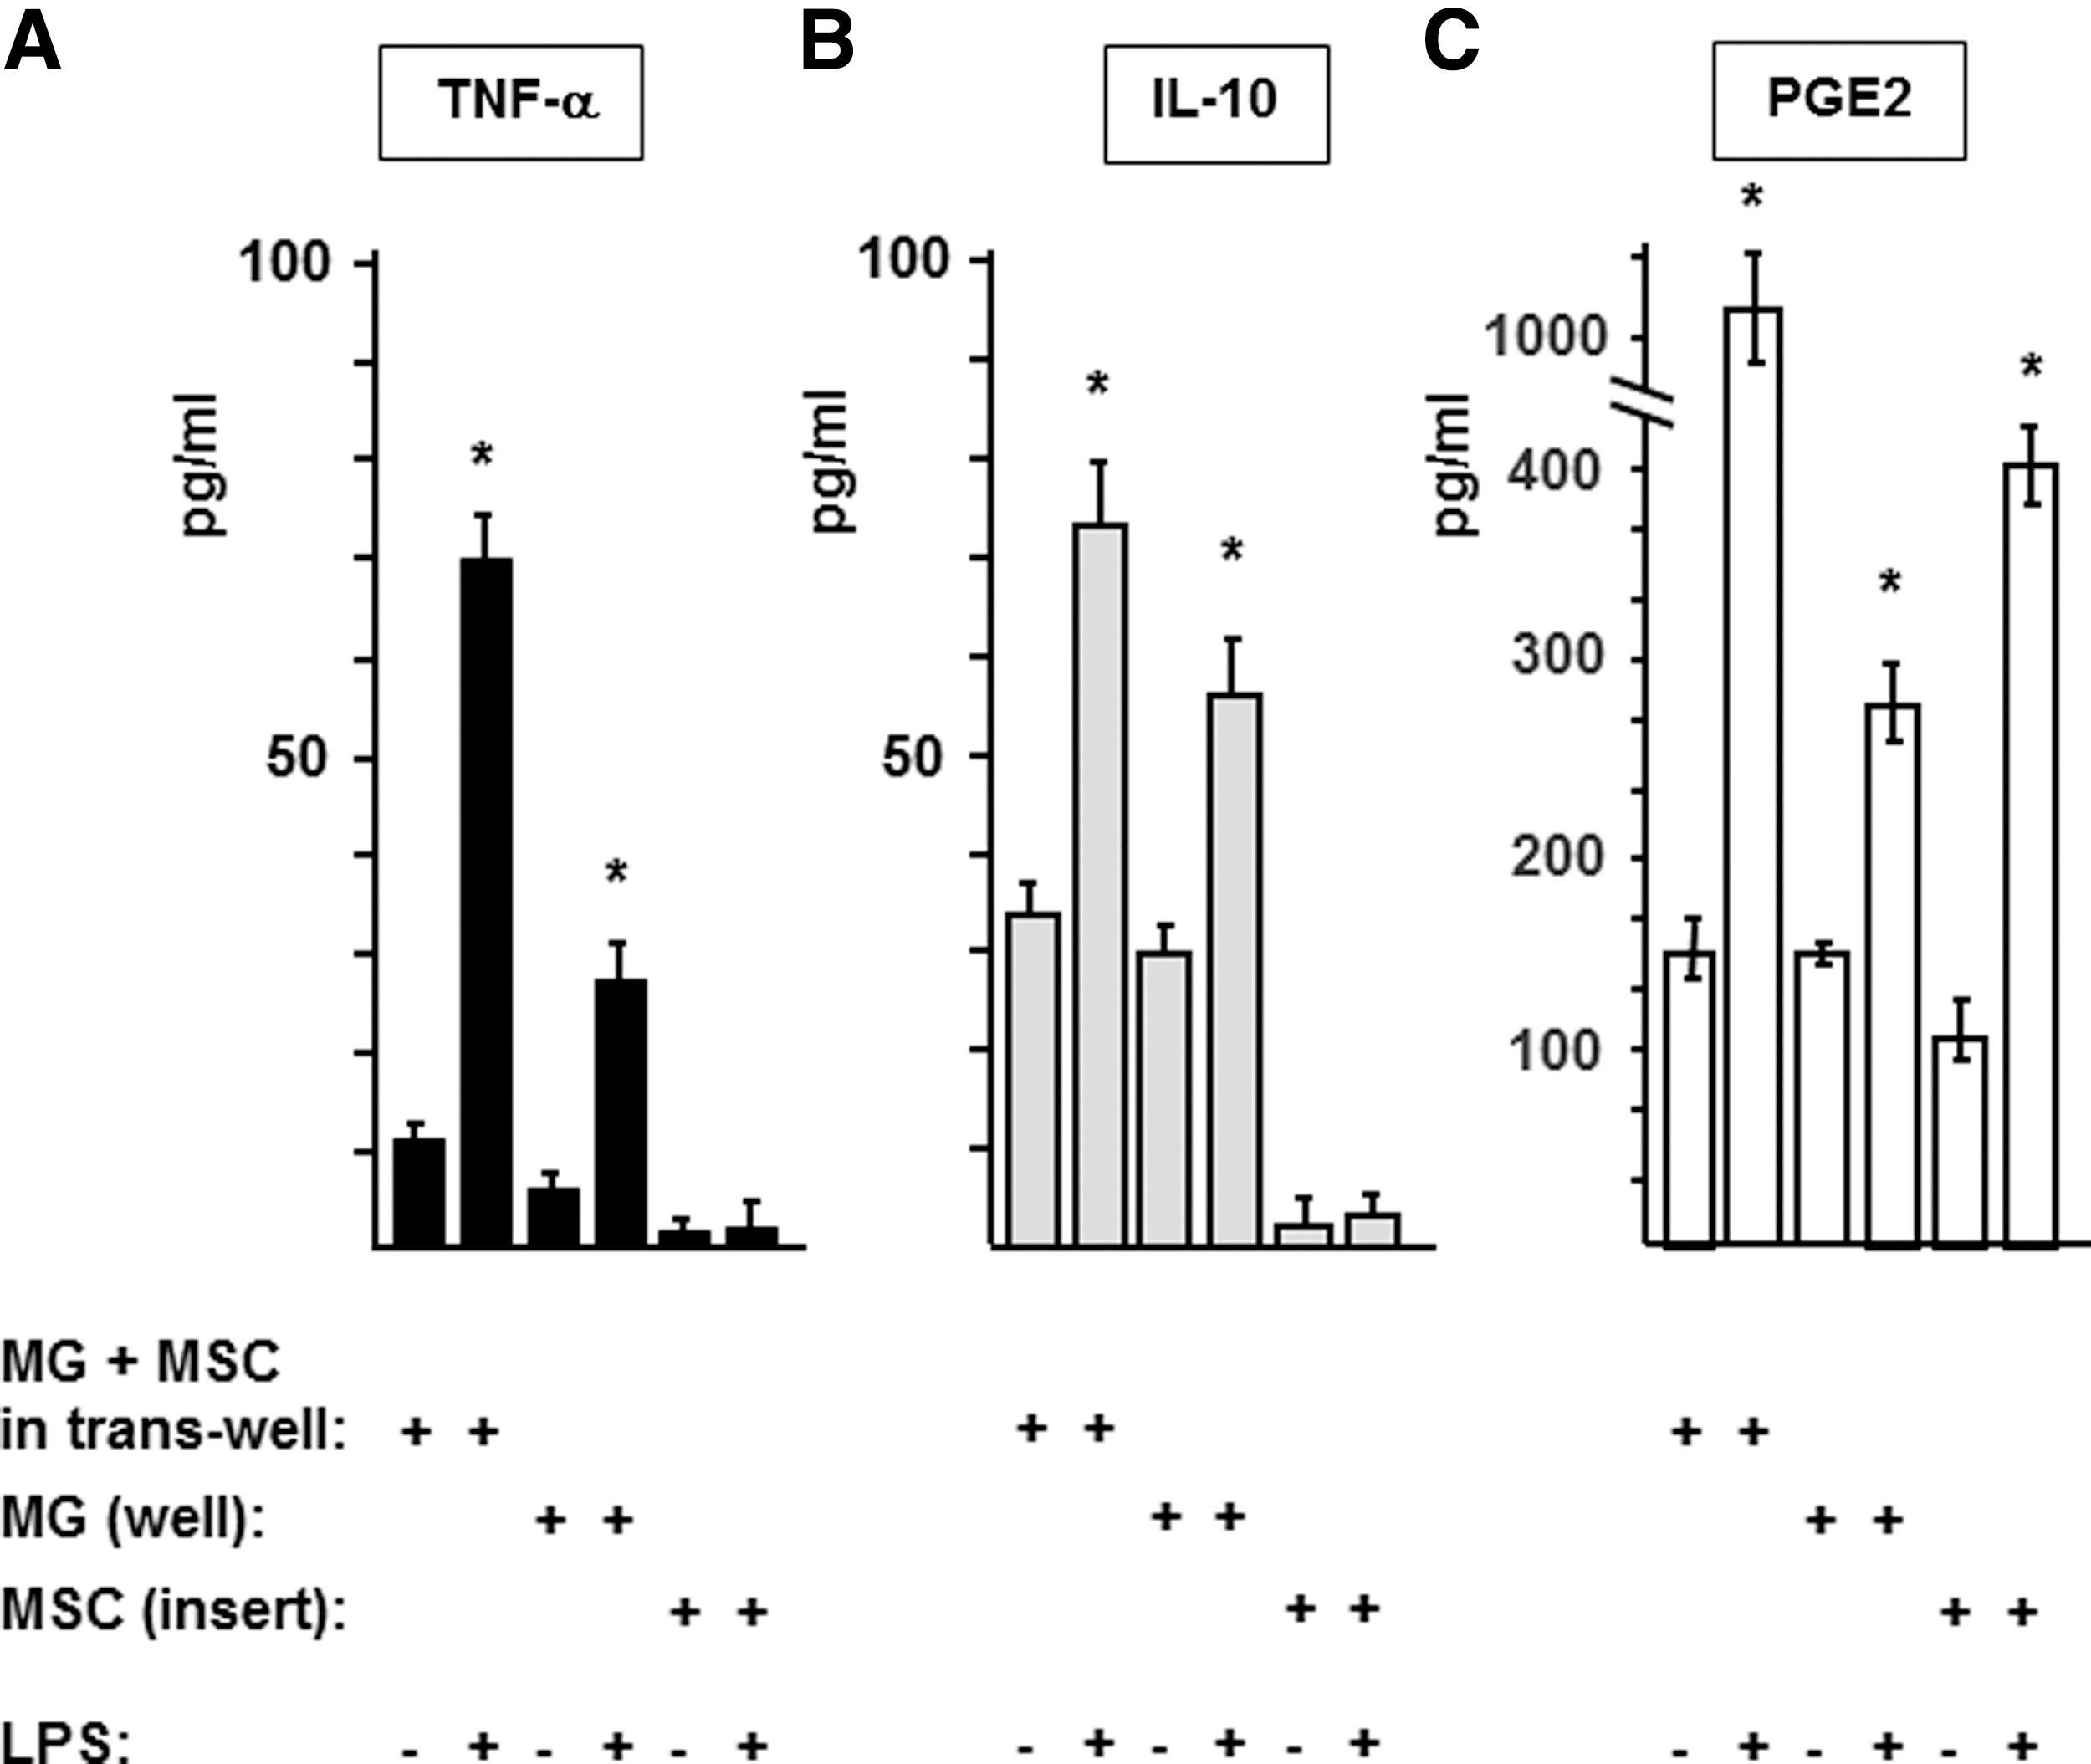
Cytokines are mainly produced by microglia in the two-step transwell culture system. To clarify the identity of mediator producing cell(s) in the MG–MSC cocultures, MGs (105/well) and MSCs (104/well) were coincubated in the transwell for 48 h in the presence or absence of 10 μg/mL LPS; then, the culture media was replaced. In half of the samples, the two cell types remained together in the same wells (MG+MSC in trans-well); whereas in the other half of the samples, MSC-containing inserts were transferred to new, empty wells [MSC (insert)] and, thus, separated from the MGs that stayed in the original wells [MG (well)]. After an additional 24 h of incubation, we collected samples from the supernatants and measured the concentrations of TNF-α
Since recent data showed that PGE2 signaling plays an important role in the regulation of IL-10 secretion by phagocytes [12,43], next we compared the kinetics of IL-10 and PGE2 production in MG–MSC cocultures after 4, 24, 48, and 72 h of incubation. We observed that levels of PGE2 significantly increased in the coculture medium during the first 24 h of coculture (MG+MSC), and were further enhanced in response to LPS (MG+MSC+LPS) (Fig. 5B). The presence of MSCs could upregulate the production of IL-10 by MGs in both the presence and absence of LPS (MG and MG+LPS), but only during the second and third days of coculturing (Fig. 5A). The data suggested that PGE2 could be an inductor of microglial IL-10 secretion in MG/MSC cocultures.
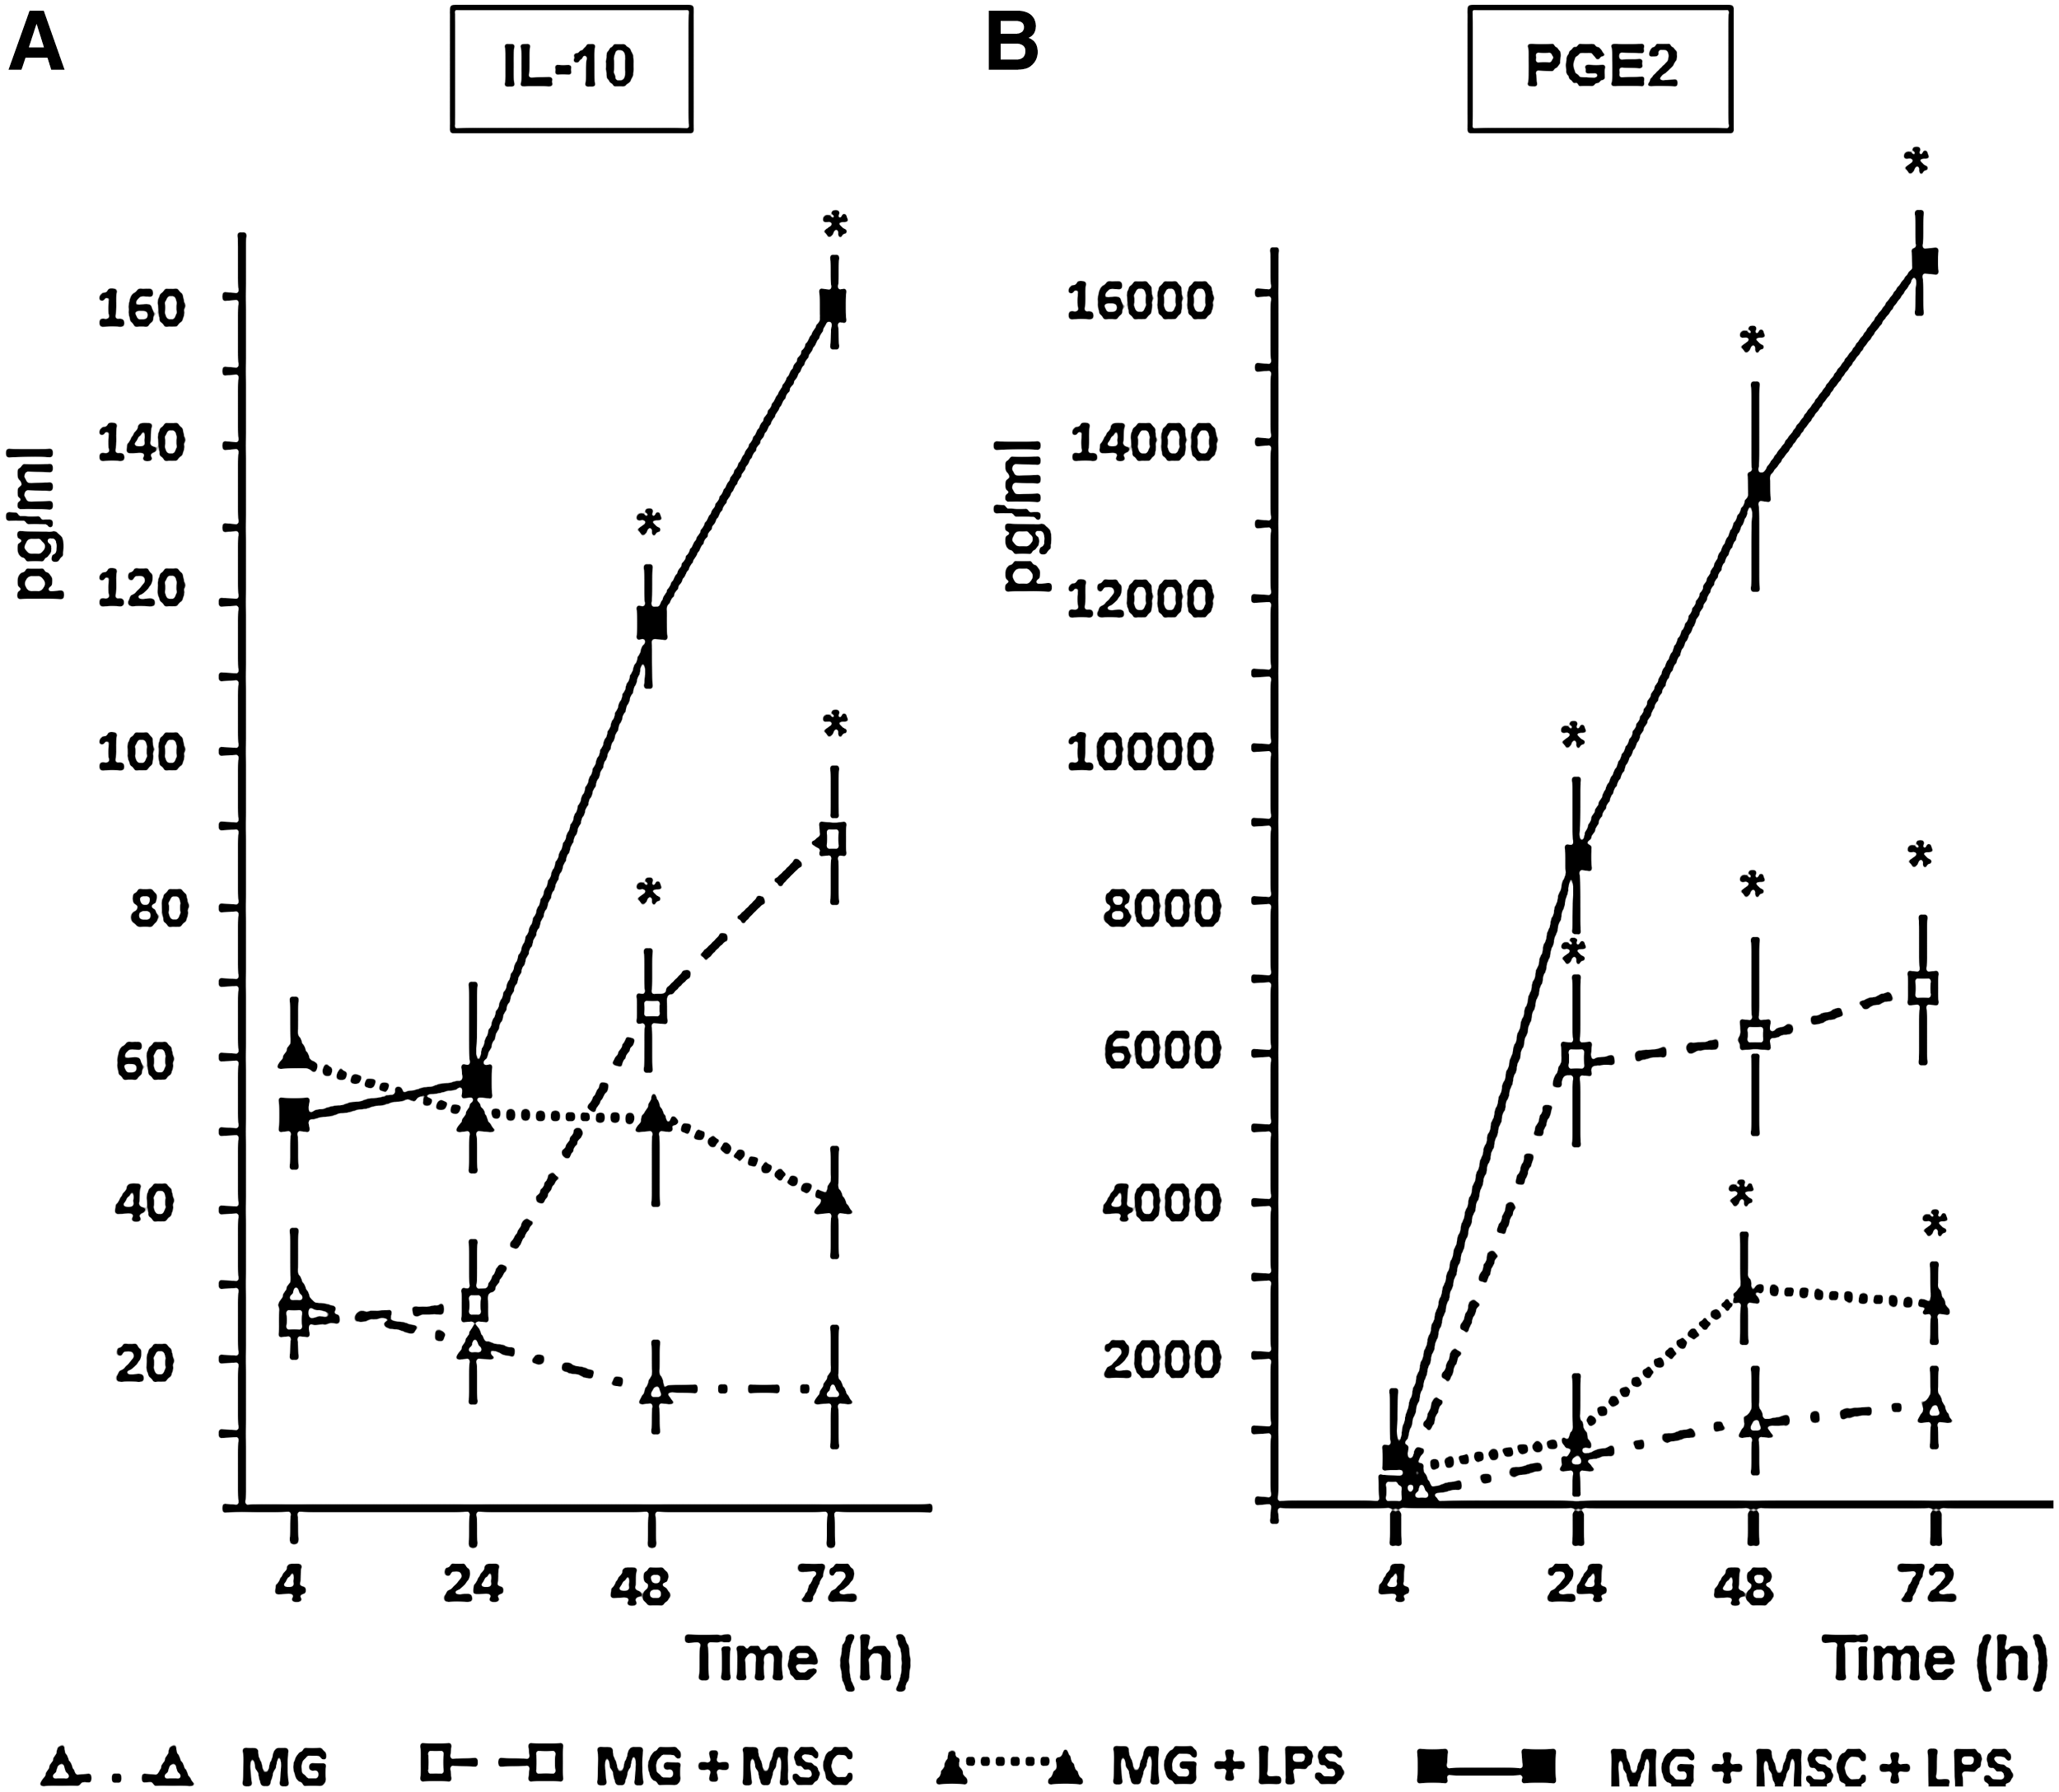
The time kinetic analysis indicates a connection between PGE2 and IL-10 production. MGs (105/well) were cultured alone or with MSCs (104/well) in the presence or absence of 10 μg/mL LPS in the indicated combinations. Supernatants were collected after the 4th, 24th, 48th and 72nd hours of incubation. The amounts of IL-10
MSCs increase arginase 1 and MCP-1 expression in MGs
Since arginase 1 (Arg1) is known as a marker of alternatively activated phagocytes, we assessed whether the presence of MSCs could change the microglial expression of the enzyme [44]. As shown in Fig. 6A, the Arg1 mRNA expression was markedly upregulated by MSCs (MG+MSC) if compared with the levels observed in mono-cultures of either MGs or MSCs. The presence of MSCs induced a similar (more than threefold) enhancement of the Arg1 gene expression in LPS-stimulated MGs (MG+MSC+LPS). The presence of MSCs increased the Arg1 expression in MGs even if contact communication was prevented by cocultivating the cells in transwell dishes. In contrast, LPS stimulation reduced the Arg1 expression of MGs in both mono- and noncontact (trans-well) cocultures.

MSCs increase Arg1 and MCP-1 expression in MGs. MGs (105/well) were cultured alone or with MSCs (104/well) in the presence or absence of 10 μg/mL LPS in cocultures or in a transwell arrangement for 5 h. RNA samples were isolated using Trizol reagent. After purification and reverse transcription, real-time PCR was performed. The figure shows fold changes in the expression of Arg1
Interestingly, the presence of MSCs significantly (by about 2.5-fold) upregulated the transcription of MCP-1/CCL2 (Fig. 6B), a chemokine involved in leukocyte recruitment [45]. Moreover, the relative MCP-1/CCL2 mRNA levels increased further (to about 4.0-fold), if LPS was added to the cocultures. The effect of MSCs on LPS-activated MGs was slightly attenuated when the cells were separated in transwell dishes. LPS alone (MG+LPS) could induce only a 1.5-fold increase in the MCP-1/CCL2 expression in microglia. Similar results were obtained when Arg1 and MCP-1 concentrations were measured in the culture supernatants by quantitative ELISA (Fig. 6C, D).
MSCs exert opposite effects on IL-1β and NALP3 expression of microglia
Since previous data [35] demonstrated an elevated IL-1β production by LPS-stimulated MGs in the presence of MSCs, we assessed whether MSCs have an impact on the transcription of IL-1β and NALP3 in resting and LPS-stimulated microglia. We found that IL-1β mRNA-level in MGs was similarly (seven- to eightfold) enhanced in the presence of LPS or MSCs (Fig. 7A, MG+LPS and MG+MSC). When MGs and MSCs were cocultured in the presence of LPS, however, the IL-1β expression dramatically increased (by about 40-fold), indicating that the endotoxin and stem/stromal cells act synergistically in activation of microglial IL-1β mRNA expression. In contrast, the level of IL-1β protein in the supernatants was increased by only fourfold under identical conditions (Fig. 7B). LPS also increased the expression of NALP3 mRNA (Fig. 7C, MG+LPS). In contrast to the synergism in IL-1β regulation, however, the presence of MSCs resulted in a significant downregulation of NLRP3 gene expression in MGs, in both the presence (MG+MSC+LPS) and absence (MG+MSC) of LPS. This effect of MSCs was also confirmed in a transwell system. The data indicated that MSCs exert opposite effects on IL-1β and NALP3 mRNA expression by MGs and that the net IL-β protein secretion is a result of these opposite effects.
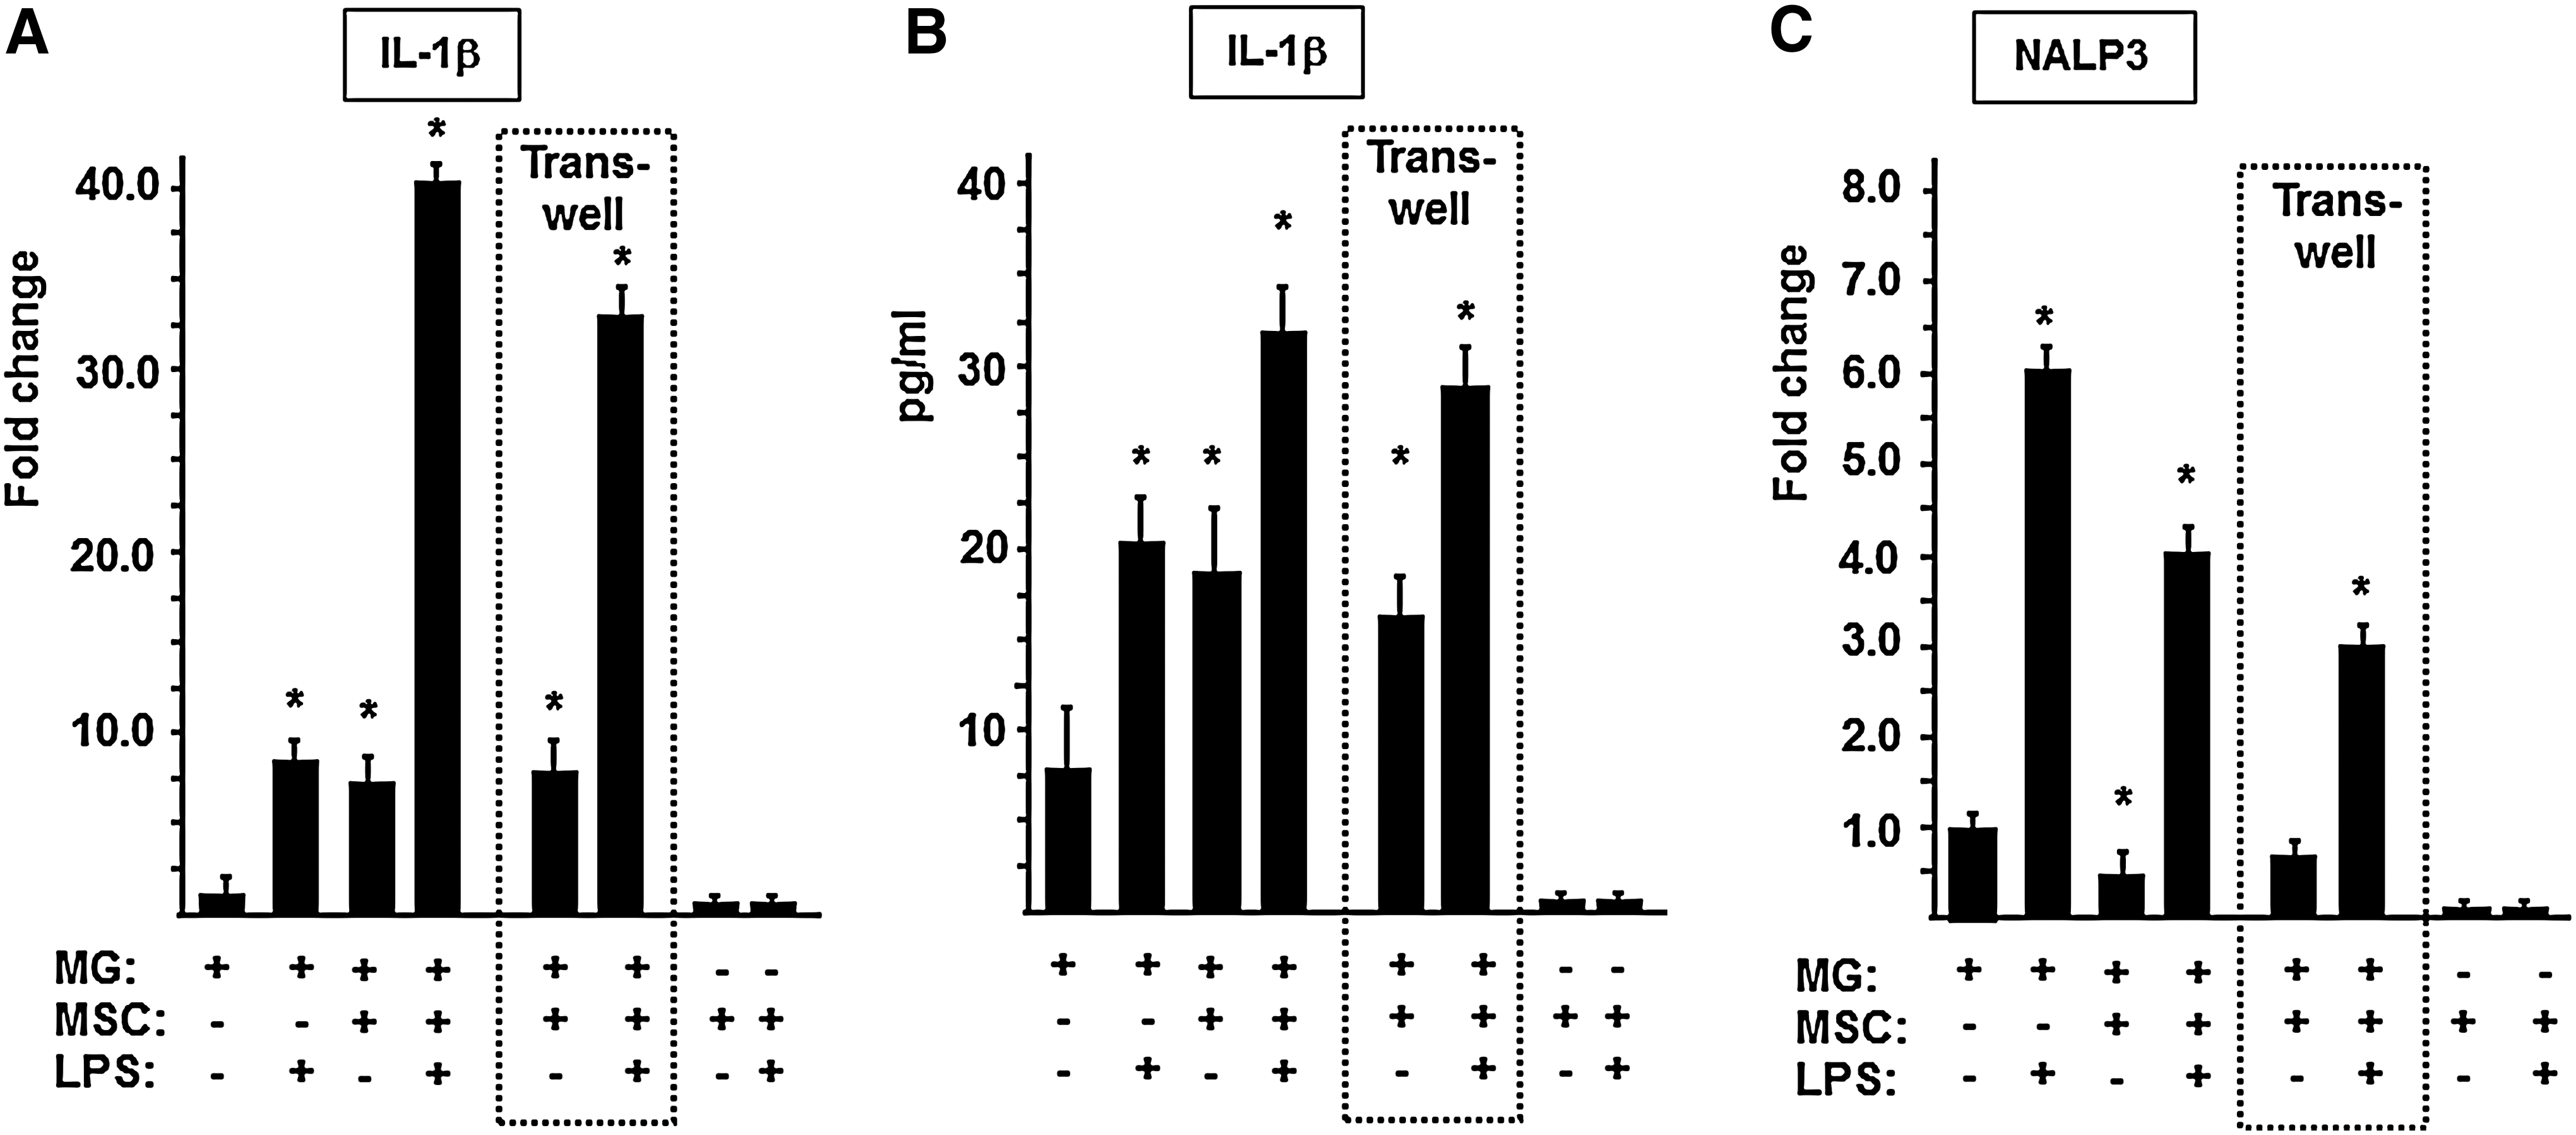
MSCs have an opposite effect on the expression of IL-1β and NALP3 by microglia. MGs (105/well) were cultured alone or with MSCs (104/well) in the presence or absence of 10 μg/mL LPS in cocultures or in a transwell arrangement for 5 h. RNA samples were isolated using Trizol reagent. After purification and reverse transcription, IL-1β
MSCs enhance the antigen-presenting capacity of MGs toward in vivo preactivated T lymphocytes
To investigate whether microglial antigen-presenting ability was modulated by MSCs, we analyzed their capacity to induce proliferation of in vivo OVA primed T lymphocytes in the presence or absence of MSCs. To this end, T cells (95% CD3+) were purified from the inguinal and popliteal lymph nodes of mice immunized with a mixture of OVA and CFA 7 days earlier, and cocultured with MGs (104 cells/well), or MGs and MSCs (103 cells/well) in the presence of 4, 20, and 100 μg/mL OVA, respectively. As shown in Fig. 8A, MGs were able to induce antigen-specific T-cell (2×10⁵ cells/well) proliferation in a dose-dependent manner when soluble OVA was also present in the cultures. Surprisingly, when MSCs were also added to the system, T-lymphocyte proliferation induced by the OVA-presenting microglia significantly increased (about twofold) compared with the control (T-cell+MG+OVA) cultures. In addition, the percentage of CD4+CD25highFoxp3+ (regulatory) T cells also slightly but reproducibly increased in the cocultures (1.15±0.12 vs. 1.63±0.21, P<0.05, n=5) (Supplementary Fig. S3). MSCs alone, however, were unable to induce expansion of OVA-specific T lymphocytes. In contrast, the same MSCs could markedly inhibit mitogen- (ConA) and alloantigen-induced (MLR) T-cell proliferation (Fig. 8B, C) at an identical (1:20) MSC: T lymphocyte ratio, as expected. Thus, MSCs seem to be able to enhance the antigen-presenting ability of MGs in cocultures where activated T cells are present.

MSCs enhance the antigen-presenting capacity of MGs. represents T cells alone,  shows MSC+T-cells,
  indicates MG+T-cells, while
  symbolizes MG+MSC+T-cells. The results represented in cpm are shown in the form of mean±SD of triplicate (*P<0.05 compared with control).
To further validate these results, we measured whether MSCs affect the expression of MHC class II antigen and/or CD86 by MGs in coculture. We found that MSCs did not modify significantly MHC class II antigen expression on the surface of MGs (data not shown), whereas the expression of costimulatory CD86 molecules was significantly upregulated. The percentage of CD86+ MGs, as well as the mean fluorescence intensity, that is, the surface density of CD86 molecules on the microglia were increased in the presence of MSCs (72.3%±4.8% vs. 94.1%±4.3%, P<0.05 and 63.8±5.1 vs. 127.5±6.7, P<0.001, n=3) (Fig. 8D). In addition, neither MHC class II nor CD86 expression by MSCs was observed under any culture conditions used in this work (data not shown). This suggests that MSCs are able to regulate the antigen-presenting ability of microglia by increasing their costimulatory molecule (CD86) expression.
Discussion
MGs are specialized tissue macrophages of the CNS that continuously survey their environment with highly motile extensions. In contrast to neurons and macroglial (astro- and oligodendroglia) cells, MGs are of hematopoietic origin and play crucial roles in the defense of CNS tissue integrity. The activated microglia can adopt an “amoeboid” phenotype and produce an enormous array of pro-inflammatory mediators, including cytokines, chemokines, and reactive oxygen species, that contribute to the clearance of pathogens and damaged cells. Prolonged or excessive MG activation, however, could result in pathological forms of inflammation that contribute to the progression of several CNS diseases [46]. In this study, we prepared MGs from the brain of newborn (1–3 days old) mice to investigate their morphology, phenotype, phagocytic activity, pro- and anti-inflammatory mediator production capacity, and antigen-presenting ability in the presence or absence of activating stimuli and then examined how these are regulated by MSCs.
We found that MSCs are able to alter the ratio of IL-10 and TNF-α in favor of the anti-inflammatory cytokine IL-10 in the culture supernatants of MGs on LPS stimulation and under yeast cell or apoptotic thymocyte ingestion. Moreover, the amount of PGE2 changes in a parallel manner with IL-10 in the cocultures. Spatial separation of MGs and MSCs in the transwell slightly ameliorates, but does not eliminate this effect of MSCs. This is consistent with earlier reports indicating that MSCs can shift MGs from an inflammatory (M1-like) into an anti-inflammatory (M2-like) phenotype [26,31,36] mainly through COX-2 mediated production of PGE2 and possibly some other soluble factors [35,37]. Similar PGE2-mediated interaction was also described between other tissue macrophages and MSCs in vitro [12], as well as in vivo [43]. In addition, the MSC-induced shift in microglia polarization was further affirmed by the fact that MGs express a high amount of Arg1, another molecule typical for M2-like phagocytes, regardless of the presence or absence of LPS in the cocultures. It is noteworthy that our findings differ from those reported by Tseng et al. [38], because in their work MSCs did not affect the expression of Arg1 by microglia. The discrepancy between studies by Tseng et al. [38] and those in our work could be explained by differences in the source of MGs (rat vs. mouse) and the concentration of LPS (100 ng/mL vs. 10 μg/mL) used in the cocultures.
More importantly, we could clearly see that MSCs themselves are able to induce some kind of microglia activation without any further stimuli. MGs had a larger-sized (“amoeboid” phenotype), increased phagocytic activity, and mannose receptor (CD206) expression in the presence of MSCs compared with MGs cultured alone. This is consistent with the study by Kim and Hematti [26] showing that human MSCs can increase the phagocytic activity and the expression of CD206 molecules by monocyte-derived macrophages. MSC-stimulated phagocytosis of apoptotic cells and zymosan particles by other tissue macrophages was also observed by Maggini et al. [12] and Zhang et al. [27], respectively. Moreover, we also found a significant amount of soluble mediators, especially IL-10 and PGE2, in the supernatants of MGs cocultured with MSCs. Concomitantly, a low level of TNF-α production was also observed. These data, along with the MSC-induced expression of Arg1 enzyme by microglia (see Fig. 6.), indicate that stem/stromal cells are indeed able to induce an MG phenotype with several characteristics of alternatively activated (M2) phagocytes without any additional pro-inflammatory stimuli. The real picture, however, is much more complicated. A relatively high amount of two pro-inflammatory mediators, MCP-1/CCL2 and IL-1β, are also expressed by MGs on MSC coculture. We can only speculate that due to the fact that mononuclear phagocytes with various phenotypic polarization are crucial for tissue repair and regeneration [47,48], the MCP-1/CCL2-induced microglia accumulation at the site of tissue injury or inflammation could have a beneficial effect on the repair process. On the other hand, the IL-1β secretion by MGs in the presence of stem cells is consistent with an earlier report [35] and could be explained by two facts. First, IL-1β, as a powerful pro-inflammatory cytokine, is involved in the “licensing” of MSCs necessary to exert their immunosuppressive properties [7]. Second, based on a recent report, it could also be a growth factor for stromal cells in vitro as well as in vivo [49]. Interestingly, however, MSCs have an opposite effect on the expression of NALP3 that are specific mRNAs in MGs, especially when LPS is also present in the cocultures. Thus, the net amount of active IL-1β protein secreted by microglia is always limited in the presence of MSCs. The reason to keep the expression level of NALP3 relatively low in MGs is not yet clear but might be explained by the cytokine-independent effects of the inflammasome under conditions of cellular stress. Too high an NALP3 level could be dangerous for microglia by inducing pyroptosis, a caspase-1-dependent form of programmed cell death [50]. In line with this, Licandro et al. [51] recently suggested that NALP3 modulates a number of signal pathways involved in DNA damage response and apoptosis.
Finally, the most intriguing aspect of this study is the enhanced proliferation of in vivo primed, antigen-specific T lymphocytes in MG–MSC cocultures, that is, the increased antigen-presenting ability of microglia on MSC coculture. Notably, MSCs are able to increase the expression of costimulatory molecule CD86, but not MHC class II antigens by MGs in our experimental settings. This property of MSCs is surprising, because several earlier reports indicated their opposite effect on the antigen-presenting ability of dendritic cells [52,53]. Moreover, when thyoglicolate-elicited mouse peritoneal macrophages were cocultured with MSCs in the presence of LPS, impaired antigen presentation and reduced surface expression of MHC class II, CD80, and CD86 molecules were observed [12]. Maggini et al. [12], however, measured primary T-cell response using CD4+ splenocytes derived from an OVA-specific T-cell receptor transgenic (OT-II) mouse. GM-CSF-treated human monocytes also showed reduced CD40, CD80, and CD86 expression, but increased MHC class II expression in the presence of MSCs [54]. By contrast, a previous work has demonstrated that MSCs do not inhibit T-cell proliferation when they are added to recall antigen-stimulated human peripheral blood mononuclear cells in vitro [55]. In addition, mouse MSCs are able to augment naive CD4+, as well as CD8+ T-cell proliferation through the MCP-1/CCL2–CCL2 receptor pathway when a low MSC:T-cell ratio (1:10) is used in the cultures [56]. Moreover, apart from the effects on antigen-presenting ability and CD86 expression of microglia, MSCs also slightly increased the ratio of CD4+CD25highFoxp3+ (regulatory) T-cells in the cocultures, another well-established function of these stem/stromal cells in vitro [57,58] as well as in vivo [59]. Therefore, we suggest that these conflicting results might be explained by differences regarding cell types (microglia vs. peritoneal macrophage; naïve vs. antigen-experienced T cell), cell source (mouse vs. human), and the presence or absence of additional pro-inflammatory stimuli (eg, LPS) in the cocultures.
In conclusion, we found that MSCs induce a mixed microglia phenotype defined as Arg1-high, CD86-high, CD206-high, IL-10-high, PGE2-high, MCP-1/CCL2-high, IL-1β-moderate, NALP-3-low, and TNF-α-low cells. These MSC-elicited MGs have high phagocytic activity and antigen-presenting ability. LPS is able to shape this MG phenotype quantitatively, but not qualitatively in the presence of MSCs. This unique polarization state resembles a novel regulatory microglia phenotype, which might contribute to the resolution of inflammation and to tissue repair in the CNS.
Footnotes
Acknowledgments
The authors thank László Barna, the Nikon Microscopy Center at IEM, Nikon Austria GmbH, and Auro-Science Consulting Ltd. for kindly providing microscopy support. This work received financial support from the program no. KTIA_AIK_12-1-2012-0025 (Hungary).
Author Disclosure Statement
The authors have no conflicting financial interests.
References
Supplementary Material
Please find the following supplemental material available below.
For Open Access articles published under a Creative Commons License, all supplemental material carries the same license as the article it is associated with.
For non-Open Access articles published, all supplemental material carries a non-exclusive license, and permission requests for re-use of supplemental material or any part of supplemental material shall be sent directly to the copyright owner as specified in the copyright notice associated with the article.