
Abstract
For evaluation of cell therapy strategies using human mesenchymal stem cells (hMSCs), it is important to be able to trace transplanted cells and their distribution in tissues, for example, cartilage, over time. The aim of the study was to determine effects on cell viability, traceability, and chondrogenic differentiation of hMSCs after iron labeling with iron sucrose. hMSCs were collected (seven donors, 13–57 years) from patients undergoing spinal surgery. Two subsets of experiments were performed. (1) Iron labeling of hMSCs: 1 mg/mL of Venofer® (iron sucrose) was added (16 h) to cultures. hMSCs were examined for uptake of iron sucrose (Prussian blue staining) and cell viability (flow cytometry). (2) Iron-labeled hMSCs (passage 4) (n=4, pellet mass), 200,000 cells/tube, were cultured (DMEM-HG) with 10 ng/mL TGFβ and compared with controls (from each donor). The pellets were harvested at days 7, 14, and 28. Real-time PCR, IHC, and histology were used to evaluate SOX9, ACAN, C6S, and COL2A1 expression. Mean number of cells containing iron deposits was 98.1% and mean cell viability was 92.7% (no significant difference compared with unlabeled control cells). Pellets containing iron-labeled cells expressed COL2A1 on protein level (all time points), in similar levels as controls, and glycosaminoglycan accumulation was observed in iron-labeled pellets (day 14 or day 28). Results were supported by the expression of chondrogenic genes SOX9, ACAN, and COL2A1. The results in vitro indicate that iron sucrose can be used as a cell tracer for evaluation of cellular distribution in vivo after transplantation of MSCs and thus contribute with important knowledge when exploring new treatment strategies for degenerated cartilaginous tissues.
Introduction
A
In recent years, stem-cell-therapy-based methods have been discussed as alternative or complementary treatment options for cartilaginous tissue disorders, including intervertebral disc (IVD) degeneration. In general, cartilage is considered to lack or has a poor capacity of self-repair. However, in the IVD, minor self-repair processes have been observed, especially in the outer rings of the annulus fibrosus (AF) [6 –8]. In the inner part of the AF and in the nucleus pulposus, no clear regeneration capacity has been reported [8,9]. For the evaluation of new cell therapy strategies, for example, transplantation of MSCs into degenerated IVDs, it would be of interest to be able to trace the transplanted cells in order to learn how the transplanted MSCs adapt to their new environment. It would be an advantage to be able to examine localization, migration, and function of the transplanted cells and to examine the transplanted cells and their distribution in the IVD tissue of the recipient. However, there is a gap of knowledge regarding the effects of iron labeling on MSCs, regarding cell viability, traceability, and the MSC differentiation capability into the chondrogenic lineage. Further, the major part of fluorescent cell tracers is only traceable for a short time period and not approved for clinical use. Iron is important in several physiological functions in mammals, including oxygen transfer. It is an important cofactor in several enzymes in a variety of different organisms, animals, as well as in plants. In humans, iron deposition mainly takes place in erythrocytes and myocytes by binding of iron to hemoglobin and myoglobin, respectively. The total-body iron content of an adult human ranges from 2 to 4 g, where about two‐third of this amount is bound to circulating hemoglobin molecules and one‐third is stored in the reticuloendothelial system (liver, spleen, and bone marrow) [10,11]. Only about 0.1% of the total iron pool is present in the peripheral blood circulation (plasma) where it is bound to transferrin, an 80-kDa glycoprotein that is synthesized in the liver. The Fe3+–transferrin complex is taken up by cells by active transport over the cell membrane [10,12,13]. Other mechanisms of uptake of iron compounds over the cell membrane into the cytoplasm include endocytosis and phagocytosis [10,12,14].
Previously, superparamagnetic iron oxides (SPIOs; eg, Endorem®) that are nontoxic have been used clinically for the detection of tumor metastases in the lymphatic system with the use of magnetic resonance imaging (MRI). Further, SPIOs have been used for labeling of cells in in vitro (human and animal cells) [14 –17] and in vivo experiments (animal models) [14,18 –20]. It has been demonstrated that SPIOs do not influence MSC differentiation into the osteogenic and/or adipogenic lineage [19,21 –23]. The SPIO Endorem, a clinically approved SPIO nanoparticle cell tracer, is no longer commercially available on the market. There are limited clinically approved iron nanoparticles that can be used for evaluation of human cell therapies. This makes it interesting to investigate other nontoxic iron compounds as important tools for and potential cell tracers in vitro and in animal models prior to development of human cell therapies. If a good outcome is obtained in preclinical experiments, then such a cell tracer may potentially be used in cell therapy applications for humans. In this study, the potential capability of iron sucrose (Venofer®) to be used as a cell tracer was investigated. Venofer® is a pharmaceutical clinically approved drug commonly used for patients with iron deficiency [11,24] and the potential capability of this iron compound to be used as a cell tracer was investigated. Venofer consists of iron (III)-hydroxide cores that are superficially surrounded by a large number of noncovalently bound sucrose molecules resulting in a molecular complex with the molecular mass of ∼34–60 kDa [25]. The iron in this molecular complex is bound in a similar structure as physiologically occurring ferritin (intracellular storage form of iron in humans). Most cell types (mammalian) have transferrin receptors (CD71) that bind to the iron–transferrin molecule. The transferrin–iron complex is then incorporated into the cytosol by endocytosis [10,26] and stored in the cytosol and mitochondria as ferritin [12,26].
For induction of chondrogenic differentiation of MSCs, the pellet mass three-dimensional (3D) cell culture system was used. This 3D cell culture system is commonly used [15,27] for the differentiation of MSCs into chondrocytes and/or chondrocyte-like cells [15,28]. The pellet mass cell culture system provides an essential microenvironment for chondrocyte differentiation and mimics several different phases in chondrogenesis [28,29]. It has been reported that cartilage formation in pellet mass cultures shares similarities with native cartilage regarding, for example, gene expression, cellular distribution, and extracellular matrix (ECM) composition [30,31].
For MSC profiling and monitoring of differentiation of the MSCs, a set of accepted markers for MSCs was used: CD105 (endoglin), a transmembrane cell surface protein associated with, for example, human bone marrow stem cells [32 –34], and CD166 (ALCAM), a transmembrane glycoprotein that is a member of the immunoglobulin super family of proteins, commonly used in MSC profiling [35 –37]. Further, the MSCs should be able to differentiate into osteoblasts, chondrocytes, and adipocytes under standard differentiation in in vitro conditions [27,33,36,38]. Sex determining region Y-box 9 (SOX9) is a transcription factor and a key regulator in chondrogenesis. SOX9 is expressed during the chondrogenesis and, under the influence of SOX9, the prechondrocytes start to produce collagen type II, which is a major component of the ECM in cartilage [39 –41]. Proteoglycans, such as aggrecans, are common components of the ECM that bind to glycosaminoglycans. The most commonly found glycosaminoglycan in mature cartilage is chondroitin-4-sulfate. Chondroitin-6-sulfate (C6S) is a glycosaminoglycan present in newly synthesized ECM of cartilaginous tissues [42 –45].
The aim of the study was to determine the effects of labeling with iron sucrose on cell viability and chondrogenic differentiation of human MSCs.
Materials and Methods
Human cells, isolation of human MSCs, and monolayer cultures
An overview of the experimental design and analyses is shown in Fig. 1.
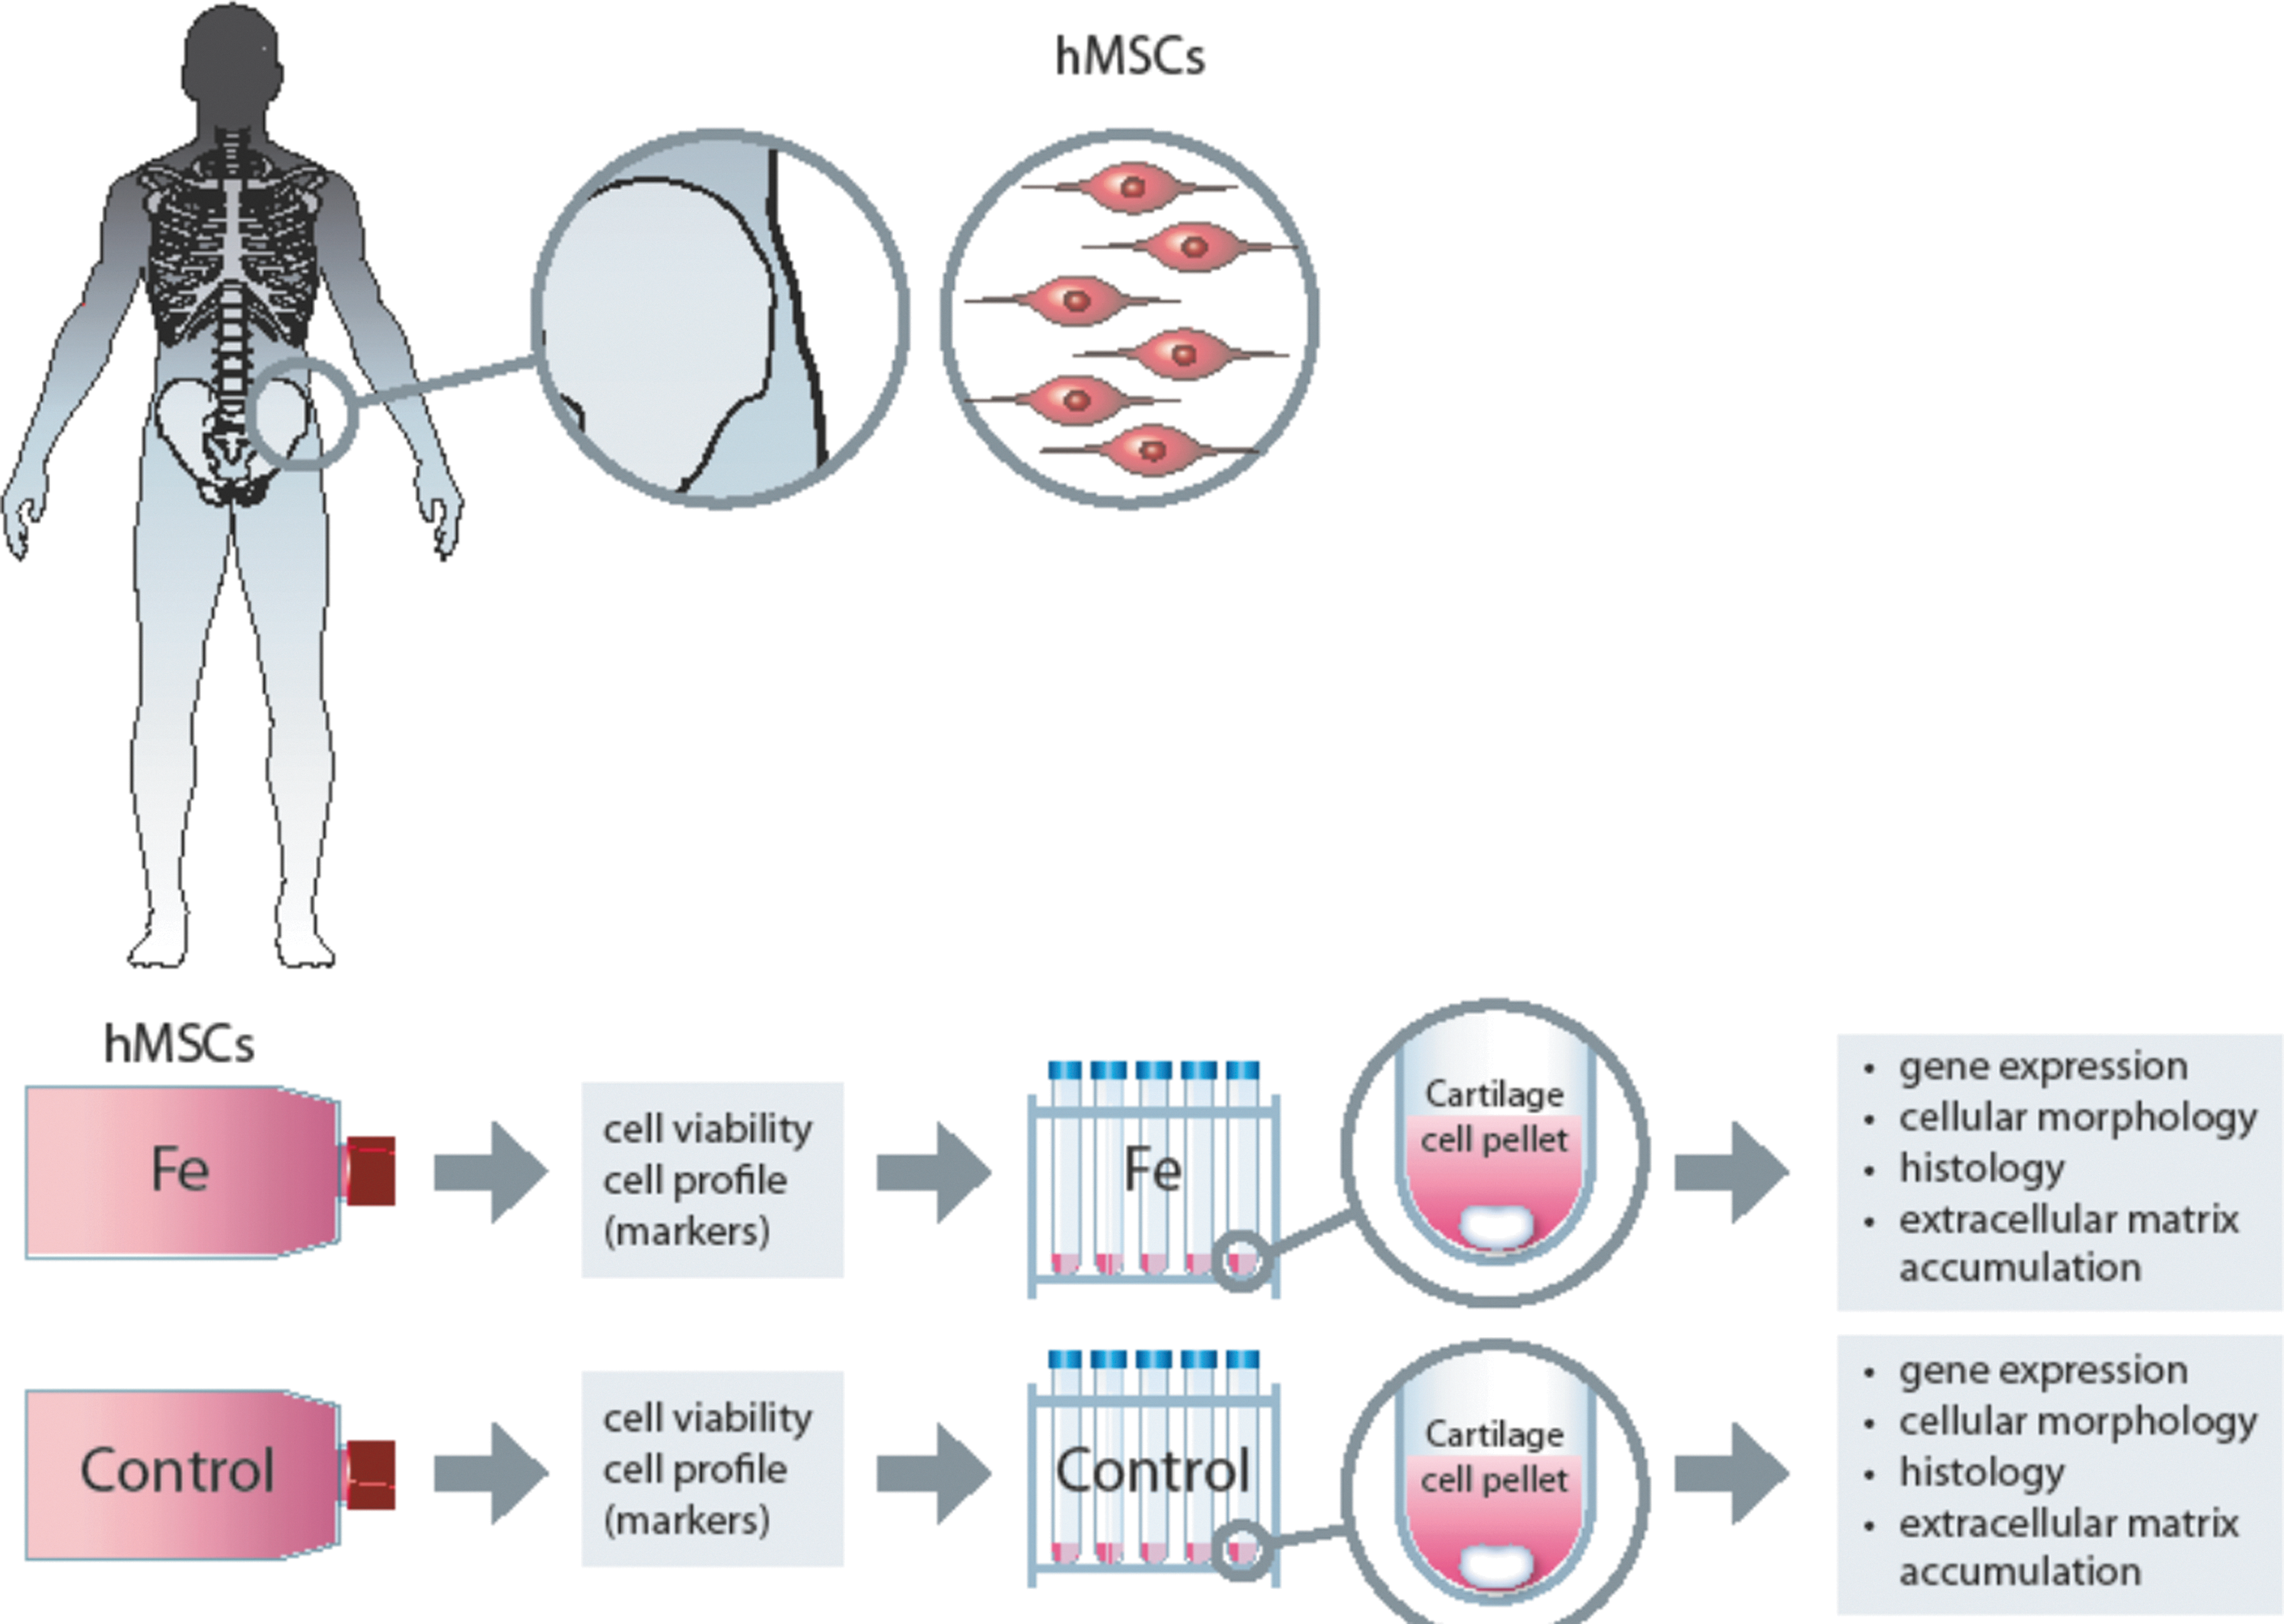
A schematic overview of the experimental design. Upper row displays the harvest site of the mesenchymal stem cells (MSCs) from the bone marrow (iliac crest) and the enlarged images to the right show iliac crest and the MSCs. Lower row displays the experimental design, cell pellet cultures, and the analyze methods performed on the iron-labeled cell pellets and the noniron-labeled control pellets. Control pellets were cultured simultaneously from each donor, respectively. Duplicate cell pellet cultures were made.
All experiments were approved by the regional human ethics committee, Vastra Gotaland region, Sweden (ethical permission number 532-04) and the samples were collected after informed consent was obtained from all the patients.
MSCs were collected by bone marrow aspiration (iliac crest) during surgery from seven donors and were isolated from the bone marrow aspirate by centrifugation in cell preparation tubes (Ficoll; Becton Dicksson). The MSCs were thereafter seeded in cell culture flasks (NUNC) at the concentration of 200×103/cm2 and expanded in Dulbecco's modified Eagle's medium, with low-glucose (DMEM-LG) (Invitrogen). The medium was supplemented with 2 mM
Flow cytometry analysis: human MSC profiling
In order to verify the phenotype of the MSCs, the MSCs were analyzed by flowcytometry for expression of the markers CD105, CD166, CD34, and CD45 expression using fluoroscein-, phycoerytrin and peridin conjugated antibodies (Ancell). The instrument used for analysis was an FACSaria flowcytometer (BD Biosciences).
Iron labeling of human MSCs
The MSCs (passage 4) were iron labeled as follows: Venofer (20 mg/mL; Luitpold Pharmaceuticals) {[Na2Fe5O8(OH)·3(H2O)]n·m(C12H22O11); iron sucrose, a brown, sterile, aqueous solution was used for labeling the MSCs. Cell media were removed from the cell cultures, the cells were subsequently washed with DMEM-LG (without serum), and thereafter serum-free DMEM-LG with 1 mg/mL Venofer (iron sucrose) was added to the human MSC (hMSC) cultures. The hMSC cultures were then incubated for 16 h in 37°C, 7% CO2, and 93% air.
The dose of 1 mg/mL Venofer was used in the iron labeling of MSCs, which was based on previous studies for iron labeling of cells in cultures [15,46]. For simplicity reasons, the iron sucrose labeling will be hereafter referred to as iron labeling in the text.
Cell viability in cell cultures after iron labeling
Briefly, the cells (5,000 cells per donor) were analyzed for cell viability by incubation for 10 min with 7-aminoactinomycin solution (BD Biosciences) according to the manufacturer's instructions and thereafter analyzed by flow cytometry using an FACSaria instrument (BD Biosciences).
Cytospin preparations
MSCs (in passage 4) were detached, 50 μL of cell suspension from each donor was placed in sample chambers with filters and object glasses, and thereafter the cytospin preparations were centrifuged using a Cytospin 2 instrument (ThermoFisher/Shandon). Duplicate cytospin sample preparations were made from each donor. The object glass with the spun-down cells was then gently air dried, stained, and investigated for iron deposits present in the cells using the Prussian blue reaction/staining (Mallory's method), which was performed according to standard protocols [47,48]. The number of cells containing iron deposits was counted using a light microscope NIKONEqlipse600 (Nikon) and NIS-elements software. Negative controls were noniron-labeled cells that were analyzed according to the same protocol described previously.
Pellet mass cell cultures
After expansion in monolayer, iron-labeled MSCs from four donors (A–D, passage 4) were cultured in the pellet mass culture system [28]. For the pellet cultures, 200,000 cells were pipetted into polypropylene conical tubes (15 mL) containing 0.5 mL of a defined chondrogenic medium consisting of Dulbecco's modified Eagle's medium, with high-glucose (DMEM-HG) (PAA Laboratories) supplemented with 5.0 μg/mL linoleic acid (Sigma-Aldrich), insulin, transferrin, and selenium (Life Technologies); 1.0 mg/mL human serum albumin (Equitech-Bio); 10 ng/mL transforming growth factor (TGF)-(1 (R&D Systems); 10−7 M dexamethasone (Sigma Aldrich); 14 μg/mL ascorbic acid (Sigma Aldrich); and 1% PEST (PAA Laboratories). The cells were centrifuged at 500 g for 5 min and cultured in an incubator (37°C, 7% CO2, 93% air) and the medium was changed twice a week. Duplicate pellet cultures were made and the pellets were harvested after 7, 14, and 28 days. Controls were simultaneously cultured, noniron-labeled pellets from the same donors (n=4).
Preparation of cell pellets for histology and immunohistochemistry
The cell pellets were placed in 4% formaldehyde (Histolab Products AB) and imbedded in paraffin and 5–7-μm sections were prepared. Paraffin sections were deparaffinized with xylene for 2×10 min and rehydrated in 99%, 95%, and 70% ethanol for 5 min in each solution prior to analysis.
Immunohistochemistry
SOX9
Sections of the pellets were deparaffinized and rehydrated as described in the section “Preparation of cell pellets for histology and immunohistochemistry.”
For analysis of SOX9, an antigen retrieval step using 0.1 M sodium citrate buffer (pH 6.0) for 20 min at 90°C was used. Samples were blocked with 2% bovine serum albumin (BSA; Sigma) and 0.5% Triton-X100 diluted in phosphate-buffered saline (PBS) and thereafter a mouse anti-SOX9 antibody (Abcam), diluted 1:500 in PBS-containing blocking solution, was applied to the sections, which thereafter were incubated overnight at 4°C. The primary antibody was visualized using a goat anti-mouse secondary Alexa fluor 546-conjugated antibody (Invitrogen), diluted 1:250, and it was applied to the sections which thereafter were incubated at room temperature (RT) for 2 h. Sections were mounted with Prolong gold antifade media (Invitrogen) containing the nuclear staining compound 4,6 diamino-2 phenylindole (DAPI).
Cell counting: SOX9
Semiquantification was performed of the SOX9-positive cells in pellets. The SOX9-positive cells (yellow color) were counted in one pellet section from each pellet in a defined area measured in the center of the pellets consisting of one field of view (40×objective). Each positive-counted cell was marked with an X (cell count function) in order to avoid double counts using the software NIS elements BR 3.0 (Nikon) and a fluorescence microscope NikonEqlipse600 (Nikon).
Collagen2A1
Immunohistochemical analyses for detection of collagen2A1 accumulation in pellets were performed. Samples were digested with 8,000 U/mL of hyaluronidase (Sigma Aldrich) in PBS (pH 7.4) for 1 h at 37°C and thereafter blocked with 3% BSA (Sigma-Aldrich). Sections were labeled with goat anti-collagen2A1 antibody (Santa Cruz) diluted 1:100 in PBS containing 3% BSA (Sigma-Aldrich) and incubated overnight at 4°C. The primary antibody was visualized using an anti-goat secondary antibody, horseradish peroxidase conjugated (Jackson Laboratory), diluted 1:200, and sections were incubated at RT for 2 h. An enhancement step was performed using the TSA-direct Cy-3 kit (Perkin Elmer) according to the manufacturer's instructions. Sections were mounted with Prolong gold antifade media (Invitrogen) containing the nuclear staining compound 4,6 diamino-2 phenylindole (DAPI).
C6S
Sections of the pellets were deparaffinized and rehydrated as described under the section; preparation of cell pellets for histology and immunohistochemistry.
For analysis of C6S, an antigen-retrieval step using 0.05 U/mL of chondroitinase ABC (Sigma Aldrich) was performed for 1 h at 37°C, blocked with 3% BSA (Sigma-Aldrich), and thereafter a mouse anti-C6S antibody (Millipore), diluted 1:100 in PBS containing 3% BSA (the antibody is directed toward the residual molecular epitopes that are detectable after digestion with chondroitinase ABC), was applied to the sections which thereafter were incubated overnight at 4°C. The primary antibody was visualized using a goat anti-mouse secondary Alexa fluor 488-conjugated antibody (Invitrogen), diluted 1:250, and it was applied to the sections which thereafter were incubated at RT for 2 h.
Sections were mounted with Prolong gold antifade media (Invitrogen) containing the nuclear staining compound 4,6 diamino-2 phenylindole. The sections were then examined for C6S expression using a fluorescence microscope NikonEqlipse600 (Nikon) and NIS-elements software. Negative controls were isotype controls and/or sections incubated with the primary antibody omitted.
Histology of pellets: ECM accumulation and iron staining
The sections were stained for glycosaminoglycans by the Alcian blue Van Gieson staining method [49,50] and for iron deposits as earlier and examined by light microscopy using a microscope NikonEqlipse600 (Nikon).
Isolation of RNA
Two to three cell pellets consisting of iron-labeled or noniron-labeled cells were pooled and placed in RNA later® (Qiagen) and thereafter frozen at −80°C until further analysis. Isolation of RNA was performed by homogenization in RLT lysis buffer (Qiagen) using a Tissue lyser instrument (Qiagen) and the standard protocol for RNeasy Mini Kit (Qiagen).
Quantitative real-time polymerase chain reaction analysis
cDNA was prepared from the pellets from a minimum of 72 ng of total human (n=4) RNA using TaqMan® Reverse Transcription reagents and random hexamer primers (Life Technologies). The temperature program during cDNA synthesis was 25°C for 10 min, 37°C for 120 min, and 85°C during 5 s. Preamplifications were performed with TaqMan PreAmp Master Mix for all samples (Life Technologies). Quantitative polymerase chain reaction (qPCR) analysis was performed using the instrument ABI7900HT (Life Technologies). The following human TaqMan gene expression assays were used: ACAN (proteoglycan, ECM component) (Hs00153936_m1), CD105 (marker for MSCs) (Hs00923996_m1), CD166 (marker for MSCs) (Hs00977641_m1), SOX9 (chondrogenic lineage marker) (Hs00165814_m1), COL2A1 (chondrogenic marker for early ECM synthesis) (Hs00156568_m1), and COL2B (chondrogenic marker, mature ECM) (Hs01064869_m1). qPCR was performed in 20-μL volume for each sample with 10 μL of 2× TaqMan Gene Expression Master Mix and 1 μL of 20× Gene Expression Assays, with temperature program as follows: 50°C for 2 min, 95°C for 10 min succeeded by 95°C for 15 s and 60°C for 1 min during 40 cycles. Samples were analyzed in duplicates and the relative gene expression was evaluated by the 2−ΔΔCt method in GenEx Enterprise 5.2.3.13 (MultiD Analyses). Reference genes used in the analysis were CYCLOPHILIN A (Hs99999904_m1) and CREBBP (Hs00231733_m1).
However, since iron molecular compounds, for example, FeCl3, have been reported to inhibit the activity of polymerases and may therefore disturb the qPCR analysis (and in vivo) [51,52], the gene results are presented only as detected (D/D) or not detected (ND/ND). CT values above 37 were considered not detected (ND/ND).
Statistical analysis
Cell viability of the iron-labeled cells and SOX9 expression in the pellets were examined and compared with noniron-labeled control cells from each donor using the Student's t-test. The profile of MSC surface markers—CD105, CD166, CD45, and CD34—was analyzed and compared with controls using the Student's t-test. A P-value <0.05 was considered statistically significant when comparing iron-labeled cells with noniron-labeled control cells from the same donor.
Results
Flow cytometry: MSC markers
Prior to start of pellet cultures, the cells were iron labeled for 16 h and thereafter the cells were tested for a panel of accepted MSC markers: CD105 and CD166 (markers for MSCs), CD34 (marker for hematopoietic stem cells), and CD45 (marker for leukocytes). In passage 4, the mean values of MSC markers of the cells were as follows: nonlabeled control cells, CD105, 96.0%; CD166, 90.2%; CD45, <10%; and CD34, <10% (n=4), and for the iron-labeled cells, CD105, 70.7%; CD166, 71.9%; CD45, <10%; and CD34, <10% (n=4). There was a significant difference in the CD105 expression (P<0.05) while no significant difference was found in the CD166 (P=0.10), CD45 (P=0.16), or CD34 (P=0.25) expression between the iron-labeled cells when compared with the noniron-labeled control cells (Fig. 2A).

Flow cytometry: cell viability
The mean cell viability for iron-labeled cells was 92.7% and 94.6% for the noniron-labeled control cells (no significant difference when compared with the noniron-labeled control cells) at start of the pellet cultures (n=7, P=0.26) (Fig. 2B, C).
Detection of iron deposits in MSCs after iron labeling
After iron labeling of the cytospin sample cell preparations, the mean number of cells containing iron deposits was 98.1% (n=7). Controls of noniron-labeled MSCs showed no staining (n=7) (Fig. 3).

Images of monolayer cultures and cytospin preparations of one representative donor (male, age 55 years) of
Traceability of iron deposits in the cell pellets
In the iron-labeled cell pellets, deposits of iron compounds were clearly visible as intense blue granulae in the cytosol of the cells and the intracellular iron deposits were relatively evenly distributed in the cell pellets at all time points. The iron-labeled and the noniron-labeled control pellets displayed rounded or nonrounded morphological shapes (n=4) (Fig. 4).
Images in upper row display iron-labeled cell pellets (blue color) from
Expression of chondrogenic lineage marker SOX9
Cells expressing SOX9 were detected in the iron-labeled pellets at all the time points (4/4 donors). The SOX9 expression was more pronounced in the cell pellets at the earlier time points, day 7 and/or day 14 in the iron-labeled pellets and in the noniron-labeled control pellets, compared with cell pellets at day 28 in both groups. No statistical differences were found when comparing the number of SOX9-positive cells in all donors per pellet/section in iron-labeled pellets to controls at any time point (day 7: P=0.10, day 14: P=0.34, and day 28: P=0.18) (Fig. 5).
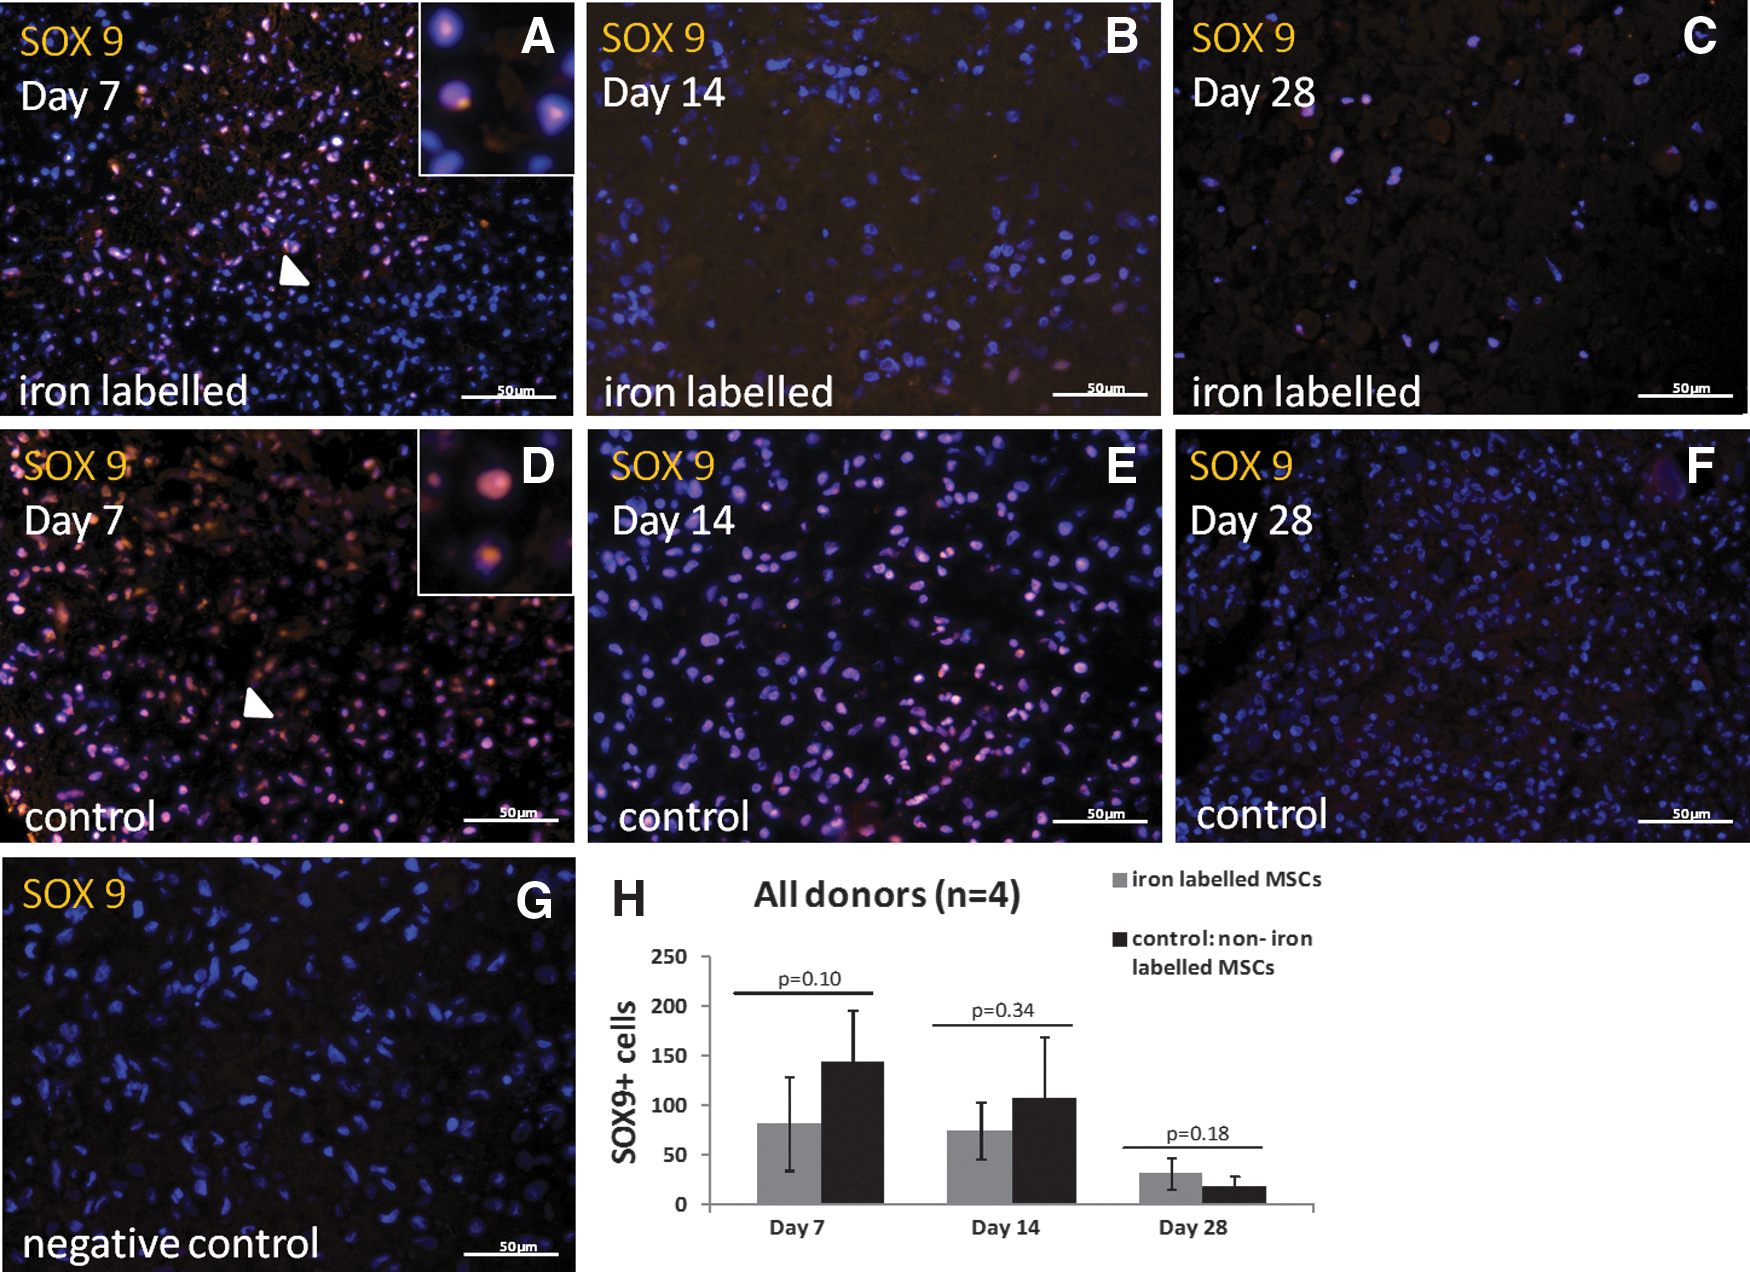
Images taken from center part of the pellets of immunohistochemical stainings of sex determining region Y-box 9 [SOX9, yellow color, nuclei stained with 4,6 diamino-2 phenylindole (DAPI, blue)] from one of the donors (male, age 35 years).
Analysis of extracellular matrix components: protein level
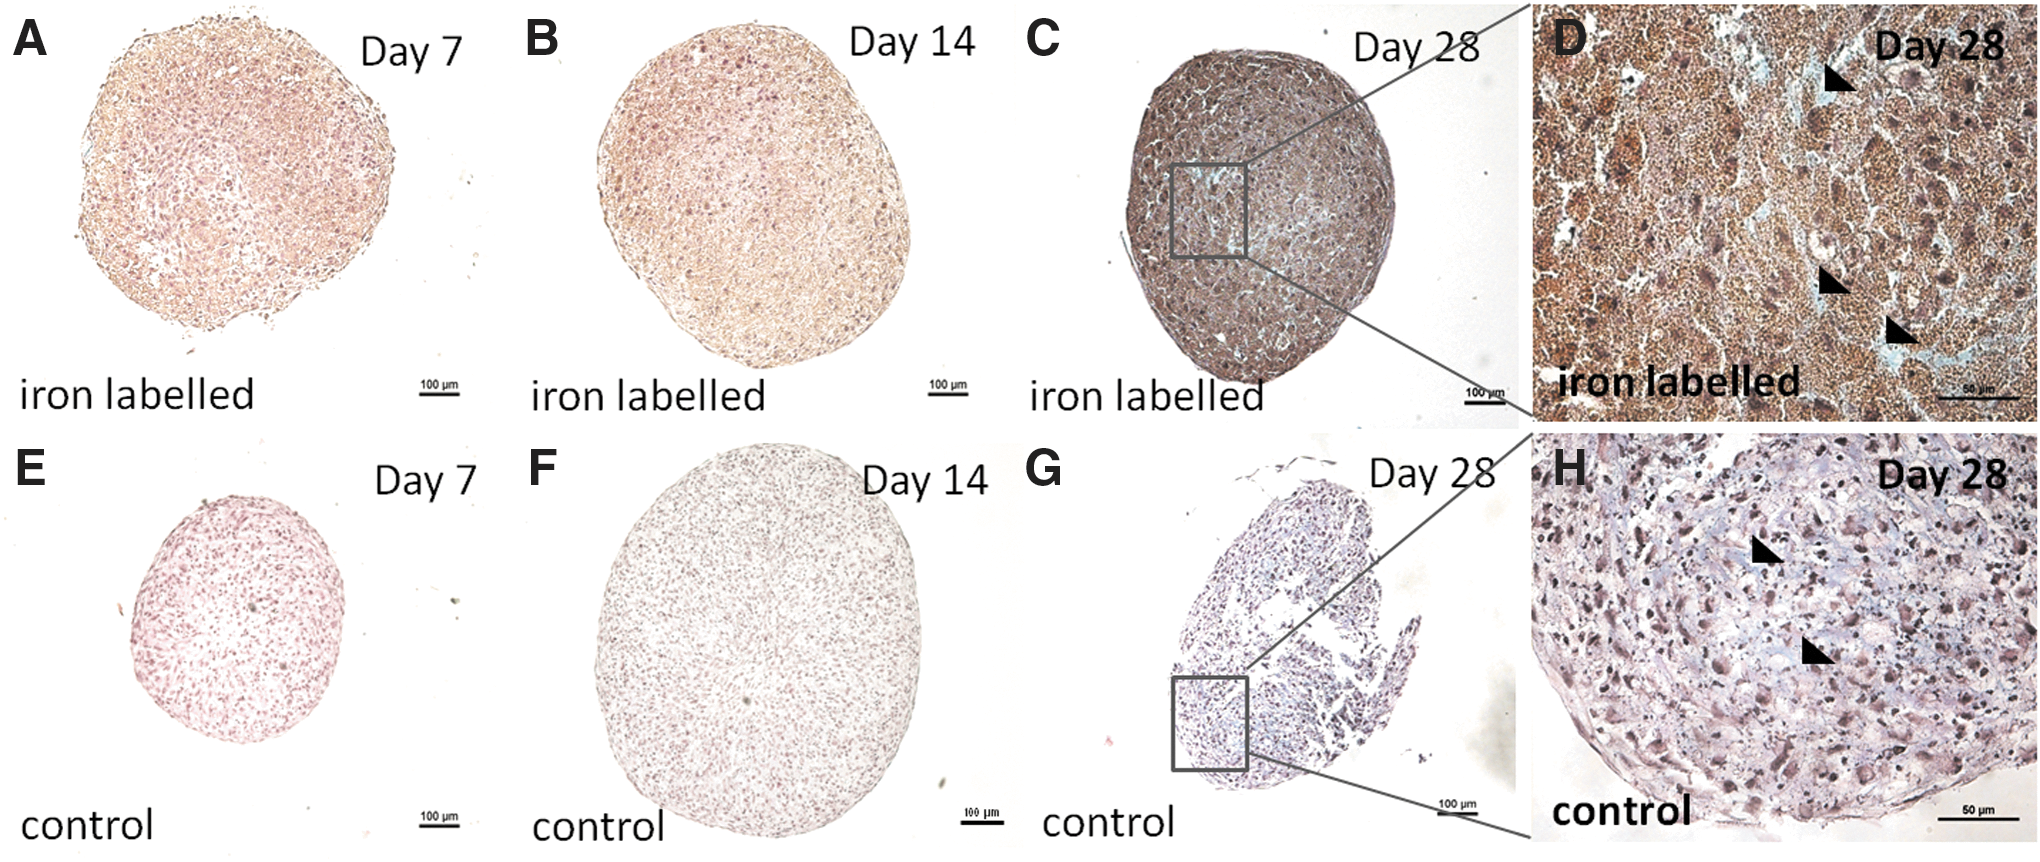
Collagen2A1
Expression of collagen2A1 was detected in the iron-labeled pellets at all the time points, peaking at day 28 (4/4 donors) in comparable levels as controls. In the noniron-labeled control pellets, collagen2A1 expression was detected at all the time points (4/4 donors) (Fig. 6).
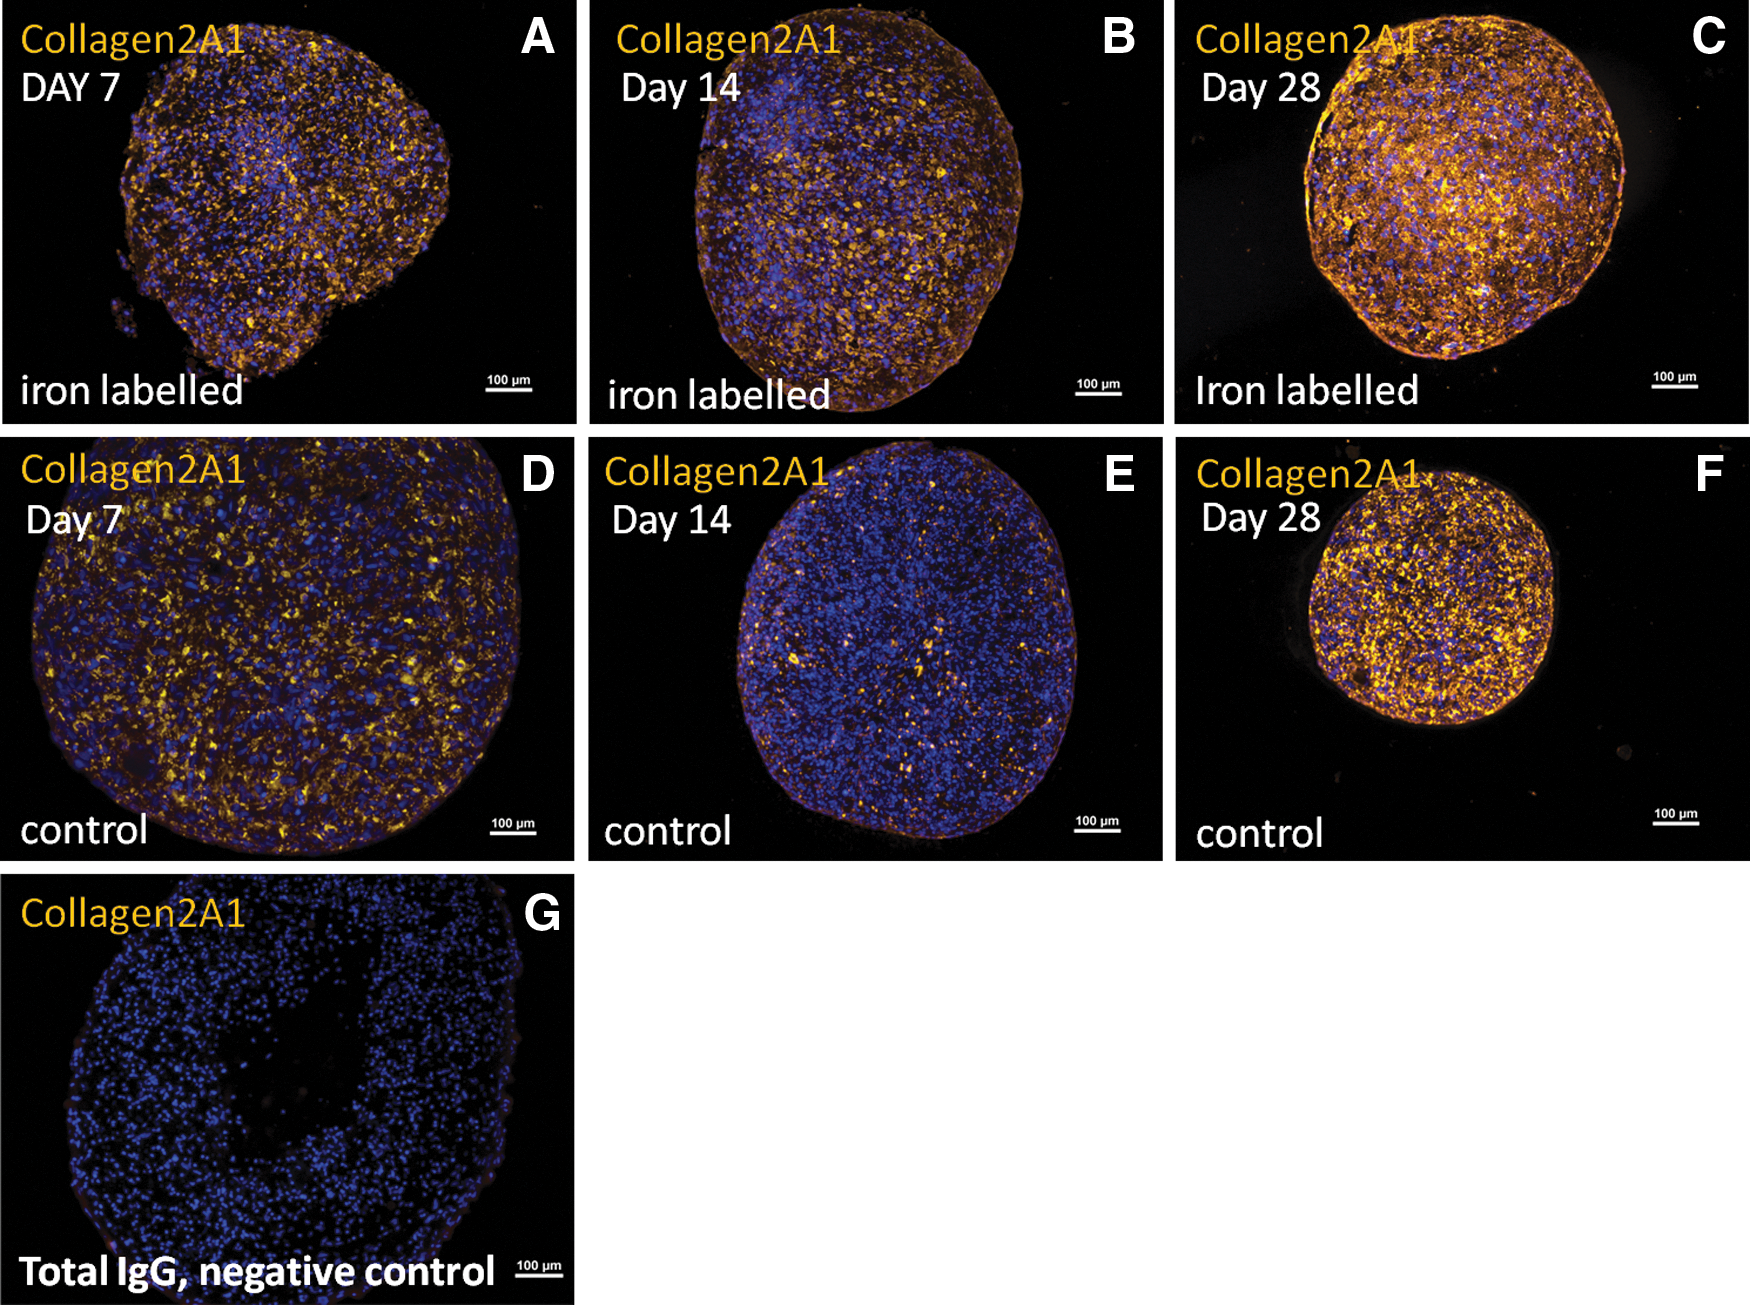
Images from immunohistochemical staining of collagen2A1 (yellow color) from one of the donors (male, age 51 years).
Glycosaminoglycans: C6S expression
Expression of C6S was detected in 3/4 donors at the time points day 14 (2/4 donors) and day 28 (4/4 donors) in the iron-labeled cell pellets.
In noniron-labeled control pellets, C6S expression was detected at day 7 (2/4 donors) and day 14 (2/4 donors) and at day 28 (4/4 donors) (Fig. 7).
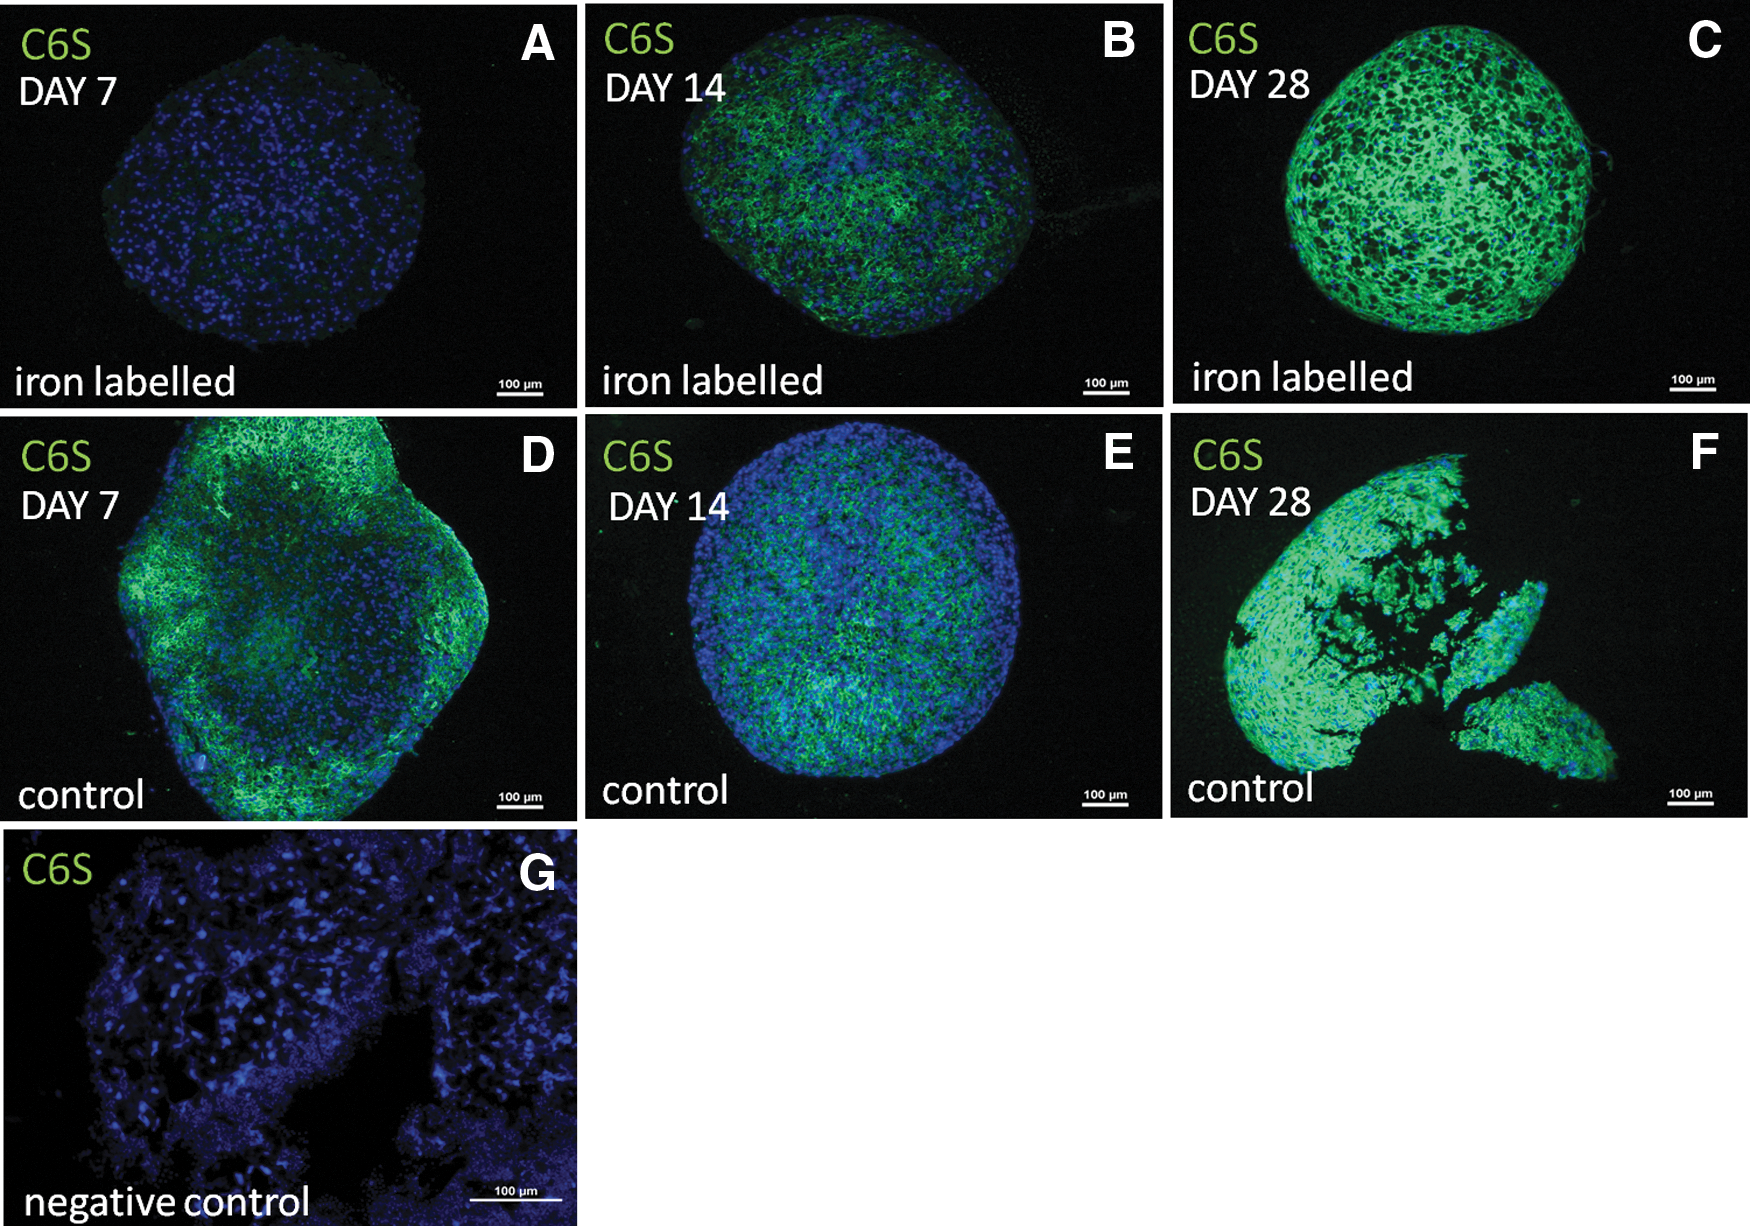
Images from immunohistochemical staining of chondroitin-6-sulfate (C6S, green color) from one of the donors (male, age 51 years).
Glycosaminoglycans: histology
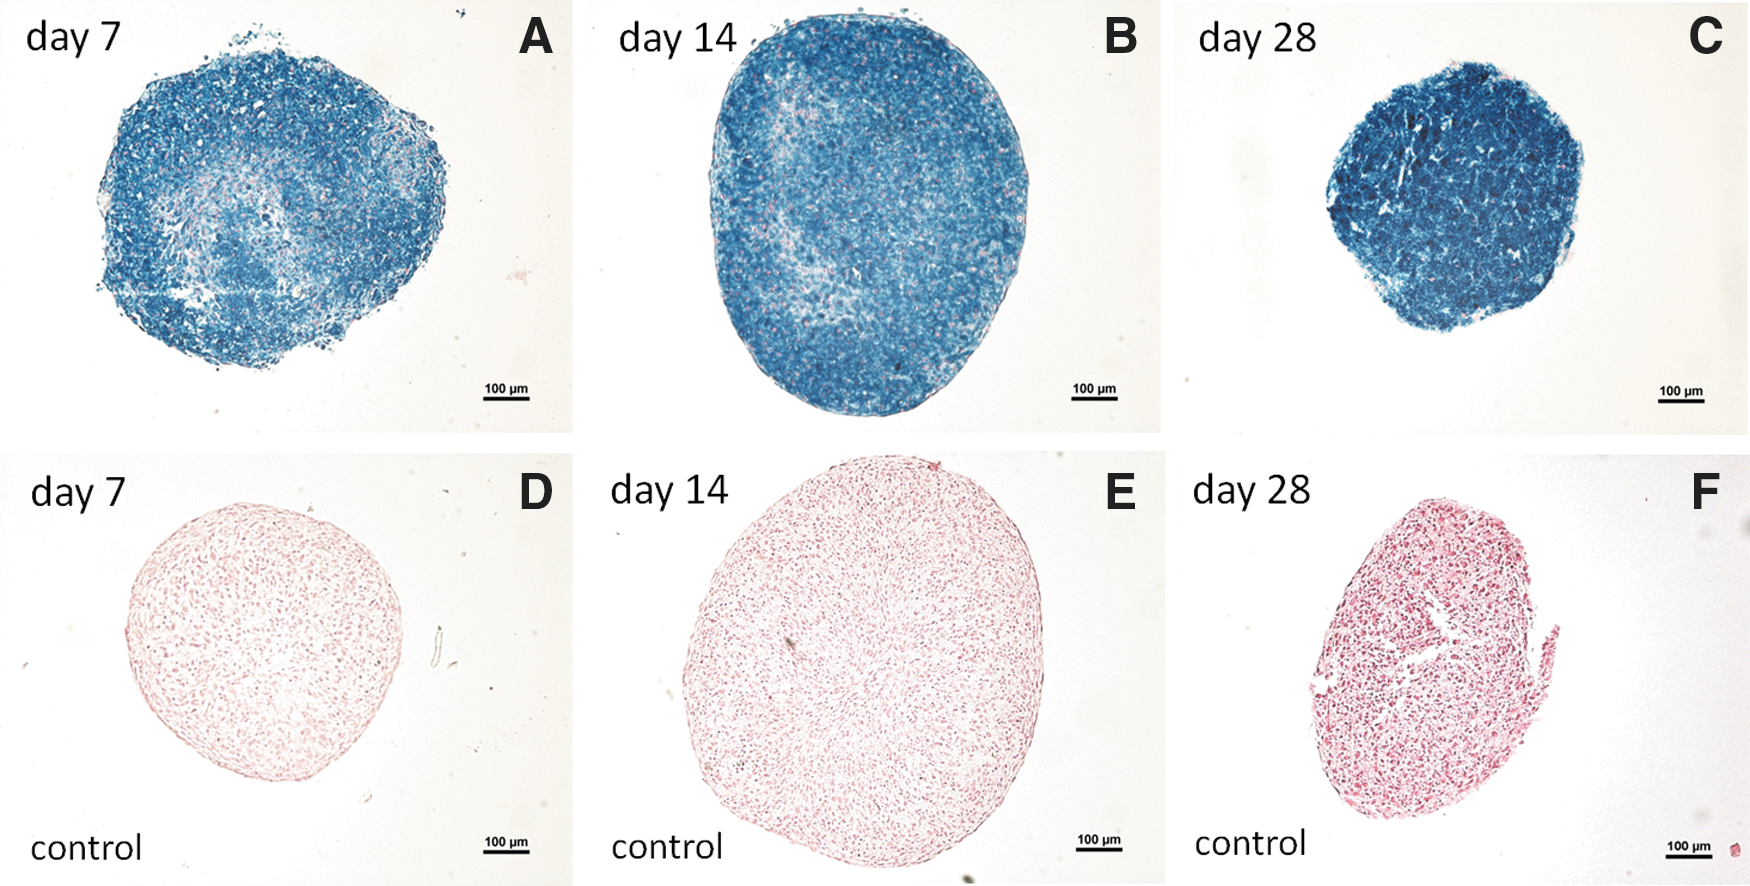
The MSCs formed cell pellets with various rounded shapes in the pellet mass cell cultures and an increase in pellet size was macroscopically observed in the cell pellets over time. In the iron-labeled cell pellets at day 14 (2/4 donors) and day 28 (3/4 donors), a weak positive staining for glycosaminoglycan accumulation was detected. In the noniron-labeled control pellets, a low positive staining for glycosaminoglycan accumulation was detected at day 14 (2/4 donors) and at day 28 (4/4 donors) (Fig. 8).
Images from histology staining of glycosaminoglycans (pale blue) from one of the donors (male, age 51 years).
Gene expression of MSCs
Gene expression of the MSC markers CD105 and CD166 was detected in the iron-labeled cell pellets (donors A–D, n=4); CD105 was detected at day 7 and day 14 (4/4 donors) and at day 28 (3/4 donors). CD166 gene expression was detected at days 7 (4/4 donors), 14, and 28 (3/4 donors). In the noniron-labeled control cell pellets (n=4), gene expression of CD105 was detected at all time points (4/4 donors) and CD166 gene expression was detected at the time point day 7 (4/4 donors) and days 14 and 28 (3/4 donors). In the iron-labeled pellets (n=4), gene expression of the chondrogenic lineage marker SOX9 was detected at days 7 and 14 (3/4 donors) and at day 28 (2/4 donors). In the noniron-labeled control cell pellets, SOX9 expression was found at days 7 (4/4 donors), 14, and 28 (3/4 donors). Gene expression of the chondrogenic ECM marker COL2A1 was detected in iron-labeled cell pellets at days 7 (1/4 donors), 14, or 28 (2/4 donors). COL2A1 gene expression was detected in noniron-labeled control pellets at day 7 (3/4 donors) and at day 28 (3/4 donors). COL2B (chondrogenic marker, mature ECM) gene expression was detected in the iron-labeled cell pellets at day 14 or at day 28 (2/4 donors). COL2B gene expression was detected in noniron-labeled control pellets at day 7 (1/4 donors) and at day 28 (3/4 donors). In the iron-labeled pellets, gene expression of ACAN was detected at day 7 (3/4 donors), day 14, or at day 28 (2/4 donors). In the noniron-labeled control pellets, ACAN was detected at the time points day 7 (4/4 donors), 14 (2/4 donors), and 28 (3/4 donors) (Table 1).
The results are presented as detected (D//D, highlighted in light gray color) or not detected (ND/ND, highlighted in dark gray color).
Discussion
In this study, the effects of iron labeling on human MSC survival and differentiation into the chondrogenic lineage were investigated. TGF-β and a pellet mass culture system were used to induce the differentiation of human MSCs into the chondrogenic lineage. Other factors that have been reported to induce chondrogenic differentiation and ECM accumulation are, for example, biomechanical forces, local cell signaling, and surface topography of the microenvironment [53,54]. Regarding the effect of iron labeling on differentiation of MSCs into the chondrogenic lineage, there are a few reports with divergent data that describe effects [55] on the chondrogenic differentiation [56,57]. However, recent studies have demonstrated that iron labeling does not affect the “stemness” of human bone-marrow-derived MSCs [57,58]. In the present study, after the iron labeling of MSCs, the cell viability was observed to be at similar level as in controls prior to start of the cell pellet cultures. The iron deposits were clearly detectable in the cultured iron-labeled MSC pellets up to day 28 (end point of the study). The results are comparable with previous studies that use iron nanoparticles (SPIOs) for labeling of MSCs in in vitro and animal models [14,15,16,21]. SPIOs are an elegant alternative when it comes to noninvasive cell tracking using MRI. In addition to that, they offer the opportunity of exogenous cell manipulation by magnetic fields for, that is, cell-targeting purposes as demonstrated by El Haj et al. [17]. To the best of our knowledge there are no such agents available for use in humans at the present time. Recently, Thu et al. proposed the off-label use of a combination of three different FDA-approved pharmaceutical compounds (ferumoxytol, heparine, and protamine) for SPIO cell labeling with promising results [59]. Our results from this study suggest that iron sucrose (Venofer) can be an in-vivo-cell-labeling option with a known, favorable risk profile (considering possible adverse effects such as allergic reactions) for use even in humans—in experimental designs where tissue samples can be acquired for histological examination [17].
In this study, the iron-labeled cells were able to form cartilage-like cell pellets in the pellet mass culture system and the cultured cell pellets were able to differentiate into the chondrogenic-lineage-expressing SOX9 and ECM markers collagen2A1 and C6S on a protein level. Normally, the gene expression precedes the protein expression in time. In the iron-labeled cell pellets, gene expression was detected from days 7 to 28 in the pellets, which supports that the cells were viable and active since gene expression of the investigated genes was detected in these samples (RNA has a short degrading time in vivo). Expression of chondrogenic genes displayed variation between donor samples in the iron-labeled pellets as well as in the nonlabeled control pellets. Presumably, the variation observed in the iron-labeled cell pellets is explained by reports of that iron compounds; for example, FeCl3 can inhibit or disturb the activity of polymerases by competing for the Mg2+ binding site at the polymerase molecule [51,52,60]. Mg2+ is a cofactor for the polymerase enzyme and hence it is necessary for the activity of this enzyme in order to the transcription of DNA or RNA can take place [51,61]. In addition, normal variation in gene expression between pellets can occur between donors and over time. Notwithstanding, the pellets were able to differentiate into the chondrogenic lineage as seen in the observed SOX9 expression (on gene and protein levels). In general, the SOX9 expression (protein level) was slightly lower in the iron-labeled cell pellets compared with the noniron-labeled pellets but no statistical differences were found when comparing the total SOX9 expression of all donors in iron-labeled pellets to controls (Fig. 5).
Further, extracellular matrix components collagen2A1 and C6S were observed on protein level in the pellets especially at the time points days 14 and 28, which was supported by the gene expression data of the same markers. In the iron-labeled pellets, in some of the donors, the gene expression of the chondrogenic genes was somewhat less detectable when compared with the noniron-labeled control pellets, indicating that the iron labeling may influence and/or delay the differentiation into the chondrogenic lineage of the human MSCs.
The flow cytometry results revealed that the stemness of MSCs when iron labeled (in aspects of cell surface marker profile) was slightly altered when compared with the noniron-labeled pellets. It appears as if the cell surface marker profile of the MSCs was affected by the iron labeling procedure since the CD105 expression was found to be significantly lower in the flow cytometry analysis (performed directly after the iron labeling procedure) when compared with the noniron-labeled control cells. No differences were observed for the other investigated markers.
Previously, in an in vitro study with pellet cocultures, a mixture of human MSCs and IVD cells was used in different ratios and iron nanoparticle (Endorem) labeling of one of the cell types (MSCs) was performed [15] and the iron deposits were thereafter detectable for up to 28 days (the latest investigated time point) [15]. In addition, in a recent in vivo study (lapine model), in situ labeling with iron nanoparticles (Endorem) of local cells in the IVD region (niche area adjacent to the epiphyseal plate) was reported where the labeled cells could be traced up to 6 weeks after the in situ labeling and detected distributed as solitary iron-deposit-containing cells within the IVD at relatively far distance from the injection site [62].
Limitations of this study were that a relatively small sample size was used. Data from the qPCR analyses were limited due to the fact that iron compounds most likely influenced/inhibited the activity of polymerases. Further, it is possible that a more pronounced differentiation of the MSCs into the chondrogenic lineage and ECM accumulation in the iron-labeled cell pellets would have been obtained if the cell pellet cultures would have been maintained in the cell cultures for a longer time period.
Conclusions
The pharmaceutical compound Venofer, iron sucrose compound, may be suitable as a cell tracer in in vivo studies of distribution of transplanted cells, for example, MSCs. The investigated iron sucrose compound provides a stable detectable signal and was found at all time points during differentiation, which gives it an advantage over other cell tracer compounds, for example, fluorochrome tracers that often lose their signal more rapidly over time.
Further, the cell viability was not affected by the iron labeling procedure while the differentiation into the chondrogenic lineage of the MSCs was to some extent influenced in the iron-labeled cell pellets compared with the controls. Hence, the iron labeling procedure appears to slightly delay the differentiation into the chondrogenic lineage over time. However, it should be mentioned that the labeled cells were able, in any case, to form pellets, indicating a significant residual chondrogenic differentiation capacity. The described iron labeling model in this study can be useful in in vivo models for monitoring of cellular distribution after stem cell transplantation, for example, by histology methods, and thus contribute with important knowledge when exploring new treatment strategies for cartilaginous tissues involving different stem cell therapy applications.
Footnotes
Acknowledgments
The study was supported with grants from the Swedish Research Council, the Neubergh Foundation, the Hjalmar Svensson Foundation, Sahlgrenska University hospital funds, the Royal Society of Art and Sciences, VINNOVA, and BIOMATCELL VINN Excellence Center of Biomaterials and Cell Therapy, Gothenburg, Sweden.
Author Disclosure Statement
The authors declare no conflict of interest.