
Abstract
Perinatal sources of mesenchymal stromal cells (MSCs) have raised growing interest because they are readily and widely available with minimal ethical/legal issues and can easily be stored for allogeneic settings. In addition, perinatal tissues are known to be important in mediating the fetomaternal tolerance of pregnancy, which confer upon perinatal-MSCs (P-MSCs) a particular interest in immunomodulation. It has been recently shown that it is possible to deeply modify the secreted factor profiles of MSCs with different cytokine stimuli such as interferon gamma or tumor necrosis factor alpha to license MSCs for a better immunosuppresive potential. Therefore, we aimed to compare adult bone marrow-MSCs with MSCs from perinatal tissues (cord blood, umbilical cord, amnion, and chorion) on their in vitro immunological and stromacytic efficiencies under different priming conditions. Our results showed that P-MSCs had a potential to modulate the in vitro immune response and be useful for hematopoietic progenitor cell ex vivo expansion. However, we showed contrasted effects of cytokine priming embedded in an important between-donor variability. In conclusion, our study highlights the importance to elaborate predicitive in vitro tests to screen between-donor variability of perinatal tissues for banking allogeneic standardized MSCs.
Introduction
M
Although first applications using MSCs were based on their multilineage differentiation capacity, recent research has focused on their ability to exert biological function through trophic mechanisms. This shift results from observations that MSCs have the propensity to reduce inflammation, apoptosis, or fibrosis, despite a lack of differentiation and engraftment in the injured tissue [15].
This advancing knowledge has progressively led scientists to consider MSCs as “small factories” for intercellular communications. MSCs constitute a connective tissue scaffolding, and produce cytokines, chemokines, or extracellular matrix proteins for tissue repair through immunomodulation, homing, and cell proliferation mechanisms [16].
Many studies have demonstrated that co-transplantation of hematopoietic progenitor cells (HPCs) with bone marrow (BM)-MSCs can promote hematopoietic engraftment, reduce incidence of graft versus host disease (GVHD), accelerate lymphocyte recovery, and reduce the risk of graft failure [17 –24]. Furthermore, it has been extensively documented that, under particular circumstances, MSCs effectively modulate both adaptive immune effector activity such as T and B cells and innate immunity actors: natural killer, antigen presenting (monocytes, macrophages, and dendritic cells), and polymorphonuclear cells [25]. Only a few comparative analyses have been conducted between BM-MSCs and perinatal-MSCs (P-MSCs) [26 –28] and although P-MSCs may share many cytokinic effectors with adult MSCs, their secretion pattern might be tissue-specific [29]. In addition, perinatal tissues are known to be important in mediating the fetomaternal tolerance of pregnancy, which confer to P-MSCs a particular interest in immunomodulation. This fetomaternal interface is a unique environment, which enables maternal tolerance of the fetal allograft.
An important characteristic of MSCs is their ability to be influenced by their environment. Multiple groups have shown that it is possible to deeply modify the secreted cytokine profiles of MSCs with different kinds of stimuli such as hypoxia and cytokines [25,30 –32]. There is increasing literature focusing on the use of inflammatory cytokines such as interferon gamma (IFN-γ) or tumor necrosis factor alpha (TNF-α) to license MSCs for immunosuppression [25]. However, specific priming mimicking fetomaternal environment has not yet been investigated.
An important point to take into consideration for clinical use of MSCs is that they are not always “magical cells”, robust to culture conditions, and intrinsically efficient and their biological effect could vary between different donors. It has been highlighted in a recent phase III clinical trial in which expanded frozen MSCs administrated to patients with GVHD did not modify the evolution of the disease [33]. Although donor, tissue origin, lab protocols, passage, freezing, or priming are now commonly studied for their impact on MSCs, measuring their relative influence on MSCs and finding in vitro functional tests according to the clinical need are now a required waypoint toward proposing patients a realistic and reproducible treatment [34].
In this work, our aim was to define selection criteria to create a bank of allogeneic MSCs for cellular therapy. We first confirmed the inter-individual variability of MSCs and determined the most suitable perinatal source of MSCs (amnion, chorion, UC, and UCB) in terms of culture properties, phenotype, and differentiation capacity. We demonstrated that conventional phenotypic marker patterns and growth capacity were not related to their functional heterogeneity. We therefore evaluated more specialized functional assays such as stromacytic hematopoietic coculture and mixed lymphocyte reaction. We further investigated how priming with pro-inflammatory cytokines and tolerogeneic molecules mimicking pregnancy environment could enhance the immunomodulatory potential of cells prior to their banking.
Materials and Methods
Isolation of BM-MSCs
Human BM-MSCs were obtained from different patients undergoing routine total hip replacement surgery in the “Percy Hospital” (Clamart, France) after informed consent. As previously reported [35], spongious bone fragments were added and vigorously mixed in phosphate buffered saline (PBS; PAN-Dominique Dutscher), 1 mM EDTA (Prolabo-VWR), ACD-A [0.32 g/L of citric acid, 0.88 g/L of sodium citrate, and 0.98 g/L of dextrose (MacoPharma)], and 0.5% human serum albumin (HSA; LFB). After 20 min of settling, the supernatant was collected and centrifuged at 480 g for 10 min. The supernatant was filtered at 70 μm and the bone marrow mononuclear cells (BM-MNC) were counted using an automated cell analyzer (Sysmex).
Perinatal tissues (amnion-chorion-UC) freezing
All perinatal tissues were obtained from normal full-term deliveries after maternal informed consent according to approved institutional guidelines (Hôpital d'Instruction des Armées Bégin, Saint Mandé).
Placental membranes (amnion and chorion) were manually separated, placed in sodium chloride, 1 g/L vancomycine (GSK, GB), 1 g/L clamoxyl (GSK, GB), 0.5 g/L amikacine (Mylan), and 0.05 g/L fungizone (Bristol Myers Squibb), for 1 h 30 min at room temperature, and then cut into pieces of 2 cm2. The fragments were placed in RPMI1640 (Gibco-Life Technologies), 5% HSA, 0.005 mg/mL ciprofloxacin (Bayer Pharma), and 50% glycerol (Sigma-Aldrich) and stored at −80°C until isolation of mononuclear cells (MNCs).
The UC were collected and immediately placed in PBS added with1 mM EDTA, 4% ACD-A, and 0.5% HSA. Like amniotic membranes, the UC were placed in an antibiotic bath (as described above for placental membranes), cut in 2 cm pieces long, and frozen in solution (as described above for placental membrane freezing).
Isolation of P-MSCs
Human UCB units were obtained from normal full-term deliveries after maternal informed consent. They were collected before placental delivering by way of venous puncture of the umbilical vein with collection bag systems containing citrate phosphate dextrose solution (Macopharma) (Assistance Publique-Hôpitaux de Paris, Unité de thérapie cellulaire Hôpital Saint-Louis, Paris, France and Hôpital d'Instruction des Armées Bégin, Saint Mandé). UCB units from 60 to 100 mL were treated within the 15 h after delivery. To isolate MNCs, each UCB unit was loaded onto 1.077 Ficoll-Hypaque solution (Dominique Dutscher). Centrifugated at 1,080 g for 20 min, MNC layer was collected, washed with PBS added with 1 mM EDTA, and counted with an automated cell analyzer. UCB-derived MNCs were plated at a high density of 1×10⁷/cm2 into 24-well culture plates in EGM-2 MV medium (Lonza). Medium was first changed at day 3 and every day thereafter during the first week, and then twice a week.
Amnion and chorion pieces were thawed after a resting period of 30 min at room temperature, placed first in PBS 1× containing 0.1% collagenase type IV (Life Technologies) and 2.4 U/mL Dispase II (Roche) for 1 h 30 min at 37°C, and placed in 0.025% trypsine-EDTA (Life Technologies) for 30 min at 37°C. Pieces of UC were thawed after a resting period of 30 min at room temperature, cut into smaller pieces around 1–2 mm3, placed first in PBS 1×, 300 U/mL collagenase type I (Life Technologies) and 1 mg/mL hyaluronidase (Calbiochem-Merck) for 1 h at 37°C, and then placed in 0.025% trypsine-EDTA (Life Technologies) for 30 min at 37°C. MNCs obtained from amnion, chorion, and UC were then filtered through a 100 μm cell strainer (BD) and centrifuged at 200 g for 10 min. Numeration was determined using Malassez slide.
Culture of BM-MSCs and P-MSCs
All MNCs were seeded at 30,000/cm2, and 0.33.106 cell/25 cm2 for clonogenic tests [colony forming unit fibroblast (CFU-F)] in MEM alpha (Clinisciences) supplemented with 0.01 mg/mL of ciprofloxacine, 10 U/mL of heparin (Choay-Sanofi Aventis), and 5% of platelet lysate (PL) (obtained from platelet apheresis collection performed at the “Centre de Transfusion Sanguine des Armées”, Clamart). The medium was replaced every 3 days, each passage was done at 60%–70% confluence using 1× trypsin-EDTA. Then, MSCs were seeded at 4,000 MSCs/cm2 for proliferation and 200 MSC/25 cm2 for CFU-F. The growth characteristics of MSCs derived from different fetal and adult sources were compared until the end of proliferation ability. Cultures were stopped when the cells were not able to achieve this level of confluence in 21 days. For CFU-F formation, the culture was stopped on day 10. All MSCs were frozen in MEM alpha medium supplemented with 10% HSA and 10% dimethylsulfoxide (DMSO; Sigma-Aldrich).
Immunophenotyping of MSCs
We carried out a multi-parameter analysis of MSCs for their surface antigen expression by using a FACS SCAN (Beckton Dikinson). About 5×10⁴ cells were incubated in PBS 1×, 2% HSA, and 0.5% polyvalent human immunoglobulins (LFB) for 20 min at 4°C; then incubated with monoclonal antibodies at a saturating concentration for 20 min at 4°C; and finally fixed in 1% formol/PBS. For MSC characterization, we used FITC-labeled IgG1, CD29, CD31, CD34, CD45, CD90 (all from Beckman Coulter), and CD54 (R&D) and phycoerythrine (PE)-labeled IgG1, CD44, CD73, CD105, CD144, HLA classII DR antigen (all from Beckman Coulter, USA), CD73 (BD), CD146 (BD), CD200 (Biolegend), KDR (R&D), and MSCA1 (Miltenyi Biotec). The percentage of stained cells was calculated by comparison with the isotypic control.
DNA extraction and HLA typing
DNA issued from UCB and perinatal expanded MSCs were extracted using Wizard Genomic DNA purification kit (Promega) according to the manufacturer's instructions. HLA locus were investigated using the Dynal AllSet SSP kit (Dynal-Life Technologies), a PCR-based technique that uses Sequence Specific Primers (SSP), for DNA-based tissue typing. The kit was used according to the manufacturer's instructions.
Osteogenic, chondrogenic, and adipogenic differentiation
For osteogenic induction, cells were plated at 3×10³ cells/cm2 in MEM alpha with 10% fetal calf serum (FCS) supplemented with 0.1 μM dexamethasone, 0.05 mM L-ascorbic acid-2-phosphate, and 10 mM β-glycerophosphate (all from Sigma-Aldrich) for 21 days of culture. Medium was changed twice a week. Osteogenic monolayer cultures were histochemically stained for alkaline phosphatase (ALP) detection using Abcys detection kit. Matrix mineralization was evaluated by (i) 2% Alizarin Red (Sigma-Aldrich) staining and (ii) by Von Kossa staining. Briefly, fixed cells were stained for 30 min with 1% silver nitrate solution, then washed with water, and placed 15 min under ultraviolet light.
For chondrogenic induction, MSCs were centrifuged at 500 g for 5 min without brake to form small pellets and cultured for 21 days in DMEM high glucose (Gibco) with 10% FCS supplemented with 1 mM sodium pyruvate, 0.17 mM ascorbic acid-2-phosphate, 10−7 M dexamethasone, and 10 ng/mL recombinant TGF-β3 (from Sigma-Aldrich). Every 2–3 days, cell pellets were resuspended with fresh medium. At day 21, chondrogenic pellets were fixed in formol, dehydrated with a graded series of ethanol treatment prior to being embedded in paraffin. Paraffin sections of 5 μm thickness were dried, deparaffinized, and stained with hematoxylin phloxin and safranin (RAL Diagnostics) or with Alcian Blue (VWR).
Adipogenic differentiation was induced in MSC subconfluent cultures by three treatment cycles with 1 μM dexamethasone, 0.5 mM 3-isobuthyl-1-methylxanthine (IBMX), 0.2 mM indomethacin, and 0.01 mg/mL insulin (all from Sigma-Aldrich). Cycles were performed during 3-day culture and were followed by 1–3 days of maintenance culture in a specific medium (in DMEM high glucose with 10% FCS supplemented with 0.01 mg/mL insulin) until day 10. Between day 10 and 21, cells were cultivated in maintenance medium refreshed twice a week. Adipogenic monolayer cultures were then histochemically stained with oil red O (20 min followed by a brief rinsing) allowing lipid droplet detection (Cayman Chemical).
MSC/CD34+ coculture and colony forming assay
CD34+ cells were enriched from freshly isolated MNCs fractions (collected from patients by cytapheresis at CTSA (after informed consent) using the magnetic-activated cell sorting cell isolation kit (CliniMACS® CD34 Reagent; Miltenyi Biotec) according to the manufacturer's instructions, and they were then stored in liquid nitrogen. CD34+ cells were thawed; suspended in SynH (Abcell-Bio) supplemented with 10 ng/mL recombinant human (rh) stem cell factor (rh-SCF; PeproTech), rhFlt3L (R&D), and rh thrombopoietin (TPO; PeproTech); and seeded at 25,000 cell/cm2 on a confluent P or BM-MSC feeder layer or without stroma as control. Coculture was maintained for 7 days, half of the medium was refreshed once. After coculture, HPCs were harvested by following extensive flushing to collect nonadherent and adherent cells. HPCs were numerated and immunophenotyped by flow cytometry by using the following: PE-CD34, FITC-CD38, FITC-CD45, and FITC-CD90 (all from Beckman Coulter). At the end of coculture, HPCs were taken off the dishes, counted, and immunophenotyped by flow cytometry. Then, a part of HPCs were replated for an additional 14 days of culture to assess hematopoietic progenitor colony formation. HPCs were resuspended in IMDM medium (PAN-Dominique Dutscher), and 500 HPCs/35 mm2 were seeded in 1 mL of semi solid culture medium MethoCult® H4435 (StemCell Technologies). Colony formation was assessed 14 days after plating. The types of colonies were identified as granulocyte/macrophage colonies (CFU-GM), granulocyte colonies (CFU-G), macrophage colonies (CFU-M), erythroid burst-forming units (BFUE), and multipotential granulocyte, erythroid, macrophage, and megakaryocyte progenitors (CFU-GEMM) according to their typical morphological features. The clonogenic potential was calculated by multiplying the number of colonies of interest with the number of CD34+ cells obtained at the end of coculture and dividing by the number of HPC seeded in the secondary culture colony assay. The average number of HPCs and colonies were calculated from duplicate wells in each experiment. Mean+/− standard error of the mean (SEM) of three independent donors of MSCs on two experiments using two donors of HPC.
Mixed lymphocyte reaction using MSCs either as stimulating cells facing HLA-mismatched peripheral blood mononuclear cell as responder cells or as third-party cells in classical MLR
Human peripheral blood mononuclear cells (PBMCs) were collected from whole blood samples of healthy volunteer donors provided from CTSA. PBMCs from different donors were used as responder cells and MSCs were used either as allogenic stimulating cells to test their immunogenicity or as third-party cells to evaluate their immunomodulatory properties.
First, we evaluated whether the various sources of naïve or primed MSCs could stimulate lymphocyte alloproliferation. The HLA class II+ human B-lymphoblastoid cell line LCL 721.221 (ATCC) irradiated at 75 Gy dose was used as positive control to stimulate HLA-mismatched PBMC. Nonirradiated MSCs were used as stimulating cells at different ratios (PBMCs:MSCs 2:1, 4:1:, 8:1, 16:1 or 33:1) with a final concentration of responder cells of 105/well in a 96-well plate. Cultures were incubated at 37°C in a humidified 5% CO2 air atmosphere. PBMCs, MSCs, and PBMCs+MSCs proliferation were measured at day 6 by [3H]-thymidine incorporation (1 μCi/well; Perkin Elmer) during the last 18 h of culture. Cells were then harvested on filter mats and thymidine incorporation into DNA was quantified, using a beta counter (Wallac 1450; Perkin Elmer). All samples were analyzed in triplicate.
Next, we evaluated naïve or primed MSCs immunomodulatory properties toward activated T cells by using MSCs as third-party cells in mixed lymphocyte reaction (MLR) experiments. In a 96-well plate, 105 PBMCs were used as effector cells toward 5×10⁴ 75 Gy-irradiated LCL cells used as stimulating cells. P-MSCs and BM-MSCs were used as nonirradiated third-party cells at different ratios (PBMCs:MSCs 10:1, 20:1, 40:1, 80:1, 160:1). As described above, PBMC proliferation was measured at day 6.
The influence of MSC priming was analyzed by adding two different sets of cytokines in cultures 72 h before MLR. The first set named tolerance TOL was composed of complete growth medium supplemented with 3,400 U/mL leukemia inhibitory factor (LIF; Peprotech), 1 μg/mL progesterone (Sigma-Aldrich), and 20 ng/mL IL-10 (Peprotech). The second set named inflammatory (INFLA) was composed of complete growth medium supplemented with 25 ng/mL IFN-γ (Peprotech) and 15 ng/mL TNF-α (R&D).
Protein array analysis
MSCs were cultivated until 80% of confluence in MEM alpha supplemented with 5% PL. Then, the medium was removed and replaced by MEM alpha. Culture supernatants were collected after 24 h. The control supernatant was obtained by following the same protocol in flask with no cells to assess the level of residual cytokines released by PL aggregates. Supernatant proteins were concentrated five-folds using the Amicon Ultra Ultracel 3k (Millipore-Merck) and then analyzed according to the manufacturer's instructions with cytokine anti- body array by using RayBio® Human Cytokine Antibody Array G Series 4000 that can detect 274 human cytokines (RayBiotech). Scanning procedure was achieved by using laser scanner Axon GenePix using cy3 channel (Excitation frequency 532 nm). For analysis of large number of arrays, several controls were used for normalization and comparison of arrays performing in different membranes. The positive control was a biotinylated protein used to normalize the streptavidin incubation step. The internal control, was a spiking-in protein, which had no crossreactivity with protein in the array, used to normalize the entire process. Then, the negative control, bovine serum albumin, gave a background reading. After normalization, we then subtracted the sample values with control supernatant values. Finally, on the 274 total analytes, only those with a value above the background noise in at least one sample (indicated at 200 optical density (OD) units by the manufacturer) were retained for analysis. One sample of each type of MSC was analyzed.
Statistical analysis
Histograms summarizing data represented mean±SEM. These representations and CFUF=f (Passage) plots were made with Prism software while variance components representation was made with Excel software with data extracted from R software (v2.15.1), and lymphocyte proliferation inhibition plots where realized with R software. Position comparison between groups was made by parametric analysis of variance (ANOVA) when possible, after visually checking for normality and homoscedasticity, and eventual log or square root transformation of the response variable. Post-tests were either Dunnet for all-against one comparisons, or Tukey for all against all comparisons. When parametric tests' assumptions could not be held, one way nonparametric Kruskal–Wallis tests were used to study the effect of a fixed effect variable, at each level of the other explanatory variables. P<0.05 was considered significant. The estimated variance components were extracted from a nested anova performed with the lme formula (package nlme) in R software.
Results
P-MSCs exhibit similar phenotypical and growth features
We isolated MSCs from different sources of perinatal tissues such as amnion, chorion, UC (Wharton Jelly), and UCB. The isolation of MSCs from amnion, chorion, and UC gave 80% to 100% rate while UCB source gave a very low rate of 8%. HLA typing confirmed that isolated MSCs from amnion and UC were exclusively from fetal origin, whereas MSC isolated from chorion expressed both fetal- and other-specific alleles (data not shown).
All cells isolated from perinatal and BM-MSC sources were spindle-shaped plastic adherent cells. To confirm that perinatal cells corresponded to MSCs, we tested the expression of several MSC phenotypical markers including: CD29, CD44, CD73, CD90, and CD105. We showed that all MSCs, regardless of their tissue origin, were positive for these “mesenchymal” markers, negative for hematopoietic and endothelial lineage markers such as CD34, CD45, CD31, CD144, KDR, and negative for HLADR (Fig. 1).
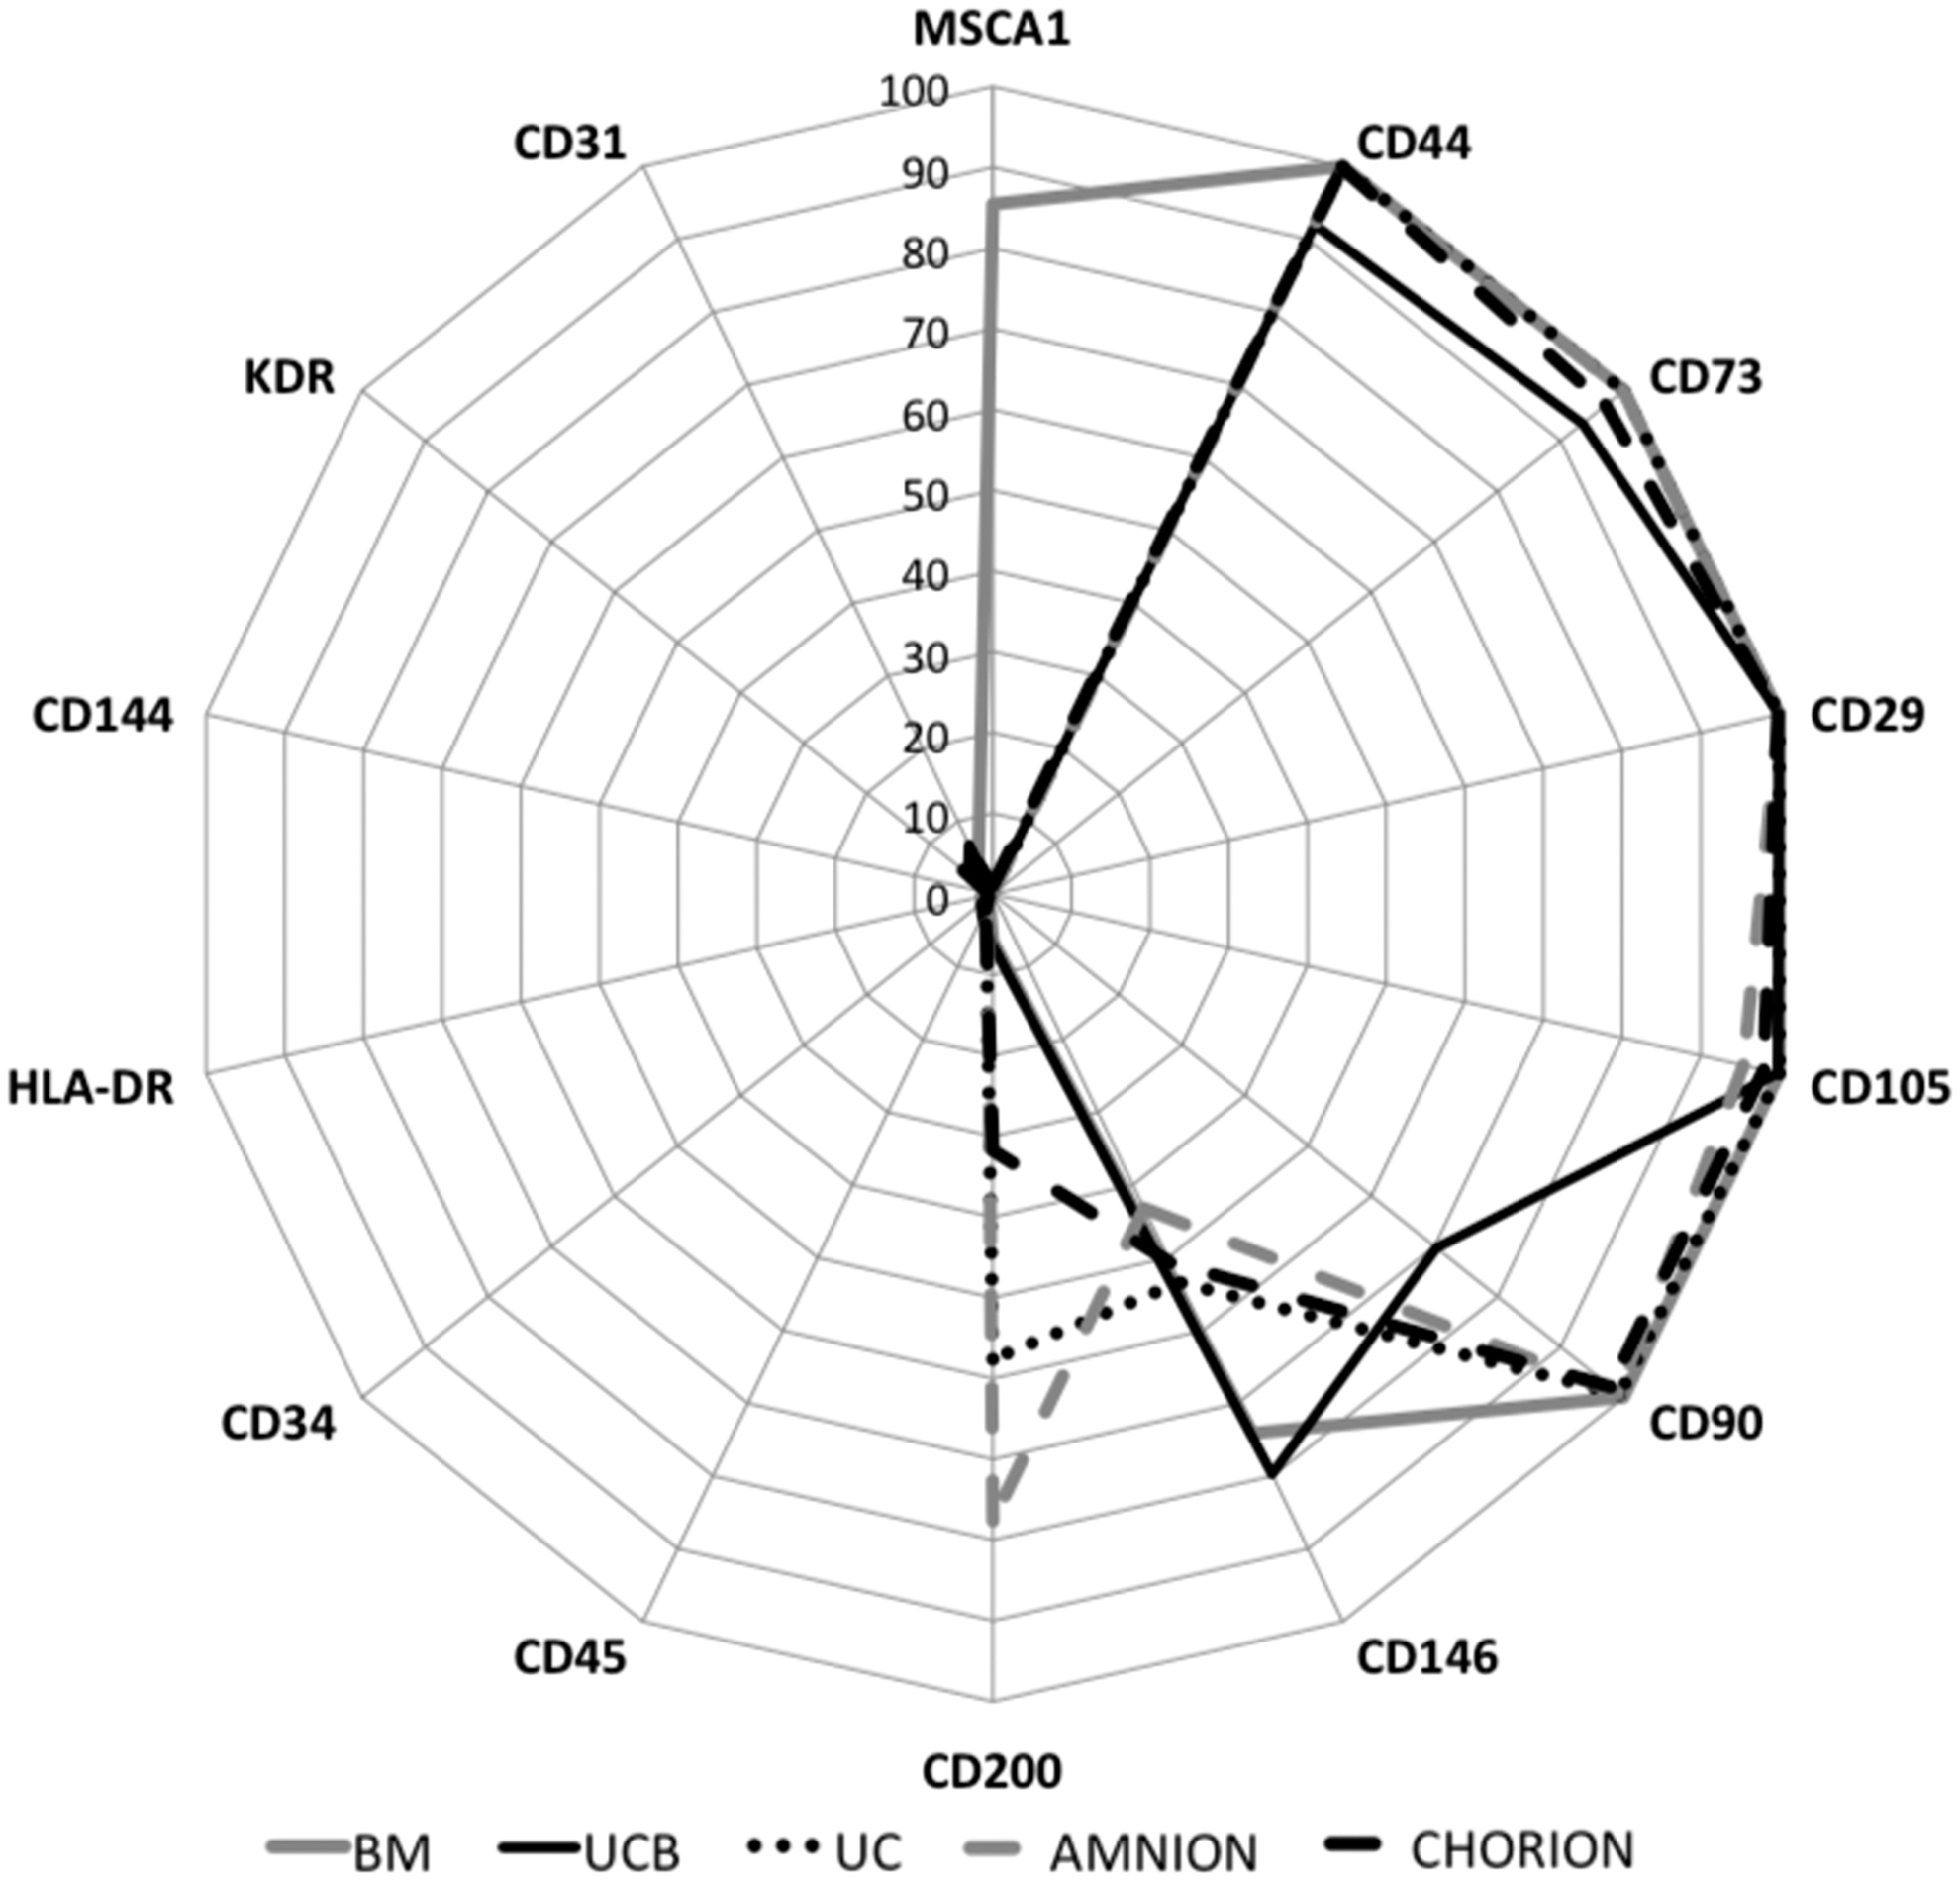
Phenotypic characterization of P-MSCs. The values represented the percentage of positive cells for each marker on a logarithmic scale. “Mesenchymal” markers: CD29, CD44, CD73, CD90, CD105, and CD200. Hematopoietic markers: CD34, CD45, and CD117. Specific endothelial markers: CD31, CD144, and KDR. Mesenchymal/endothelial markers: CD54, CD106, and CD146. BM-specific marker: MSCA-1. Amnion and chorion n=6, UC n=4, UCB n=3, and BM n=2. BM, bone marrow; MSC, mesenchymal stromal cell; P-MSCs, perinatal-MSCs; UC, umbilical cord; UCB, umbilical cord blood.
We further explored the expression of phenotypic markers initially described to discriminate primitive subpopulations of BM-MSC such as CD146, CD200, and MSCA1. We showed that the percentage of CD146-positive cells was higher in UCB (79.8%±13.2%) and BM-MSCs (74.1%±5.7%) compared with amnion (43.1%±8.4%), chorion (50.6%±6.7%), and UC (53.4%±14.1%) MSCs (Fig. 1). The expression of CD200 was higher in amniotic membranes (77.6%±7.8% and 31.7%±14.2% respectively for amnion and chorion) and UC (57.6%±10.9%) and only 6.4%±4.5% for UCB and 5.9%±1.75% for BM (Fig. 1). Finally, the novel MSCA1 marker, which is described as a tissue nonspecific ALP marker of MSC, was only expressed by BM-MSCs (85.4%±0.05%) (Fig. 1).
We then compared the growth characteristics of MSCs derived from different fetal and adult sources. We showed that all MSC sources (P-MSC and BM-MSC) exhibited a similar growth pattern in terms of cell number obtained at the latest passage (4.6.108±2.108 for BM and 2.1.1014±1.1.1014 for P-MSC) (Fig. 2A). The maximum number of passages for which the cells were grown was determined when cells stopped to proliferate and were not able to give rise to CFU-F. We demonstrated that the maximum passage number was similar for the different sources of MSCs tested (9.7±0.33 vs. 11.9±0.7 respectively for BM- and P-MSC; Fig. 2B).

Comparable growth characteristics of BM and P-MSCs. The growth characteristics of MSCs derived from different fetal and adult sources were compared until the end of proliferation ability. Cells were trypsinized at 70%–80% confluence and then seeded again at 4,000 cells/cm2. Cultures were stopped when the cells were not able to achieve this level of confluence in 21 days.
Clonogenic efficiency of BM- and P-MSCs was then compared at each passage until the end of their proliferation ability. The basal clonogenic efficiency obtained at passage 1 (P1) was significantly higher for amnion-MSCs compared with BM-MSCs (29.5±2.2 vs. 20.3±3.2, P<0.001, n=3 to 6; Fig. 3A) and significantly lower for chorion-MSCs (11.7±3.2 vs. 20.3±3.2, P<0.05, n=3 to 6; Fig. 3A). We found that the percentage of CFU-F progressively decreased along the passages for all MSC types following a linear regression (Fig. 3A). We showed that the progressive decrease of CFU-F was significantly slower for chorion–MSCs than that obtained from BM-MSCs as demonstrated by the linear regression analysis (−1±0.5 vs. −2±0.39, P<0.05, n=3 to 6; Fig. 3A). The size of the colonies was evaluated by measuring the total plastic area covered by clones after 10 days culture at each passage. We showed that the total colony surface obtained from UC-MSC at P1 was significantly higher compared with BM-MSCs (23.6±3.4 vs. 16.3±2.4, P<0.05, Fig. 3B) and significantly lower for chorion-MSC (4±3.7 vs. 16.3±2.4, P<0.01, Fig. 3B). We found that the percentage of area covered by CFU-F progressively decreased along the passages for all MSC types following a linear regression (Fig. 3B). Linear regression analysis revealed that the total area coverage was lower for chorion-MSC compared with BM-MSCs (−0.25±0.5 vs. −1.4±0.34, P<0.05, Fig. 3B), whereas no significant difference was observed between BM and other perinatal sources. Therefore, we can conclude that despite differential clonogenic efficiency between BM- and P-MSCs, we did not observe a significant growth capacity and kinetic difference.
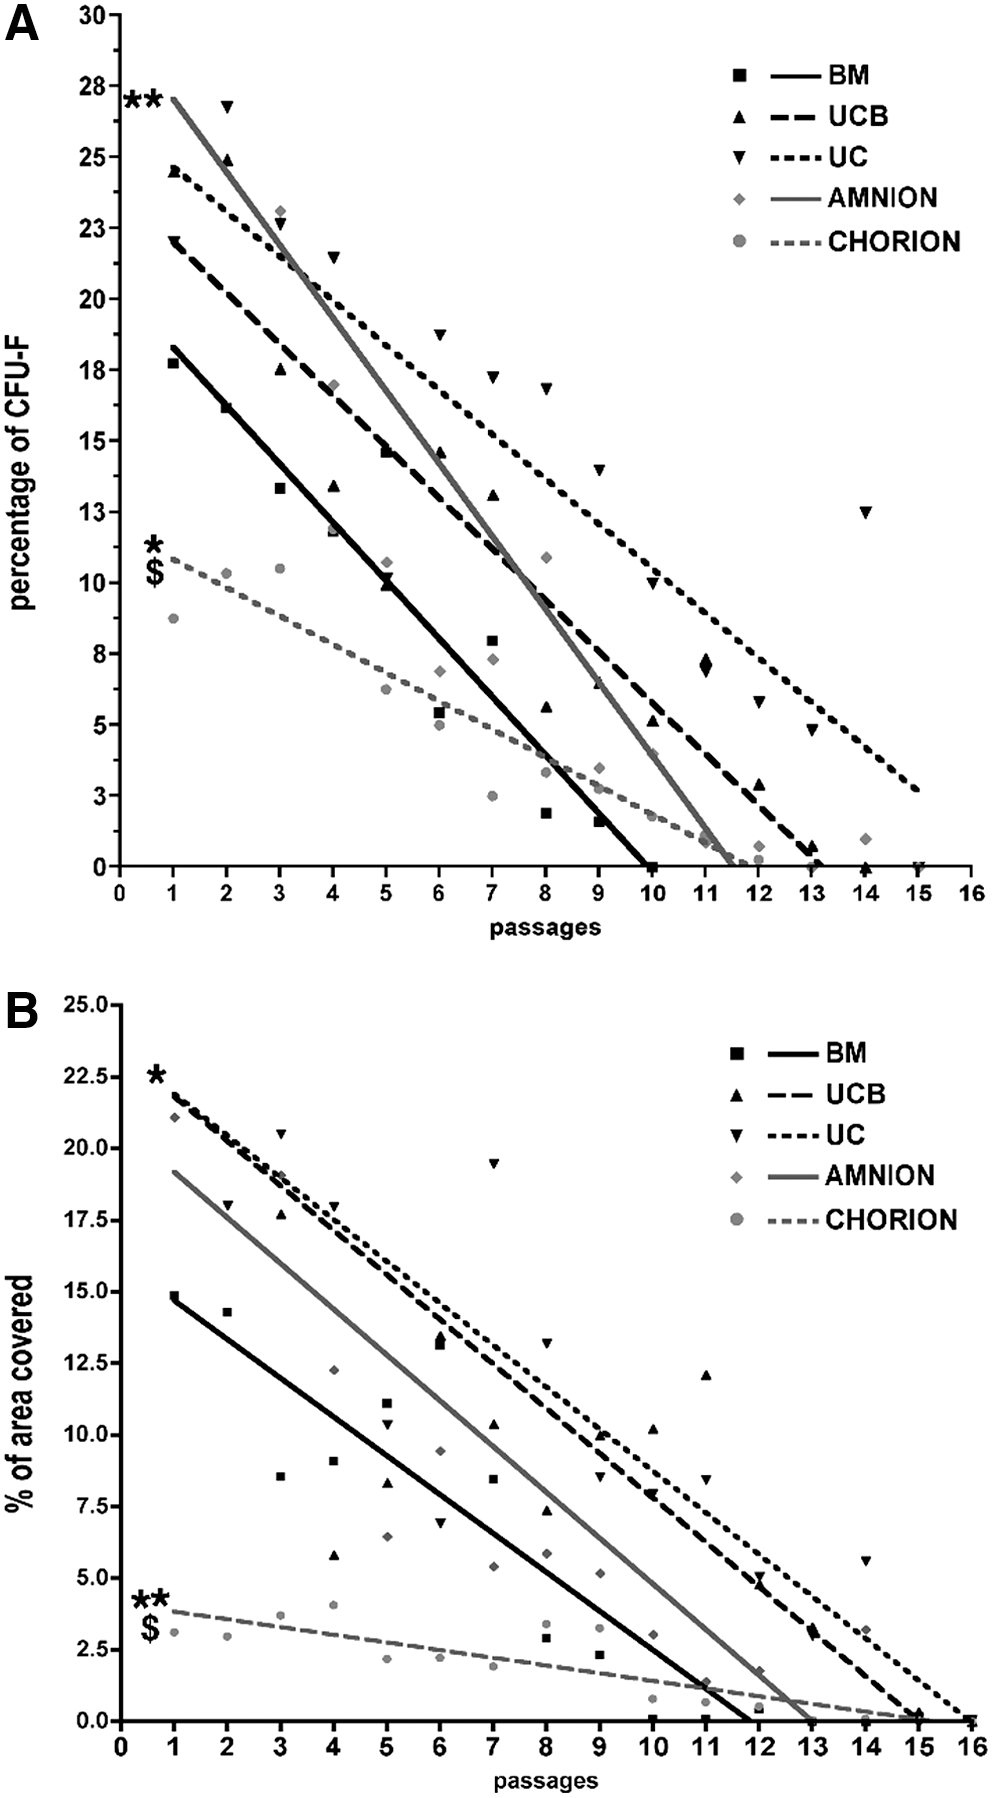
Differential clonogenic capacity between BM and P-MSCs. Cultures were stopped and assessed for CFU-F determination on day 10. Colonies containing 50 or more MSCs were scored as CFU-F colonies.
We further compared the differentiation potential of MSCs exposed to osteogenic, adipogenic, or chondrogenic induction media. After 3-week culture, MSCs from all perinatal sources were able to differentiate into osteoblast lineage as demonstrated by high mineralization (Alizarin red and Von Kossa staining). However, PAL activity was lower for UC-, amnion-, and chorion-MSCs than for BM-MSCs (Fig. 4A). In the same way, MSCs from all tissue origins were able to differentiate in chondrocyte lineage, as assessed by Alcian Blue staining (Fig. 4B). After adipogenic induction of P-MSCs, lipid droplets were not or rarely observed as compared to BM-MSCs (Fig. 4C).
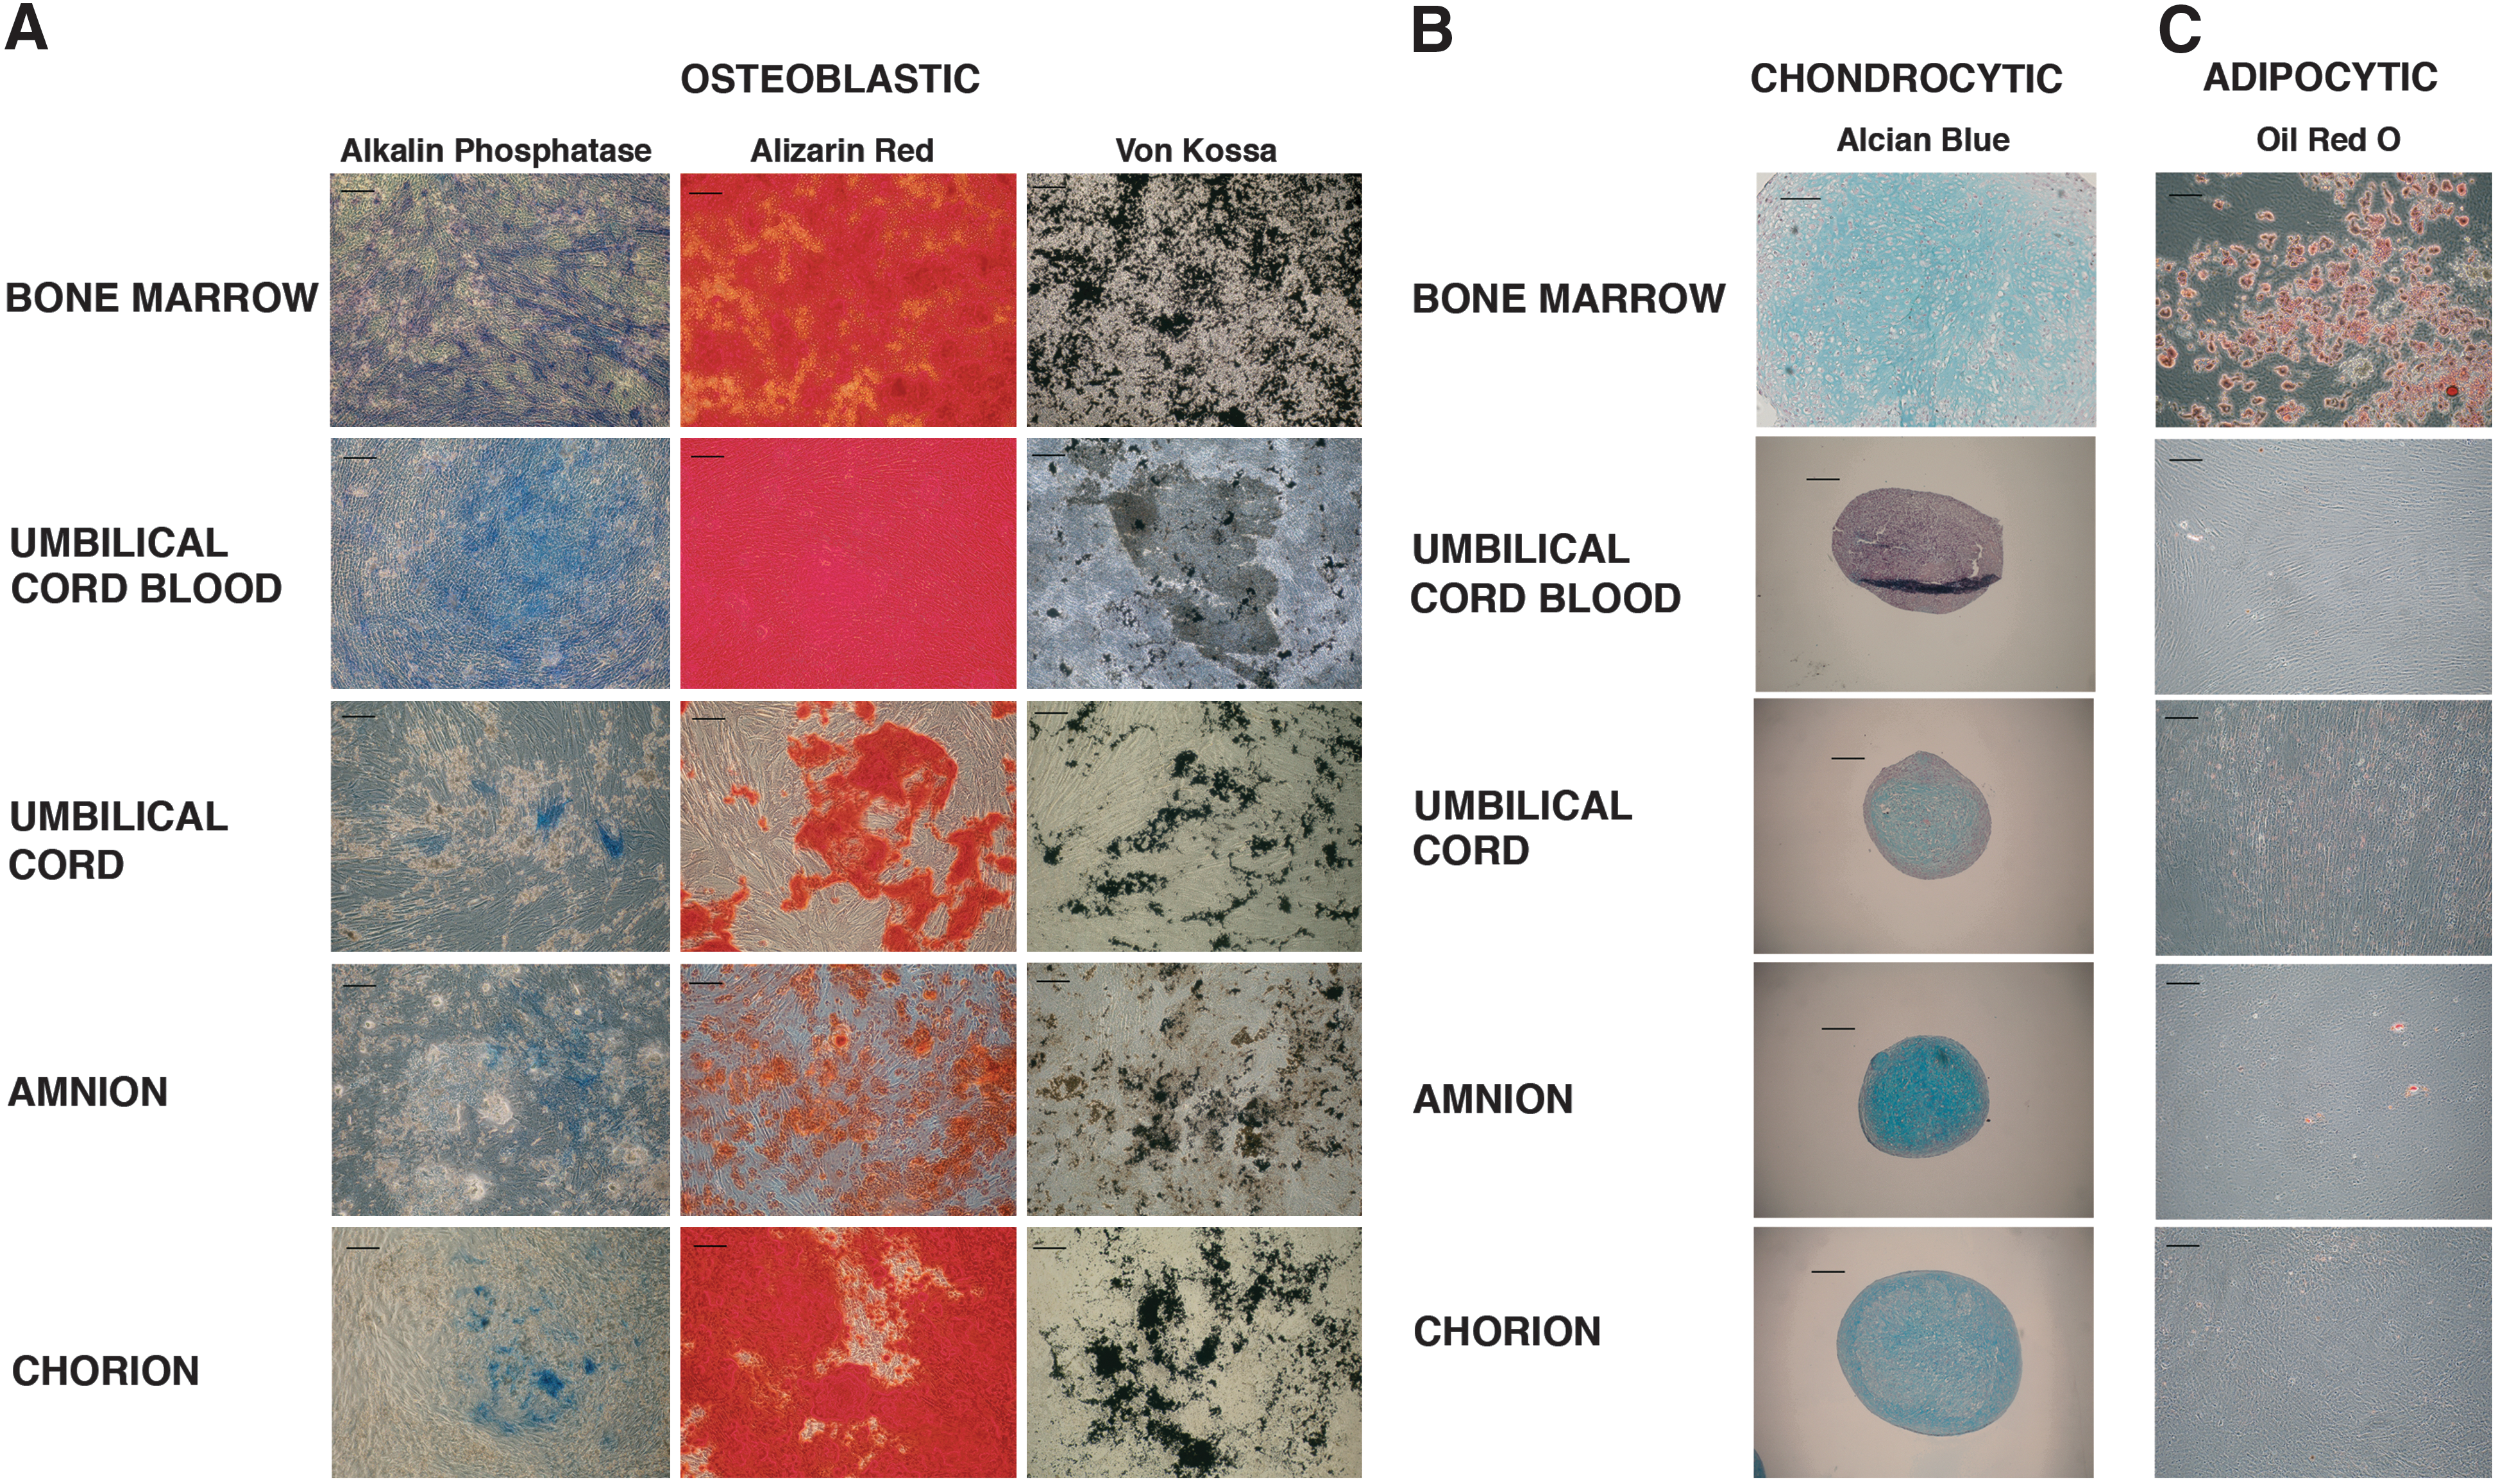
In vitro differentiation of P-MSCs.
Altogether, these results showed that although the P-MSCs did not have all the basal MSC characteristics described by Dominici et al., and it is not predictive of their functional efficiency [36].
P-MSCs exhibit similar secretory profile
In an attempt to explore the supportive effect of P-MSCs, we screened the secreted protein pattern of the different sources of MSCs by using a Raybiotech protein array assay. Among the 274 analyzed cytokines, only 117 were detectable. We analyzed these 117 analytes on the GeneOntology (GO) Web site (
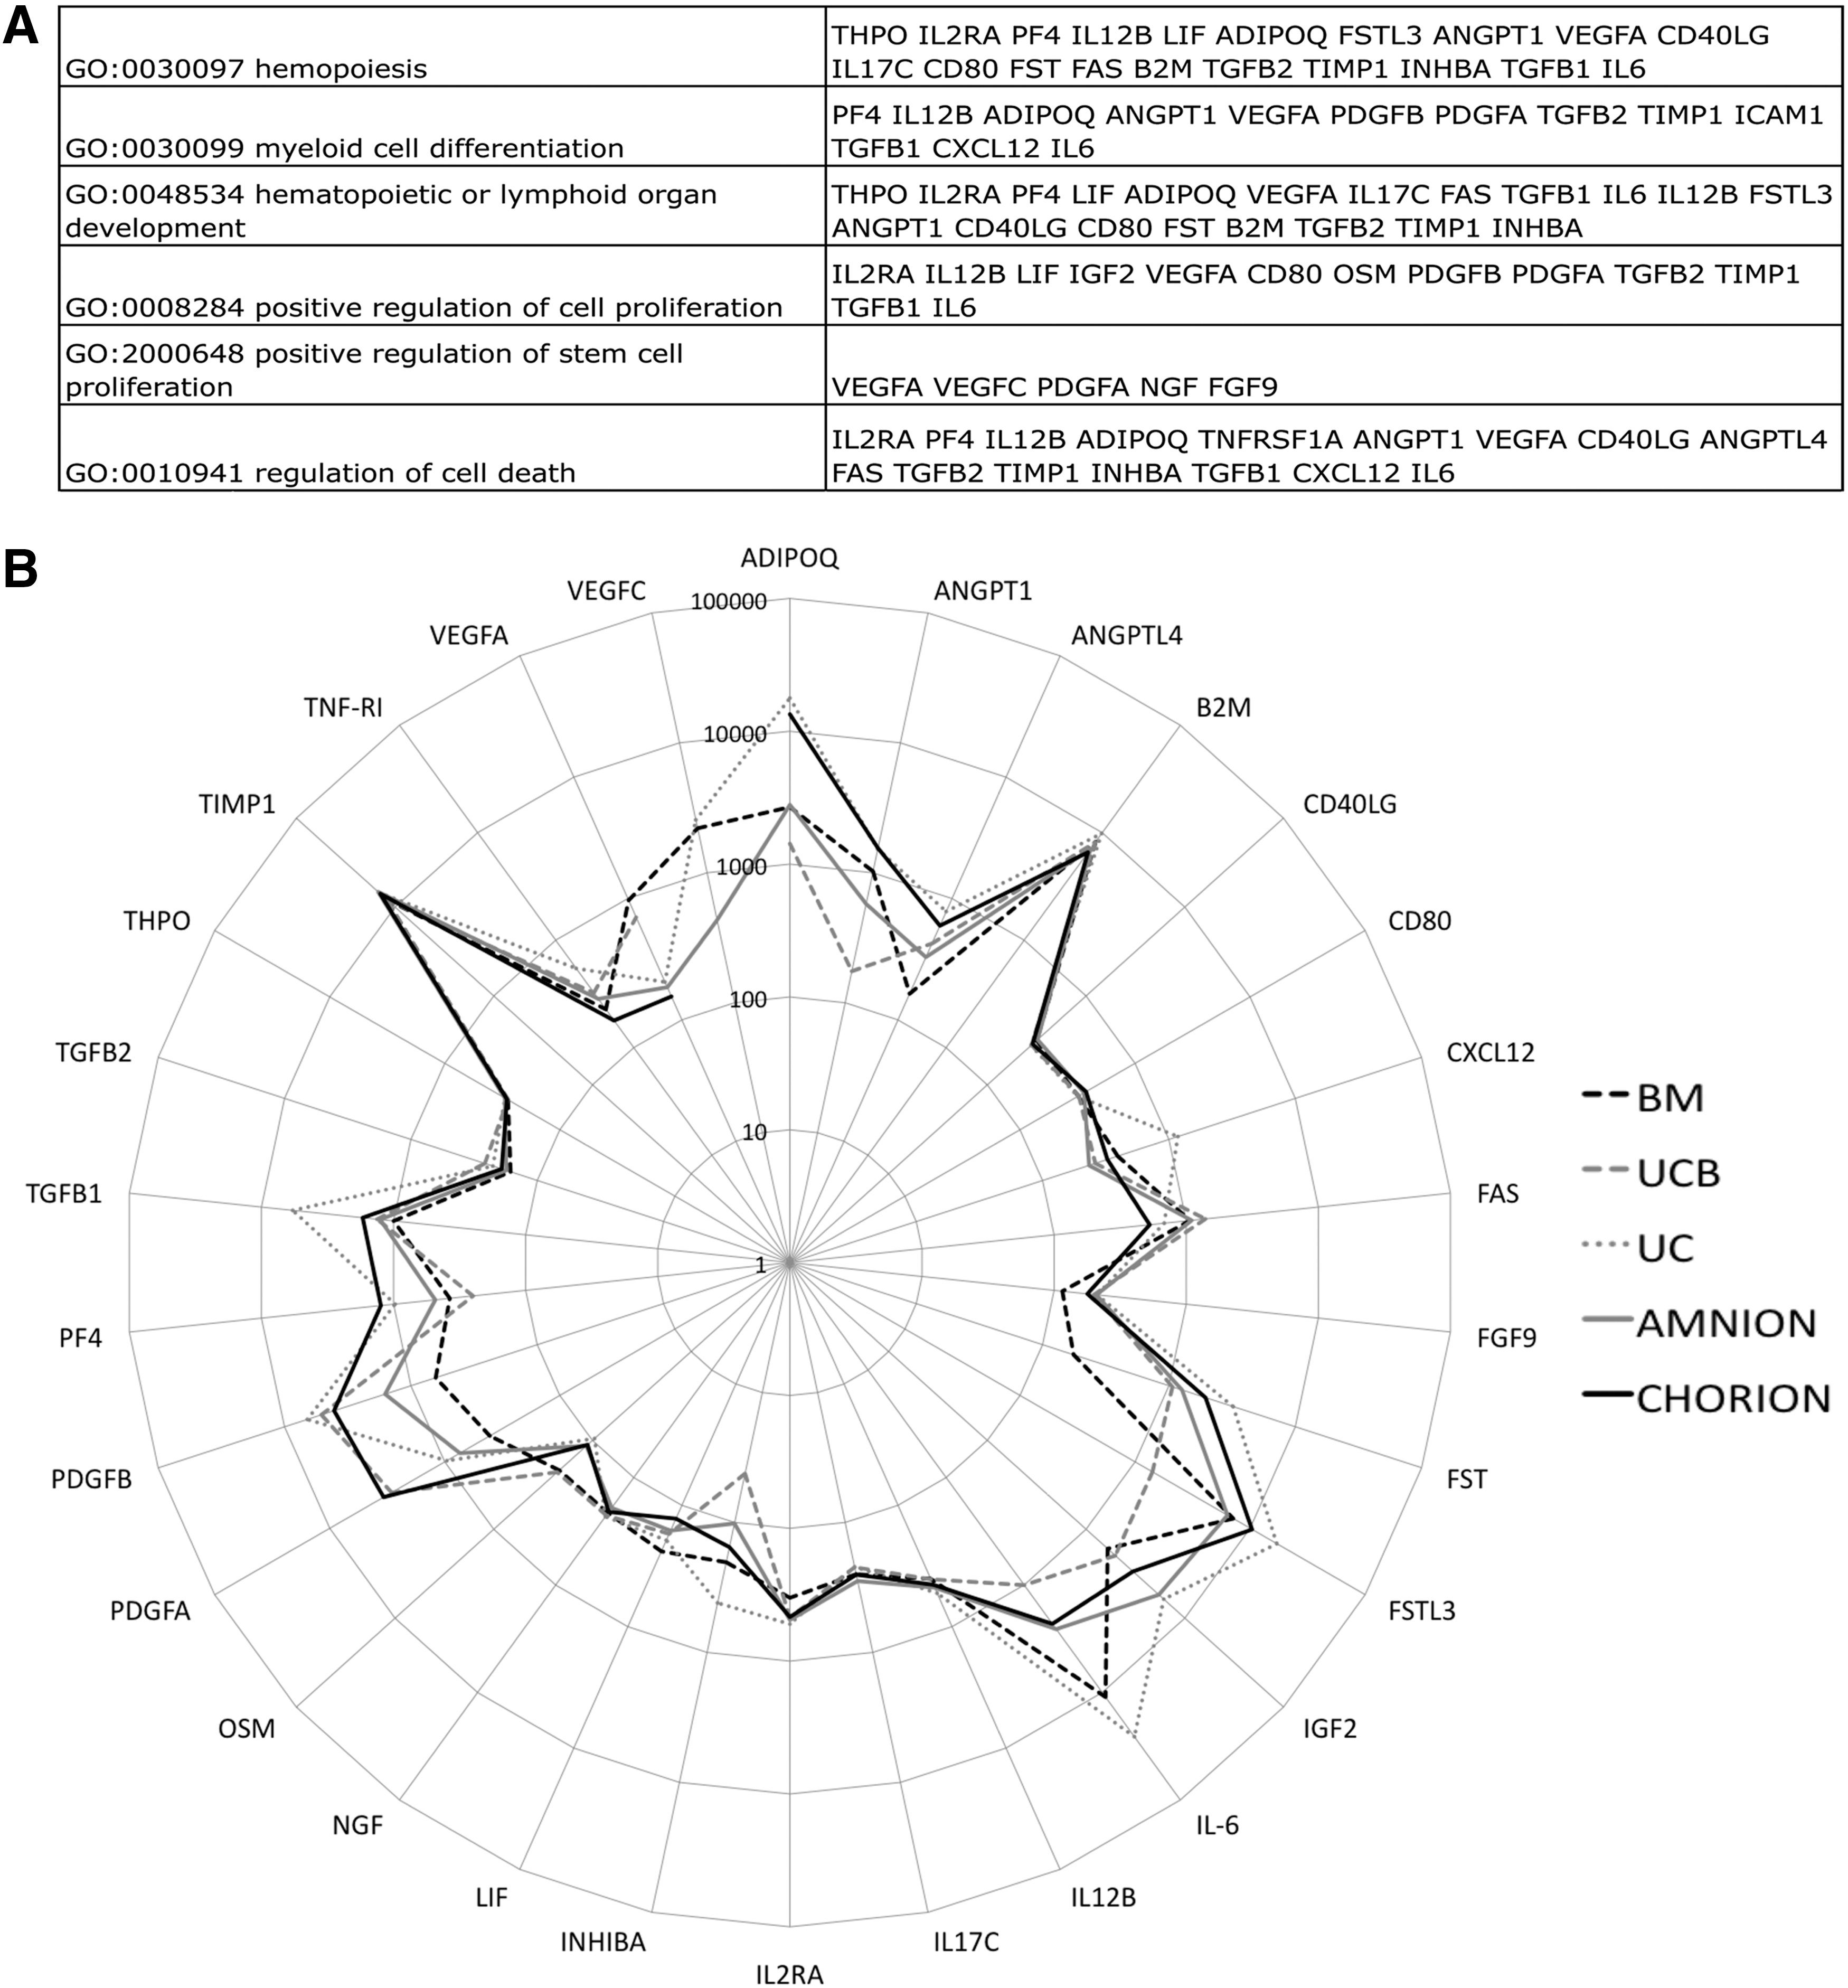
Protein array analysis of P-MSCs focused on hematopoiesis support.
Like for the HPC functional test, we tried to correlate a secretion profile of MSCs with their efficacy in immunomodulation. As described above, the conditioned media obtained after a 24-h culture of MSCs were assayed using Raybiotech protein array. We analyzed 117 analytes on GO database focusing on those related with our functional immunomodulation model. Using GO term best describing the putative phenomenon underlying the MSC immunomodulation potential (regulation of immune response and regulation of T-cell proliferation), we retrieved 27 cytokines of interest (Fig. 6A). The pattern of secretion comparing adult to P-MSCs were similar (Fig. 6B) suggesting similar hematopoietic support and immunomodulation capacities.
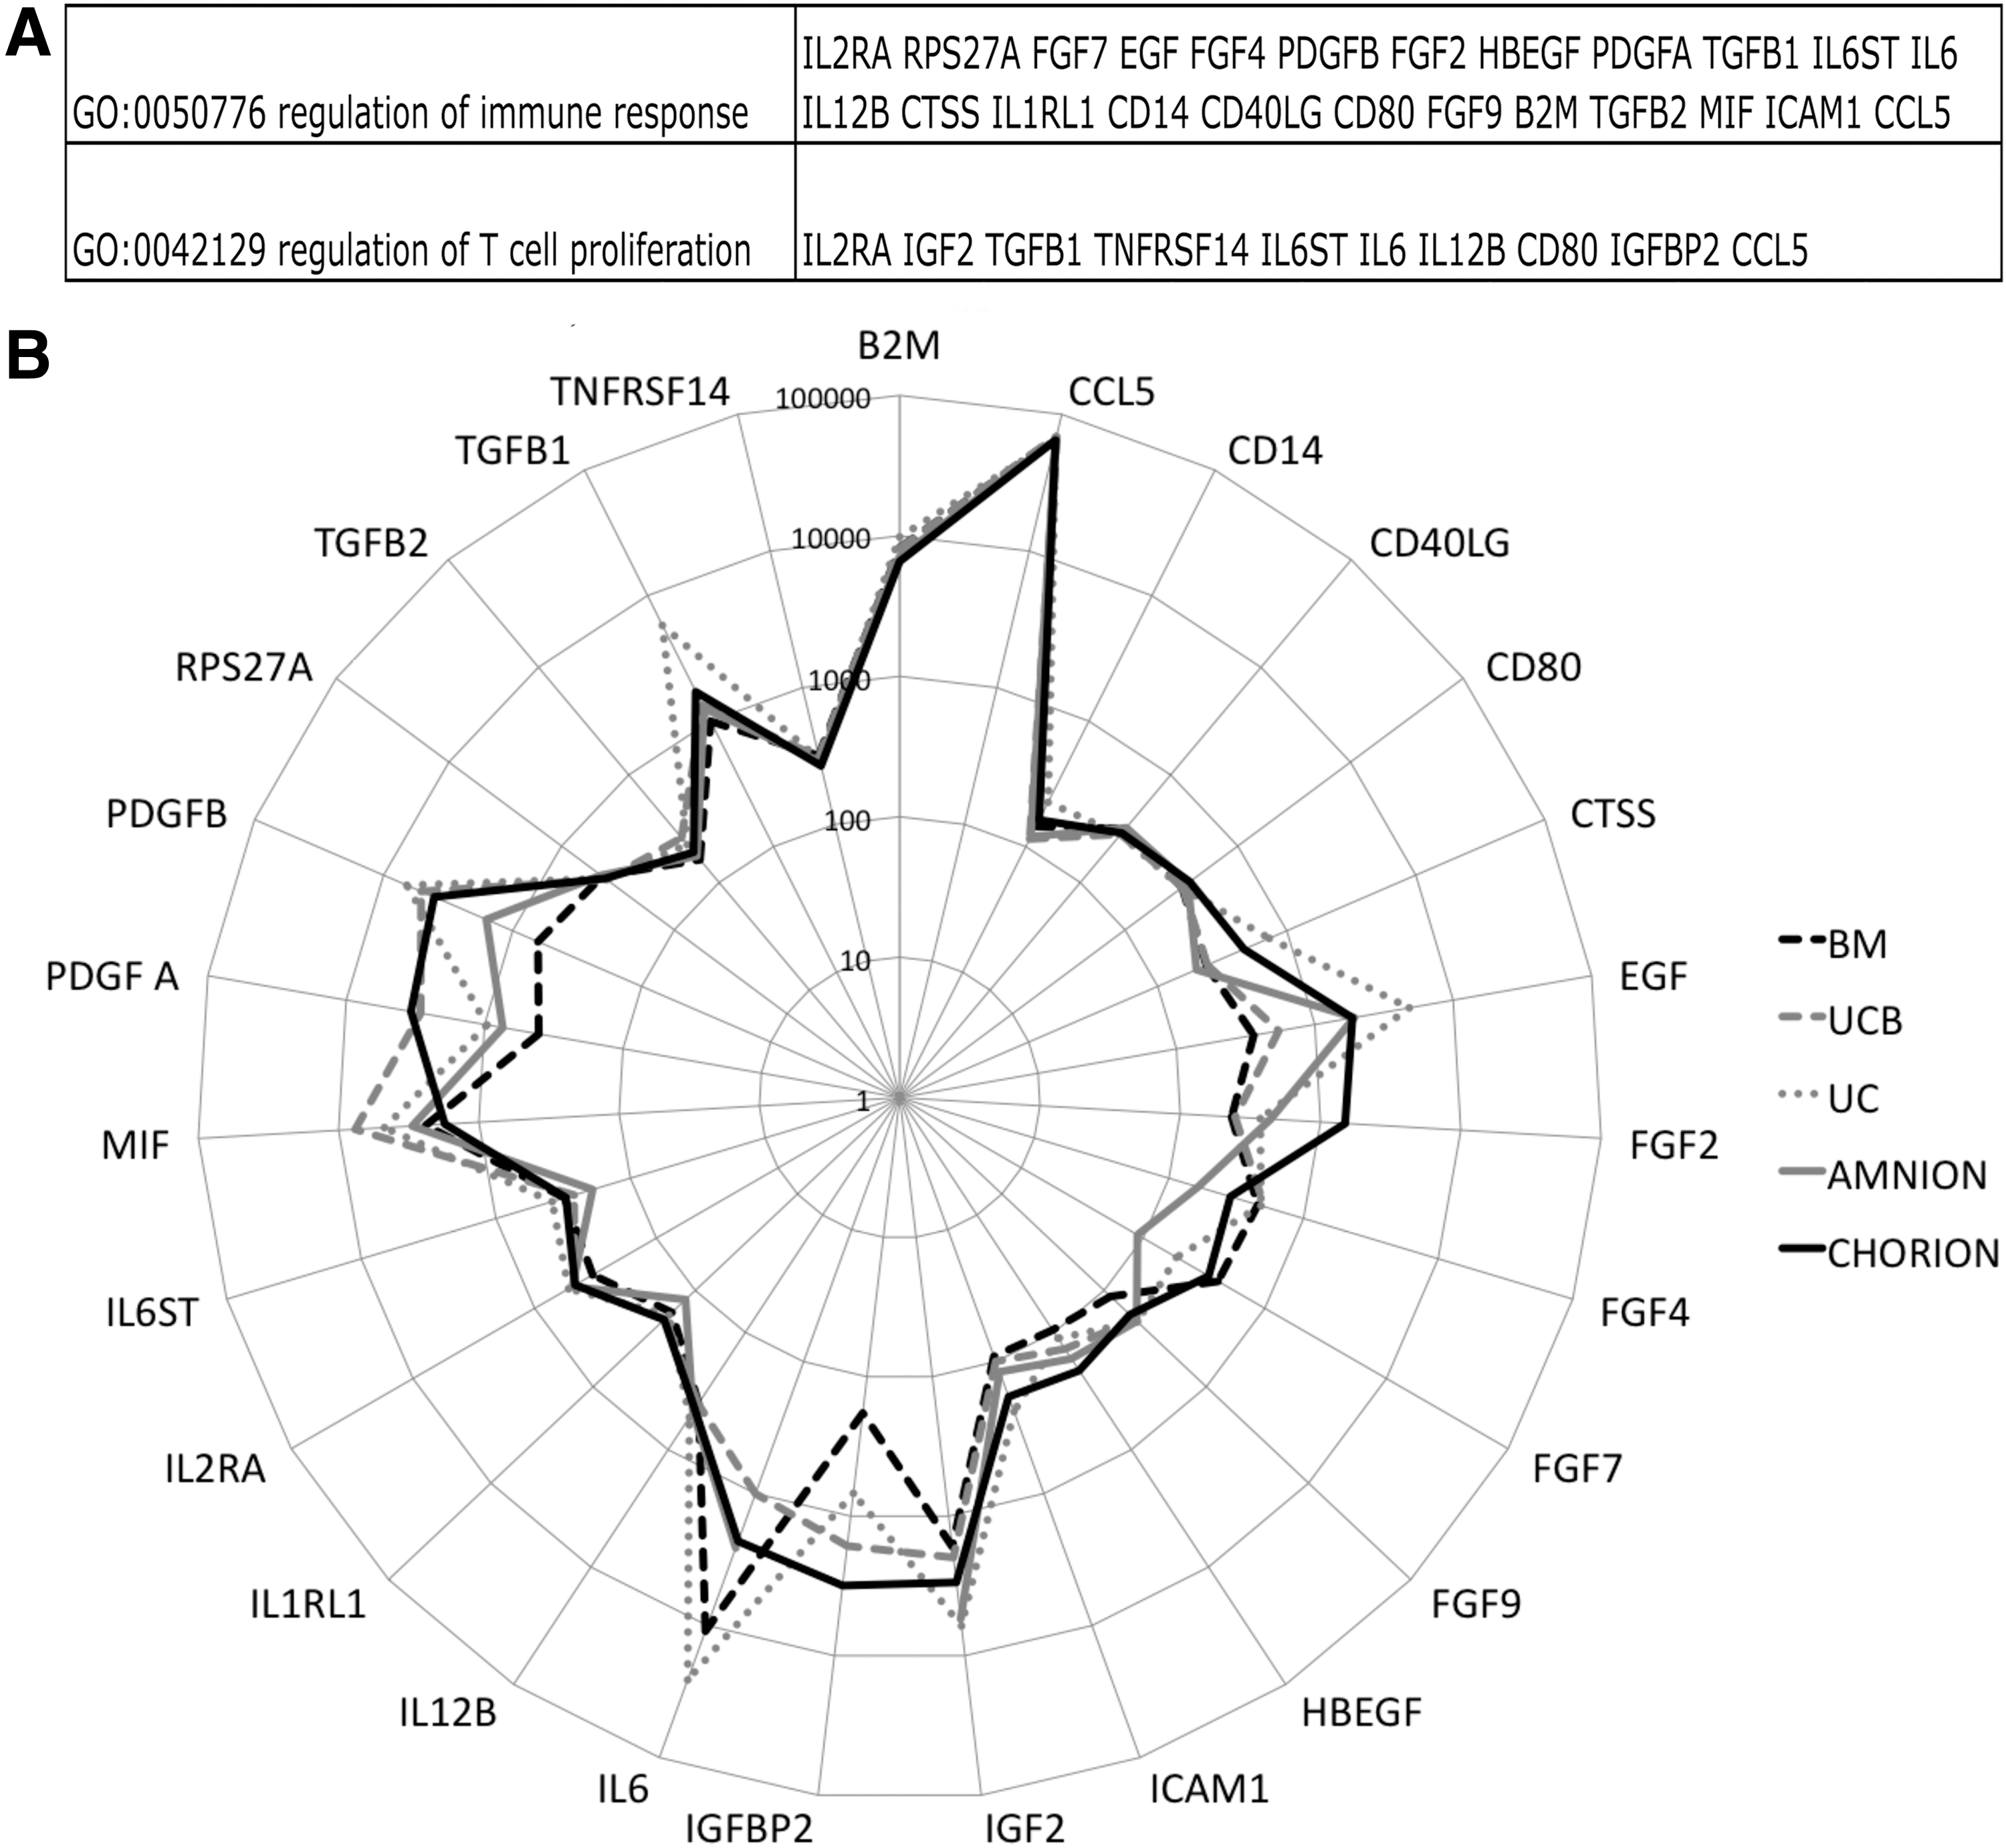
Protein array analysis of P-MSCs focused on immunomodulation.
Therefore, we aimed to evaluate the paracrine and supportive functions of P-MSCs by using hematopoietic stromacytic and immunomodulatory in vitro assays.
P-MSCs were able to support HPC growth and differentiation
We investigated whether P-MSCs were able to act as a stromal layer by supporting the growth and maintenance of HPCs. At day 4 of coculture, CD34+ cell proliferation was not significantly different when cocultured with or without MSC feeder, whatever their origin (Fig. 7A). At day 7 of coculture, CD34+ cell proliferation was significantly increased in the presence of all MSC feeders since we obtained 589,760±105,152; 501,446.4±88,985.5; 376,816.8±41,881; 338,928.3±19,119.7; and 307,766.4±37,364.2 CD34+ cells respectively for BM, UCB, UC, amnion, and chorion as compared to the condition without feeder (45539 CD34+ cells; ***P<0.001; Fig. 7A). Following 7 days of coculture in the presence of feeder MSC from perinatal sources, the total number of hematopoietic colonies was statistically increased compared with the condition without feeder (12,477.7 colonies vs. 150,109.9±7,635.1; 106,500.6±27,692.1; 75,730.5±2,138; 70,761.2±7,985.4; and 66,375.1±9,663.5 respectively for BM, UCB, UC, amnion, and choron-MSC feeder; **P<0.01 and ***P<0.001; Fig. 7B). This increase was mainly due to a positive effect of P-MSC feeder on CFU-GM (6,102.2 CFU-GM colonies vs. 57,787.3±5,449.7; 64,221.9±17,180.8; 49,031.1±1,527.2; 38,580.4±2,658.2; and 42,115.6±6,277.8 respectively for BM, UCB, UC, amnion, and chorion-MSC feeder; *P<0.05 and **P<0.01; Fig. 7B). However, no statistical difference was observed between BM and perinatal sources (Fig. 7B). Altogether, our results demonstrate that P-MSCs could improve CD34+ HPC proliferation and support their clonogenic potential in a manner similar to their BM counterpart.

BM as P-MSC was able to support HPC growth without affecting their clonogenic potency.
MSCs exhibit a specific phenotype in response to INFLA priming
MSCs are known to express a moderate level of HLA class I molecules. Efficiency of cytokine priming was attested through the statistically significant upregulation of HLA-ABC level expression for BM (Mean of MFI BM INFLA/MFI BM CTRL±SEM: 7.2±1.4), UCB (12.4±3), and chorion-MSCs (5.1±1.6) in INFLA condition (Fig. 8). Whereas steadystate MSCs did not express HLA-DR, we showed that an INFLA priming significantly enhanced HLA-DR expression level intensity by BM-MSCs (12.7±6.3) (Fig. 8). The other P-MSCs sources exhibited no or very low expression level of HLA-DR even if they were primed by INFLA cytokines (Fig. 8). We also observed a significant increase in CD54 expression for all MSCs after INFLA priming (181.3±116.2; 113.7±30.2; 84.7±14.5; 109±9; and 104.2±27.2 respectively for BM, UCB, UC, amnion, and chorion-MSCs MFI) (Fig. 8). Finally, we observed that INFLA priming of MSCs significantly increased the B7-H1 expression level for all sources except chorion-MSC (6.9±0.33; 5.1±0.6; 2.05±0.05; 2.3±0.06 respectively for BM, UCB, UC, and amnion-MSCs) (Fig. 8). Conversely, TOL priming did not modify the phenotype of MSC regarding the expression of HLA-ABC, HLA-DR, CD54, and B7-H1 (Fig. 8).
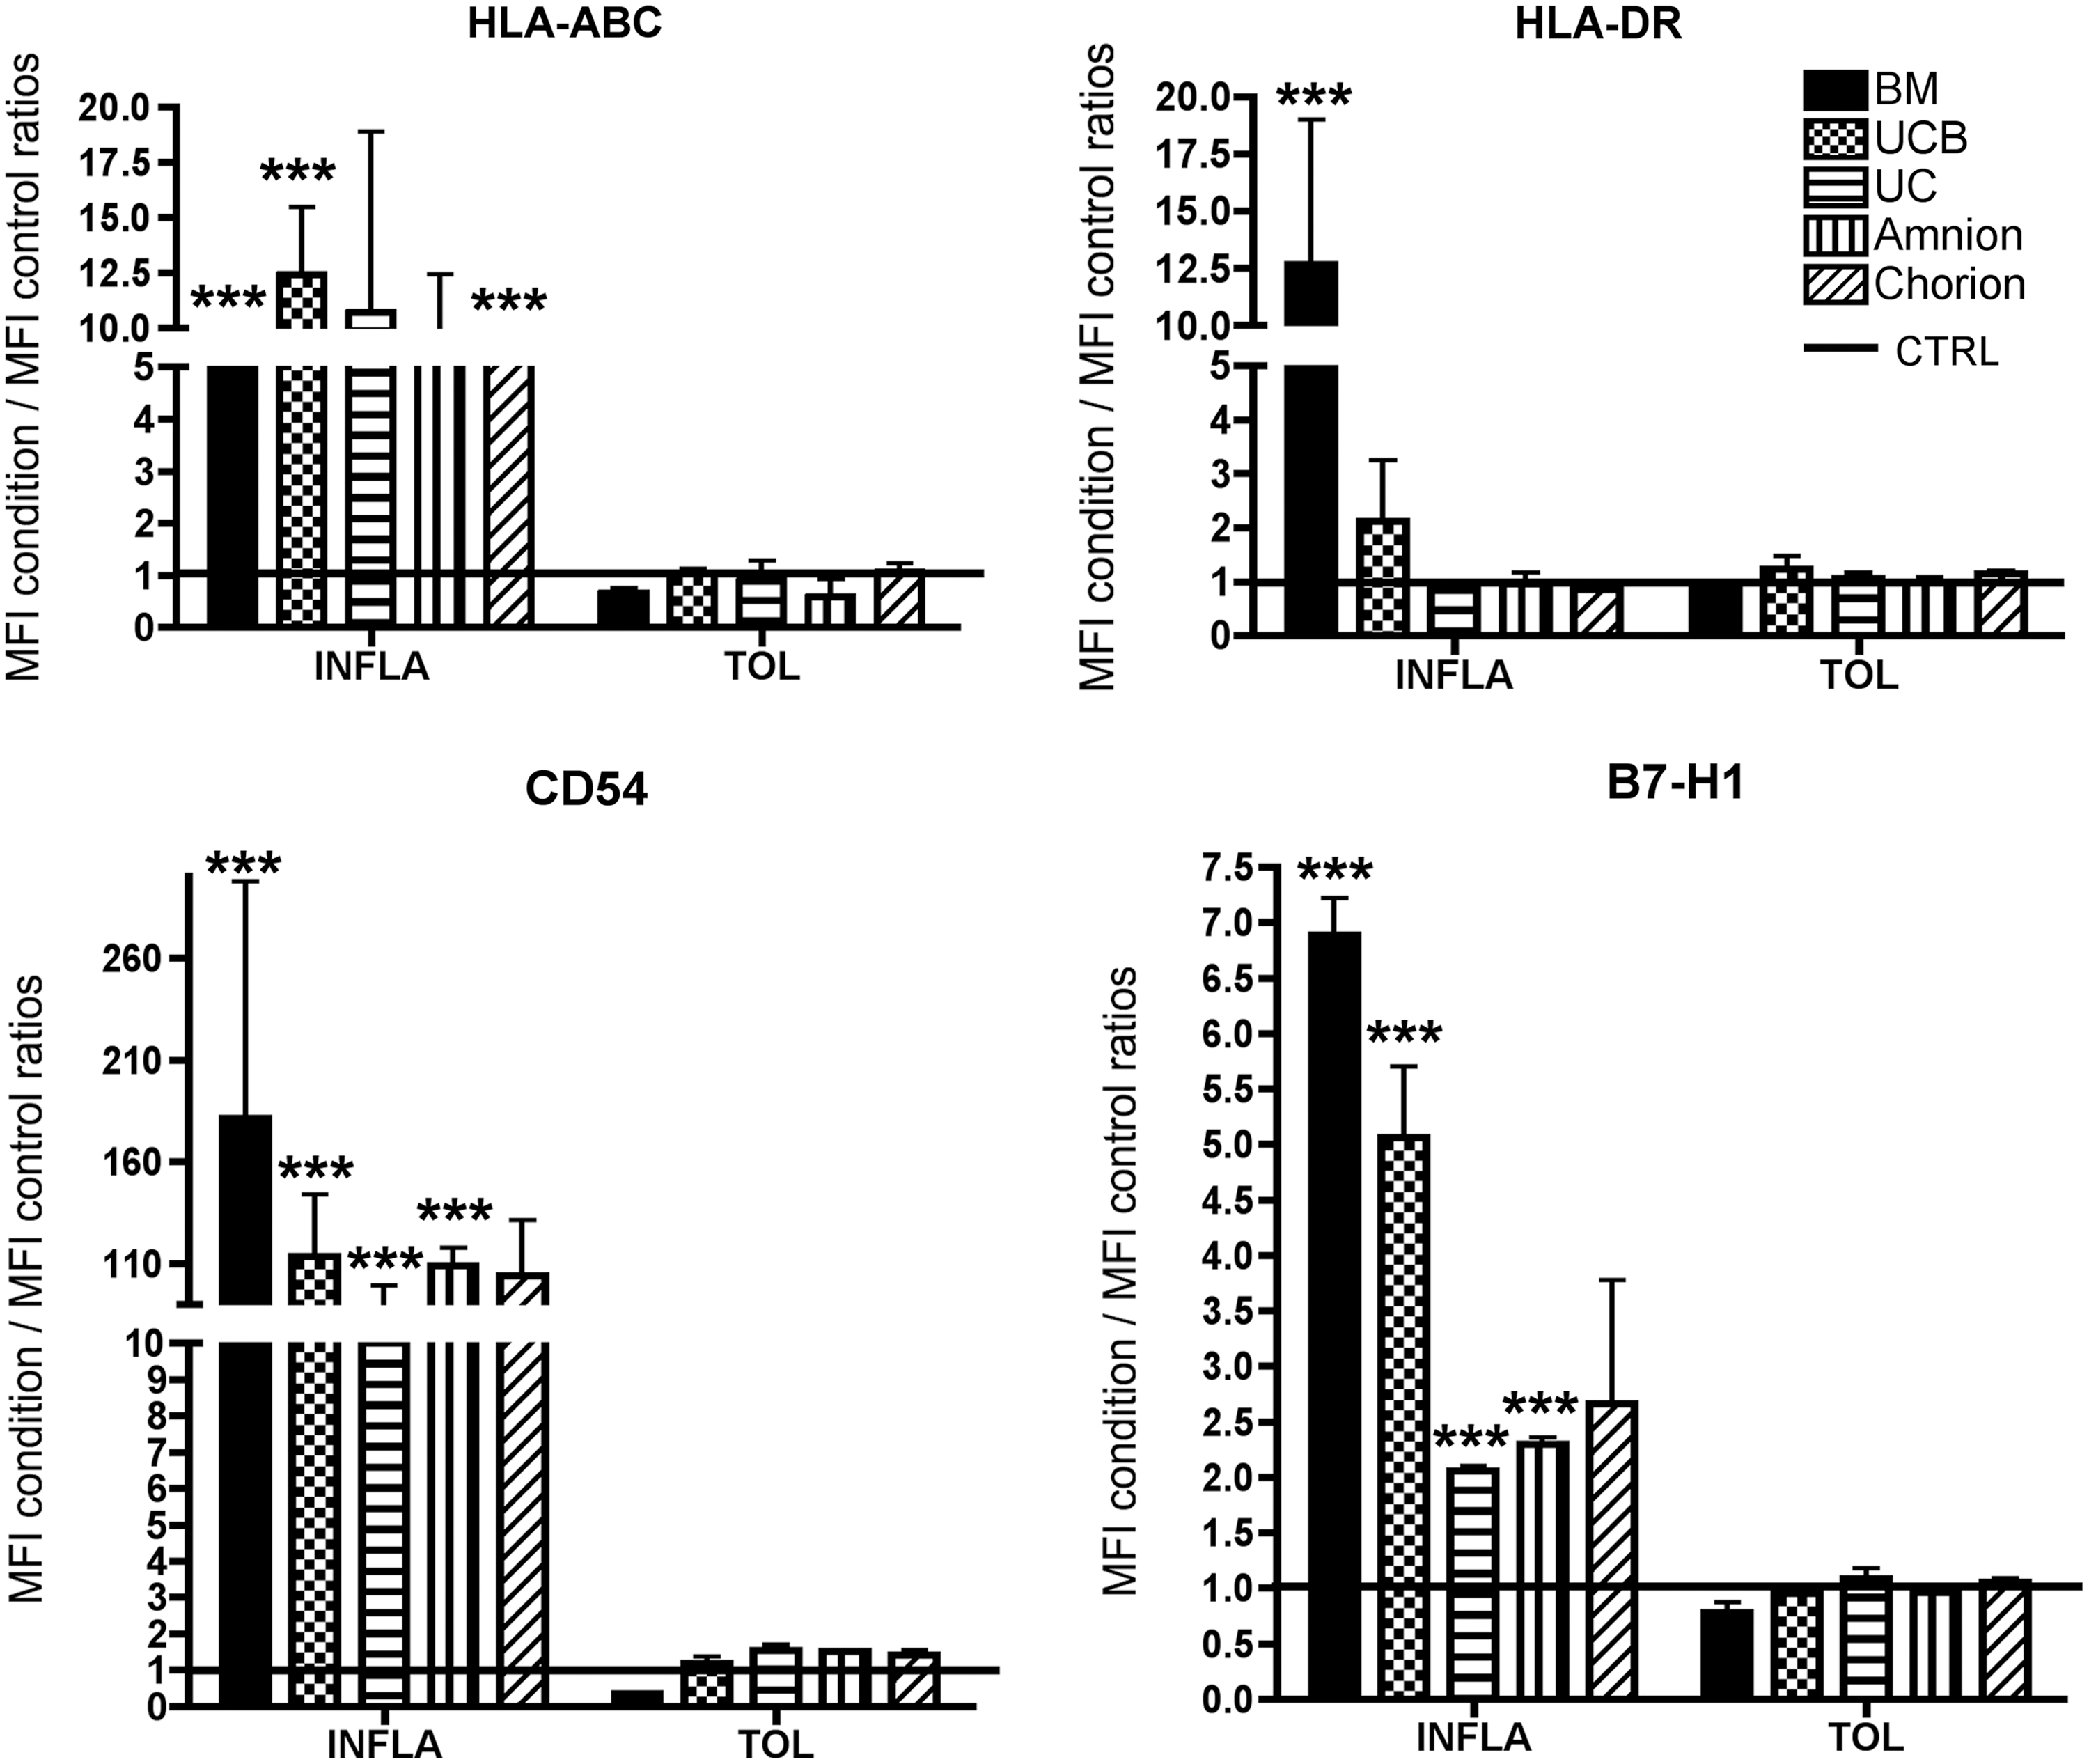
Modulation of HLA-ABC, HLA-DR, CD54, and B7-H1 expressed by MSCs primed by inflammatory cytokines. MSCs were cultivated in MEMα +5% PL or in MEMα +5% PL supplemented with two different cocktails INFLA or TOL (as described above). Histograms represented the mean fluorescence intensity (MFI) obtained in INFLA and TOL conditions/MFI obtained in CTRL condition, CTRL MFI was represented by a black line (n=3 for HLA-ABC and HLA-DR and n=2 for CD54 and B7-H1). Statistical analysis was conducted comparing INFLA to CTRL and TOL to CTRL within each tissue: *** indicates P value <0.001. PL, platelet lysate.
P-MSCs have low immunogenic properties as they do not stimulate HLA-mismatched PBMCs
We first evaluated whether the various sources of MSCs could stimulate lymphocyte alloproliferation in HLA-mismatched settings. At 2:1 ratio in control condition, we obtained 3,571±784.3 cpm for PBMC and BM-MSCs cultivated separately and only 971.6±271.6 cpm when PBMC were cocultured with BM-MSC; 2,903.4±237.8 cpm for PBMC and UCB-MSC cultivated separately and 2,454.3±931.7 when PBMC were cocultured with UCB-MSC; 1,663.4±134.2 for PBMC and UC-MSC cultivated separately and 6,025±3,189.7 when PBMC were cocultured with UC-MSC; 3,233.4±265.2 for PBMC and amnion-MSC cultivated separately and 1,747.7±584.8 when PBMC were cocultured with amnion-MSC; and 5,382.9±1,331.2 for PBMC and chorion-MSC cultivated separately and 5,658.4±830.2 when PBMC were cocultured with chorion-MSC (Fig. 9). These results showed that, when MSCs were cocultured with PBMC at a ratio of 2:1, a nonsignificant PBMC alloproliferation with two HLA-mismatched PBMCs was obtained as compared to PBMC and MSC cultured separately (Fig. 9). Furthermore, no alloproliferation was observed in response to other tested doses 4:1, 8:1, 16:1, or 33:1 of allogenic BM-MSCs or P-MSCs (data not shown) and no statistical difference was observed between the P-MSC sources (Fig. 9). Finally, priming of MSCs with INFLA (TNF-α +IFN-γ) or TOL (IL10+LIF+Progesterone) sets of cytokines did not modify their low immunogenicity (data not shown). Consequently, our results suggest that, similar to BM-MSCs, P-MSCs have low immunogenic properties in HLA-mismatched settings as they do not induce PBMC alloproliferation. This low immunogenicity was maintained when MSC were subjected to inflammatory or tolerogenic environment.
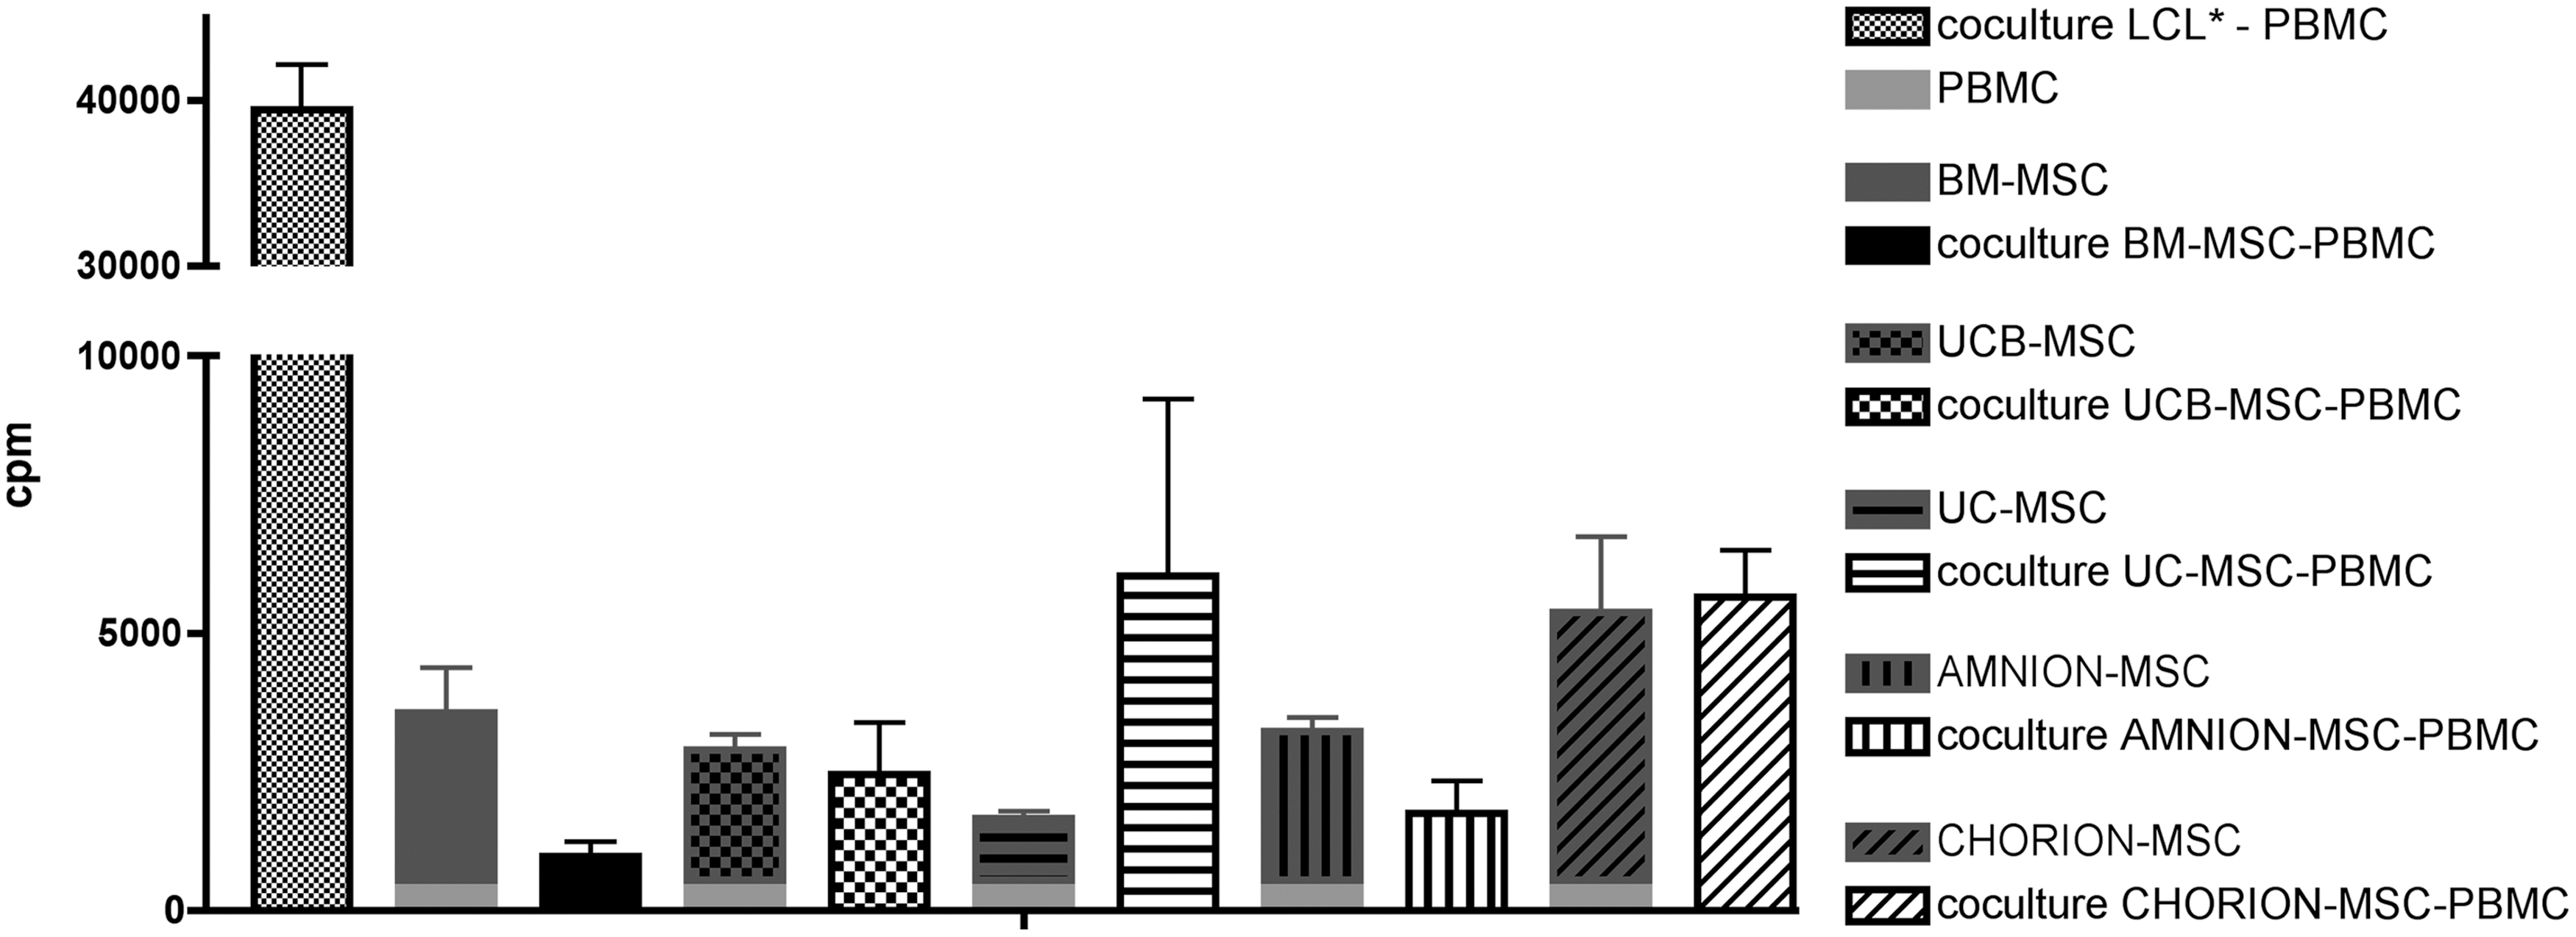
Absence of alloproliferative response of PBMC against naïve BM or P-MSC. Lymphocytes (responders) were incubated with 70 Gy-irradiated allogeneic human B-lymphoblastoid cell line LCL* 721.221 (stimulator) or with nonirradiated MSCs. Two PBMC responders/sample of MSC, n=3 MSC donor of each type. Five days later, 3H-TdR uptake was measured for each sample separately and in coculture. Mean±SEM of three independent experiments. Proliferation index=3H-TdR uptake on sample well (responder+stimulator+MSC)×100/3H-TdR uptake on control well (responder+stimulator). Inhibition index=100-proliferation index. Ratio PBMC:MSC 2:1. PBMC, peripheral blood mononuclear cell; SEM, standard error of the mean.
In vitro varaiability of MSC immunomodulatory properties according to the PBMC:MSC ratio
We then compared the influence of MSC source, donor and priming on their immunomodulatory properties toward T-cell function at different PBMC:MSC ratio (10:1, 20:1, 40:1, 80:1, and 160:1).
Donor and tissue variability of MSC immunomodulatory properties depends on the PBMC:MSC ratio
We first wanted to estimate the proportion of variance accounted by tissue origin or donor (Fig. 10A) using variance component analysis on a wide range of PBMC:MSC ratios. Indeed, in most clinical trials, MSCs were usually injected around 1 to 2.106/kg and considering the blood PBMC content in a 70 kg adult we can consider that PBMC:MSC ratio were between 70 and 350:1. At a high MSC concentration (10:1), commonly found in literature, the most important tissue variability in terms of MSC-related PBMC proliferation inhibition was observed as ascertained by 37.3% of total variance (Fig. 10A). Conversely, at a low MSC concentration (from 80:1 to 160:1 ratio) this tissue variability decreased to 0% (Fig. 10A). These results led us to compare the PBMC proliferation inhibition by MSC from different tissue origins at their most efficient ratio (10:1). In contrast, donor relative variability rises from 53.5% to 100% of variance from high MSC concentration (10:1) to low concentration of MSC more closer to therapeutic conditions (160:1) (Fig. 10A). These results led us to focus our between-donor variability analysis of PBMC proliferation inhibition by MSCs at low concentration (160:1 ratio).
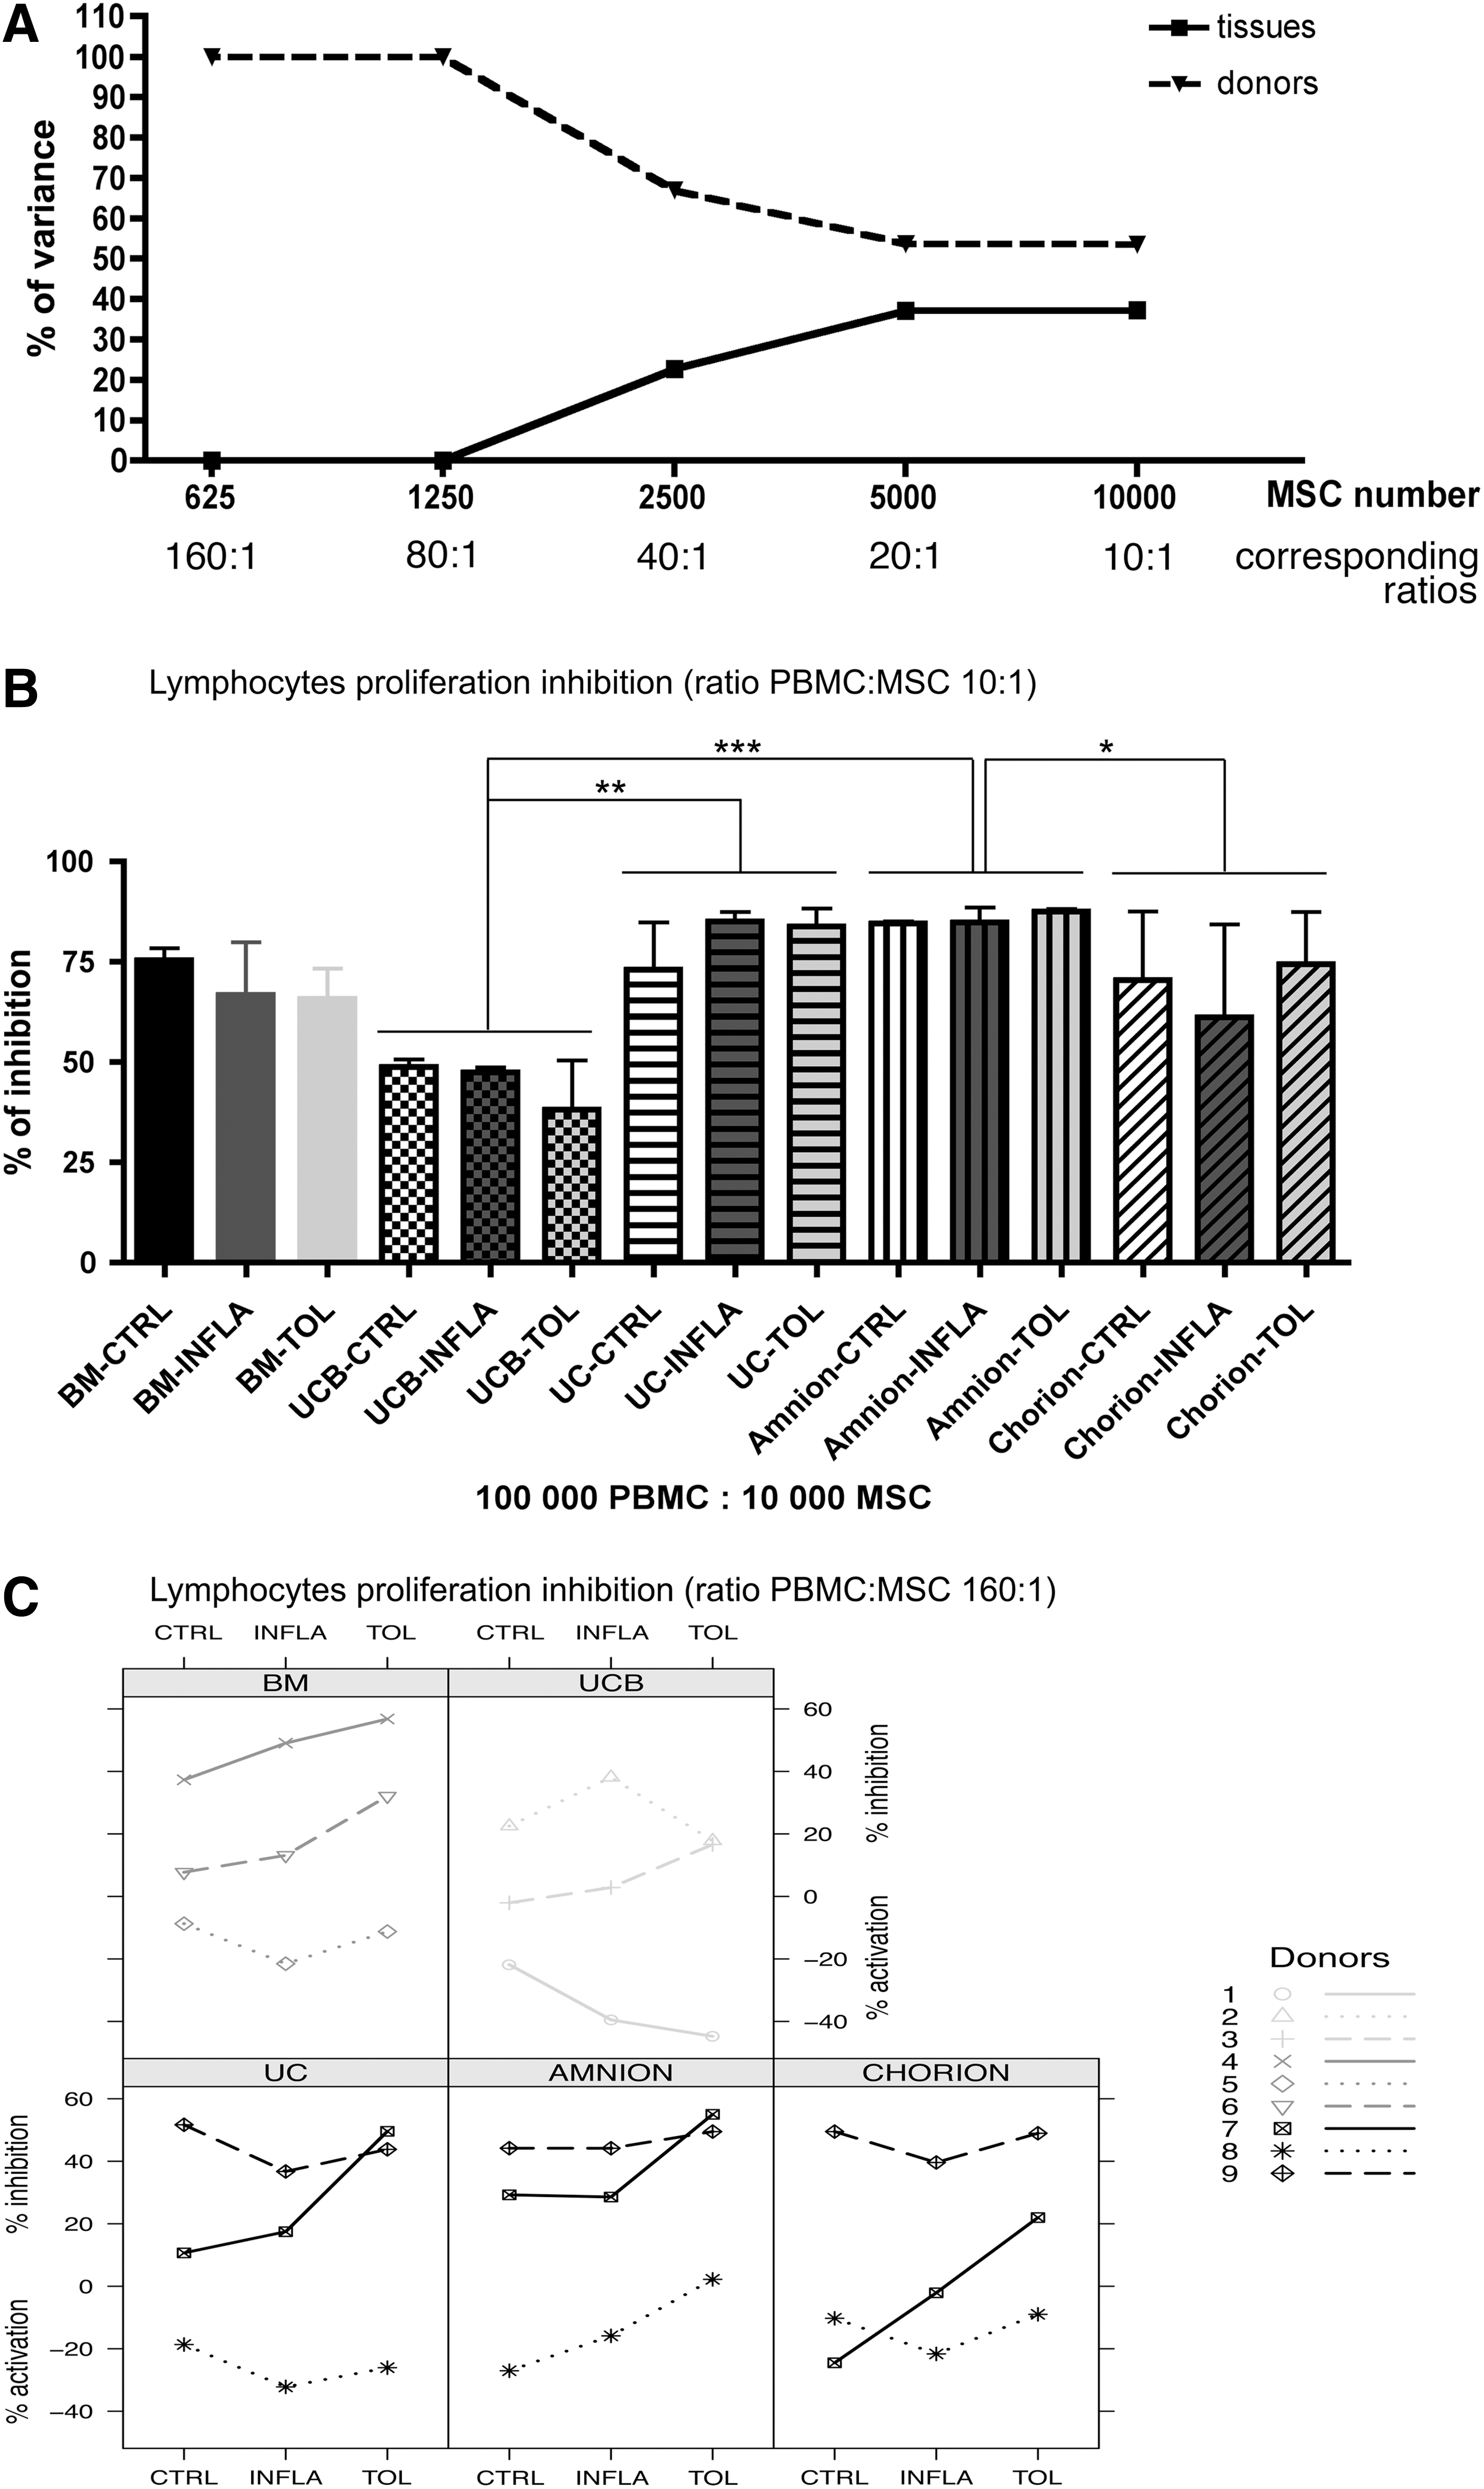
Dose and donor-dependant inhibition of proliferative response of activated PBMC when naïve or primed MSCs were added in third part cells. Lymphocytes (responders) were incubated with 70 Gy-irradiated allogeneic human B-lymphoblastoid cell line LCL 721.221 (stimulator), MSC were added in third part cells. Two PBMC responders/sample of MSC. MSC were unprimed or primed 72 h with two different cocktails: INFLA (composed of TNF-α +IFN-γ) and TOL (composed of IL10+LIF-+progesterone). Five days later, 3H-TdR uptake was measured. Mean±SEM of three independent experiments. Proliferation index=3H-TdR uptake on sample well (responder+stimulator+MSC)×100/3H-TdR uptake on control well (responder+stimulator). Inhibition index=100-proliferation index.
P-MSCs exhibit immunomodulatory properties as they inhibit PBMC alloproliferation at a high PBMC:MSC ratio
At 10:1 ratio, we observed that the percentage of T-cell alloproliferation inhibition by P-MSCs was not significantly different from BM-MSCs in unstimulated conditions (75.4%±3%, 48.83%±1.9%, 73%±12%, 84.5%±0.6%, and 70.5%±17.1% (mean±SEM) respectively for unstimulated BM-, UCB-, UC-, amnion-, and chorion-MSC; Fig. 10B). At this ratio we observed that INFLA and TOL priming did not significantly increase these percentages of suppression as assessed by a two-way ANOVA (Fig. 10B). Furthermore, the percentage of inhibition was significantly higher for UC (80.6%±4.2%) and amnion (85.6%±1.2%) compared with UCB-MSCs (44.8%±4%) regardless of culture conditions. In addition, the percentage of inhibition was also significantly higher for amnion-MSCs (85.6%±1.2%) than chorion-MSCs (68.7%±9.3%) (Fig. 10B) while no statistical difference was observed between BM-MSCs (69.3%±4.7%) and any other P-MSC source.
At 160:1 ratio, we observed greater tissue homogeneity and donor heterogeneity of T-cell alloproliferation inhibition (Fig. 10C). Interestingly, at this ratio we observed a trend toward an increasing inhibitory capacity for some donors under INFLA or TOL priming, but not for all donors (Fig. 10C). Control level inhibition did not appear to be predictive of the donor response to one or the other priming.
Collectively, our results led us to propose that, at clinically relevant PBMC:MSC ratio, the T-cell alloproliferation inhibition capacity of MSC has to be tested for each donor in primed conditions. This test could be considered as a release criteria for MSC selection for banking.
Discussion
MSC represent a heterogeneous stromal cell population, which is increasingly used for clinical applications. BM is the traditional source of MSCs, however, its collection requires an invasive and painful procedure, causing us to consider alternative sources such as perinatal tissues. P-MSCs cells are easily accessible by a noninvasive collecting process that is harmless to the mother and baby. P-MSC isolation procedures are also relatively simple to perform and provide a good cell yield except for UCB source from which MSC isolation is very difficult since MSCs were obtained in only ∼10% of UCB units (data not shown and [37,38]).
As expected, we showed that all P-MSCs expressed mesenchymal markers and no hematopoietic or specific endothelial makers (Fig. 1). Furthermore, we showed that BM and UCB-MSCs expressed high level of CD146 and that these cells also exhibited a higher capacity to support HPC growth and differentiation (Figs. 1 and 5). These results are in accordance with results from Sorrentino group showing that CD146 may represent an in vitro surrogate model for HPC long-term culture as CD146+ MSCs produced several growth factors that may play a pivotal role in hematopoietic niche regulation [39]. In our experiments, we found that all P-MSCs readily differentiated toward osteo- and chondrogenic lineages but not toward adipogenic lineages that is in agreement with previous studies [27]. As previously reported by In't Anker et al., HLA analysis of our culture-expanded cells showed that only UC and amnion samples were of pure fetal origin [5]. Our P-MSC proliferation rates were similar to BM-MSCs even if chorion-MSCs also exhibited a statisically lower clonogenic potential. These chorion dyscrepancies could be related to the presence of contaminated maternal cells from decidua parietalis clinging to the chorionic membrane [5].
As P-MSCs did not completely fit with ISCT definition of MSCs in terms of multipotency differentiation, we explored their functions related to their secretion activity [36]. For this purpose we analyzed MSC supernatants and detected 117 secreted proteins among which 30 cytokines were involved in supporting hematopoiesis and 27 cytokines were involved in regulation of immune response (Figs. 6 and 10). As previously described by Yoo et al., we observed that the secretion patterns of MSC were very similar between BM- and P-MSCs [29].
The major limitation for HPCs transplantation is the insufficient number of HPCs that can be collected from a patient that could increase the rate of engraftment failure and mortality [40 –43]. The stromacytic MSC potential was used for improving HPC in vitro expansion protocols in clinical settings for more than two decades [44 –46]. BM-MSCs may provide a specialized microenvironment with an appropriate network of cytokines, adhesion molecules, and extracellular matrix proteins, which could influence HPC fate [24,47,48]. Few studies have used MSCs from perinatal origin to create this environement in vitro, and no study to our knowledge compared all sources of MSCs. We therefore conducted these studies by comparing at once supportive functions of BM and P-MSCs toward HSPC in vitro. Like BM-MSCs, UC-MSCs may provide stromal support structure for the long-term culture of cord blood HPC [49], and they were shown to enhance formation of CFU-GM colonies by HPCs and to enhance their engraftment in a combine transplant immunodefiscient mice model [50]. Kogler et al., published that USSC (comparable to our UCB-MSCs) produce functionally significant amounts of hematopoiesis-supporting cytokines and are superior to BM-MSC in expansion of CD34+ cells from CB [51]. Finally, Mizokami et al., had shown that amnion-derived adherent cells had the ability to support the proliferation and maintenance of Lin-CD34+ cells in short-term cultures as well as in long term culture systems [52]. In our study, we obtained a significant difference of CD34+ growth in presence of MSC feeder wathever their origin as compared to the free-feeder condition (BM-MSCs and P-MSCs) (Fig. 7). Interestingly, Bakhshi et al. demonstrated that the MSC feeder was also hugely donor dependant within a tissue source. These results led to the idea that for cell therapy settings, MSC from different donors should be selected prior to their banking, through in vitro functional predictive tests [34]. Therefore, we suggest that perinatal tissues may be attractive sources for HPC ex-vivo expansion due to the availability of many testable donors.
Another scope of activity of MSCs is their immuno-modulatory properties, for which we sought to study two different aspects: (i) third party protection: in a model of T-cell proliferation induced by a stimulatory cell line (mimicking both transplanted organ rejection or GVHD), and (ii) self-protection, in which MSC served as the stimulatory cell (studying MSC survival). GVHD represents a major complication after allogeneic hematopoietic stem cell transplantation and affects the skin, liver, gut, and other organs [53,54]. Le Blanc et al. first reported successful treatment of a patient with severe acute GVHD using third-party haploidentical MSCs [55]. Our data showed that P-MSCs appear to be at least as nonimmunogenic as BM-MSCs on a short-term test (Fig. 9). This is in accordance with other studies where P-MSCs failed to induce an allogeneic or xenogenic immune response in MLR [56]. As expected, both origins exhibited low expression of highly polymorphic MSC class I and did not express surface MHC class II molecules (Fig. 8). Moreover, our data showed that naïve UC, amnion and chorion-MSCs expressed a much higher level of CD200 than BM or UCB-MSCs (Fig. 1). Pietila et al. showed that BM-MSCs ability to inhibit TNF-α secretion of activated macrophages was correlated with CD200 expression. When they blocked the binding of CD200 ligand (OX-2) to its cognate CD200 receptor this capability of BM-MSCs was abolished [57]. According to these results we can suggest that MSC from UC, amnion, and chorion origin could exhibit a higher anti-inflammatory activity compared with BM.
Many studies have highlighted that the surrounding environment had a pivotal effect on MSC immunosuppressive activity [25]. Numerous reports have demonstrated in vitro that pretreatment of MSCs with IFN-γ or TNF-α could enhance their immunomodulation effect [31,56,58 –60]. This effect appeared to be partly mediated through enhanced secretion levels of TGFβ by MSC [61], or the combination of indoleamine 2,3-dioxygenase (IDO) [62] and hepatocyte growth factor, which synergistically act leading to the induction of cyclo-oxygenase-2 [63]. Moreover, Polchert et al., has demonstrated that MSCs pretreated with IFN-γ more efficiently suppress GVHD in a mouse model than untreated MSCs [60]. The efficiency of our pro-inflammatory priming was demonstrated through the upregulation of HLA-ABC, CD54, and the apparition of HLA-DR and B7-H1 in BM-MSCs and UCB-MSCs. Interestingly, we showed that P-MSCs issued from perinatal stromal tissues never expressed HLA-DR under inflammatory conditions (Fig. 8). Similar results were obtained by the Prasanna study where HLA-DR was not detected on Wharton's Jelly-MSC upon treatement with either IFN-γ or TNF-α [31]. During pregnancy, a particular inflammatory environment leading to the trophoblastic secretion of immune-modulatory factors has been suggested to prevent the rejection of the histoincompatible fetus [64]. Therefore, we created an in vtro “tolerogenic” priming environment mimicking placental environment and demonstrated that primed MSCs suppressed stimulated lymphocytes proliferation in a dose- and donor-dependant manner (Fig. 10).
Numerous studies have already demonstrated that MSC populations exhibit donor-to-donor heterogeneity [65]. Our results of MLR at a PBMC:MSC ratio of 160:1, closer to physiological conditions, indicated that donor effect overcame the variability linked to tissue source and priming (Fig. 10). Moreover, as stated by Galipeau, the recent failure of MSCs in a phase III GVHD clinical trial has enforced the need for predicitive in vitro testing of MSC donor variability [34], and these tests would be more predictive by mimicking the environment in which the cell would be injected [66]. Furthermore, on very short-term outcomes, priming might be the main modulator of MSCs behavior after injection. Indeed, there are probably two parameters that can discriminate a well- versus non-adapted donor: (i) antigen mismatch with the recipient if long-term survival is required and (ii) the trophic factors secreted by MSCs in response to the environment [67 –69].
In summary, we confirmed that P-MSC exhibited an in vitro potential to modulate immune response and to support in vitro HPC expansion. In our opinion, elaborating predicitive in vitro tests to evaluate between-donor variability is crucial for banking functional standardized P-MSCs. Futhermore, these preselective potency assays would be predictive by mimicking the environment into which cells will be administrated. Moreover, regarding their huge availability, the facility to screen a large number of donors and their high proliferative potential, P-MSCs must be considered as a privileged source for allogeneic cell-based therapies.
Footnotes
Acknowledgments
We are not only indebted to Mme Monod-Broca and the whole team of HIA Bégin Maternity, but also the Unité de thérapie cellulaire Hôpital Saint-Louis especially Pr. Jérôme Larghero, Assistance Publique-Hôpitaux de Paris, for supplying all perinatal tissues and service de chirurgie orthopédique of HIA Percy for supplying BM tissues. We also extend special thanks to Patrick Saint Blancard and his team of Service d'anatomie-pathologie, HIA Percy, Clamart for their knowledge and technical support concerning in vitro differentiation analyses. We also want to thank HLA department of CTSA and particularly Laurence Poirrier. Finally, I also want to particularly thank Kyle Lund for his help.
Author Disclosure Statement
This work was supported by grants from ANR (Agence Nationale pour la Recherche) and by Servier laboratory. Authors do not declare any conflicting financial interests.
Ethical Conduct of Research
For investigations involving human subjects, informed consent has been obtained from the participants involved.