
Abstract
Human embryonic stem (HUES) cells are derived from early individual embryos with unique genetic printing. However, how their epigenetic status might affect their potential to differentiate toward specific lineages remains a puzzling question. Using chromatin immunoprecipitation (ChIP)–polymerase chain reaction and ChIP-on-chip, the status of bivalent domains on gene promoters (ie, histone 3 on lysine 4 and histone 3 on lysine 27 trimethylation) was monitored for both undifferentiated and bone morphogenetic protein 2 (BMP2)-induced cardiac-committed cells. A marked difference in the epigenetic profile of HUES cell lines was observed and this was correlated to the pattern of gene expression induced by BMP2 as well as to their potential to generate cardiac progenitors and differentiated myocytes. Thus, the epigenetic H3trimeK4 and H3trimeK27 prints generating bivalent domains on promoters, could be used to predict a preference in their differentiation toward a specific lineage.
Introduction
H
Epigenetic studies have brought important insights into the unique properties of ES cells [2]. Besides the genetic code, the epigenetic code is likely to be a key regulator of not only the pluripotent state [3], but also of HUES differentiation potential. Among diverse histone modifications, methylations of histone 3 on lysine 4 (H3K4) and lysine 27 (H3K27) are established marks, which are crucial for developmental cell lineage specific pathways [4]. While methylation of H3K4 mediated by a trithorax complex positively regulates gene expression by serving as a scaffold to recruit chromatin-remodeling enzymes, H3K27 trimethylation catalyzed by polycomb complex 2 confers a compact structure to chromatin, preventing gene transcription.
HUES cells are derived from early embryos, at a stage of development (ie, blastocyst) at which epigenetic marks of the genome inherited from both the maternal and the paternal genome are partially conserved. A recent report also showed that epigenetic marking in sperm is correlated with developmental regulators and is close to that of ES cells [5]. Whether the histone demethylation wave, which occurs in the fertilized embryo affects the overall histone methylation, is still controversial [6]. Thus, following the derivation and maintenance in culture, it is possible that the cell lines retain the embryonic epigenetic print from the stage of derivation. The latter might reflect slightly different stages of embryonic development which could influence the epigenetic print of the embryo. Indeed a recent study revealed a different histone modification status in inner cell mass-derived stem cells and primitive endoderm-derived Xen cells [7].
Interestingly, the promoters of transcription factors specific of cell lineages feature both activating methylated H3K4 and repressive methylated H3K27 epigenetic marks (ie, bivalent domains) at early stage of development, enabling these cells to quickly turn on gene transcription upon differentiation either by gaining H3K4 methylation and/or by losing H3K27 methylation [8]. However, regulation of the state of bivalent domains by extracellular signals in HUES cells has not been reported yet.
In this study we investigated the epigenetic marks constituting the bivalent domains present on promoters of genes coding for early transcription factors in two HUES cell lines, based on their differential cardiogenic potential under spontaneous or bone morphogenetic protein 2 (BMP2)-driven cardiac specification. We broaden the study using chromatin immunoprecipitation (ChIP)-on-chip to extensively investigate bivalent marks of the two cell lines under control or BMP2-stimulated conditions.
Materials and Methods
Culture and cardiac commitment of human pluripotent stem cells
HUES cell lines were cultured on mouse embryonic fibroblasts (MEFs; passages P2–P4) prepared from E14 mouse embryos using knock-out Dulbecco minimum essential medium (KO-DMEM) medium supplemented with β-mercaptoethanol, glutamine, nonessential amino acids, 15% knock-out serum replacement (KOSR), and 10 ng/mL fibroblast growth factor 2, respectively. The medium was warmed at 37°C and changed every day. Cell colonies were dissociated into single cells every 4 days using a short (3 min) trypsin treatment.
HUES cells were treated for 48 h with 10 ng/mL BMP2 in the presence of 1 μM SU5402, a FGF receptor inhibitor, in KOSR-DMEM or for 4 days in Roswell Park Memorial Institute medium added with B27 (Life Technology) to sort out SSEA-1+ cardiac progenitors. HUES cells were used within no more than five passages (P30–P35). Cells were phenotyped every 10 passages using anti-SSEA-3/4, TRA-1-60, and TRA-1-80 antibodies (Chemicon). Less than 5% of cells were positive for SSEA-1 (Chemicon). Karyotype was found normal and stable in the course of the experiments.
Cardiac differentiation
To induce cardiac differentiation, HUES cells were dissociated into clumps using Dispase 1 mg/mL (Invitrogen) for 20 min at 37°C, and maintained in suspension in low attachment six-well plates (Corning), in a differentiation medium containing 80% DMEM/F12 media, 20% fetal bovine serum (Hyclone), 1 mM
Immunofluorescence of EBs
EBs in culture were subjected to specific immunostaining by using a cardiac troponin T primary antibody (mouse monoclonal antibody, NeoMarkers, 1 μg/mL) and Alexa Fluor 488- (green) conjugated secondary goat antibodies. Briefly, EBs in culture were fixed with 4% paraformaldehyde for 20 min at 4°C, permeabilized and blocked in phosphate buffered saline (PBS)–0.1% saponin containing 10% goat serum for 2 h at 37°C, and incubated with the primary antibody in PBS–0.1% saponin containing 1% goat serum, overnight at 4°C. Cells were then incubated with the conjugated secondary antibody for 1 h at room temperature.
Fluorescence-activated cell sorting analysis
Fluorescence-activated cell sorting (FACS) analysis of SSEA-1 and markers of pluripotency (SSEA-4, Tra-1-60, Tra1-80) of HUES cell lines was performed using a FACSCalibur (Becton-Dickinson). For SSEA-1, the gates were set according to nontreated HUES cells (used as negative controls) and mouse ES cells (used at a positive control).
Real-time quantitative polymerase chain reaction by SYBR green detection
RNA was extracted from ES cells using a ZYMO research kit. One microgram of RNA was reverse-transcribed using the SuperscriptII reverse transcriptase (Invitrogen) and oligo(16)dT. Quantitative PCR (Q-PCR) was performed using a Light Cycler LC 1.5 or LC 480 (Roche Diagnostic). Amplification was carried out as recommended by the manufacturer. Twelve microliters of reaction mixture contained 10 μL of Roche SYBR Green I mix, respectively (including Taq DNA polymerase, reaction buffer, deoxynucleoside trisphosphate mix, SYBR Green I dye, and 3 mM magnesium chloride), 0.25 μM concentration of appropriate primer, and 2 μL of diluted cDNA. The amplification program included the initial denaturation step at 95°C for 8 min, and 40 to 60 cycles of denaturation at 95°C for 1 (LC1.5) or 10 s (LC480), annealing at 65°C for 8 s (LC1.5) or 15 s (LC480) and extension at 72°C for 10 (LC1.5) or 30 s (LC480). The temperature transition rate was 20°C/s (LC1.5) or 4°C/s (LC480). Fluorescence was measured at the end of each extension step. After amplification, a melting curve was acquired by heating the product at 20 or 4°C/s to 95°C, cooling it at 20 or 4°C/s to 70°C, keeping it at 70°C for 20 s, and then slowly heating it at 20 or 4°C/s to 95°C. Fluorescence was measured through the slow heating phase. Melting curves were used to determine the specificity of PCR products, which were confirmed using conventional gel electrophoresis and sequencing. Data were analyzed according to Pfaffl [9]. Primers specific for human genes are described in Tomescot et al. [10] and will be available upon request.
ChIP assay
ChIP was performed using a standard ChIP procedure as previously described [11] or for single colonies a microchip procedure [12]. Anti-H3triMeK4 and anti-H3triMeK27 antibodies (UBI) were added to the IP buffer containing chromatin (3 μg antibody/IP). Rabbit immunoglobin G or no antibody was used as IP controls. Q-PCR was used to amplify the DNA elements as described above. Absolute enrichment was calculated assuming that at most 1% of nucleosome was immunoprecipitated [13].
For the sequential-ChIP experiments (double ChIP), protein-DNA complexes after the first anti-H3triMeK4 or anti-triMeK27 antibody were extensively washed with ChIP buffer and then a Tris-ethylenediaminetetraacetic buffer. Complexes were eluted by incubation for 30 min at 37°C in 50 μL of elution Tris EDTA buffer supplemented with 2% sodium dodecyl sulfate (SDS), 15 mM dithiothreitol, and protease inhibitors. This reducing protocol cleaves the antibody so that no trace of first antibody remains during the second IP reaction. After centrifugation, the supernatant was diluted 20 times with ChIP buffer and the samples were then subjected to the ChIP protocol using the second antibody.
Genomic region was thus considered enriched if 10 ng IP samples showed a greater enrichment when compared to 0.1 ng of input DNA. Data in all the text and figures are normalized to a control condition (absolute enrichment set to one) and are thus representative of a relative enrichment in one experimental condition (BMP2 treatment) versus the control (nontreated cells) or as a log2 enrichment versus the input. The primers used to amplify the genomic regions of promoters are described in [14] and further available upon request.
ChIP-on-chip
ChIP was performed as described above. The pull-down DNA was amplified and hybridized to Affymetrix–GeneChip® Human Promoter 1.0R Array according to the manufacturer. Experiments were performed in duplicate. To identify H3K4 or H3K27 methylation sites, we compared the ChIP-chip intensities of the HUES cells treated with BMP2 to those of untreated HUES cells. Before the binding site detection, raw intensity data were normalized between the controls and the corresponding BMP2 treatments using the cross correlation method [15]. Enriched binding sites were identified based on peak height intensity, peak weight, and peak neighboring intensities (Supplementary Fig. S1; Supplementary Data are available online at
Results
Differential cardiogenic potential of two HUES cell lines
To test the cardiogenic potential of HUES cell lines, we employed the EB approach. Both cell lines were derived and cultured under identical protocols within a similar range of passages (p30–35) before allowing them to spontaneously aggregate.
The beating activity of EBs was scored after 12 days of differentiation. In three experiments, 13% of HUES-24-derived EBs were contracting in comparison to 9% of HUES-26 EBs (Fig. 1A). Further, only HUES-24 cell-derived EBs featured several beating clusters per EB. Troponin T was used as a marker of differentiated cardiomyocytes. Immunostaining of this sarcomeric protein revealed the presence of much less clusters of cardiomyocytes within HUES-26 EBs than within HUES-24 EBs (Fig. 1B).
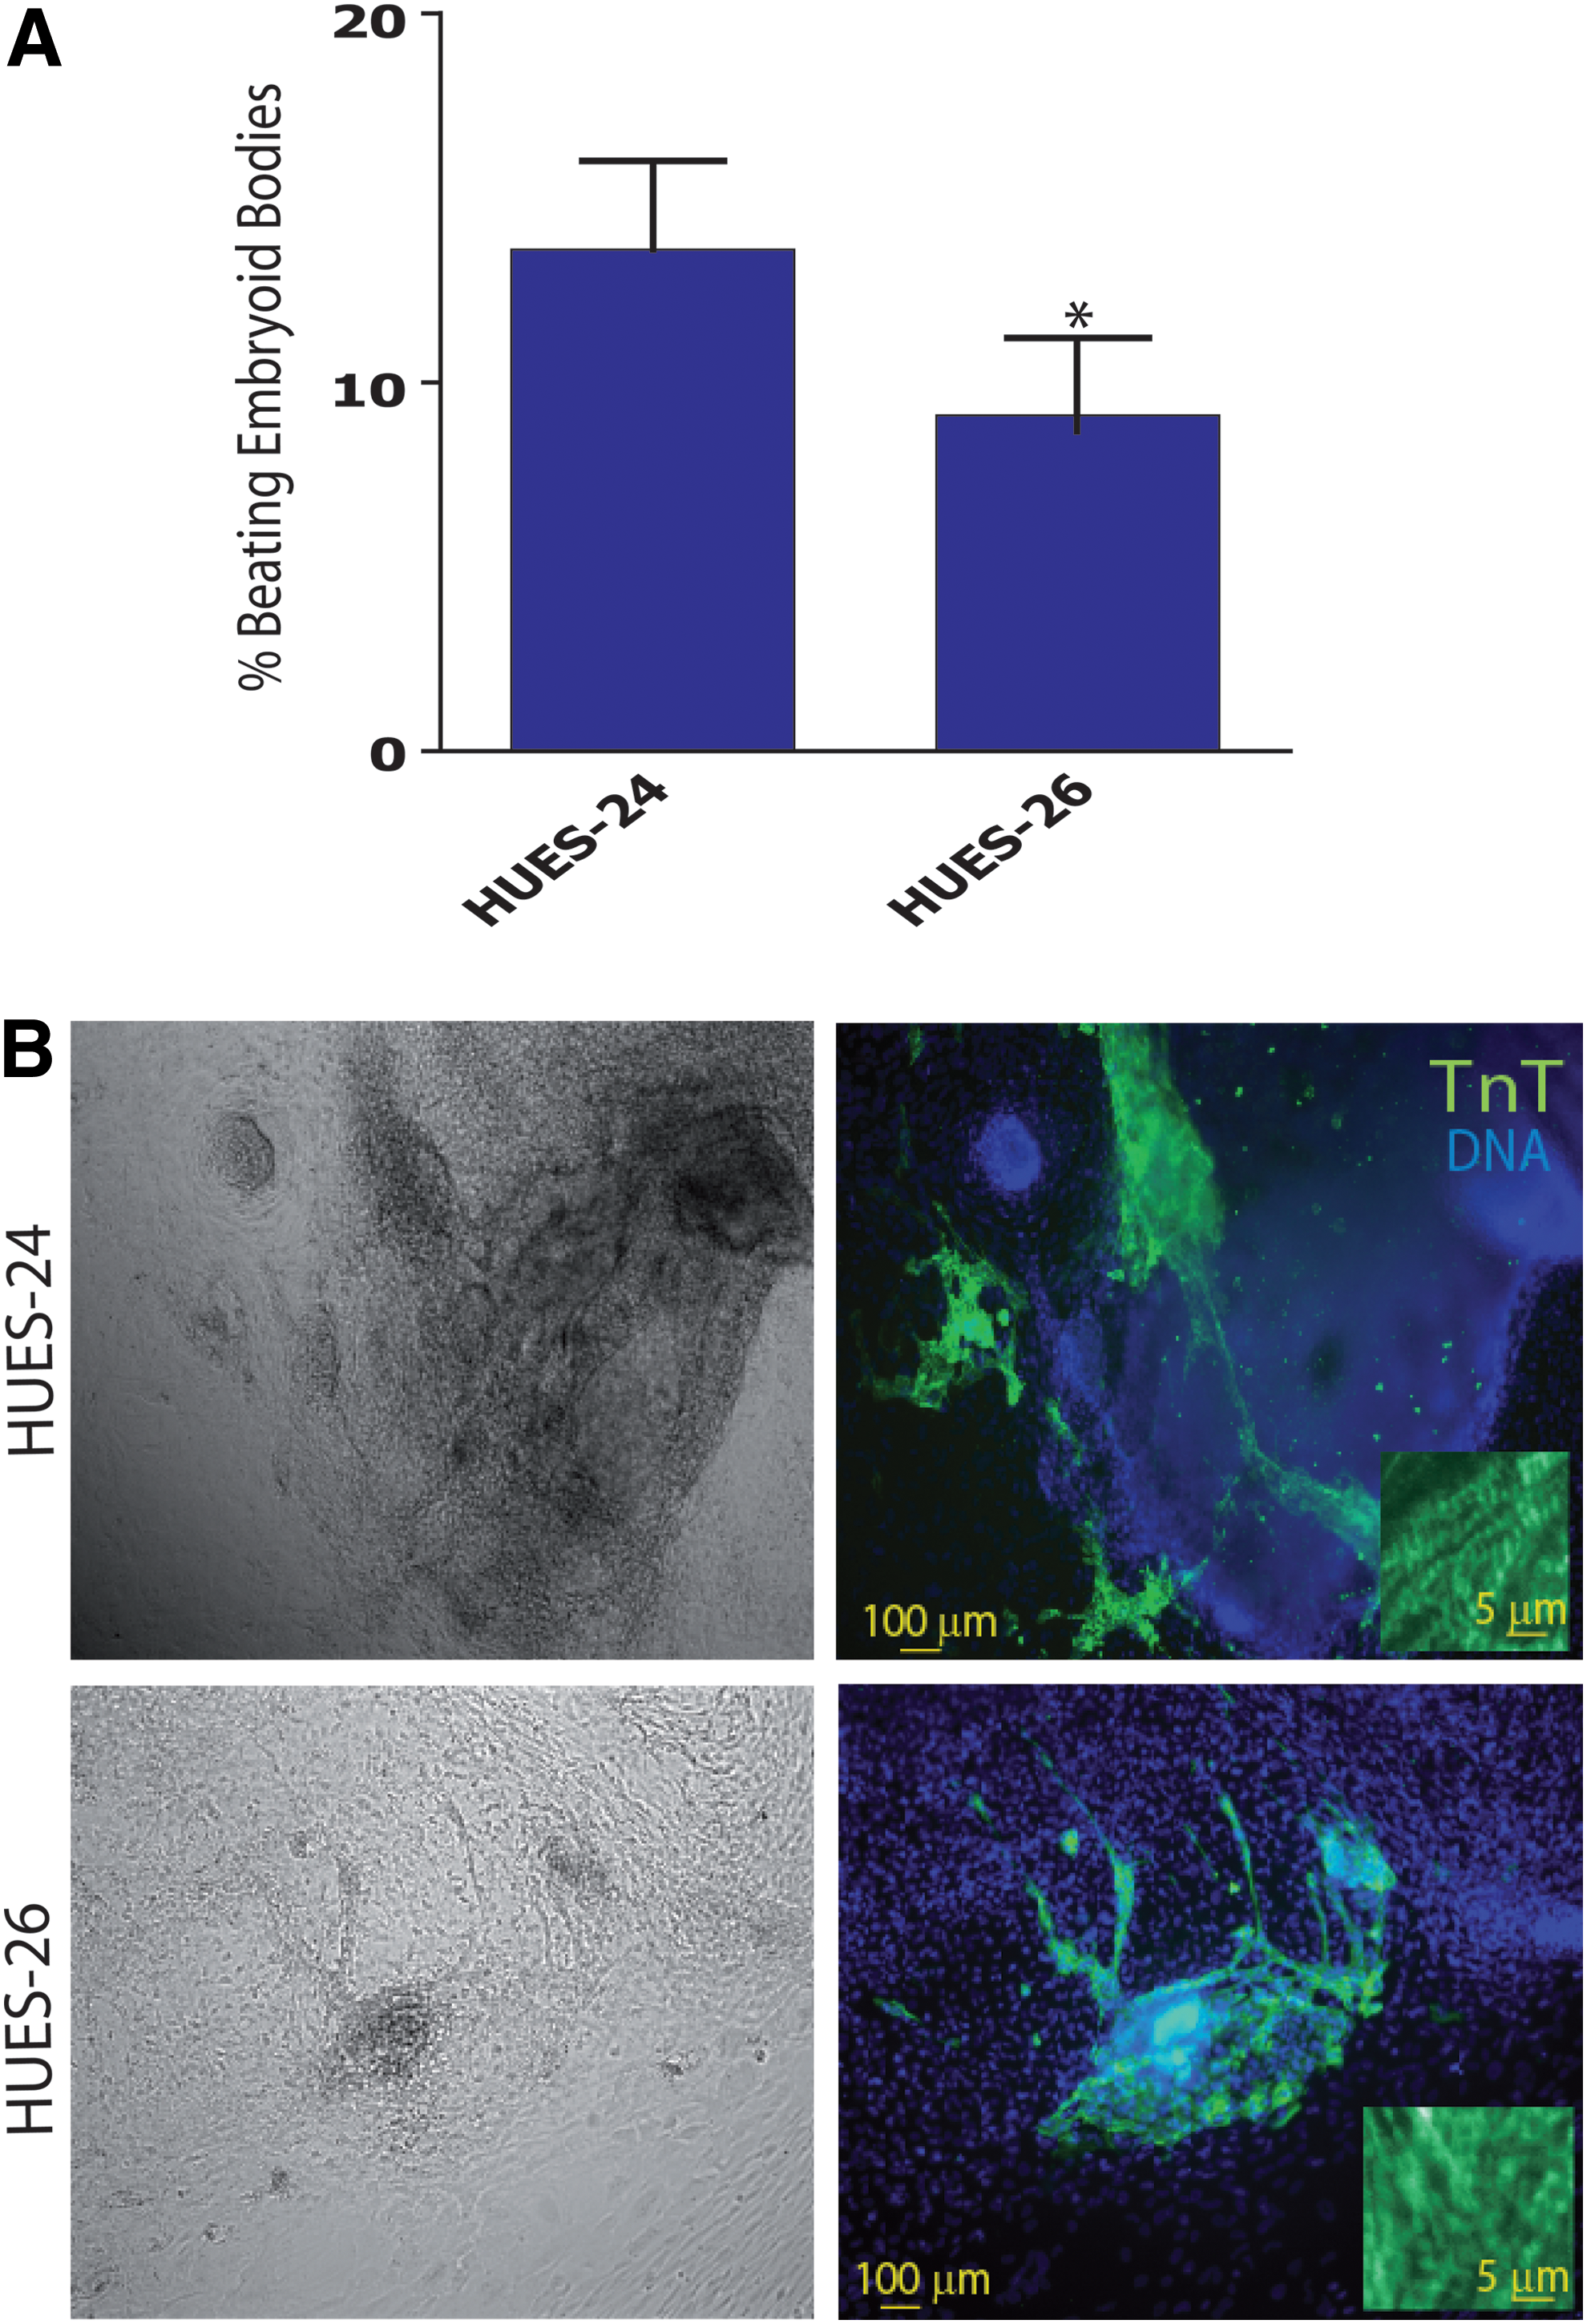
HUES-24 cell line is more prone than HUES-26 to differentiate toward a cardiac lineage.
Next, we next further investigated the cardiogenic response of both HUES-24 and HUES-26 cell lines by challenging them with the potent cardiogenic instructor BMP2 [10]. Expression of several mesodermal- and cardiac-specific genes was monitored in response to BMP2. BMP2 added for 2 days to the HUES-24 cell line turned on a full transcriptional cardiogenic program. Expression of mesodermal genes BRACHYURY (T), MESP1, and TBX6, as well as a pattern of genes which altogether confers a cardiac-specific status (ie, TBX20, MEF2C, NKX2.5, GATA4, TBX5, and ISL1) were all induced by BMP2. Gene induction was specific to the morphogen since noggin, an inhibitor of the BMP2 receptor, used at a concentration of 100 ng/mL, fully prevented BMP2-induced gene expression (Fig. 2A). The HUES-26 cell line was also responsive to BMP2 although to a different extent. Early mesodermal and cardiogenic genes BRACHYURY, MESP1, TBX20, GATA4, and ISL1 were strongly induced, whereas TBX6, MEF2C, NKX2.5, and TBX5, were poorly or not at all induced (Fig. 2B).
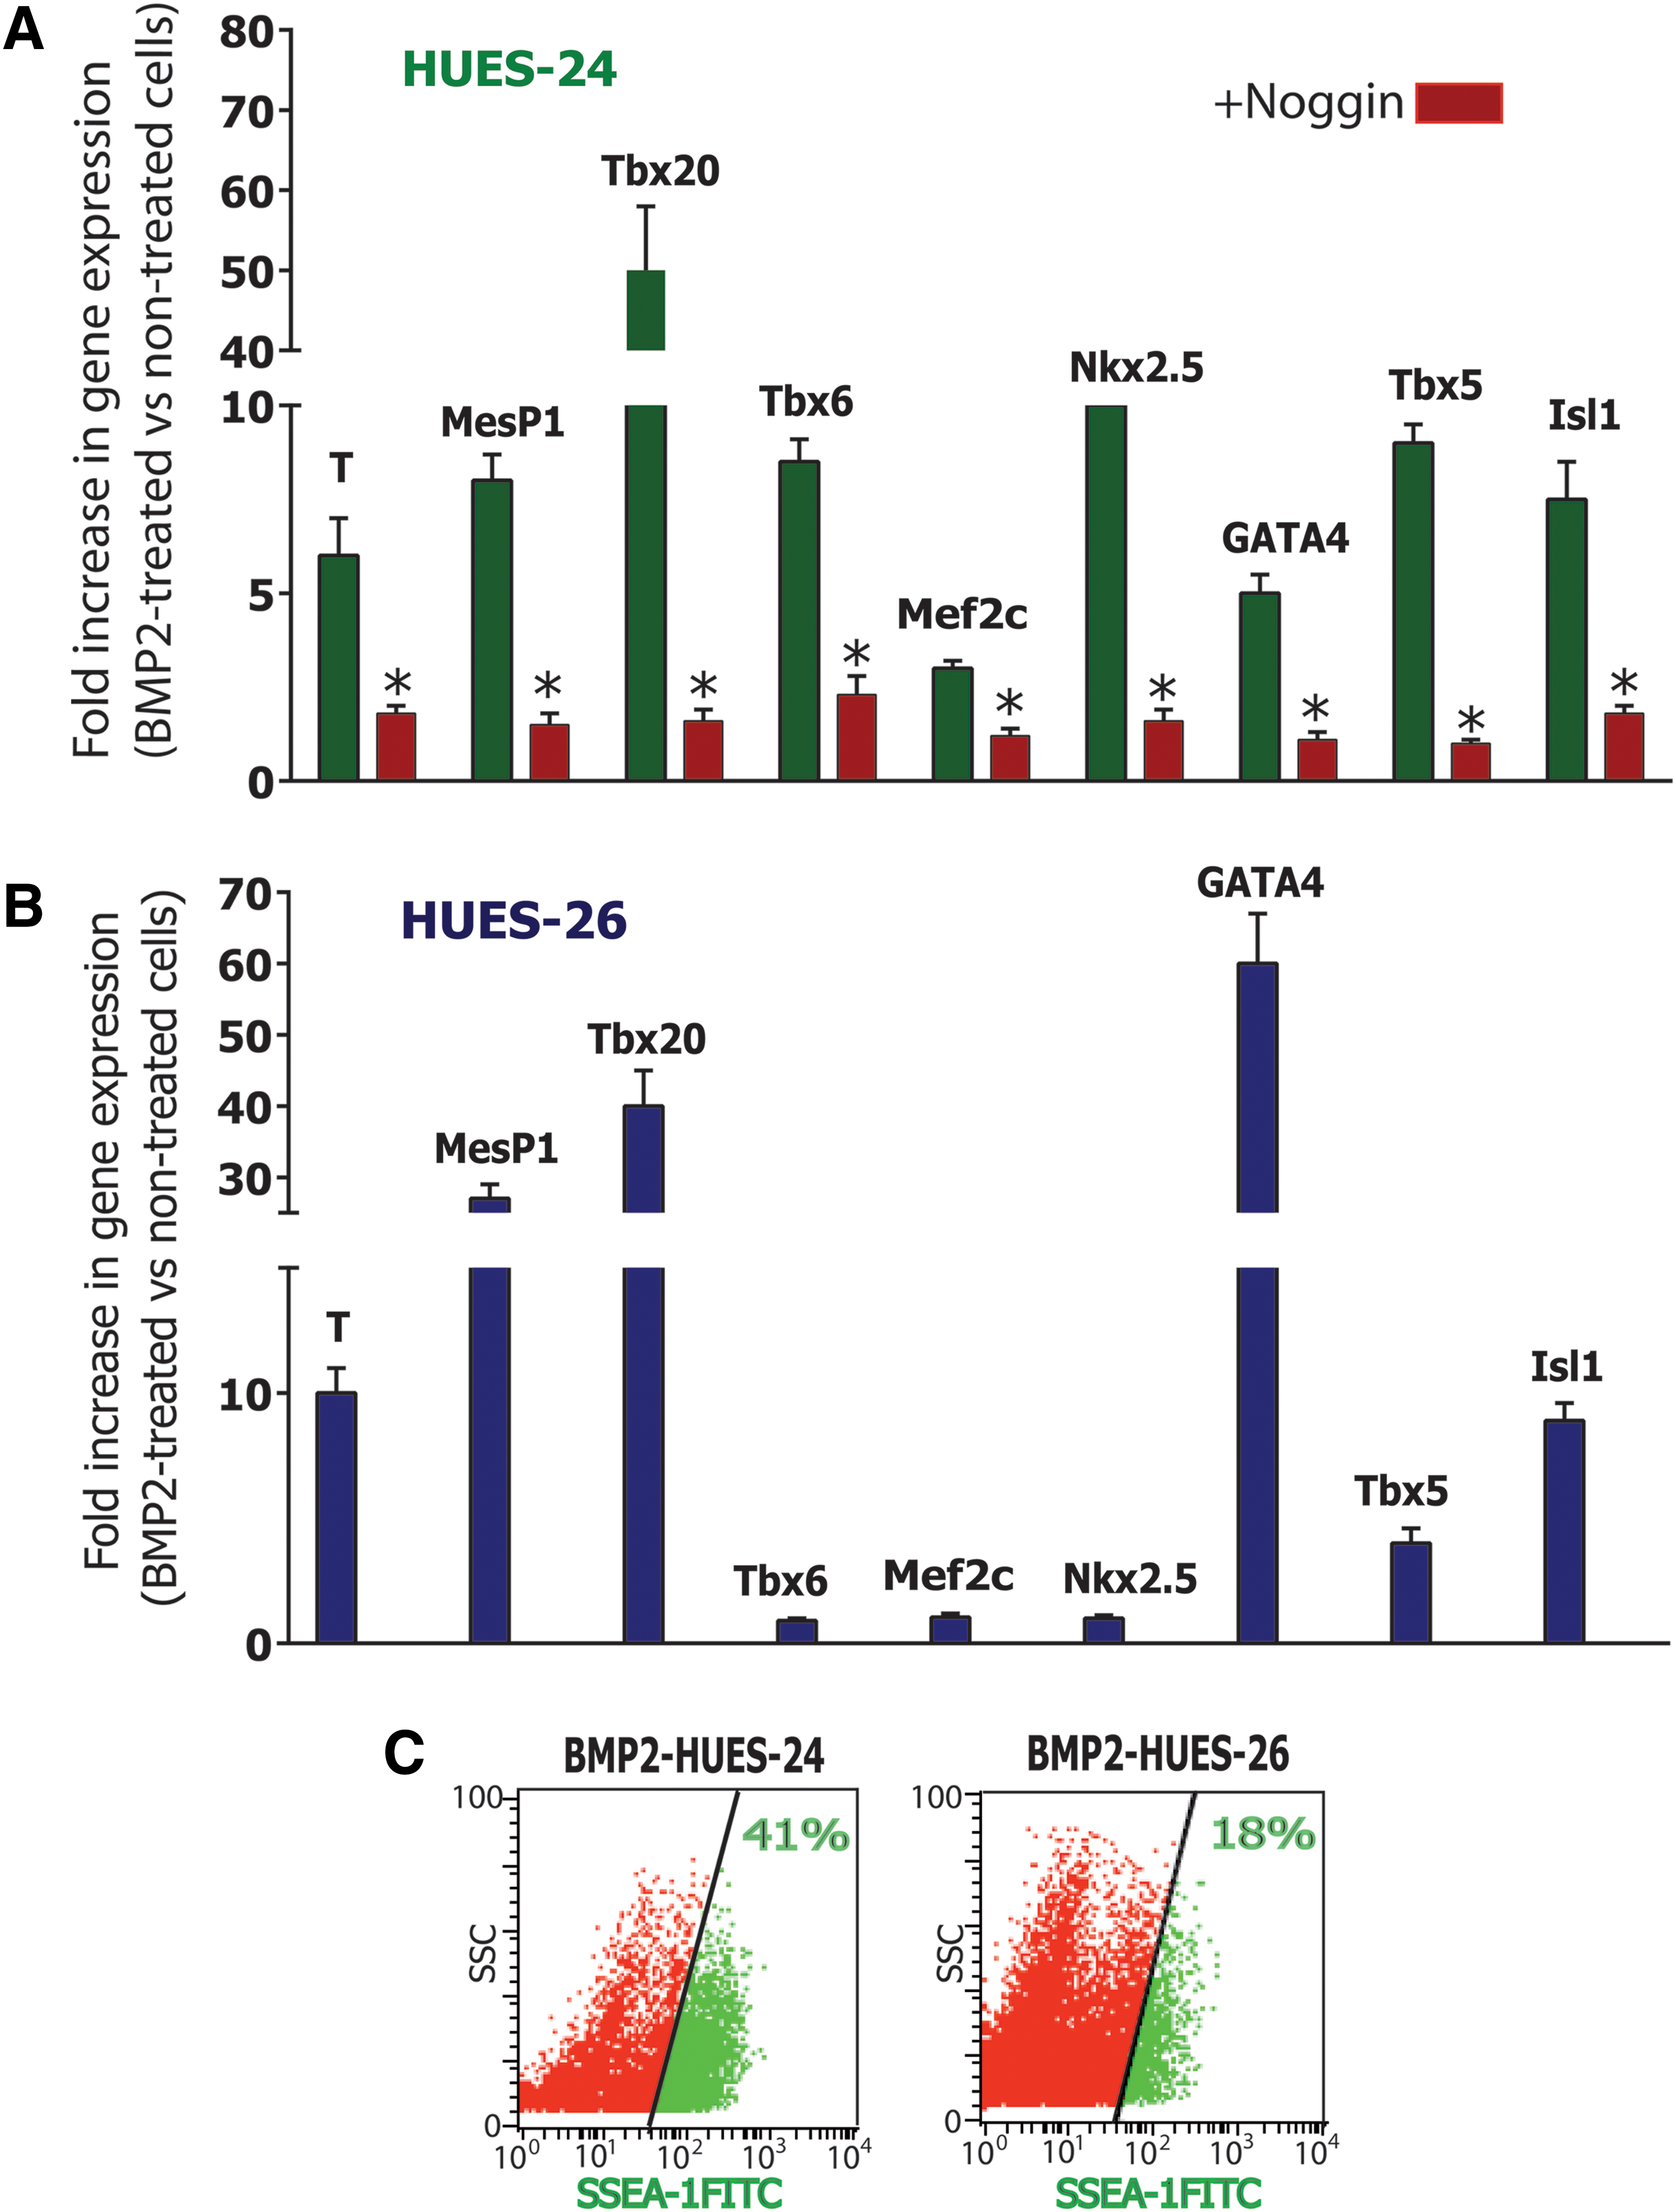
Cardiac commitment by BMP2 is increased in HUES-24 compared to HUES-26 cell line. Gene expression in BMP2-stimulated HUES cells. HUES-24
Next, we treated the cells with BMP2 for 4 days to sort the cardiac progenitors using SSEA-1 [14,16]. The sorting yield was much lower using HUES-26 cells [20%±5% (n=3)] when compared to HUES-24 [40%±6% (n=4)] (Fig. 2C).
HUES cell lines feature specific bivalent domain prints of promoters of early mesodermal and cardiac transcription factors
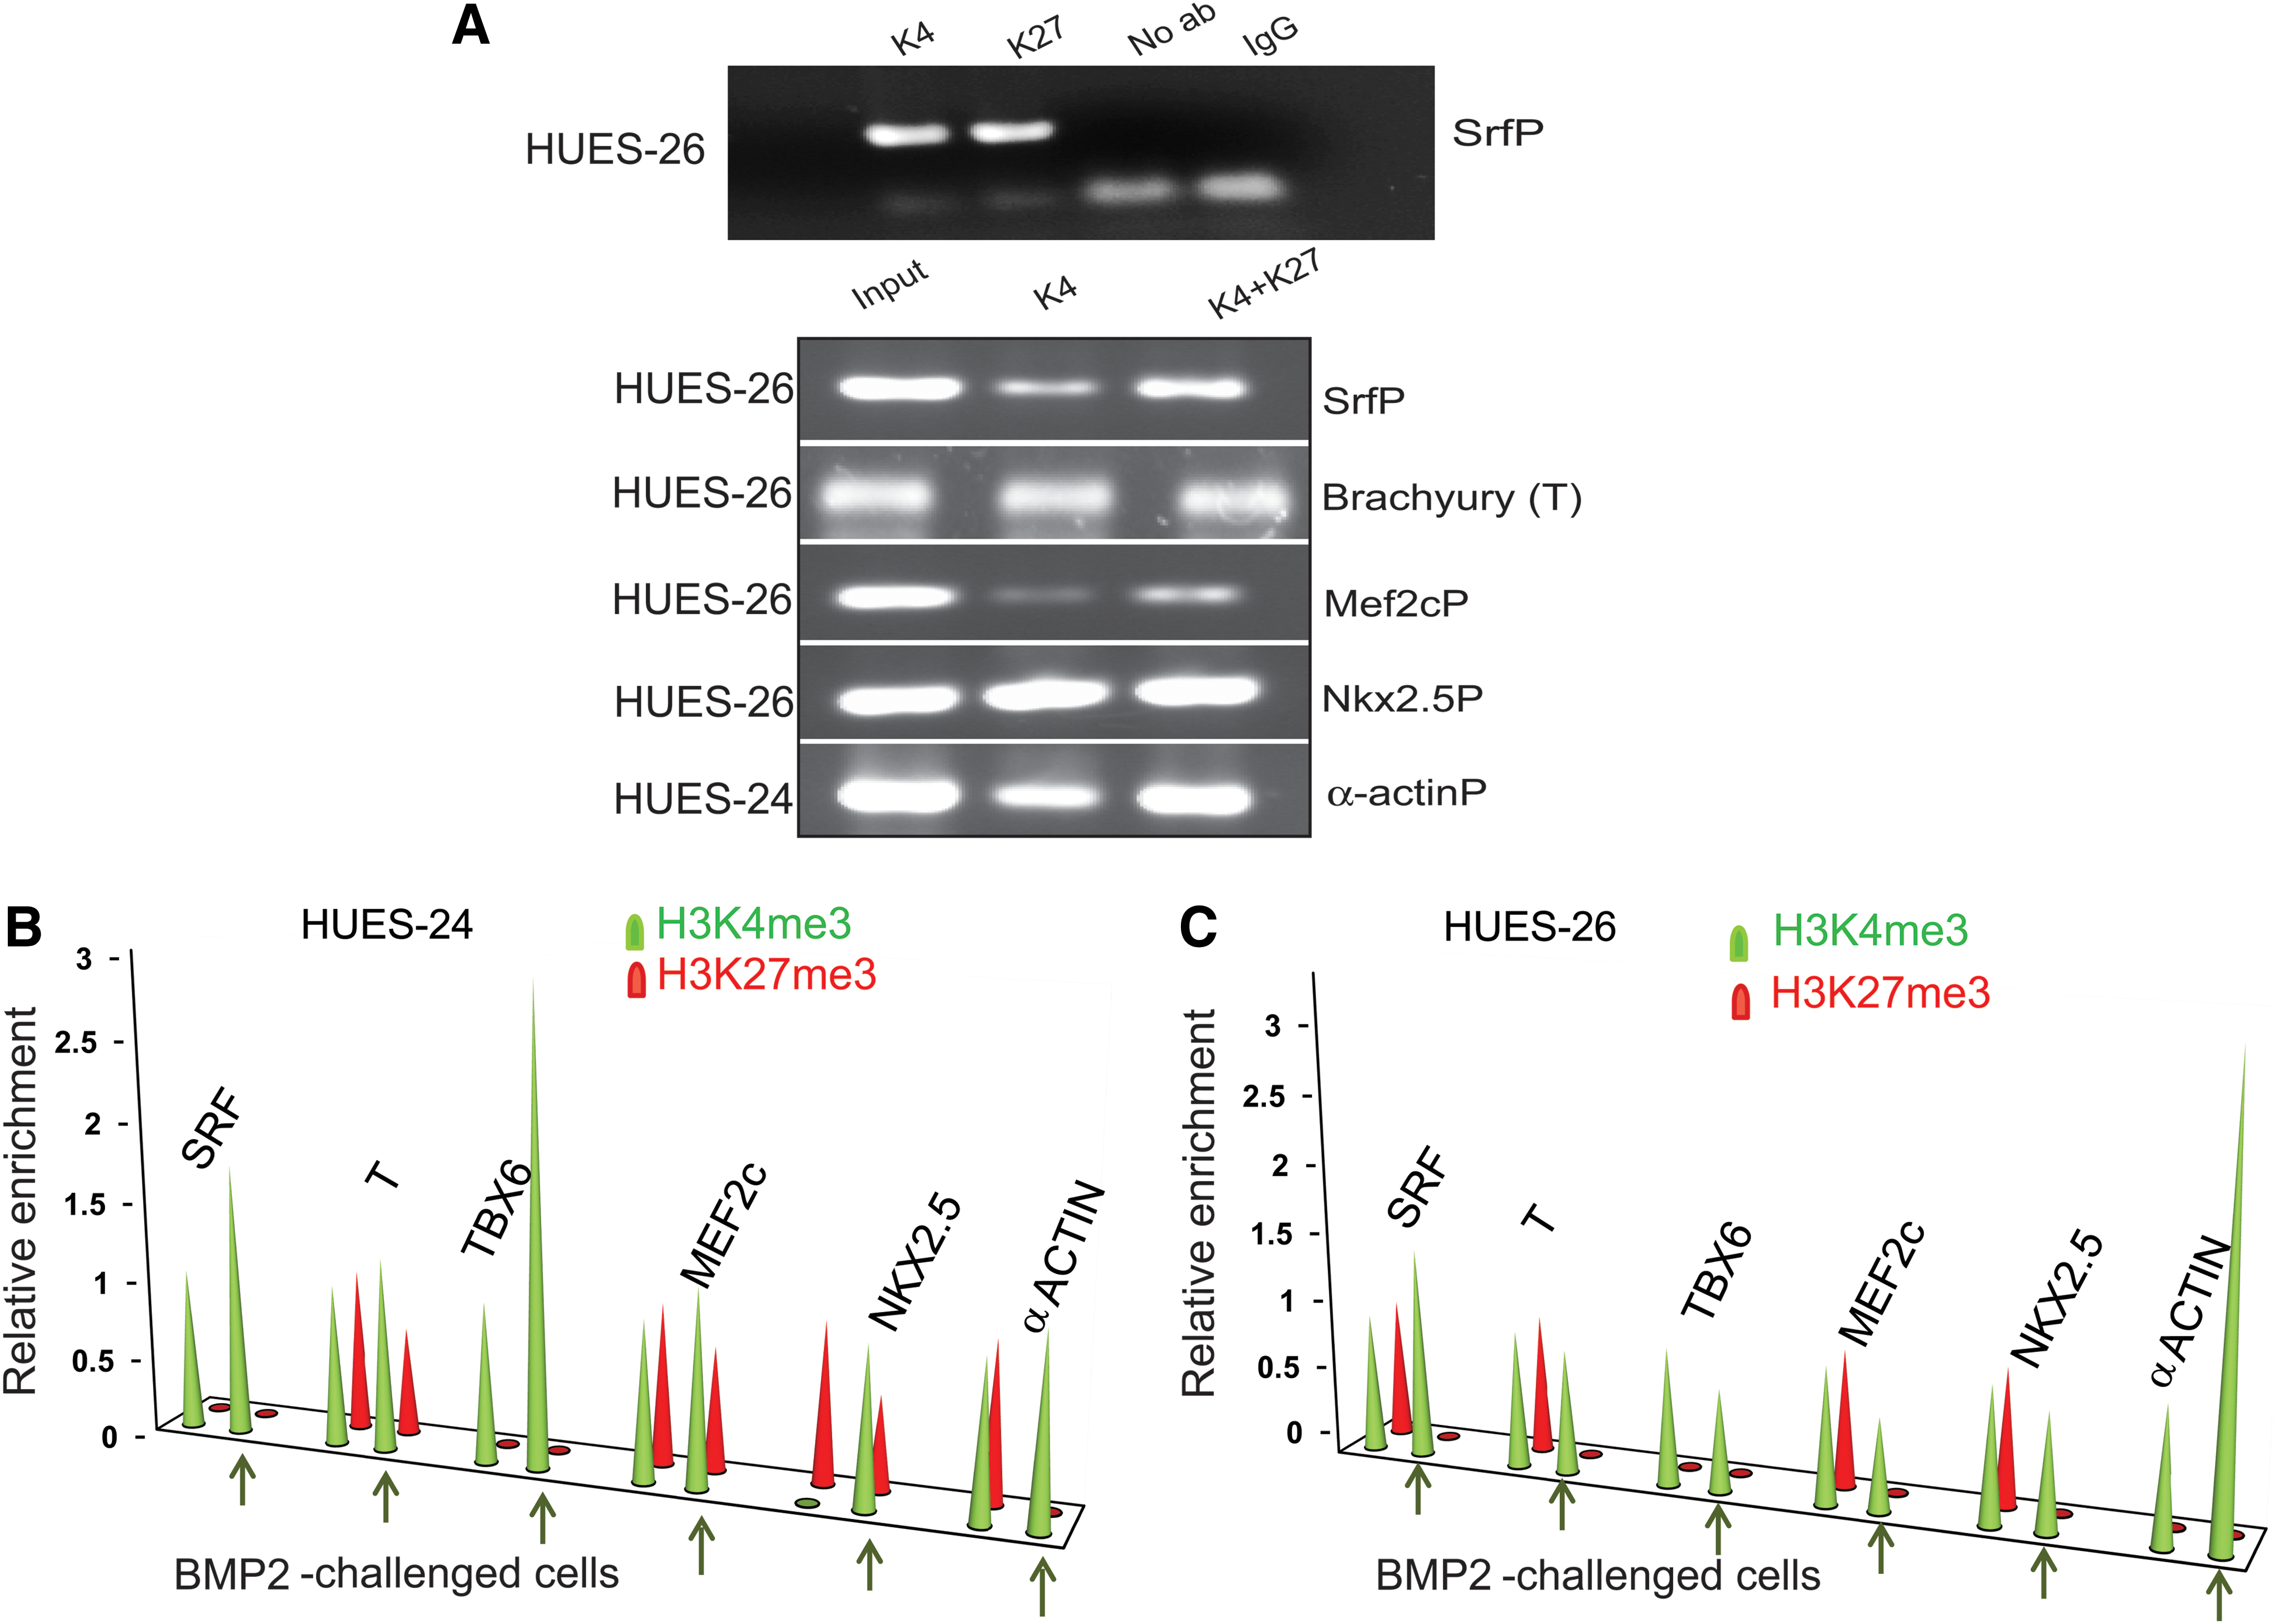
In ES cells, the promoters of transcription factors specific to early cell lineages feature bivalent domains [8]. We surmised that these promoters might be specifically exposed to the variability in the epigenetic status of HUES cell lines. Cardiogenesis, a developmental process originating from the mesoderm is one of the earliest events in the embryo. Thus, we interrogated the histone methylation status of three mesodermal and three cardiac-specific promoters in both HUES-24 and HUES-26 cell lines. Bivalency of promoters was first demonstrated by sequential ChIP using the anti-H3trimeK4 or the anti-H3trimeK27 antibodies at the first step of IP and then switching the antibody at the second step. Real-time PCR was used to amplify DNA enriched by ChIP. We used primers matching short (150 bp) regions within 1 kb upstream the transcription starting site as K4 methylation of histone H3 as well as polymerase II occupancy of active promoters was found within this genomic region suggesting active transcription [17]. Taking the serum responsive factor (SRF) regulatory promoter region of HUES-26 cell line as an example, Fig. 3A first shows that this promoter harbors the two H3K4me3 and H3K27me3 epigenetic marks.
Differential epigenetic response of HUES-24 and HUES-26 cell lines.
This figure further illustrates that SRF, BRACHYURY (T), MEF2C, NKX2.5, and α-cardiac ACTIN promoter/enhancer regions also featured both epigenetic marks at least in one or the other HUES-24 or HUES-26 cell line.
The trimethylation pattern of both K4 and K27 was, however, variable among both cell lines and depended on the promoter (Fig. 3B, C). We specifically looked further at changes in methylation status of both H3K4 and H3K27 enriched at bivalent mesodermal and cardiac promoters in the two HUES cell lines upon BMP2 challenge of cells. The pattern of methylation of HUES-24 cell line featured a unique image. A gain in H3K4 methylation enrichment at SRF, NKX2.5, and TBX6 promoter binding sites was observed upon BMP2 treatment of cells. α-Actin promoter binding site revealed a demethylation of H3K27 (Fig. 3B). Specifically, the NKX2.5 promoter dramatically gained a methylation of H3K4 whereas slightly losing methylated H3K27 in HUES-24 cell line challenged by BMP2.
In HUES-26 cell line, the same NKX2.5 promoter lost H3K27me3, but did not acquire further enrichment with H3K4me3 (Fig. 3C). HUES-26 cell line treated with BMP2 featured a demethylation of H3K27 enriched at SRF, BRACHYURY, MEF2C, and NKX2.5 promoters. A gain in H3K4 methylation was observed at the α-ACTIN promoter binding site (Fig. 3C).
Tbx6 promoter lost its bivalent feature in both undifferentiated cell lines, but gained H3K4me3 in HUES-24 cell line upon BMP2 treatment whereas it remained unchanged in HUES-26 cells.
To investigate whether the potential epigenetic variability within the same cell line could depend upon the culture condition or the growth of HUES cells, we performed micro-ChIP experiments from chromatin extracted from small (<100 μm) or big (>500 μm) colonies within the same HUES-24 culture plate using the anti-H3K4me3 and anti-H3K27me3 antibodies. The enrichment of DNA regions, including BRACHYURY, NKX2.5, or α-ACTIN promoters by trimethylated histones were comparable between small (<100 μm diameter) or big (more than 500 μm diameter) colonies (Supplementary Fig. S3).
Genome-wide analysis of epigenetic status of promoters in both HUES cells at the control condition or challenged by BMP2
To investigate whether these changes in epigenetic marks were found only for mesodermal and cardiac-specific promoters, we performed a genome-wide analysis of histone H3 methylation on K4 and K27 in control and BMP2-challenged HUES-24 and HUES-26 cell lines using ChIP-on-chip. Supplementary Figure S4 shows the distributions of log2-fold changes over all probes for the anti-H3trimeK4 and anti-H3trimeK27 pull-down of chromatin in the two cell lines. This figure reveals that upon BMP2 treatment, there are much more probes with high fold changes for H3K27 in HUES-26 than in HUES-24 cells, whereas for H3K4 the opposite picture could be observed—more probes with high fold changes for H3K4 in HUES-24 than in HUES-26 cells. We obtained similar trends for enriched binding sites in promoters. Altogether, this indicates significant differences in morphogen-induced epigenetic changes between the two cell lines.
The HUES-24 cell line responded to BMP2 by a dramatic gain in novel H3K4me marks (Fig. 4), including genes involved in mesodermal and cardiac development (SRF, BRACHYURY, NKX2.5, TBX5, HEY1, TROPONIN-T; see list of enriched DNA sites in Gene Expression Omnibus dataset). A few methylated K4 marks were conserved, but shifted along the promoter sequence. H3K27me3 marks were also increased upon BMP2 treatment of the HUES-24 cell line. This mainly applied to the promoters of genes involved in cell growth or stem cell pluripotency like NANOG or early neuronal development like DLX1 due to the inhibitory effect of BMP on neuronal differentiation. The HUES-26 cell line stimulated with BMP2 featured almost no change in H3K4me3, but a dramatic increase in enrichment in H3K27me3. Interestingly, the repressive marks were observed on polycomb genes (SUZ12) known to prevent differentiation of ES cells [18,19] (Supplementary Fig. S5). Enriched H3K4me3 occupancy of its promoter was found for both cell lines following BMP2 challenge, whereas there is no enriched binding site for H3K27me3 in the HUES-24 cell line. This indicates that SUZ12 is activated through methylation of H3meK4, but not demethylation of H3meK27 upon a differentiation signal. We looked more specifically and more broadly at the genomic regions surrounding the genes differentially induced by BMP2 in the HUES-24 or HUES-26 cells. TBX6, MEF2c, and NKX2.5 loci featured much less H3K4me3 enrichment in the HUES-26 than in HUES-24 cell line following BMP2 treatment in agreement with the lack of induction of these genes in the HUES-26 cell line (Fig. 2B). In contrast, GATA4 induced by BMP2 in both HUES-24 and HUES-26 cells featured a similar epigenetic landmark in both cell lines (Fig. 5).
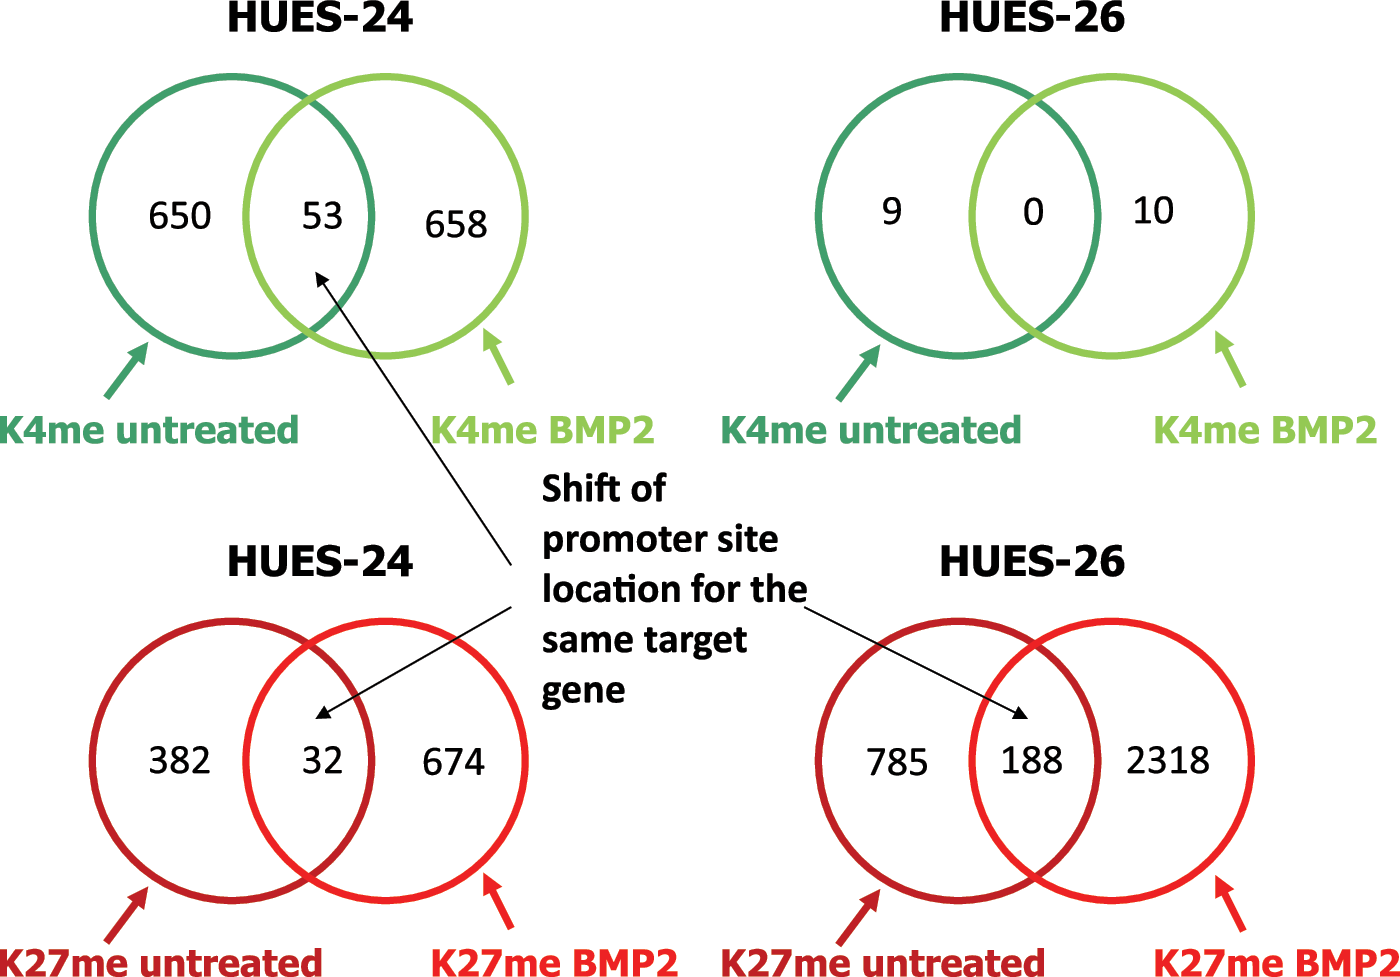
Genome-wide analysis of the epigenetic status of two HUES cell lines challenged by BMP2. Crosslinked chromatin was extracted from HUES-24 and HUES-26 cell lines under control or BMP2-treated conditions and trimethylated H3K4 and H3K27 were immunoprecipitated. The DNA bound to histones was hybridized to Affymetrix–GeneChip® Human Promoter 1.0R Array. The number of genomic sites enriched was scored after statistical analysis. Experiments were done in duplicate without significant differences. The dataset are available in Gene Expression Omnibus (GEO access no. GSE 59328). Color images available online at
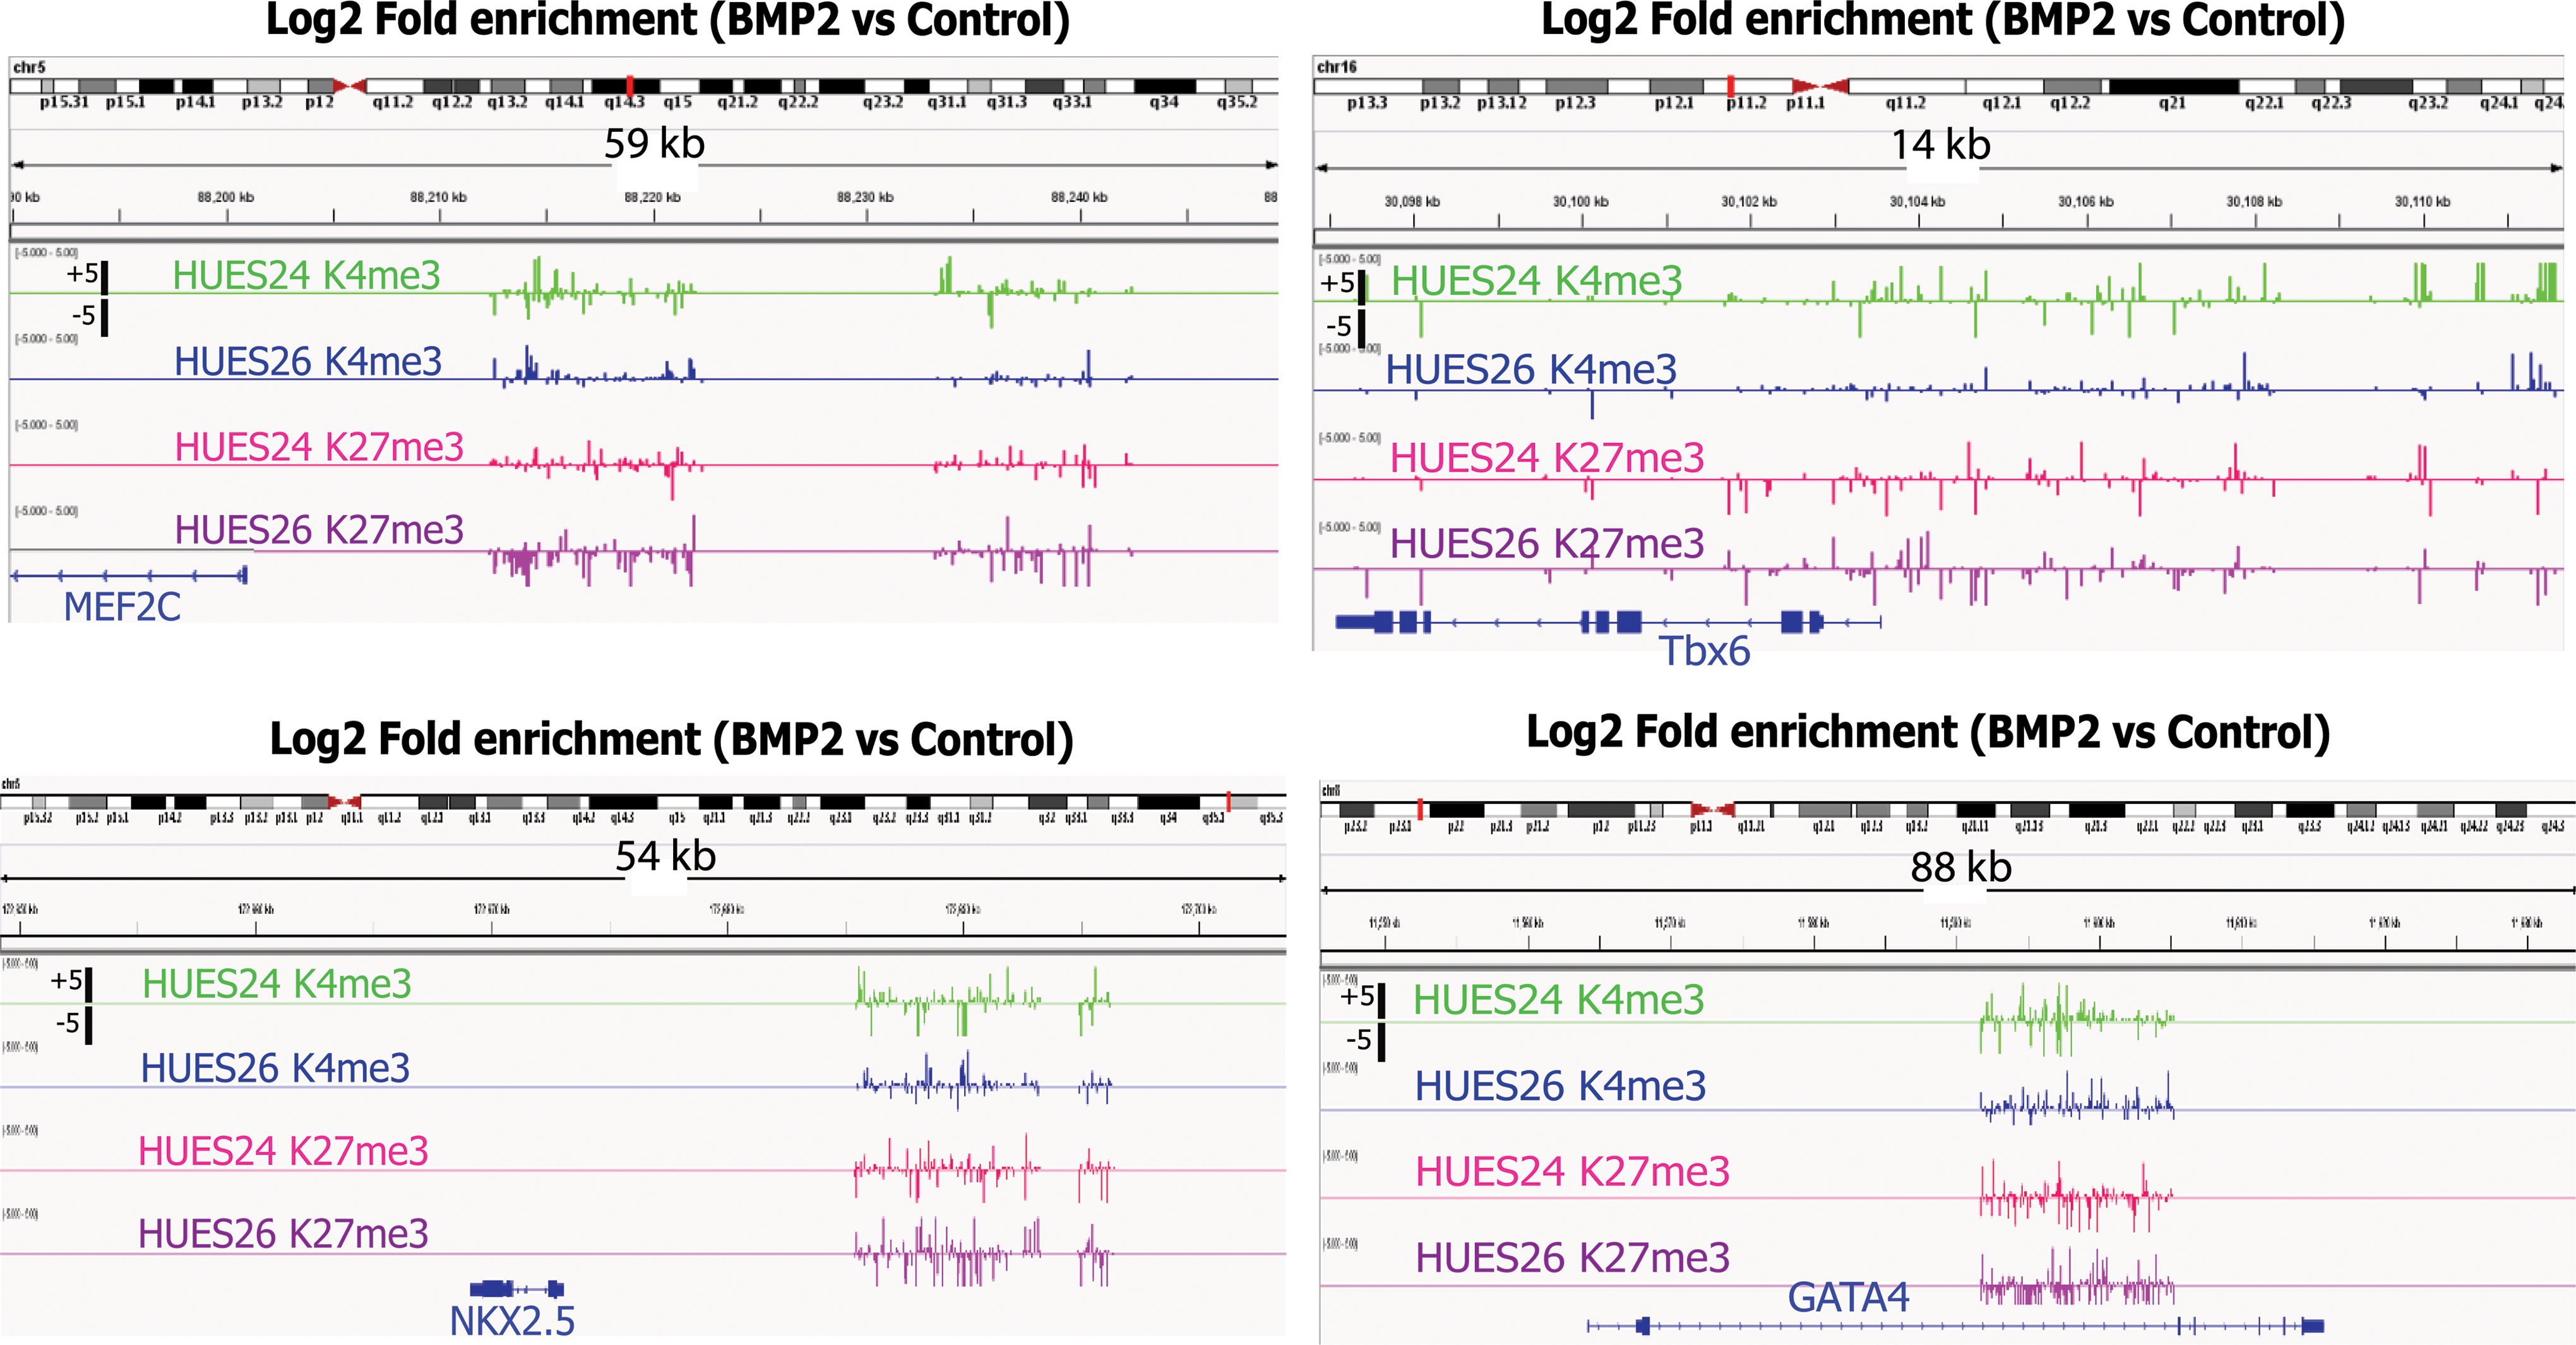
Differential histone modifications in loci of genes differentially expressed in BMP2-treated HUES-24 and HUES-26 cell lines. Chromatin was extracted from both HUES-24 and HUES-26 cell lines before and after the BMP2 treatment. Modified histones H3K4me3 and H3K27me3 were immunoprecipitated and the bound DNA was used to probe the promoter array chip. Enriched binding sites were identified based on peak height intensity, peak weight, and peak neighboring intensities. Signal profiles were generated for the indicated histone modifications around the position of the promoter of the gene of interest. Color images available online at
Discussion
This study uncovered dramatic differences in the epigenetic status of two HUES cell lines derived under similar conditions. This variability cannot be attributed to a metastable epigenetic print of cell lines as both lines were cultured under standard and identical conditions. Differences observed on a genome-wide basis could be confirmed by ChIP real-time PCR focused on mesodermal and cardiac gene promoters. We further found that the epigenetic status of promoters of genes (mainly transcription factors) enriched in bivalent domains could be regulated by a morphogen, namely BMP2. To our knowledge, this is the first report showing a specific modulation of such bivalent domains by a growth factor or morphogen in two different cell lines. This raises the question of the intracellular signaling pathways, which modulate activity of trithorax and polycomb complexes. In two cell lines (HUES-24 and HUES-26) investigated in depth, the regulation of bivalent domains by BMP2 correlated with the profile of genes responsive to BMP2 and further to the cardiogenic potential of HUES cell lines as monitored by beating EBs and cTnT expression. While polycombs play a major role in maintaining pluripotency of ES cells by repressing the promoters of lineage-specific genes through the methylation of H3K27 [18,19], our data rather suggest that H3K4 methylation by trithorax is required to fully turn on the expression of early transcription factors triggering the genetic cascade which leads to cell differentiation. Such an idea was suggested by previous genome-wide data acquired in a single HUES cell line [20].
Indeed, as NKX2.5 and MEF2C were only switched on in HUES-24, this suggests that the loss of methylation of H3 on K27 was not sufficient to switch on the promoter. Rather, the maintenance (if H3K27me3 is lost) or gain in trimethylated K4 (if H3K27me3 still persisted) is a crucial epigenetic event required to switch on the expression of an early lineage gene in pluripotent stem cells even in the presence of the remaining H3K27me3. This observation was verified for regulatory regions having lost their bivalent domains at the undifferentiated stage such as the Tbx6 locus likely because HUES cells are more reminiscent of epiblast cells than of inner cell mass. However, an increase in H3K4me3 upon BMP2 challenge was efficient enough to induce transcription of the gene (Fig. 2). These findings challenge the idea that bivalent domains have to resolve to an univalent state to trigger differentiation of ES cells [8,17]. This also does not fully match with the prevailing model of sequential polycomb complexes PRC1 and PRC2 recruitments to specific promoters as PRC1 recruited by the PRC2-induced H3K27 methylation was suggested to block RNA polymerase II elongation [21]. That would rather suggest that mesodermal and cardiac promoters in this study belong to the subset of bivalent promoters not occupied by PRC1 [22]. This point will require further investigation.
HUES cell lines derived from individual embryos at the blastocyst stage thus feature an epigenetic profile of gene promoters possibly inherited from the parents. As the whole process of demethylation modulating both H3K4 and H3K27 takes place later (postimplantation) in development, the HUES cell lines maintain these epigenetic prints in culture making them unique, although this idea is still controversial. Alternately, but not mutually exclusive of this possibility, the stage of the blastocyst at the time of derivation of the cell line might also play a key role in its epigenetic status. Indeed, if the blastocyst starts making its first cell fate decision differentiating in epiblast and primitive endoderm, the epigenetic status is expected to change. The primitive endoderm will feature high H3K27 methylation of lineage-specific gene promoters [7]. Thus as ES cells are in a metastable status commuting from inner cell mass to epiblast stage, a cell line featuring more spontaneous differentiation toward the primitive endoderm and or epiblast stage will acquire more H3K27 methylation on cell lineage gene promoters.
The epigenetic status of lineage-specific genes might well explain why each HUES cell line is more or less prone to differentiate efficiently toward a specific cell fate. Epigenetics includes both changes in DNA methylation and histone modifications. Although it has been proposed that a differential methylation status of DNA of HUES and induced pluripotent stem (iPS) cell lines might be used to score a potential of differentiation of the cells toward specific germ layers [23], the histone marks and behavior of the bivalent domains had never been involved so far in such a predictive process. Our study thus adds to the concept that variability in global epigenetic status underlies different cardiogenic potentials of individual cell lines
The variability among HUES cell lines of various genetic and epigenetic backgrounds is thus expected to be greater than among mouse ES cell lines as the latter are derived from inbred mice with a less heterogeneous genetic background. This has to be taken into account for several purposes, and notably (1) optimizing protocols to differentiate the cells (2) establishing kinetics of epigenetic changes during cell differentiation as recently reported for cardiac development in a unique cell line [24] (3) when using diseased embryos from Preimplantation Genetic Diagnosis to derive HUES as a model of pathology. This epigenetic variability becomes even more important for patient-specific iPS cells that could be reprogrammed to a true ground state or partially to a more still differentiated state [25]. If the disease features some epigenetic components, these cells derived before the erasure of parental or donor epigenetic prints might not faithfully recapitulate the pathology. A recent article [26] suggested that iPS cells are more prone to epigenetic so-called abnormalities than in vitro fertilization-derived HUES cells and somatic cell nuclear transfer (SCNT)-derived HUES cells. However, such a statement was made based on the different features of DNA methylation observed in iPS and SCNT cells. The histone modifications and the bivalent domains were not monitored in this study. As DNA methylation is erased from a blastocyst much earlier than histone marks, one has to be cautious before making too strong a statement. Our findings rather suggest that more investigation is required on SCNT cells before favoring this type of cell over iPS cells.
Footnotes
Acknowledgments
The authors thank Dr. B. Bernstein (Harvard University, and the Broad Institute Cambridge) for discussions on data and critical reading of the article. The authors also thank Dr. Thomas Moore-Morris for editing the article. This work was funded by the grant from the Agence National de la Recherche (ANR specistem to M.P.) and the authors are grateful to the Leducq Foundation (SHAPEHEART) also for funding this study.
Author Disclosure Statement
No competing financial interests exist.
References
Supplementary Material
Please find the following supplemental material available below.
For Open Access articles published under a Creative Commons License, all supplemental material carries the same license as the article it is associated with.
For non-Open Access articles published, all supplemental material carries a non-exclusive license, and permission requests for re-use of supplemental material or any part of supplemental material shall be sent directly to the copyright owner as specified in the copyright notice associated with the article.