
Abstract
Bone is a dynamic organ where skeletal progenitors and hematopoietic cells share and compete for space. Presumptive mesenchymal stem cells (MSC) have been identified and harvested from the bone marrow (BM-MSC) and cortical bone fragments (CBF-MSC). In this study, we demonstrate that despite the cells sharing a common ancestor, the differences in the structural properties of the resident tissues affect cell behavior and prime them to react differently to stimuli. Similarly to the bone marrow, the cortical portion of the bone contains a unique subset of cells that stains positively for the common MSC-associated markers. These cells display different multipotent differentiation capability, clonogenic expansion, and immunosuppressive potential. In particular, when compared with BM-MSC, CBF-MSC are bigger in size, show a lower proliferation rate at early passages, have a greater commitment toward the osteogenic lineage, constitutively produce nitric oxide as a mediator for bone remodeling, and more readily respond to proinflammatory cytokines. Our data suggest that the effect of the tissue's microenvironment makes the CBF-MSC a superior candidate in the development of new strategies for bone repair.
Introduction
A
However, the MSC proliferative potential, differentiative potential, purity, and yield significantly differ among tissues of origin. These source-specific features of MSC directly contribute to the trophic and immunosuppressive activity they exert [26 –29]. MSC receive constant chemical and structural inputs that directly affect their commitment and specification [2,30,31].
The stem cell niche that was once defined as the site where stem cells simply remain undifferentiated is now emerging as a regulator of MSC role and fate [32 –35]. While the bone marrow has been extensively characterized [2,36,37], so far, only few groups have described the trabecular [38 –41] and cortical [42] compartments of the bone as reservoirs of resident MSC. Cortical bone and bone marrow constitute a dynamic organ, where skeletal progenitors and hematopoietic cells share and compete for space [43]. During bone remodeling, a number of paracrine factors recruit osteoprogenitor cells and induce them to become osteoblasts [44,45]. While osteoclast precursor cells originate from cells of hematopoietic lineage, osteoprogenitor cells derive from the mesenchymal lineage of the bone marrow [46] and are found on the endosteal and periosteal regions of bones [47]. It has been proposed that the hypoxic conditions found in the osteoblastic niche are responsible for maintaining the cells in a quiescent state, while oxygenic conditions found in the vascular niche support actively proliferating progenitor cells [48].
In this study, we aimed to investigate the nature of the osteoprogenitor cells identified in the cortical portion of the bone, cortical bone fragments-derived MSC (CBF-MSC), in comparison with their bone marrow counterparts. We hypothesize that despite sharing a common ancestor, the differences in tissue homeostasis and oxygen tension, as well as the structure of the bone and marrow niches affect MSC proliferation, commitment to undergo osteoblastogenesis, and to differentially respond to inflammatory stimuli. To test this hypothesis, we isolated and characterized native populations of rat CBF-MSC to define differences in proliferation [doubling time (DT)], clonogenic potential [colony forming units (CFU)], expression of differentiation markers (CD44, CD90, CD73, CD29, and CD105), and immunosuppressive potential either in response to proinflammatory cytokines or to the presence of stimulated peripheral blood mononuclear cells (PBMCs). The different responses to stimuli of BM- and CBF-MSC provide an indication of the role that these cells may have when exposed to an activated environment as a consequence of disease, injury, or inflammation.
Materials and Methods
Samples collection
Male Sprague-Dawley rats were sacrificed by carbon dioxide inhalation after isofluorane sedation in accordance with the regulatory guidelines of the Institutional Animal Care and Use Committee. A 70% (v/v) ethanol solution was applied liberally to the lower half of the animal to achieve a level of sterility before harvesting the tissues. Tibias and femurs were removed and cleaned rigorously with a sterile scalpel to remove excess muscle, tendons, periosteum, and connective tissues. The cleaned bones were kept on ice-cold phosphate-buffered saline (PBS) containing 2% (v/v) fetal bovine serum (FBS) for further processing.
Scanning electron microscope
Rat bones were fixed in glutaraldehyde (2.5% 0.1 M Sodium Cacodylate buffer pH 7.4), dehydrated by treatment with a grade of ethanol solutions (30%, 50%, 75%, 85%, and 95% each for 2 h), and then were placed in a dryer at room temperature overnight before being coated by 7 nm of Pt/Pl for the scanning electron microscope (FEI Nova NanoSEM 230) examination.
Cell isolation
Isolation of rat CBF-MSC and BM-MSC was performed by adapting published protocols [42,49]. Briefly, after flushing the bone marrow, bones were crushed in a mortar and pestle with several washes of 2% FBS-PBS with gentle agitation to remove contaminating marrow cells. Bone chips were then transferred into a 25-cm2 plastic culture flask with forceps and then digested with α-MEM containing 20% FBS in the presence of 3 mg/mL of collagenase I for 2 h on a rotating shaker at 37°C. Three washes with α-MEM followed the digestion, and fragments were subsequently seeded into a 25-cm2 plastic culture flask in the presence of α-MEM supplemented with 20% FBS and incubated at 37°C in a 5% CO2 and 5% O2 atmosphere for 3 days. On the third culture day, the medium was changed to remove nonadherent cells and tissue debris and replaced with complete HG-DMEM medium (supplemented with 15% FBS, 2 mM L-glutamine, 1% penicillin (100 UI/mL)–streptomycin (100 mg/mL), and 0.25 mg/mL amphotericin B). After 5 days in culture, adherent cells were harvested with TrypLE™ Express (Invitrogen) and subsequently passaged. Bone chips were washed and reseeded in the same flasks to allow MSC to continue migrating out from the chips to the flask for at least 3 additional days.
CBF-MSC and BM-MSC cultures
For maintenance of cultures, CBF-MSC and BM-MSC were plated at up to 1×10⁴ cells/cm2 and incubated at 37°C in a humidified atmosphere (90%) with 5% CO2, 5% O2. The number of viable cells was counted by the trypan blue dye exclusion method using a Burker chamber. Adherent cells were serially passaged using TrypLE Express (Invitrogen) upon reaching near confluence (80%), and then reseeded for culture maintenance. Both CBF-MSC and BM-MSC were expanded for up to 10 passages to evaluate the proliferation rate and MSC-associated marker expression.
Proliferation rate and colony forming unit assay
The proliferation rate and colony forming unit (CFU) assay were determined on CBF-MSC and BM-MSC as previously reported [16,17,21]. Doubling time (DT) was assessed from passage (P) 1 to P10. CFU assays were performed at P0, plating cells at different densities (100, 250, 500, and 1,000 cells/cm2). Colonies formed by 16–20 nucleated cells were counted under a BX71 microscope (Nikon).
Cell morphology and immunophenotyping
Confocal microscopy
Cell morphology was evaluated at P3. Cells were fixed with 4% formaldehyde in phosphate-buffered saline and stained for actin cytoskeleton (phalloidin). To evaluate the presence of CD44, CD90, and CD29 on the cell surface, cells were labeled with the following primary antibodies: anti-CD44, anti CD-90/Thy 1, and anti-Integrin beta 1 (Abcam). Secondary antibodies (goat anti-Rabbit IgG DyLight 650-conjugated, goat anti-Rat IgG-DyLight 350-conjugated, and goat anti-mouse IgG FITC-conjugated) were purchased from Thermoscientific. After washing in PBS, samples were stained with antifading 4′,6-diamidino-2-phenylindole (DAPI; Life Technology) for 1 min and captured on a confocal laser microscope (A1 Nikon Confocal Microscope). Images were acquired and analyzed with NIS-Element Nikon.
Flow cytometric analysis
Flow cytometric analysis was performed on cells isolated from the bone marrow and compact bone soon after isolation (P0) and at P3. Tested markers included the integrin β1 (CD29; BioLegend), the thymocyte differentiation antigen 1 (CD90; BioLegend), the glycoprotein CD44 (BioLegend), and nestin (BD Biosciences); 2×10⁵ cells were incubated with directly conjugated antibodies in PBS 0.1% BSA for 30 min at room temperature in the dark. The cells were then washed twice in ice-cold PBS and analyzed using a BD LSR Fortessa™ cell analyzer (Beckton Dickinson). A minimum of 50,000 cells were analyzed. Offline analysis of the fetal calf serum (FCS) files was performed using FCS Express software v.4 (
Multipotent differentiation
Multilineage potential of cells toward osteogenic, adipogenic, and chondrogenic differentiation was assessed in vitro at P3. For both CBF-MSC and BM-MSC, noninduced cells were used as control and cultured for the same time in the growth medium.
Osteogenic differentiation
CBF- and BM-MSC were seeded at the density of 5,000 cells/cm2 in 12-well plates and cultured until they reached ∼80–90% confluence. Osteogenic induction (StemPro® Osteogenesis Differentiation Kit; Gibco) was performed over 14- and 21-day periods. To confirm mineral deposition, conventional von Kossa and alkaline phosphatase staining were performed (VECTOR Blue Alkaline Phosphatase Substrate Kit; Vector Labs).
Adipogenic differentiation
CBF- and BM-MSC were seeded at the density of 1×10⁴ cells/cm2 and cultured until they reached ∼80%–90% confluency. Induction was performed using the StemPro Adipogenic Differentiation Kit (Gibco) for a 21-day period. Intracellular lipid droplet accumulation was visualized by conventional Oil red O staining.
Chondrogenic differentiation
CBF- and BM-MSC were seeded at the density of 5,000 cells/cm2 and cultured in the presence of the StemPro Chondrogenesis Differentiation Kit (Gibco) for 21 days. Conventional Alcian blue staining was performed to highlight proteoglycan deposition.
Mineral deposition and quantification
Mineral deposition following 14 and 21 days of osteogenic induction was quantified using the Osteogenesis Quantitation Kit (Millipore) in accordance with the manufacturer's instructions. Absorbance was compared with curves prepared using standard solutions of alizarin red. Mineral deposition was expressed as μM per well of tissue culture 12-well plates.
Immunosuppressive potential
In vitro stimulation of CBF-MSC
CBF-MSC were seeded at the density of 5×10³ cells/cm2 in 24-well plates and cultured for 24 h at 37°C before stimulation started. Stimulation was performed using soluble recombinant rat TNF-α and IFN-γ (Peprotech) at the concentrations of 10 and 50 ng/mL [50] for 10 min, 30 min, and 1, or 24, 48, and 72 h. At each time point the supernatant was harvested from the cultures, filtered, and stored at −80°C. Cells were stored at −80°C to perform gene expression analysis.
Measurement of prostaglandin E2 production by EIA
Levels of prostaglandin E2 (PGE2) released from treated CBF-MSC and BM-MSC were measured in cell supernatants using the Prostaglandin E2 EIA kit (Cayman Chemical Company). Values obtained from CBF-MSC cultures were compared with their bone marrow counterparts.
Assay for nitric oxide secretion
The presence of nitric oxide (NO) in the culture supernatants obtained from each experimental group was measured using a NO (total) detection kit (Enzo Life Sciences) following the manufacturer's instructions. Nitrate levels released from treated CBF-MSC were compared with those found in BM-MSC.
PBMC proliferation test
Rat PBMCs were obtained from heparinized whole blood samples using density gradient centrifugation (Lymphoprep; Axis-Shield) following the manufacturer's instructions. PBMC proliferation was induced by stimulating PBMCs with 2% phytohemagglutinin (PHA; Sigma-Aldrich) in final HG-DMEM complete media. The effect of BM- and CBF-MSC on T lymphocyte proliferation was determined in a cell–cell contact setting. MSC and PBMCs were plated at a 1:10 ratio. Twenty-four hours after seeding the MSC, PBMCs were stained with BD Horizon™ Violet Cell Proliferation Dye 450 (VPD450) for 10 min, washed in PBS, and cocultured with either BM- or CBF-MSC. PBMC proliferation was assessed by flow cytometry after 3 days of culture.
Molecular characterization
Quantitative reverse transcription polymerase chain reaction (qPCR) analysis was used to evaluate the expression of specific MSC-associated and hematopoietic markers at P1 and P10. Total RNA was isolated from CBF- and BM-MSC using TRIzol reagent (Invitrogen). DNAse (Sigma) treatment followed the reaction. RNA concentration and purity were measured using a NanoDrop ND1000 spectrophotometer (NanoDrop Technologies). The cDNA was synthesized from 1 μg of total RNA using the iScript retrotranscription kit (Bio-Rad Laboratories), and quantitative PCR was run in the ABI 7500 Fast Sequence Detection System (Applied Biosystems) using commercially available master mix. The following target probes (Applied Biosystems) were used to evaluate the expression of
• MSC-associated markers: CD44 (Rn00563924_m1), CD90 (Rn00562048_m1), CD105 (Rn01438763_m1), CD73 (Rn00571989_m1), and CD271 (Rn00561634_m1).
• Specific lineage-associated markers: osteocalcin (BGLAP; Rn00566386_g1), osteopontin (SPP1; Rn01449972_m1), receptor activator of nuclear factor kappa-B ligand (RANKL; Rn00589289_m1), runt-related transcription factor 2 (RUNX-2; Rn01512296_m1), semaphorin-3A (Sema3a; Rn00692251_m1), and alkaline phosphatase (ALP; Rn01516028_m1) expression for osteogenesis; peroxisome proliferator-activated receptor-gamma (PPAR-γ; Rn00440945_m1), adiponectin (ADIPQ; Rn00595250_m1), and lipoprotein lipase (LPL; Rn00561482_m1) for adipogenesis; and the SRY-related high-mobility group box transcription factor (SOX9; Rn01751069_mH), type 2 collagen (COL2α1; Rn01637087_m1), and aggrecan (ACAN; Rn00573424_m1) for chondrogenesis.
• Histocompatibility and immunosuppression-associated markers: major histocompatibility complex class I (MHC-I; Rn01764378_m1), class II (MHC-II; Rn01424725_m1), prostaglandin E synthase (PGES; Rn00572047_m1), cyclooxygenase-2 (COX-2; Rn01483828_m1), and inducible nitric oxide synthase (iNOS; Rn00561646).
The expression of each gene was normalized to the level of GAPDH (Rn01775763_g1) and represented with respect to the values obtained from the control (BM-MSC as gold standard for the MSC characterization, undifferentiated cells for the differentiation studies, and the untreated cells for the assessment of immunosuppression).
Statistical analysis
Statistical analysis was performed using GraphPad Instat 3.00 for Windows (GraphPad Software). Three replicates for each experiment (doubling time, colony forming unit, quantitative PCR (PCR), EIA, nitric oxide assays, and PBMC proliferation test) were performed and the results are reported as mean±SD. One-way analysis of variance for multiple comparisons by the Student–Newman–Keuls multiple comparison test was used.
Results
Cortical bone structure, cell yield, and morphology
CBF-MSC were isolated from the cortical bone (tibias and femora) of each animal (n=3) for a total bone mass of 1.34±0.21 g (Fig. 1A, B). Seventy-two hours after enzymatic digestion, fibroblastic-like cells migrated out from the bone and adhered to the plastic dish (Fig. 1C). At 5 days, more cells were observed (Fig. 1D) concomitantly with the appearance of sparse colonies. After 1 week from the initial culture, a layer of homogeneously shaped cells was obtained (Fig. 1E). The mean cellular yield was 12×106±34 for the CBF-MSC compared with 643×106±56 for BM-MSC. Phalloidin staining suggests that CBF-MSC tend to aggregate and organize, while BM-MSC do not (Fig. 1F, H). Consistent with this, despite looking fibroblastic-like by the transmission microscope, the confocal images reveal CBF-MSC to be bigger in size (Fig. 1G) than BM-MSC (Fig. 1I).
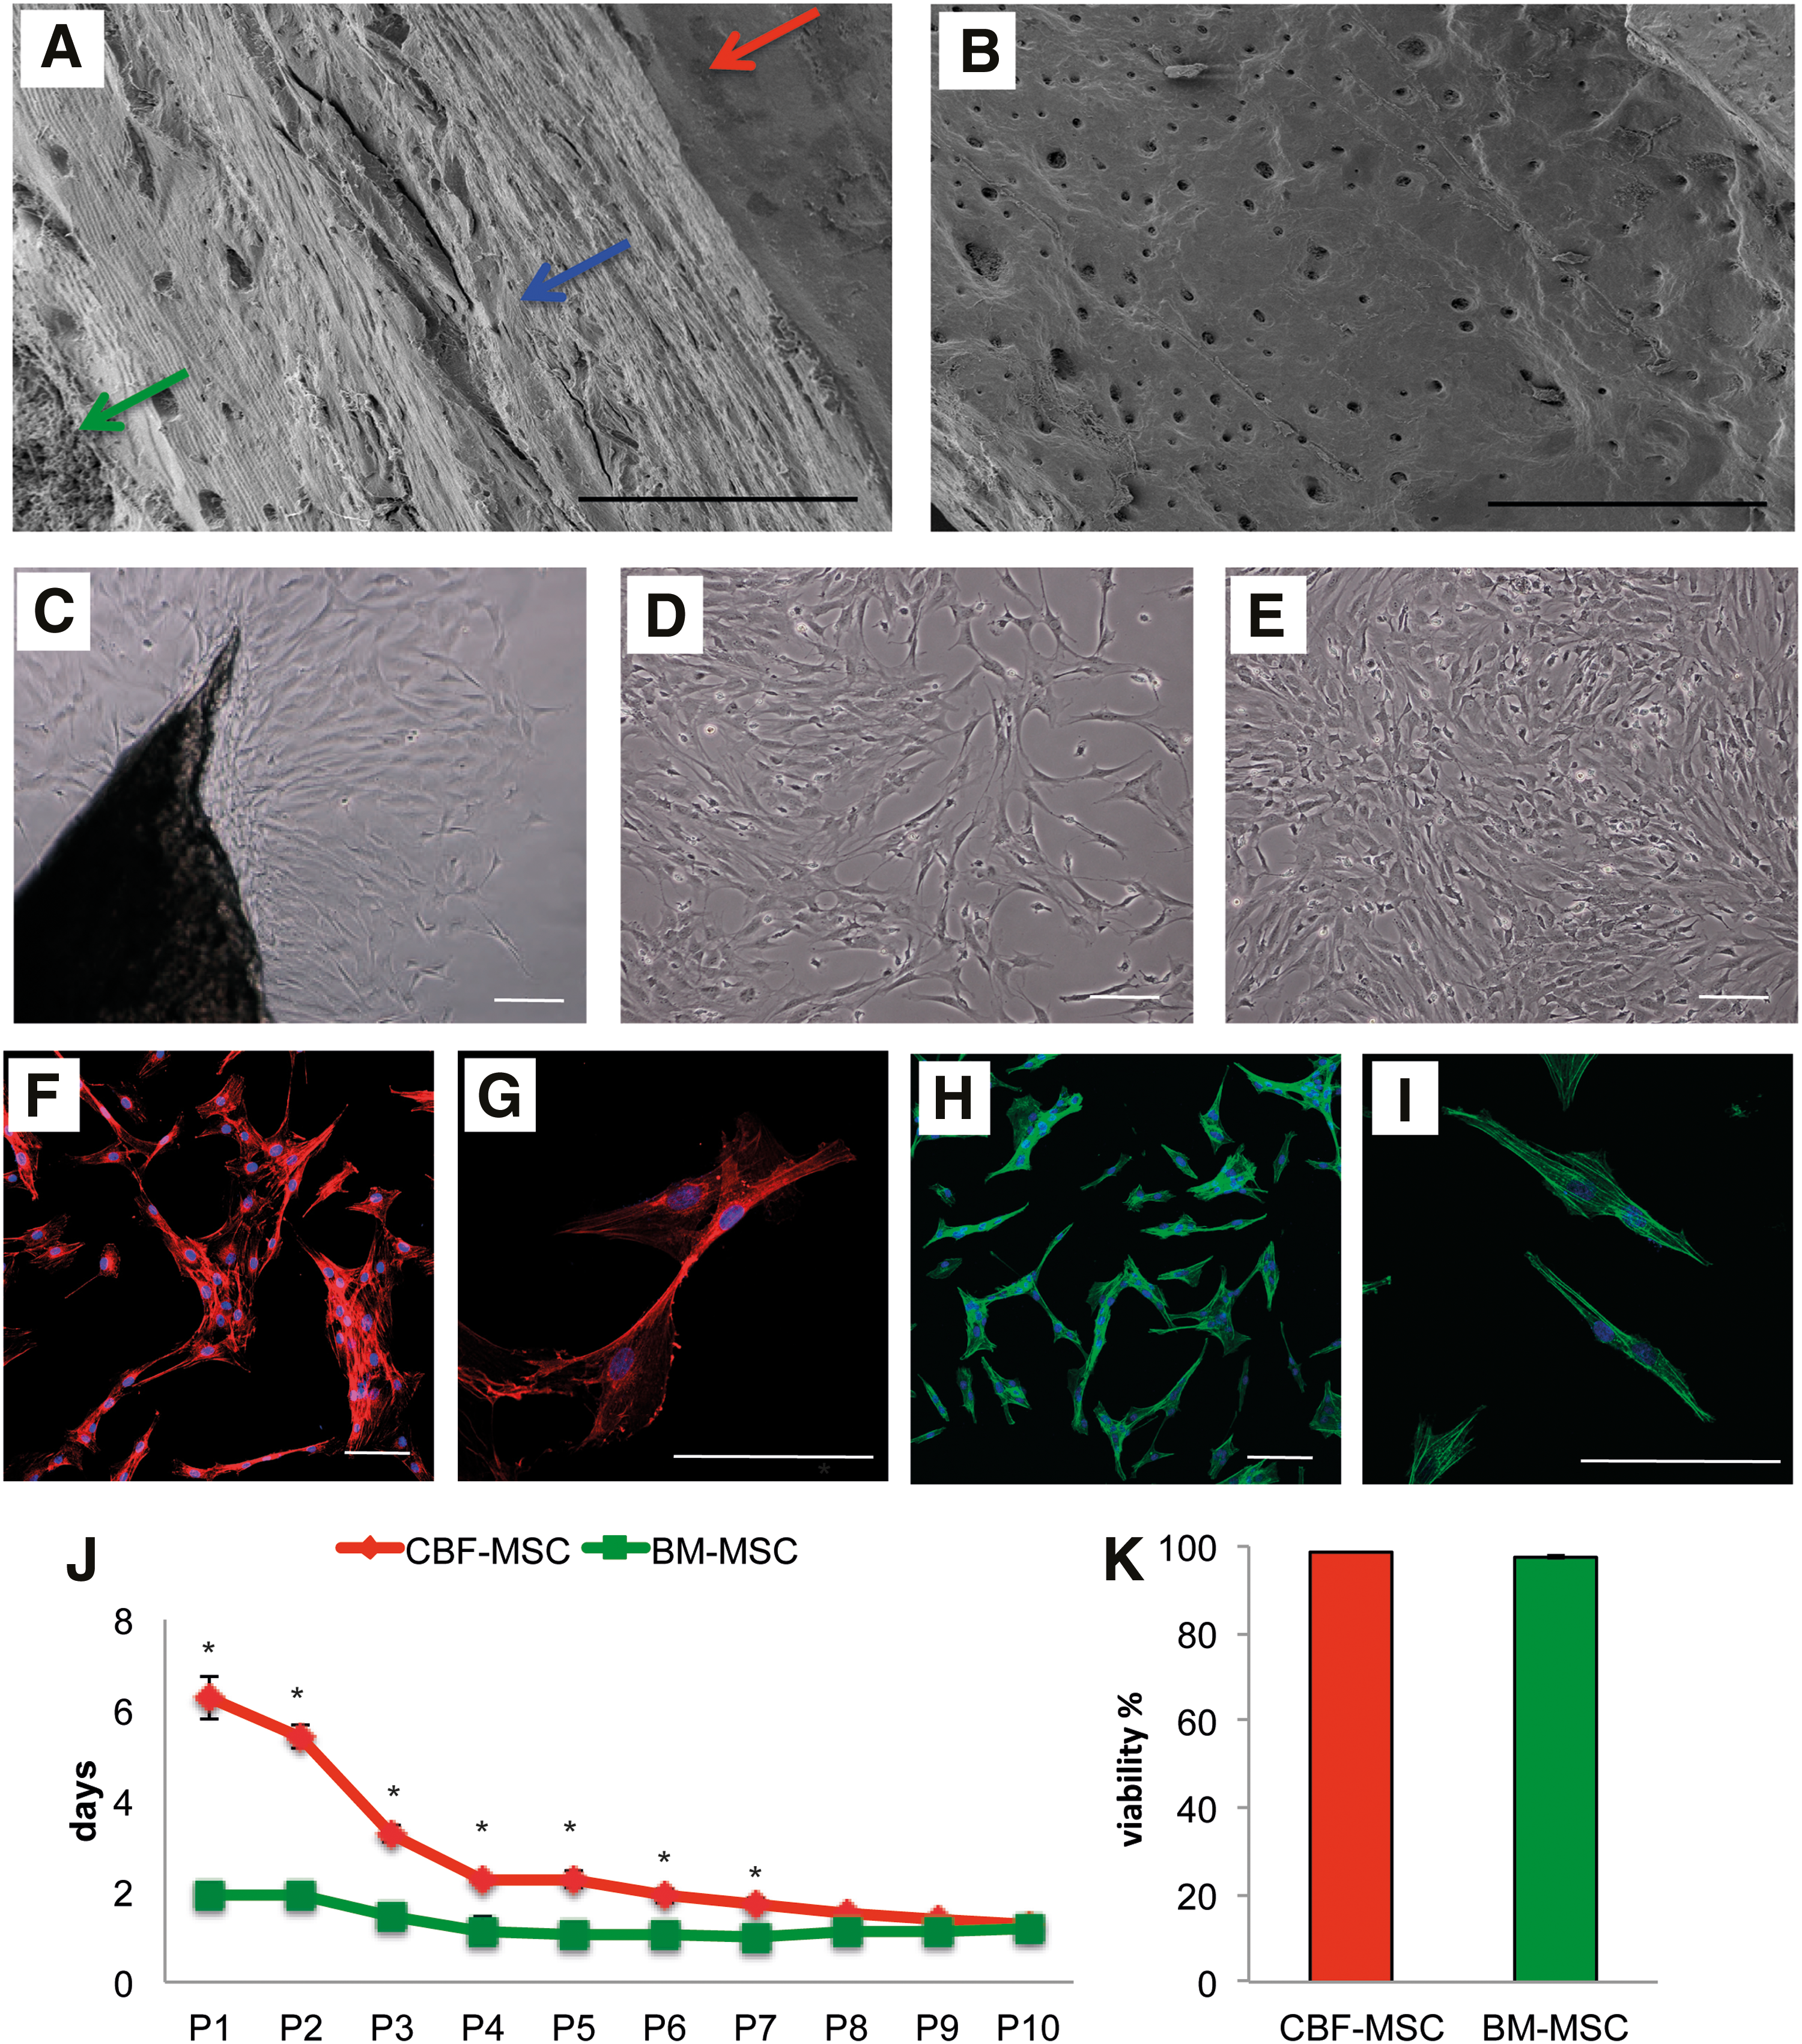
Cell morphology and proliferation. SEM images showing
Proliferation rate, viability, and CFUs
As expected, the proliferative capacity of CBF-MSC in vitro was generally slower than that observed in BM-MSC (2.72±0.13 vs. 1.28±0.08). As shown in Fig. 1J, the DT for the first passages (from P1 to P2) was higher than the later passages, with mean values of 5.83±0.58 days for CBF-MSC and 1.91±0.03 days for BM-MSC. Statistically significant differences were found between P1 and P2 and cells at P1 compared with the following passages: From P3 to P10, the mean DT value was 1.95±0.65 days for CBF-MSCs and 1.13±0.12 for BM-MSC. At each passage from P1 to P10, the difference observed between CBF-MSC and BM-MSC DT was statistically significant (P<0.05) with the exception of P10. The viability of CBF-MSC was assessed around 98.65%±0.017%, with no differences compared with BM-MSC (Fig. 1K). A significant increase in colony-forming units was found at higher cell seeding densities for both CBF-MSC and BM-MSC (Table 1).
Comparison between cell densities with different superscript letters are significantly different (P<0.05).
BM-MSC, bone marrow-derived MSC; CBF-MSC, cortical bone fragments-derived MSC.
Molecular characterization and immunophenotyping
Flow cytometric analysis showed a morphologically homogeneous CD44+, CD90+, and CD29+ cell population emerging from the cortical portion soon after isolation. These cells consistently expressed similar mesenchymal surface markers (87% of the CBF-MSC) in comparison with bone marrow-derived cells, where the population of interest represented only 0.7% of all cells extracted (Fig. 2A). Among these cells, 39.8% of BM-MSC were positive for nestin, whereas only 12.4% of nestin-positive cells were found in CBF-MSC (data not shown). At passage 3, a pure cell population was observed for both sources (Fig. 2B), as confirmed by confocal microscopy (Fig. 2C). The expression of progenitor (CD271), MSC (CD44, CD90, CD73, CD105), and the hematopoietic (CD34)-associated markers was evaluated at P1 and P10 (Fig. 2D). Among these markers, at P1, a three-fold increase in the expression of CD44 (P<0.01) and a statistically significant (P<0.05) reduction in the expression of CD90 were observed in comparison with their counterparts isolated from the bone marrow. Over the passages studied, no differences in the expression of CD271 were found between the two cell types. Expression of CD105 was lost after P1, whereas the hematopoietic marker, CD34, was not detected at any stage.

Immunophenotyping and molecular characterization. Flow cytometric analysis showing
Multilineage differentiation
CBF-MSC readily differentiated into adipocytes, chondrocytes, and osteoblasts. When appropriately induced, CBF-MSC developed lipid vacuoles, secreted extracellular proteoglycans, and deposited minerals (Fig. 3A). For adipogenesis, PPAR-γ increased 2.23±0.03-fold, LPL increased 2.22±0.26-fold, and ADIPQ increased 1.47±0.10-fold in CBF-MSC (Fig. 3B). For chondrogenesis, SOX9 expression increased 8.81±1.5-fold, ACAN increased 3.65±0.37-fold, and COL2α1 increased 2.80±0.03-fold (Fig. 3C).
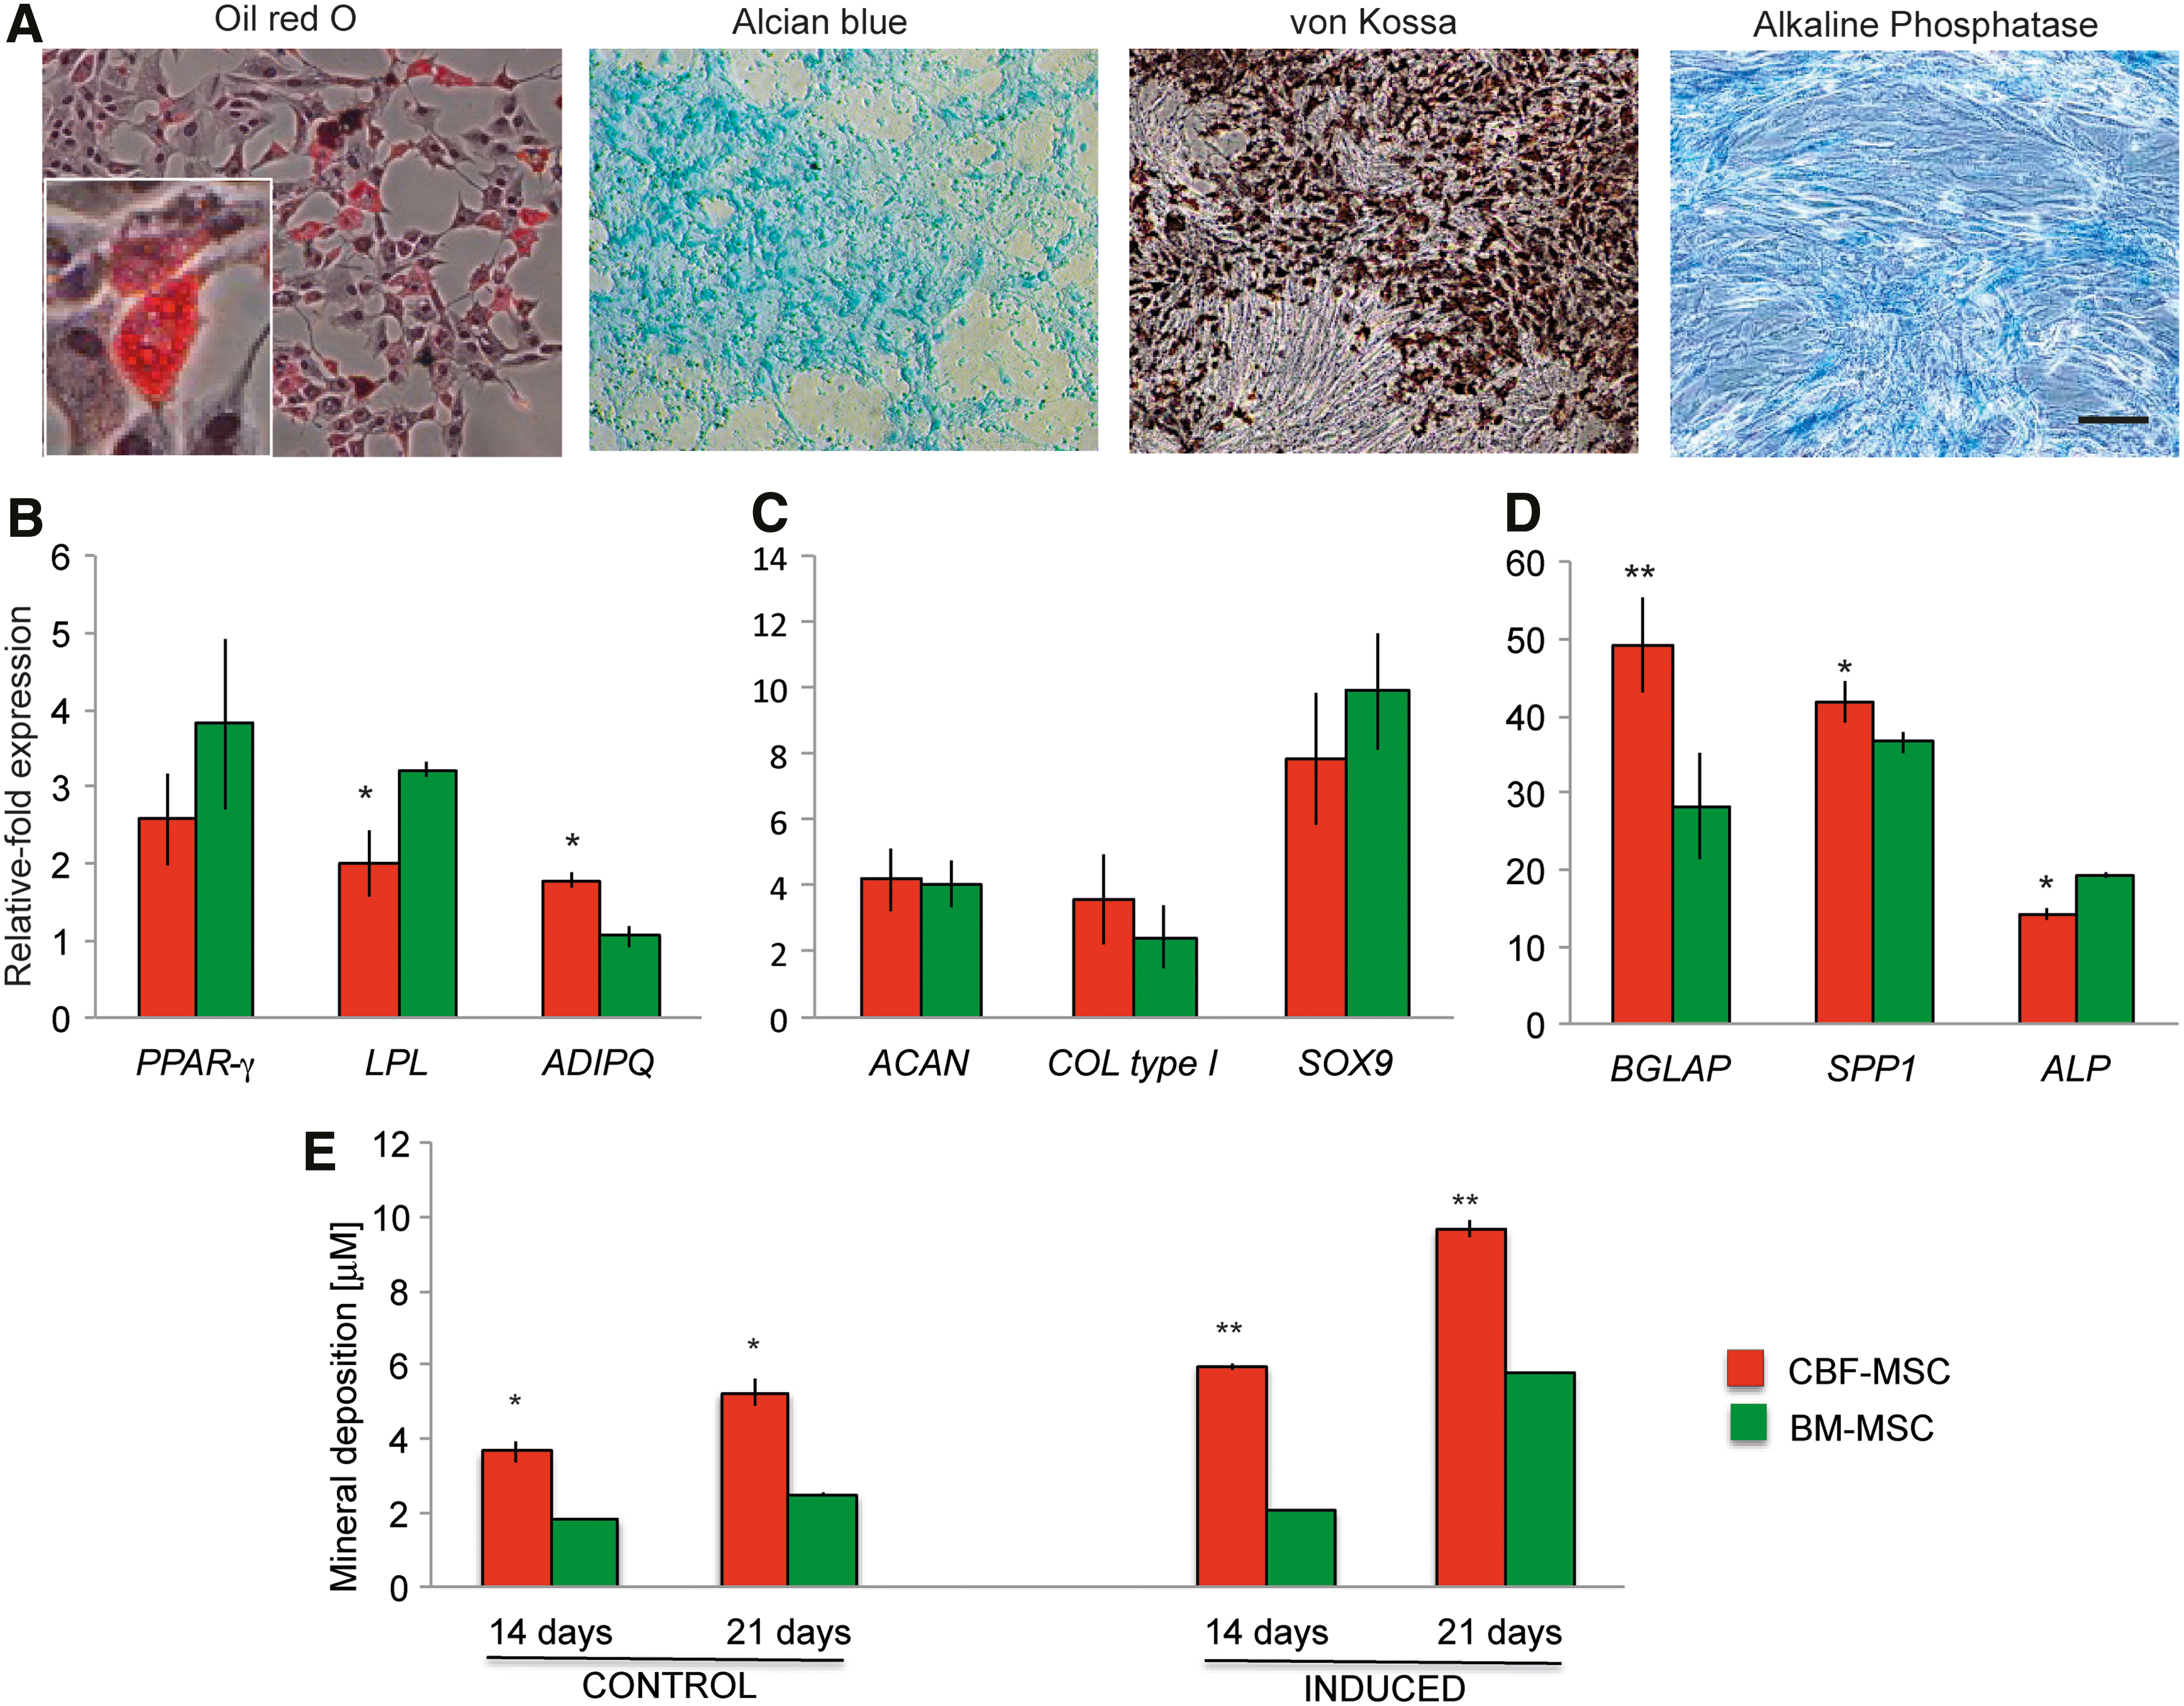
Multipotent differentiation assay.
The capability of CBF-MSC to undergo osteoblastogenesis was assessed by ALP staining and confirmed by the formation of mineralized nodules as detected by von Kossa staining (Fig. 3A). The expression of osteogenesis-associated genes quantitatively confirmed the induction (Fig. 3D). ALP expression increased 6.61±2.5-fold, BGLAP increased 49±6-fold, and SPP1 increased 41.89±2.75-fold compared with their uninduced counterparts. At 21 days of induction, CBF-MSC produced a two-fold increase in mineral deposition compared with their bone marrow counterparts (9.662±0.216 vs. 5.76±0.009, respectively). As demonstrated in Fig. 3E, CBF-MSC spontaneously differentiated toward the osteogenic lineage, depositing a great amount of minerals (3.54±0.28 and 5.24±0.38 μM after 14 and 21 days in culture, respectively). As a control, BM-MSC values were found to be reduced by two-fold.
Immunosuppressive potential
Over the passages, the expression of MHC-I and MHC-II was comparable between the two cell types (Fig. 4A). To study the immunosuppressive features of CBF-MSC, cells were stimulated for 24, 48, and 72 h with proinflammatory cytokines (TNF-α and IFN-γ) [50]. The basal levels of NO in CBF-MSC were found to be double those observed in BM-MSC at all the time points studied (Supplementary Fig. S1; Supplementary Data are available online at
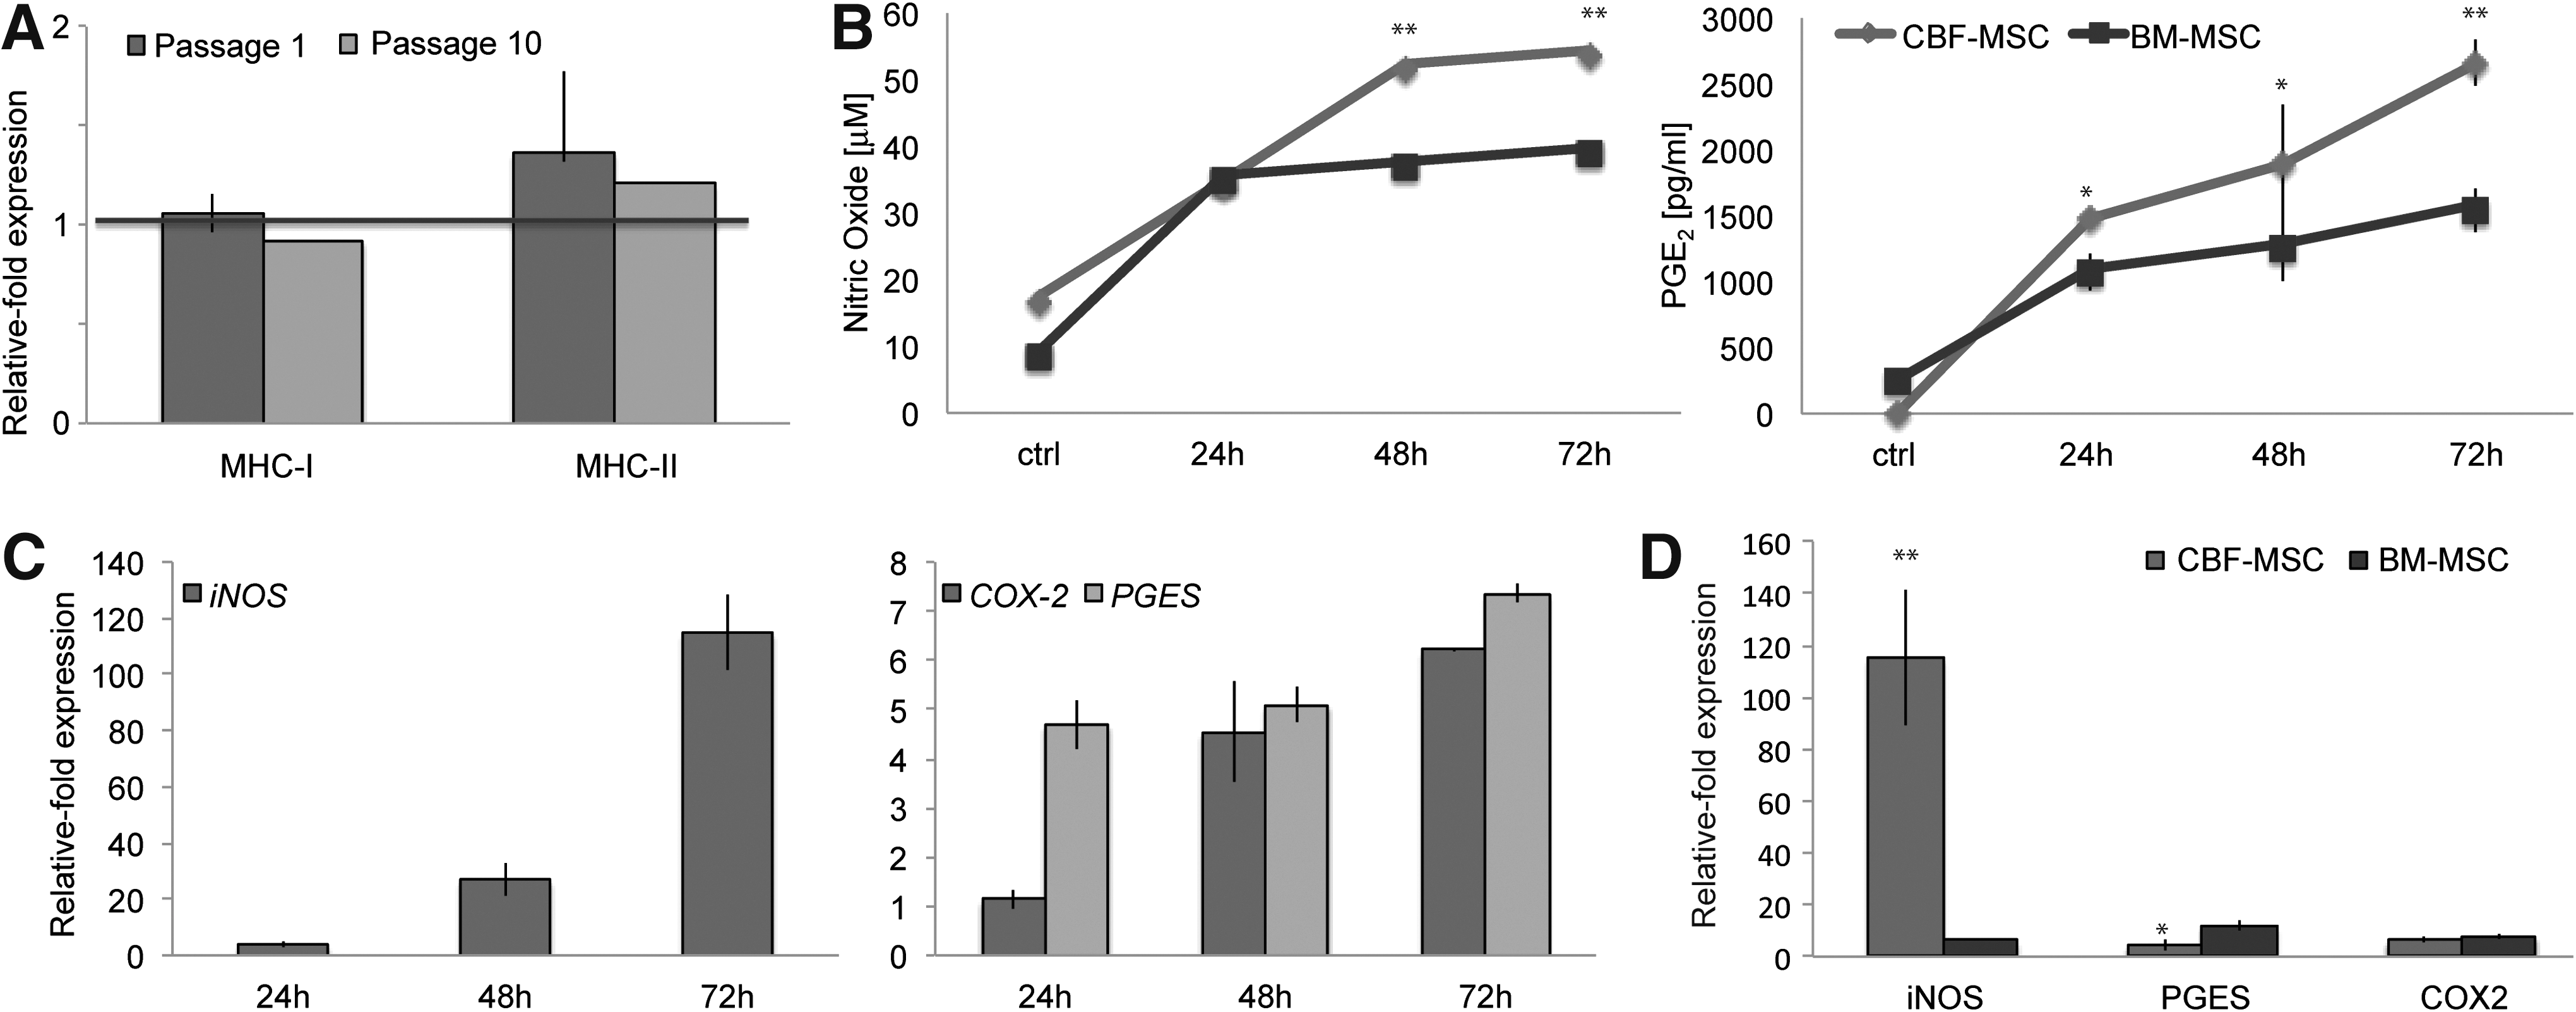
Immunocompatibility and immunosuppressive potential.
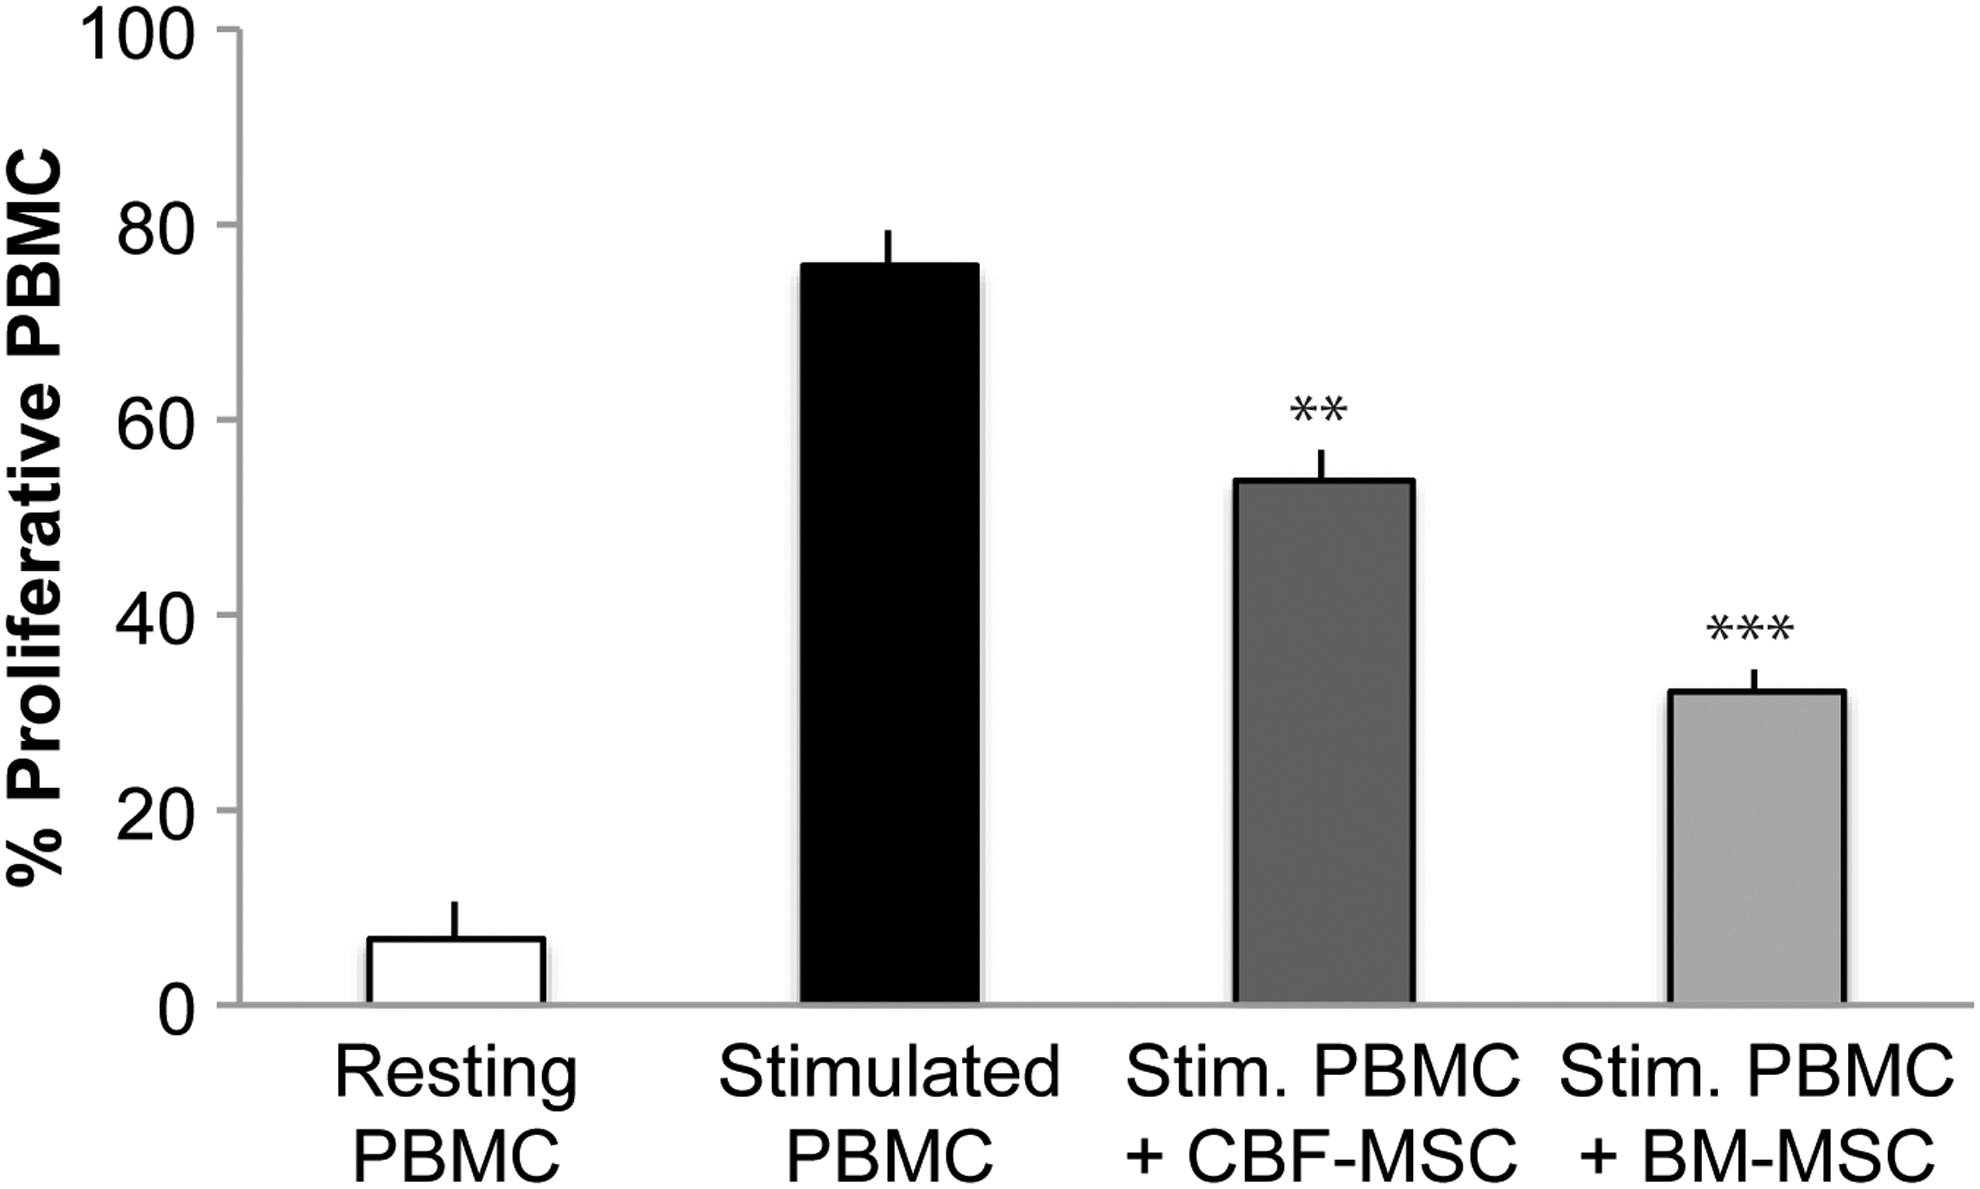
Effect of CBF- and BM-MSC on the proliferation of stimulated PBMCs following 72 h of coculture. For comparison, the percentage of proliferative PBMCs in the presence (stimulated) and absence (resting) of PHA is also reported. Data represent the mean and SD of three independent experiments. **P<0.05, ***P<0.01 versus stimulated PBMCs. PBMC, peripheral blood mononuclear cell; PHA, phytohemagglutinin.
Discussion
Progenitor cells have been identified and isolated from the bone marrow [36], the cortical [42], and trabecular region of the bone [38 –41]. In this study, we demonstrate that the cortical portion of the bone contains a unique subset of cells that displays distinctive functions, despite sharing similar properties with progenitor cells derived from the bone marrow. Cells obtained from these intricately connected tissues (Fig. 1A) share a common origin; however, we hypothesized that the different features of the tissues they reside in (the cortical bone and the marrow) and the paracrine signals they are exposed to differently program these cells to develop and react to local stimuli. Despite the mean cellular yield being much lower for CBF-MSC than for BM-MSC, soon after the enzymatic digestion, the cell population derived from the cortical bone was morphologically and phenotypically homogeneous, whereas the BM-MSC population was not (Fig. 2A) [15,38,40 –42,51]. Moreover, among those cells, a relevant percentage (87%) was positive for the MSC-associated markers tested (CD44, CD90, and CD29) against the 0.7% found in the bone marrow flush. This suggests the cortical portion of the bone as being a richer source of MSC than the bone marrow. The percentage of MSC-like cells became close to 100% in both, CBF-MSC and BM-MSC, only at passage 3. For a broader characterization of the nature of CBF-MSC, the presence of a nestin+ cell subset was also evaluated [52,53]. Our data revealed that while 39.8% of BM-MSC were nestin+, only 12.4% of nestin+ cells were found in CBF-MSC. These findings can be explained with the fact that within the bone, nestin+ MSC are strictly perivascular and typically found in more central areas of the marrow, whereas in the immediate vicinity of the endosteum they are found at a lower frequency [54].
On the other hand, as reported for cells isolated from the human trabecular portion of the bone [40], CBF-MSC also expressed CD271, a marker that belongs to the low affinity neurotrophin receptor and tumor necrosis factor receptor superfamily [55]. This marker has been shown to potentially define an MSC precursor subpopulation able to effectively suppress the allogeneic reaction [56] and is being used for the enrichment of nonhematopoietic stem cells from bone marrow aspirates [57,58] and lipoaspirates [59]. Interestingly, its expression appeared to increase with the passages in vitro, which can be correlated with the greater proliferative capacity acquired by CBF-MSC during the 10 passages in culture [58]. At early passage, CBF-MSC display a significantly increased DT compared with BM-MSC, reflecting the resting nature of osteoprogenitor cells on the bone surface and reinforcing the hypothesis of a superior osteogenic commitment [60]. So far, quiescence of progenitor cells within the niche has been directly linked to their ability to induce an efficient tissue reconstitution and is critical for sustaining the stem cell compartment in the long term [48].
Despite the genome of MSC being reported to be stable over repeated passaging in vitro [61], we found significant differences also in the expression of some of the MSC-associated markers studied (CD44, CD105, CD90, and CD73) at the latest passage (P10). We found that at the earliest passages the levels of CD90 mRNA found in CBF-MSC were significantly (P<0.05) lower and CD44 expression was significantly (P<0.01) upregulated when compared with BM-MSC. These findings support the first evidence about the role that the environment has on progenitor cells. In fact, CD90 expression has been reported to decrease when MSC are mechanically stimulated to undergo osteoblastogenesis [62]. Accordingly, CD44 has been reported to be responsible for connecting some constituents of the extracellular matrix with the cell surface, thus maintaining bone homeostasis [63]. The expression of CD73 also substantiates the nature of CBF-MSC, being the marker responsible for the correct osteoblast differentiation [64]. To exclude any possibility of osteocyte dedifferentiation and confirm that the fluctuations observed in the gene expression and proliferation rate are mainly induced by the culture conditions elicited for this specific study, we also evaluated the expression of some osteoblast-specific markers (such as Sema3a, RUNX2, and RANKL) in CBF-MSC at early passage in comparison with BM-MSC. Our findings support the hypothesis of CBF-MSC as osteoprogenitor cells, as the levels of expression of RUNX2 and RANKL are comparable with those observed in BM-MSC, whereas Sema3a levels are even lower (Supplementary Fig. S2). Random variations in gene expression have been previously described, mainly induced by the culture conditions elicited for a specific study [65]. In our work, the changes observed could be mainly determined by the low-oxygen environment [65]. According to this, although CBF-MSC DT values were significantly higher than BM-MSC at early passages, overtime they became close to those observed in BM-MSC. Taken together, these evidences confirm the role of the low-oxygen culture conditions in increasing cell proliferation while possibly inducing phenotypic changes.
Our data show that when appropriately induced, cells with cortical origin share with their bone marrow counterparts the ability to differentiate into the adipogenic and chondrogenic lineages. The quantitative and qualitative results from the osteogenic assays consistently demonstrated that CBF-MSC produced a greater amount of mineral deposition than BM-MSC, even in the absence of induction. Although alkaline phosphatase, an early marker in bone differentiation, was quantitatively and qualitatively present in both cell populations, CBF-MSC expressed higher levels of osteocalcin and osteopontin, confirming a more mature osteoblastogenesis compared with their bone marrow counterparts.
The expression of CD271 and MHC-I as well as the lack of expression of MHC-II, together with their greater osteogenic potential than BM-MSC, suggest CBF-MSC as suitable candidates for bone tissue engineering applications. To better understand the role of CBF-MSC in cellular therapy, we further investigated their response to the proinflammatory cytokines that are able to elicit local and systemic inflammation [50]. We evaluated the immunosuppressive potential of MSC in response to proinflammatory environments by measuring the increased secretion of PGE2 and NO [6] and the expression of the inducible enzymes COX-2, PGES [66], and iNOS. These enzymes are crucial for the production of PGE2 and NO by MSC, which ultimately leads to the inhibition of T cell proliferation [67,68]. CBF-MSC actively reacted to stimulation at the highest concentration of TNF-α (50 ng/mL). These observations were corroborated by the significant increase detected when we looked at the expression of inducible enzymes involved in the production of PGE2 and NO was detected. Based on these evidences, we further investigated the effect of CBF-MSC in inhibiting PHA-stimulated PBMC proliferation in a cell–cell contact assay. The functional study confirmed the immunosuppressive potential of CBF-MSC, yet suggesting a lower immunogenicity of CBF-MSC compared with BM-MSC. In the process of confirming the immunosuppressive potential of CBF-MSC, a marked accumulation of NO was observed even in the absence of stimulation. Interestingly, we noticed that the basal levels of NO secreted by CBF-MSC were two times greater than those detected in BM-MSC, suggesting that these cells constitutively secrete NO. We hypothesize that the levels of NO observed in the absence of stimulation could be mainly explained with the stress caused by the harsh procedure used to isolate CBF-MSC as well as with the role that NO has in bone metabolism. Within the bone, NO not only acts as a mediator of inflammation but is also a critical player in bone remodeling [66], being actively used in osteoblasts–osteoclasts communication [69]. In addition, PGE2 is known to be an autocrine effector in regulating osteoblast proliferation and differentiation. Its role, however, is dependent on the concentration of PGE2 present in the surrounding environment [70]. Bone-forming cells normally release PGE2 when the recruitment of osteoprogenitor cells from the bone marrow is required [71]. In agreement to this, we found no significant constitutive secretion of PGE2 in CBF-MSC compared with BM-MSC at early time points, confirming the nature of CBF-MSC as osteoprogenitor cells and the need for specific stimuli to induce PGE2. Data obtained in this study reinforce our hypothesis that CBF-MSC hold the ability to respond to proinflammatory stimuli and potentially inhibit the proliferation of allogeneic T lymphocytes [72]. Due to their greater osteogenic potential and their superior ability to react to stimuli provided by the microenvironment, CBF-MSC could play a key role in the development of tissue engineering strategies for bone repair as a potential alternative to tissue transplantation and BM-MSC-based therapies.
Footnotes
Acknowledgments
This work was supported by the Cullen Trust for Healthcare Foundation for stem cell plasticity studies (Project ID: 18130014) and the Brown Foundation (Project ID: 18130011) support to Dr. Tasciotti. Dr. Taraballi's fellowship was supported by the Italian Ministry of Health (GR-2010-2318370) and Dr. Corradetti's by the Fondazione Marche/ISSNAF Post-Doc Fellowship. The authors thank Dr. Jeffrey Van Eps for assistance with rat tissue collection and David Haviland and HMRI Flow Cytometry Core Facility for flow cytometry setup and acquisition.
Author Disclosure Statement
No competing financial interests exist.
References
Supplementary Material
Please find the following supplemental material available below.
For Open Access articles published under a Creative Commons License, all supplemental material carries the same license as the article it is associated with.
For non-Open Access articles published, all supplemental material carries a non-exclusive license, and permission requests for re-use of supplemental material or any part of supplemental material shall be sent directly to the copyright owner as specified in the copyright notice associated with the article.