
Abstract
Human hematopoietic stem and progenitor cells (HSPCs) from umbilical cord blood exhibit higher differentiation potential and repopulation capacity compared to adult HSPCs. The molecular basis for these functional differences is currently unknown. Upon screening for epigenetic effector genes being differentially expressed in neonatal and adult HSPC subpopulations, the Polycomb Repressive Complex 2 (PRC2) member EED was identified. Even though EED is expressed at comparable amounts in neonatal and adult multipotent HSPCs, early adult lineage committed progenitors of the lymphomyeloid (LM) and erythromyeloid lineages expressed higher EED amounts than neonatal HPCs. We demonstrate that EED overexpression directly leads to higher H3K27me3 levels, a repressive histone modification that is mediated by the PRC2 complex. Quantitative analysis of H3K27me3 levels by FPLC-based ELISA revealed elevated levels in primary blood cells from adults. Besides quantitative changes, gene ontology analysis of the genome-wide H3K27me3 distribution revealed qualitative changes in adult HSPCs with elevated levels in genes associated with nonhematopoietic development pathways. In contrast, H3K4me3 which labels active chromatin was enriched on hematopoietic genes. In vitro differentiation of EED-transfected neonatal HSPCs revealed aberrant expression of the myelopoietic marker CD14, suggesting that EED affects the lymphoid versus myeloid decision processes within the lymphomyeloid lineage. This is in line with LM progenitors having the most pronounced differences in EED expression. Highlighting the dynamic roles of epigenetic modifications in human hematopoiesis, the present data demonstrate shifts in the PRC2-associated histone modification H3K27me3 from birth to adulthood.
Introduction
T
In mice, aged HSCs have a clearly reduced repopulation potential which has been intensively investigated. Some early studies indicate that aged HSCs intrinsically lose their stem cell potential during aging [4]. This seems to be, at least partly, compensated by an age-associated increase in stem cell number [4]. More recent studies, however, demonstrated that the functional capacity of individual HSCs is not impaired with aging, but that HSCs which are intrinsically biased for myelopoiesis tend to dominate the stem cell pool in older mice [5,6]. This is reflected in (1) a pronounced myeloid skewing of hematopoiesis in elderly mice and (2) a preferential repopulation of the myeloid department after HSC transplantation from old donor mice [4,6 –10]. It has been confirmed also for humans that the frequency of HSCs in the BM increases during aging and that these HSCs are myeloid biased [11].
During the last years it has become evident that changes in DNA methylation (DNAm) are indicative for the aging of the organism [12 –18]. Some of the observed DNAm changes are certainly due to altered tissue compositions, while there is increasing evidence that the majority is tissue independently connected to aging [19]. Especially in the case of the hematopoietic system, it has been shown that age-associated changes between CD4+ T cells and CD14+ monocytes are comparable [15]. Interestingly, it has been observed that age-associated DNAm tends to increase on promoters, which are known as Polycomb Repressive Complex 2 (PRC2) targets, and bivalently modified in embryonic stem cells [13 –15].
PRC2 is responsible for gene silencing through trimethylation of H3K27 (H3K27me3). It regulates HSC proliferation and differentiation and has also been associated with HSC aging [20 –22]. PRC2 consists of several subunits, with the core units Ezh2, Eed, and Suz12 being essential for the enzymatic activity [23 –25]. Ezh2 contains a catalytically active SET domain and is responsible for the trimethylation of H3K27, which initiates gene silencing [23 –27], while EED is important for recognition of the histone target [28,29].
PRC2 also plays an important role during tumorigenesis. Both, overexpression and loss of PRC2 members have been associated with various forms of blood cancers [30 –33]. In the case of myelodysplastic syndrome, for example, loss of EZH2 or another member of PRC2 is associated with a poor prognosis [34,35]. On the other hand, overactive mutants of EZH2 are responsible for abnormally high levels of H3K27me3 in lymphomas [31 –33]. For treatment of the latter, pharmacological inhibitors of EZH2 are currently tested [36,37].
In this study, we investigated the expression of the PRC2 member EED in different hematopoietic progenitor cell fractions, which were flow cytometrically purified as multipotent stem and progenitor cells (HSCs/MPPs), lymphomyeloid (LM) progenitors, and erythromyeloid (EM) progenitors, according to the revised model of hematopoiesis we proposed recently [2,38 –40]. Elevated EED expression was detected in adult, but not neonate LM progenitor fractions. A minor increase was also observed in adult EM progenitors, but neither in adult HSC/MPP fractions or any of the neonate fractions. This was associated with a global increase of the repressive histone mark H3K27me3, which was accompanied by a clear qualitative shift in gene categories occupied by H3K27me3. Additionally, we demonstrate that elevated EED levels reduce the formation of natural killer (NK) cells in vitro and promote the appearance of myeloid CD14+ cells instead.
Materials and Methods
Isolation of HSPCs
Mononucleated cells (MNCs) were obtained by density centrifugation on Ficoll-Hypaque (Biochrom) from umbilical CB of male newborns, as well as from BM of healthy male adult donors. MNCs from PB were collected during leukapheresis after mobilization with G-CSF.
CD34+ HSPCs were enriched with immunomagnetic beads specific for CD34 (Miltenyi Biotech) to a purity of >90%. HSCs/MPPs (CD34+CD133+CD45RA−CD90+), LM progenitors (CD34+CD133+CD45RA+), and EM progenitors (CD34+CD133lowCD45RA−) were highly enriched (>99.5%) through flow cytometric cell sorting (FACSAria IIIu; BD Biosciences) from CD34-enriched HSPCs (MACS; Miltenyi Biotech) as described previously [2,38
–40]. Experimental details are summarized in Supplementary Fig. S2 and Supplementary Table S2 (Supplementary materials are available online at
For ChIP-on-chip analyses CD34+/Lin− cells, that is, cells that do not express selected markers characteristic for differentiated hematopoietic cells (for detailed information, see Supplementary Table S2), were flow cytometrically enriched to a purity of >99% (MoFlo XPD; Beckman Coulter) and for differentiation assays, a lineage depletion step, excluding cells expressing either CD2, CD3, CD11b, CD14, CD15, CD16, CD19, CD56, CD123, or CD235a (Miltenyi Biotech) preceded the CD34+ enrichment. CD34− cells were either obtained from the negative fraction after CD34+ isolation or, considering the low frequency of CD34+ in PB (<0.1%), the complete MNC fraction was used.
The study was approved by the University of Düsseldorf and the University Hospital Essen Ethics Committee, and all samples were collected after obtaining informed consent of the donors or the donors' mothers, respectively.
Gene expression analysis
RNA was isolated with the mirVana (Ambion) or the RNeasy Kit (Qiagen) according to the manufacturer's instructions. cDNA was either synthesized with the iScript cDNA synthesis Kit (BioRad) using a combination of oligo(dT) and random primers, or generated with M-MLV Reverse Transcriptase and oligo(dT) primers (Promega) according to the manufacturer's instructions, or synthesized with the High-Capacity cDNA RT kit (Life Technologies). Expression levels of 37 epigenetic modifiers were measured with a microfluidic card (Applied Biosystems) on an ABI 7900HT instrument (Applied Biosystems).
TaqMan Gene Expression Assays (Applied Biosystems) were performed on an ABI 7700 instrument (Applied Biosystems). Further gene expression was determined by quantitative polymerase chain reaction (PCR) with SYBR Green (Fermentas) on an ABI 7700 instrument (Applied Biosystems). Primer sequences are available upon request. All data were normalized to GAPDH as a housekeeping gene. Mean values were calculated after normalization and significance was determined with two-tailed Student's t-tests.
H3K27me3 ELISA
Histones were isolated as described previously [41] and H3 was purified through FPLC (for details, see Supplementary Data, Methods S1). Purified H3 was resuspended in ELISA lysis buffer (Cell Signaling Technology) with 1 mM PMSF (Roth). Five to ten nanograms of purified histone H3 were analyzed with the PathScan H3K27me3 ELISA Kit (Cell Signaling Technology) according to the manufacturer's recommendations.
Antibodies
For antibodies used in western blot, ChIP-assay, and flow cytometry, please refer to Supplementary Tables S1 and S2.
Western blotting
Nuclear extracts were prepared and analyzed by western blot. Secondary antibodies against mouse or rabbit IgG were either coupled to a fluorophor (LI-COR Biosciences) or to horseradish peroxidase (Santa Cruz). Fluorescence was analyzed on an Odyssey infrared imager (LI-COR Biosciences instrument) using Odyssey 2.0 software. Ratios between H3K27me3 and H3 were calculated for quantification. Chemiluminescence was detected on an LAS 3000 instrument (Fuji Film).
Chromatin immunoprecipitation
Chromatin immunopreciptiation (ChIP) of 1×10⁶ cells was performed essentially as described before [42] with the ChIP Assay kit from Millipore (Millipore). Immunoprecipitation was performed overnight. Promoter regions of different genes as well as the LINE element were analyzed by real-time PCR with SYBR Green on an ABI 7700 instrument. Primer sequences are available upon request. Data were normalized to the input control and subsequently to total H3.
ChIP-on-chip analysis
For ChIP-on-chip analyses, precipitated DNA was amplified with the GenomePlex Whole Genome Amplification Kit (Sigma) [43]. One microgram of DNA was labeled according to the NimbleGen protocol and hybridized to 385k RefSeq NimbleGen Promoter arrays (Roche, NimbleGen) enabling investigation of 24,659 human promoters, each spanning 2,200 bp upstream and 500 bp downstream of the respective transcription start site. For more details, see Supplementary Data, Methods S2.
Lentiviral overexpression of EED
EED cDNA starting with the first ATG [44] was amplified using the following primers: 5′-GATTGACTCGAGAATATGTCCGAGAGGGAAGTGTC-3′ and 5′-CGGCTAGCCGTTATCGAAGTCGATCCCAGCG-3′ and cloned into the pCL6 vector (kind gift of Prof. H. Hanenberg, University Clinic Düsseldorf) directly in front of eGFP, separated by an IRES site. Lentivirus was generated from the pCL6 control vector and the EED-containing vector using HEK293T as a producer cell line. Cells were incubated with the virus on RetroNectin (TaKaRa)-coated plates for 16–72 h, washed once and transferred to the appropriate medium. If necessary, transduced cells were flow cytometrically enriched for eGFP expression (MoFlo, Beckman Coulter) to obtain pure EED-overexpressing cells for further analyses.
In vitro differentiation assays
CD34+/Lin− cells were isolated from CB using magnetic beads. Cells were transferred on RetroNectin-coated plates and transduced with the lentivirus. After 16–24 h they were replated onto murine EL08 feeder cells and differentiated into NK cells as described previously [45,46]. eGFP-expressing cells were flow cytometrically (MoFlo; Beckman Coulter) enriched after 2 weeks of culture and plated on fresh feeder cells for the remaining culture period. At the end of the cultivation, eGFP-expressing cells were again flow cytometrically sorted to gain pure EED-overexpressing cells for transcription analyses. Additionally, different surface markers were flow cytometrically analyzed in the eGFP-positive population (MoFlo or FC500; Beckman Coulter).
For the colony-forming cell (CFC) assays of the purified HSPC subsets, 200 sorted cells (HSCs/MPPs, LM, and EM progenitors; see Supplementary Fig. S2 for details) were seeded into 1 mL MethoCult H4434 (StemCell Technologies) in duplicates. Hematopoietic colonies were scored after 14 days as described previously [38,39]. EED-overexpressing cells were cultivated for 1 week on murine EL08 feeder cells with the starting medium for NK cell generation. Afterward, eGFP-expressing cells were flow cytometrically purified and either 500 or 1,000 eGFP+/CD34+/CD14− or eGFP+/CD34−/CD14− cells were sorted directly into MethoCult GF H4434 medium in triplicates. Colonies were counted in a light microscope (Hund) after 17 days. Afterward, colonies were manually picked under the light microscope and flow cytometrically analyzed for eGFP expression (FC500; Beckman Coulter).
Results
Differences in EED expression in HSPCs from newborns and adults
To characterize human HSPCs at an epigenetic level, we compared the expression changes of genes encoding epigenetic enzymes which participate in histone modification, remodeling of the chromatin and DNAm, in neonatal (CB) and adult (BM/PB) CD34+ cells. This cell population, which is relevant for human stem cell transplantation, comprises a mixture of long- and short-term HSCs, as well as different lineage-specific hematopoietic progenitor cells [39,47 –51]. First, we analyzed the expression of 37 candidate genes in CD34+ HSPCs. For most of the analyzed genes we observed only minor expression differences (Supplementary Fig. S1).
However, EED, a core member of PRC2 and SIRT4, an NAD-dependent ADP-ribosylase, were strongly and consistently increased in G-CSF-mobilized PB and BM of adults as compared to newborns (Supplementary Fig. S1). Since it is known that PRC2 plays an important role in hematopoiesis and expression of PRC2 members is often disturbed in hematopoietic malignancies, we decided to investigate the expression of EED and other members of PRC2 in more detail.
To verify the initial observations, EED expression levels were analyzed in CD34+ HSPCs isolated from CB (n=9) and G-CSF-mobilized PB (n=17, average age: 40 years). mRNA levels of EED were strongly increased in HSPC from adults compared to newborns thus confirming the initial screening experiment (Fig. 1A). A similar increase of EED was also observed in CD34+ cells from BM (n=5, average age: 37 years), thereby demonstrating that the increase was not restricted to G-CSF-treated HSPCs (Fig. 1A). In fact, analysis of MNC samples from PB (average age: 39.8 years) before and after treatment with G-CSF revealed an inhibitory effect of G-CSF on the EED expression (Supplementary Fig. S3C).

Expression changes of PRC2 members in HSPCs and MNCs from newborns and adults. Transcript levels were measured by TaqMan gene expression assays and normalized to GAPDH.
Analysis of the two other PRC2 core components showed that in case of EZH2, transcript levels were moderately upregulated, while those of SUZ12 were decreased in mobilized CD34+ HSPCs (Fig. 1A). The significant decrease of SUZ12 seems to be, at least partly, due to the mobilization of HSPCs, since SUZ12 levels decreased considerably following the G-CSF treatment (Supplementary Fig. S3C). Importantly, a similar decrease of SUZ12 expression was not seen in untreated HSPC from BM.
Since CD34+ cells provide a heterogenic pool of different progenitor cells that can be separated by combinations of cell surface markers (Fig. 1B) [38,39], we decided to analyze EED expression in defined HSPC subfractions, next. To this end, we purified three different fractions of HSPCs from CD34+ samples from neonatal (CB, n=4) and adult (BM, n=3) sources, that is, HSCs/MPPs (CD34+CD133+CD45RA−CD90+), LM progenitors (CD34+CD133+CD45RA+), and EM progenitors (CD34+CD133lowCD45RA−) (Fig. 1C) [38 –40]. EED was found to be expressed at similar levels in adult and neonatal HSCs/MPPs. In contrast, significantly higher EED expression rates were detected in adult LM and EM progenitors, thus suggesting that EED becomes specifically upregulated during lineage commitment in adult, but not in neonate HPCs (Fig. 1C and Supplementary Fig. S2).
Next, we compared the EED expression in CB- (n=13), PB- (n=16, average age: 39.9 years) and BM-derived MNCs (n=3, average age: 36.7 years). This revealed a less pronounced but still highly significant increase of EED in MNCs from adults compared to newborns (Fig. 1D). However, it has to be noted that MNCs are a rather heterogeneous cell population and it cannot be excluded that shifts in frequencies of subpopulations contribute to these differences. However, the observed elevated EED expression in HPCs and MNCs in adults underlines the general relevance of this factor for adult hematopoiesis.
To further explore if the increase in EED expression is sustained in an aged population, we next compared EED levels in MNCs from elderly donors (n=12, average age: 74 years) to those of middle-aged donors (n=19, average age: 39.4 years) and CB (n=13). Importantly, EED expression levels were not only higher in a substantial proportion of elderly donors, but were also more scattered in older individuals, which is in line with a described stronger epigenetic heterogeneity during aging (Fig. 1E) [12].
EED-associated changes in H3K27me3 levels
As PRC2 is responsible for trimethylation of histone H3K27, we were interested to see if the observed increase in EED expression in adult cells was associated with higher levels of H3K27me3. To address this question globally, we decided to first measure H3K27me3 levels through ELISA. Notably, recent studies indicate that overall histone levels are reduced not only in aged yeast but also in senescent human fibroblasts [52,53]. To exclude that a putative loss of core histones interferes with our analysis, we first implemented an FPLC-based purification step for histone H3. Subsequently, equal amounts of FPLC-purified histone H3 were subjected to an H3K27me3-specific ELISA. As shown in Fig. 2B, the overall level of H3K27me3 indeed increased significantly in MNCs from newborns to adults (Fig. 2B). Due to limited sample material, we could not perform the ELISA on purified histone H3 from HSPCs. Therefore, we switched to more efficient ChIP assays to analyze H3K27me3 in HSPCs. This had the advantage that not only the global H3K27me3 levels but also their distribution over the genomic regions could be analyzed.
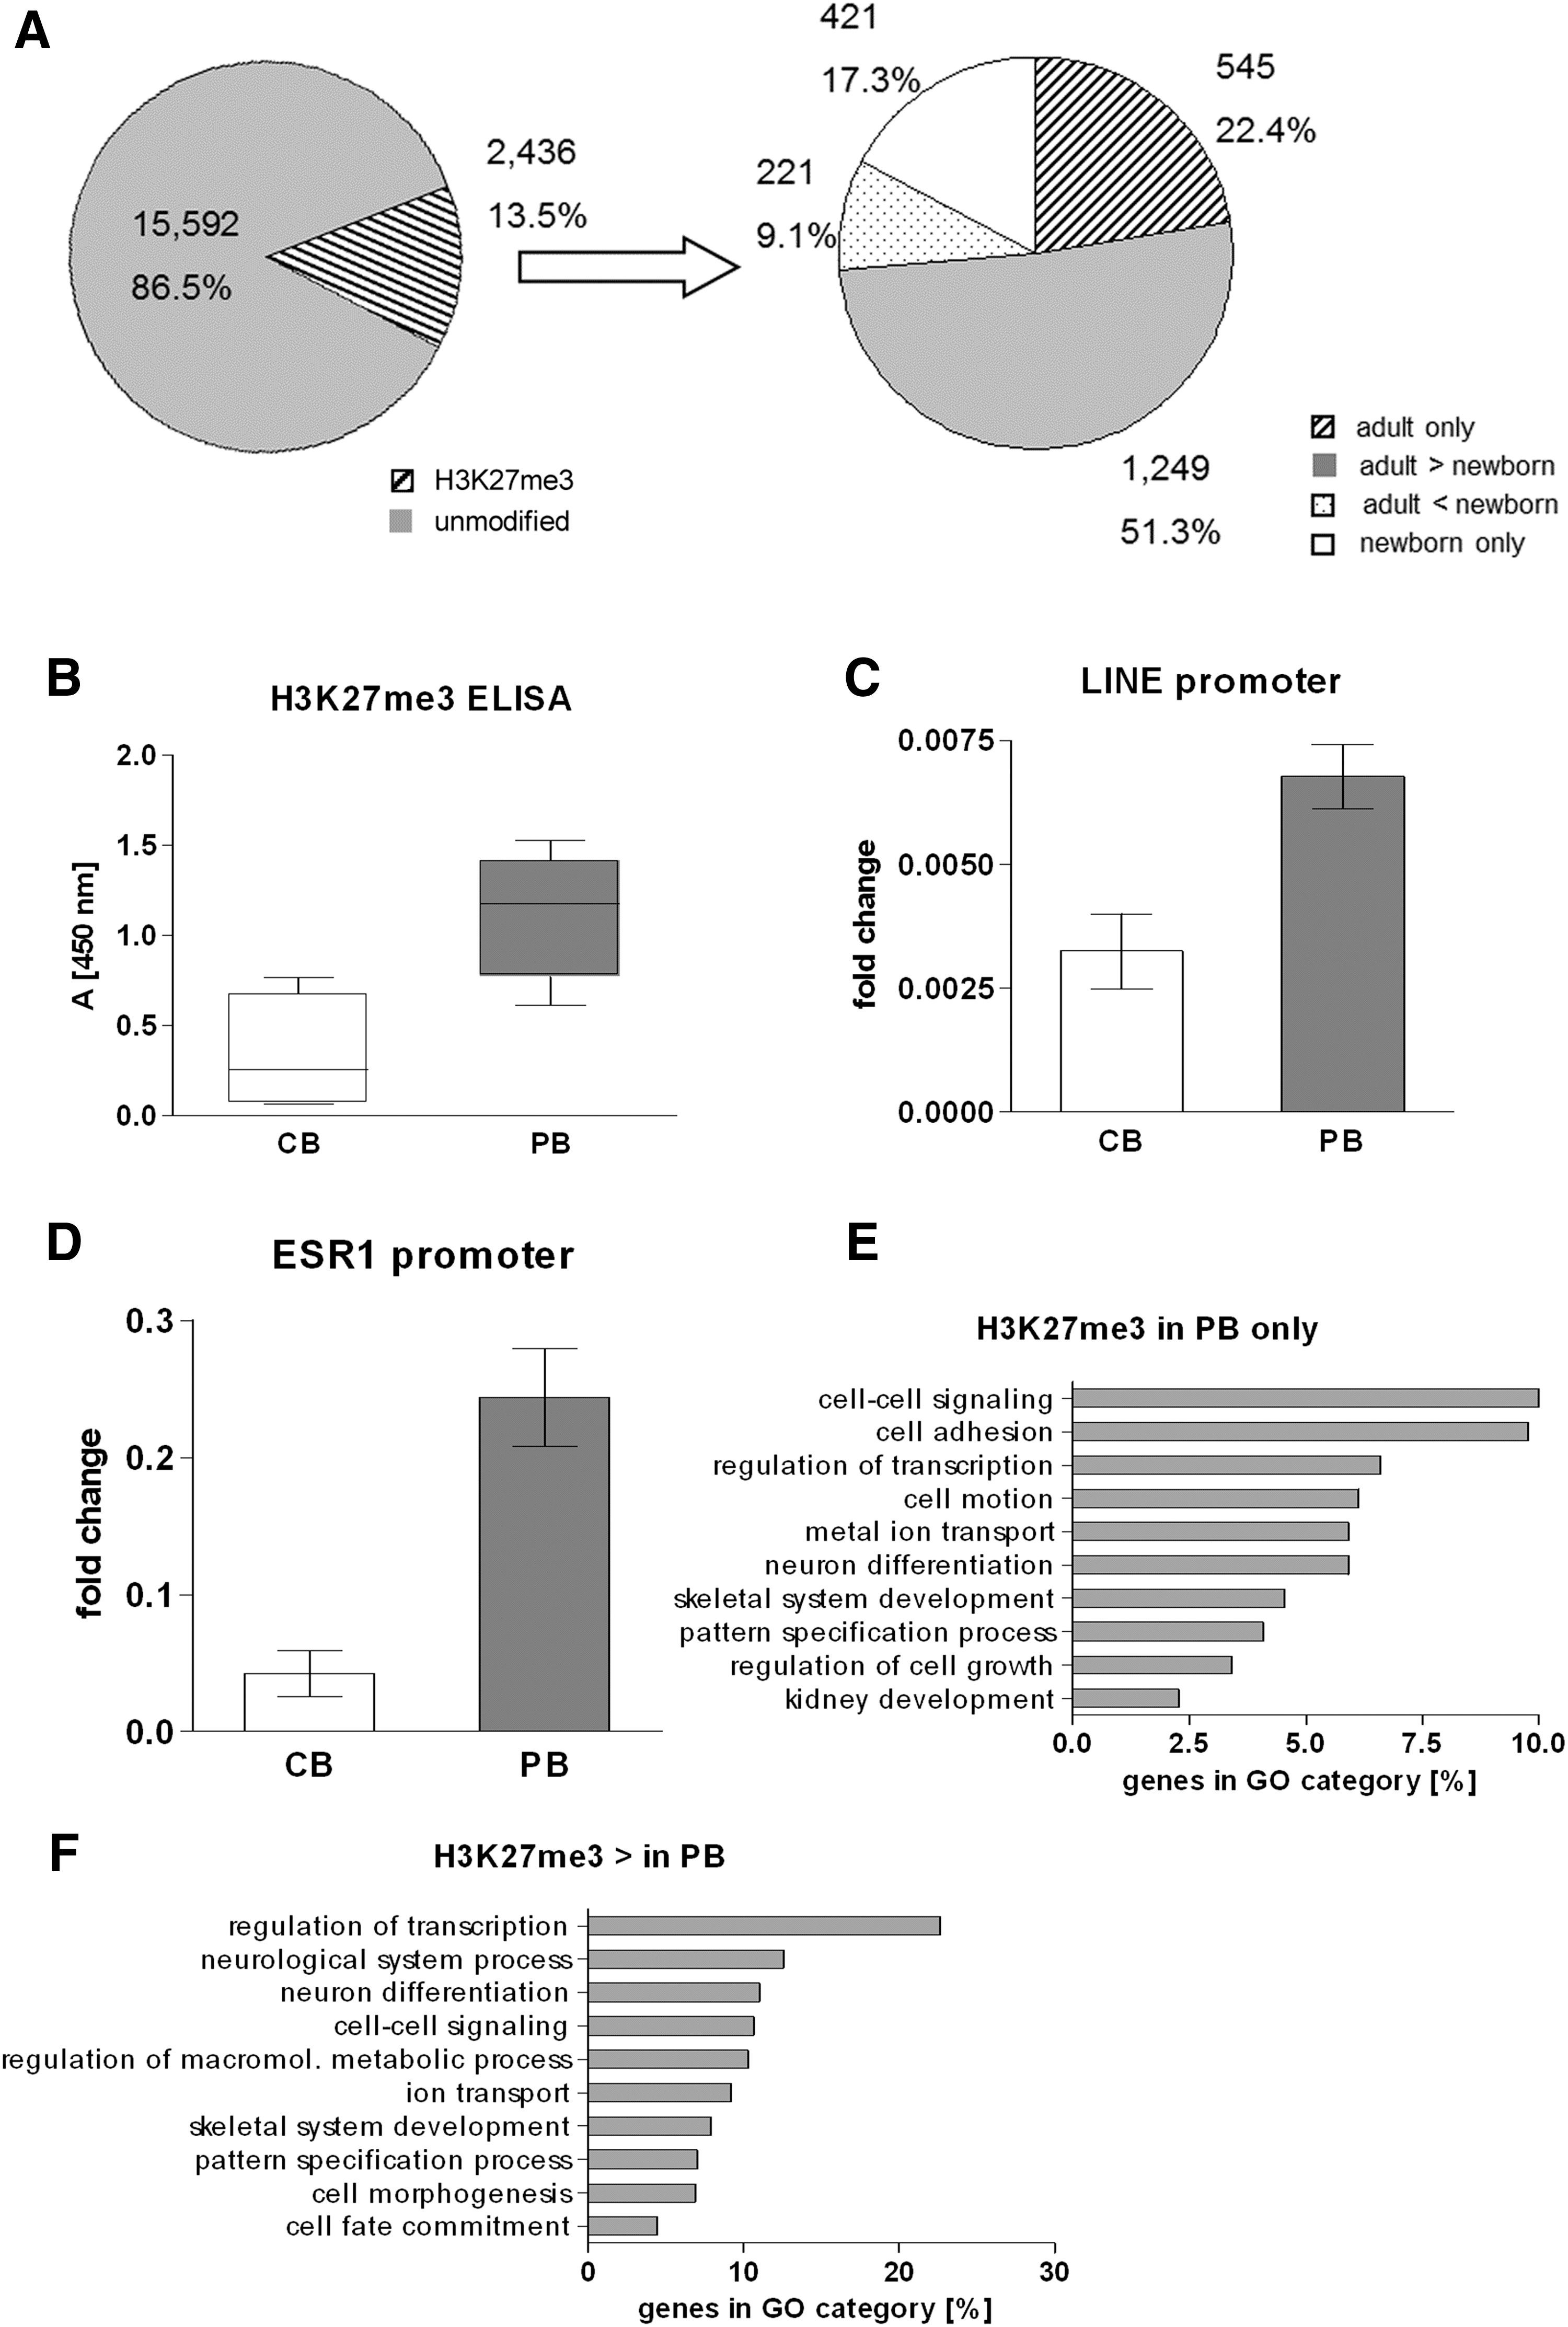
Hematopoietic cells of adults have higher H3K27me3 levels than those of newborns.
It is well known that the H3K27me3 modification is frequently found on repetitive elements such as LINE elements [54]. We thus asked, if the increase in H3K27me3 was mainly due to chromatin modifications occurring at repetitive elements or if known PRC2 target genes were also affected. Therefore, we performed a ChIP assay using purified CD34+ HSPCs from newborns and adults (46 years). Similar to the ELISA, analysis of the LINE promoter revealed a substantial increase in H3K27me3 levels at repetitive elements (Fig. 2C). Additionally, a strong increase of H3K27me3 levels at the promoter of the estrogen receptor (ESR1), a known PRC2 target gene [55], was observed (Fig. 2D). These results gave a first indication that not only repetitive elements but also gene regions are affected by the observed increase of H3K27me3 levels in HSPCs from adults.
Quantitative and qualitative changes of H3K27me3 occupancy in HSPC from newborns and adults
To investigate H3K27me3 changes on a genome-wide scale, we performed ChIP-on-chip analyses with NimbleGen 385k RefSeq promoter tiling arrays, covering 24,659 human promoters. To get highly enriched and consistent populations of HSPCs from newborns and adults, magnetically purified CD34+ cells were further enriched by flow cytometric cell sorting for expression of CD34 and lack of typical cell surface markers for the different hematopoietic lineages (Lin−) (Supplementary Table S2), resulting in a purity of >99% CD34+Lin− HSPC. ChIP-on-chip experiments were performed with pooled HSPCs from nine newborns and five adults (34–54 years, average age: 43.6 years), respectively.
In adults as well as in newborns, H3K27me3 covered only a minor fraction (ca. 13.0%) of all analyzed promoters (Fig. 2A, Supplementary Tables S3 and S4), which is within the range of previous studies analyzing H3K27me3 promoter occupancy in hematopoietic progenitor cells [56]. To confirm that we really precipitated PRC2 targets, we compared our data with a panel of PRC2 target genes defined in 2006 by Lee et al. in human embryonic stem cells [57]. Seven hundred eighty out of the 1,893 genes (41%) described by Lee et al. were associated with H3K27me3 in at least one of our sample groups (Supplementary Table S5). This is a high overlap of target genes, considering the fact that different cell types were analyzed with different methods.
As expected from the ELISA and ChIP data, H3K27me3 was enriched in HSPCs from adults compared to those of newborns, with 22.4% of all modified promoters associated with the repressive histone mark only in adults and 17.3% only in newborns (Fig. 2A). Additionally, 85% of those promoters, which were associated with H3K27me3 in both samples had a clear predominance of the repressive mark in adults, strengthening the observation of a general increase in H3K27me3 in adult samples (Fig. 2A). In embryonic stem cells, the repressive H3K27me3 histone mark is frequently found in combination with the active H3K4me3 modification, thus defining bivalent genes marked for later lineage-specific expression [56,58]. Global analyses of H3K4me3 occupancy did not reveal significant changes in the amount of bivalent promoters between HSPCs from newborns and adults (Supplementary Tables S3 and S6 and data not shown).
We next performed gene ontology analyses to determine functional categories specifically affected by the age-associated increase of H3K27me3. In the adult samples several gene categories that are associated with general functions of the cell such as transcription, cell–cell signaling, or ion transport were stronger associated with the repressive histone mark. More interestingly, H3K27me3 was enriched on genes involved in nonhematopoietic developmental pathways (Fig. 2E, F). Notably, in adult HSPCs the activating mark H3K4me3 was predominantly found on promoters involved in hematopoietic development (data not shown).
Altogether, our data indicate a general increase of H3K27me3 between HSPCs from newborns and adults. This also comprises a qualitative shift of functional categories being governed by this histone modification.
Histone modification changes are associated with expression changes of key hematopoietic transcription factors
To analyze if the observed changes in histone modifications between HSPCs from newborns and adults correlated with gene expression, we analyzed the transcription levels of several hematopoietic transcription factors (Fig. 3A). Importantly, with the exception of RUNX1, expression changes correlated well with histone modification changes (Fig. 3B, C and Supplementary Fig. S4). Interestingly, the expression of LEF1, which is important for lymphopoiesis [59], was downregulated in HSPCs from adults, which was accompanied by an increase of the repressive histone mark H3K27me3 at its promoter, while PML, a transcription factor characteristic for myelopoiesis [60] was upregulated, correlating with an increase in H3K4me3. Additionally, the expression of HOXA9 and HOXB4, which are both important for HSC maintenance and proliferation [61,62], increased in HSPCs from adults, accompanied in both cases by an increase in H3K4me3.
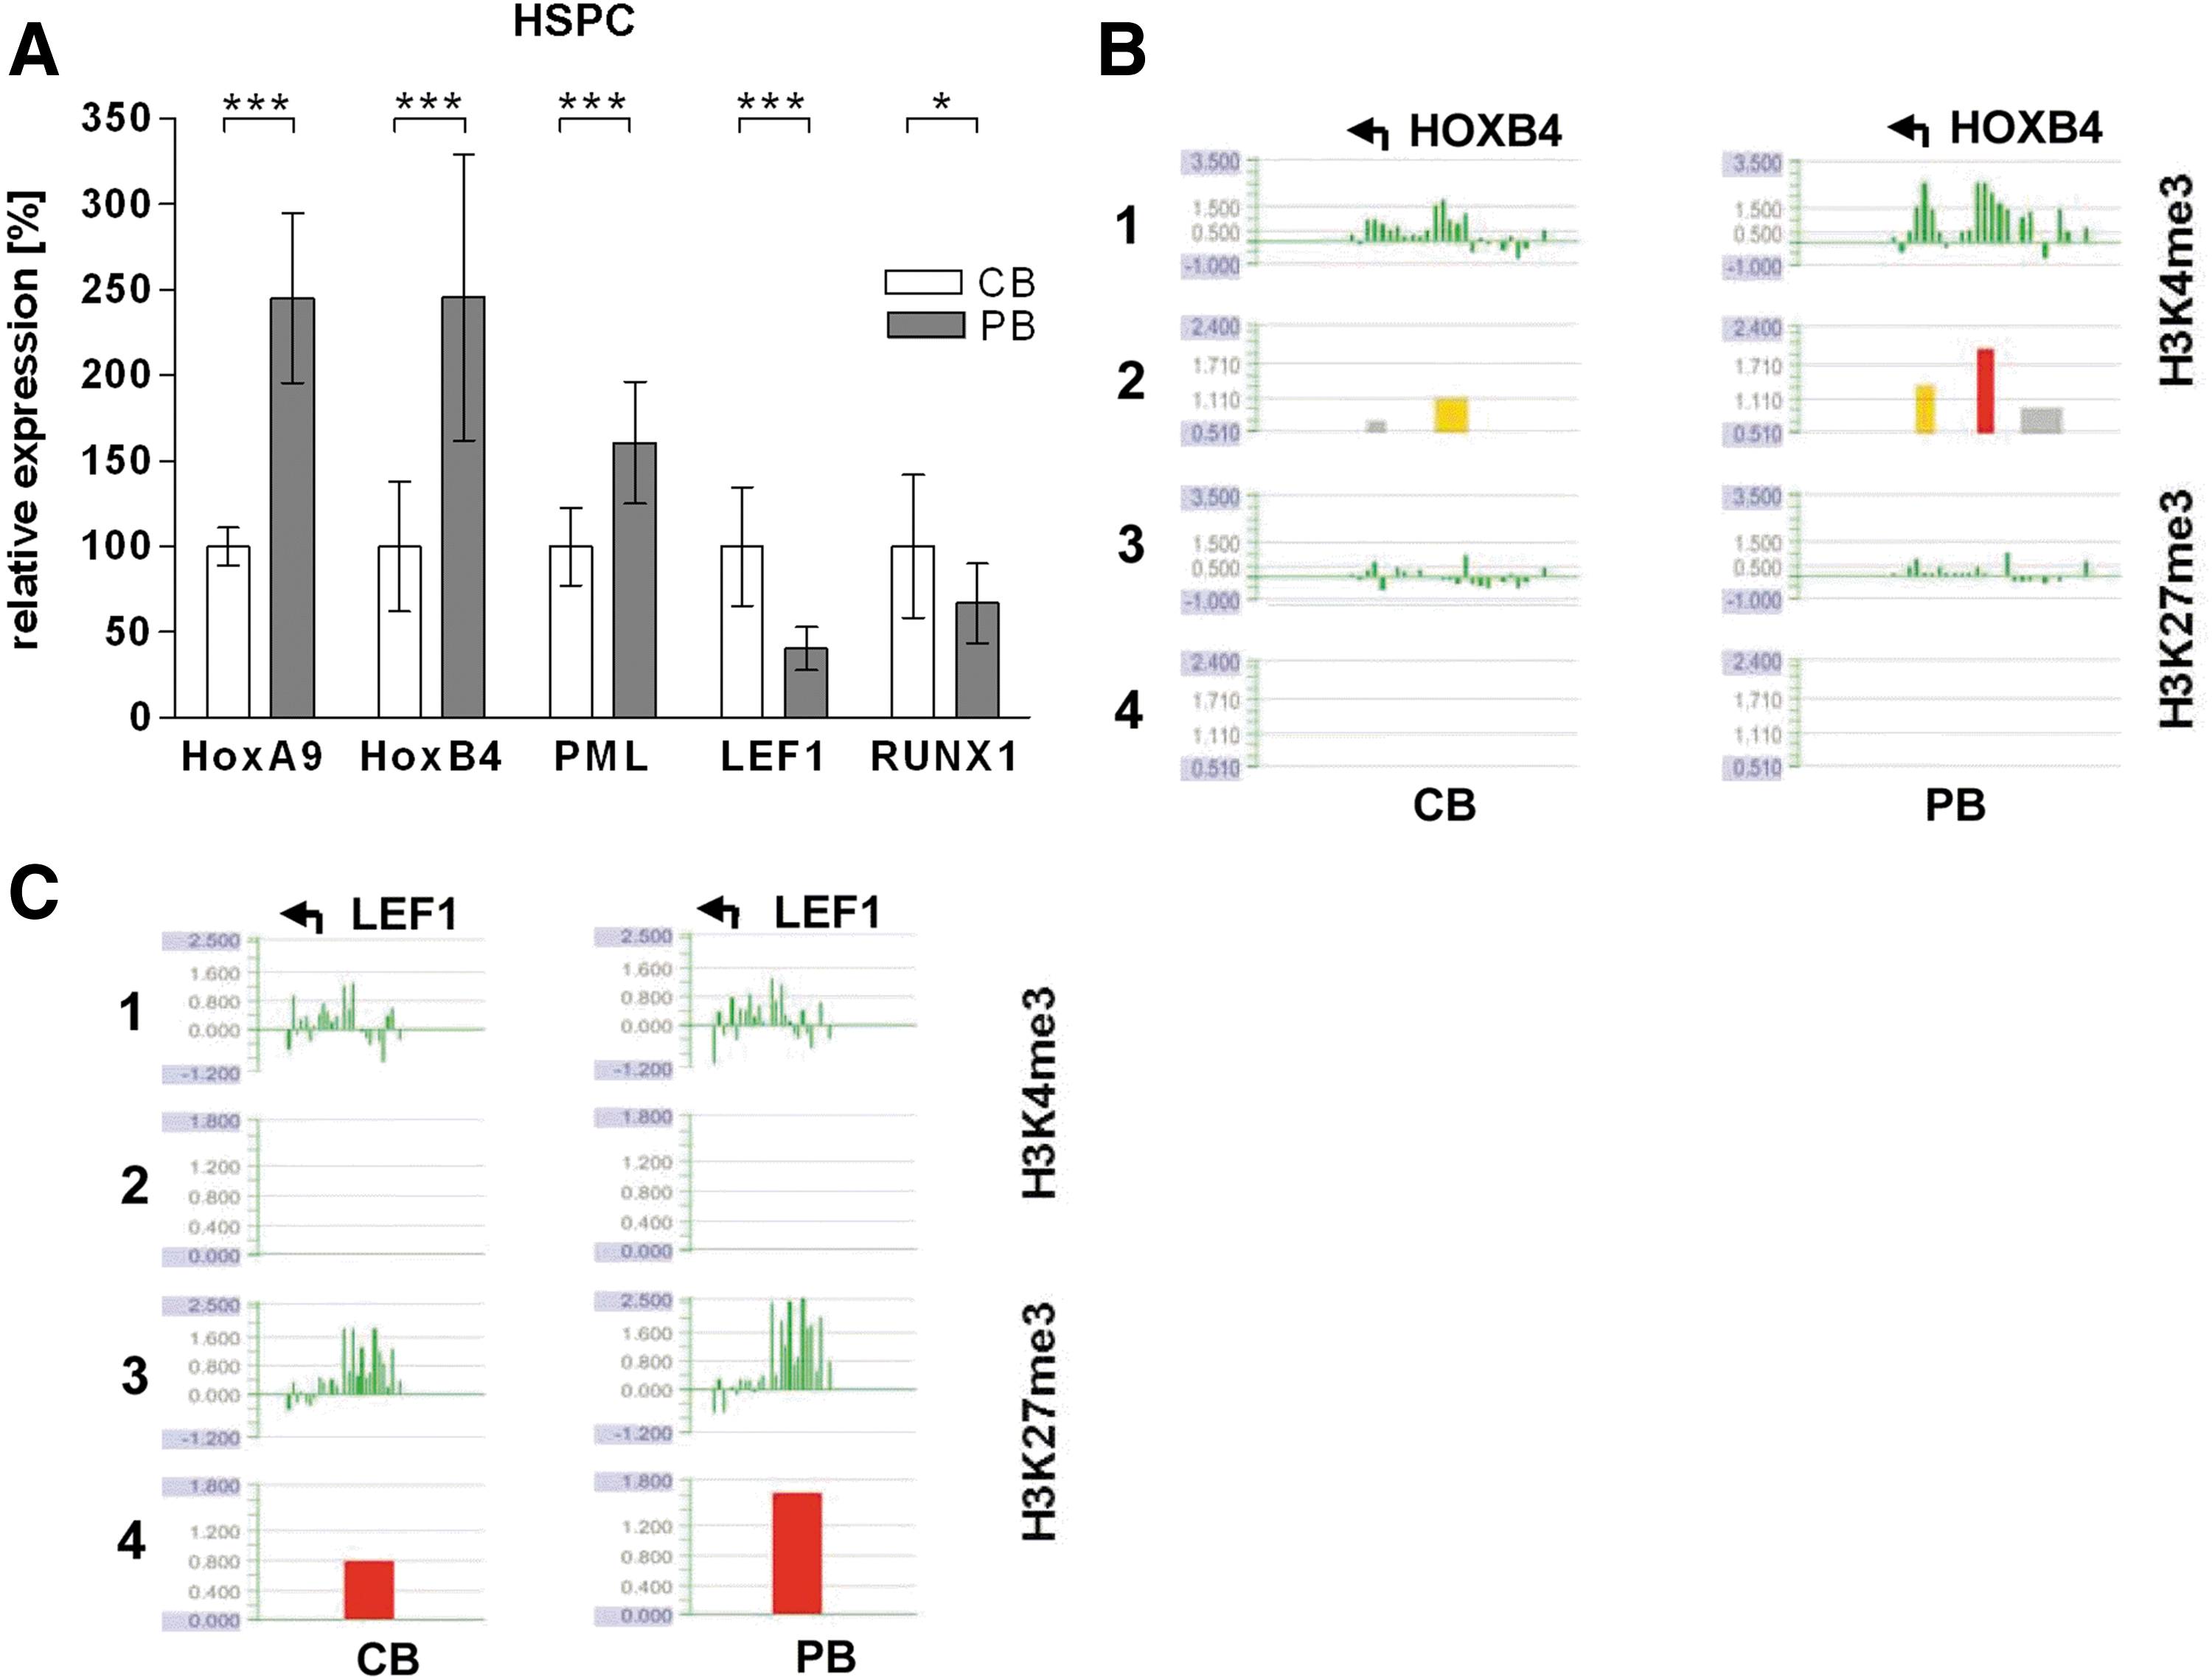
H3K27me3 influences the expression of key hematopoietic transcription factors.
EED overexpression negatively affects the potential of HSPCs to differentiate along the lymphoid lineage
To establish a direct functional link between the EED increase and the increase of H3K27me3 levels in adult hematopoietic cells, EED was stably overexpressed in the T cell line Jurkat. Overexpression of EED in Jurkat cells did not affect their growth behavior. However, upon overexpression in HSPCs, it strongly reduced their proliferation (data not shown). In Jurkat cells, EED expression was considerably increased on RNA as well as protein level, while EZH2 and SUZ12 levels did not change (Fig. 4A, B). Importantly, the ratio of H3K27me3 to total histone H3 increased in cells overexpressing EED (Fig. 4B), which indicates that elevated EED levels are sufficient to increase the levels of the repressive histone mark.

EED overexpression correlates with increased H3K27me3 levels in Jurkat cells. Jurkat cells were stably transfected with the EED vector (gray bars) or an empty control vector (white bars).
In Jurkat cells this effect was only moderate. This made the system suitable for use in the more sensitive primary HSPCs, which were strongly inhibited in their growth behavior by higher EED overexpression, but tolerated moderate overexpression levels (data not shown).
Having established that EED overexpression indeed leads to increased levels of H3K27me3, we next investigated whether elevated EED levels interfere with hematopoietic differentiation. Therefore, HSPCs isolated from CB were transduced either with an empty control vector or with a vector for EED overexpression. One week after transduction, EED-overexpressing cells were isolated by means of their concomitant expression of the eGFP reporter and submitted to diverging differentiation protocols.
To analyze the influence of EED on myelopoiesis, we performed CFC assays while its influence on lymphopoiesis was monitored by differentiating HSPCs into NK cells [45,46]. Notably, we did not detect any EED-dependent changes in myelopoiesis in terms of colony number or frequency (Supplementary Fig. S5A, B). Here it has to be considered that many of the transduced cells consistently lost eGFP-expression in culture, although they were initially sorted for eGFP expression. This might be due to technical reasons, such as transgene silencing during differentiation or difficulties of gating very low eGFP-positive cells in flow cytometry (Supplementary Fig. S5C) [63]. As the classical readout for CFC assays is based on light microscopy, which does not distinguish between eGFP-positive and -negative colonies, it cannot be excluded that this obscures a potentially promoting effect of EED on myelopoiesis.
Lymphoid differentiation was assessed by differentiating EED-transduced cells into NK cells. EGFP-positive and thus EED-overexpressing cells were sorted 1 week after transfection and differentiated as described previously [45,46]. Flow cytometric analysis at the end of the differentiation was based on the eGFP-positive population and showed that lymphoid differentiation was considerably inhibited by EED overexpression. First, the growth rate of cells overexpressing EED was severely reduced under lymphoid, that is, NK cell promoting conditions. Second, the cell surface marker pattern observed on differentiating cells overexpressing EED was strikingly different to that of control cells. After 6 weeks only 27% of EED-transduced cells expressed the NK cell marker CD56 compared to almost 90% of control cells (Fig. 5A, E). Instead, EED-transduced cells contained comparatively large fractions of cells expressing the myeloid marker CD14 (22.6%) (Fig. 5A, F). The occurrence of the CD14+ subset could be verified on mRNA level by real-time reverse transcription PCR (RT PCR) (Fig. 5D).
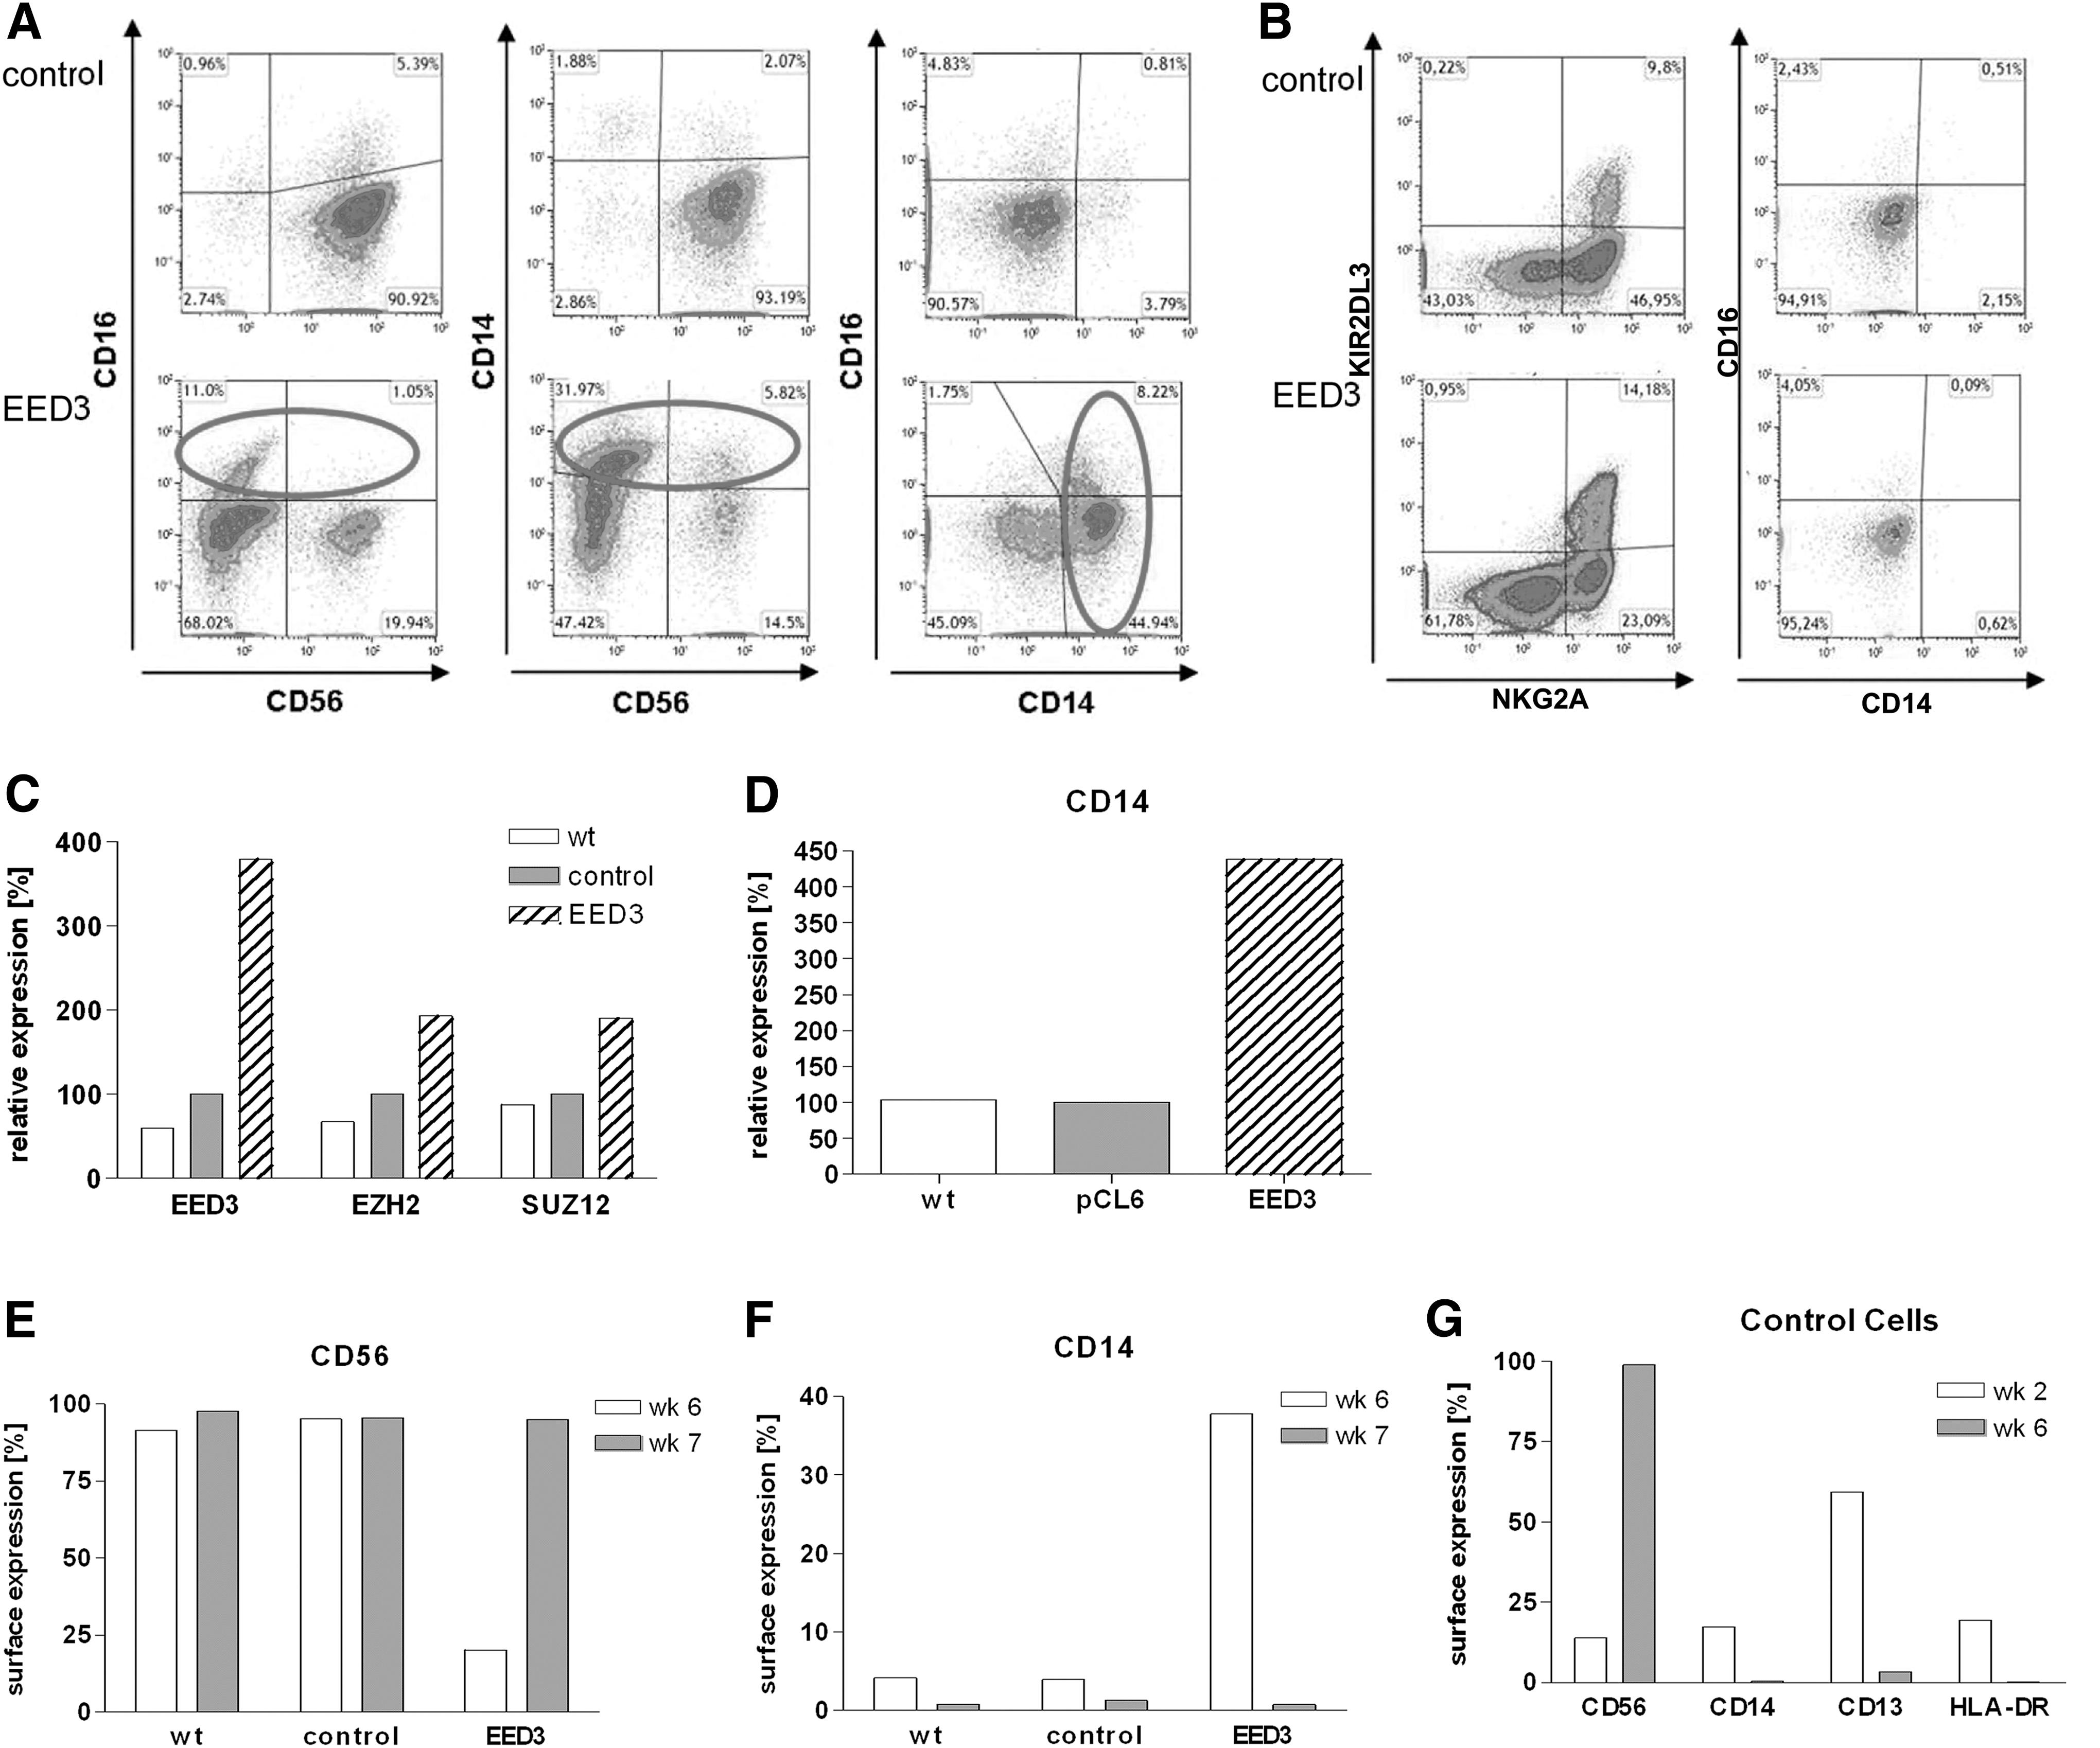
Differentiation of CD34+/Lin− HSPCs into Natural Killer (NK) cells. CD34+/Lin− HSPCs were isolated from CB and transduced with either the empty control vector or the EED-overexpression vector, and differentiated into NK cells. Transduced cells were flow cytometrically enriched for eGFP expression after 2 weeks and at the end of the differentiation period to ensure that expression analyses were only performed on cells that indeed overexpress EED.
CD34+ HSPCs transduced with the empty vector expressed myeloid markers at the beginning of the NK cell differentiation process (week 2), when only a minor fraction (14%) was positive for CD56. However, these markers vanished during prolonged differentiation (6 weeks), when the stage of mature NK cells was reached (Fig. 5G). Notably, after 1 additional week of culture, EED-overexpressing cells finally developed into mature NK cells expressing characteristic markers such as NKG2A and KIR2DL3 (Fig. 5B), suggesting that lymphopoiesis was decelerated, but not irreversibly blocked by EED overexpression.
Interestingly, in contrast to Jurkat cells, not only EED expression but also expression of all three core PRC2 members was increased in EED-overexpressing in vitro-generated NK cells (Fig. 5C).
Discussion
In our study, we reveal an increase of the PRC2 member EED in adult human progenitors of both the LM and EM differentiation lineages and MNCs from adults compared to those of newborns. This increase continues, at least in MNCs, until higher ages (up to 87 years) and is accompanied by an increase in heterogeneity of expression levels. Importantly, the increased EED expression could be tightly linked to a genome-wide increase in the corresponding histone modification H3K27me3 by direct analysis of H3K27me3 levels ex vivo as well as experimentally by the overexpression of EED in lymphocytes and hematopoietic progenitor cells. Interestingly, expression changes of the other two core PRC2 components, EZH2 and SUZ12, did not follow those of EED, which suggests that the increase of EED alone is sufficient to globally increase H3K27me3 levels. Of note, the expression of JMJD3 and UTX, two factors that are known to demethylate H3K27 [64], followed opposing trends (Supplementary Fig. S3A, B).
Our data demonstrate that EED expression is higher in HPCs from adults compared to those of CB and unchanged in HSCs/MPPs. These findings are in contrast to a recent study by Beerman et al., which showed that the expression of PRC2 members in murine HSCs is downregulated [17] during proliferative aging. While we compared HSPCs from the different sources CB and adult PB or BM, Beerman et al. investigated HSCs from young and old mice. In fact, preliminary data from our laboratory indicate that MNCs from children express higher levels of EED than both MNCs from CB and adults, thus corroborating the findings of Beerman et al.
Investigation of the genome-wide distribution of H3K27me3 in HSPCs from newborns and adults by ChIP-on-chip analyses showed that in HSPCs from adults more loci are covered with H3K27me3 than in HSPCs from CB. Additionally, we observed a functional change of gene categories associated with H3K27me3. In the adult samples, H3K27me3 was predominantly enriched at genes connected to the development or differentiation pathways of cell types not involved in hematopoiesis. This might reflect an increasing need in adult HSPCs for silencing of nonhematopoietic pathways through H3K27me3. In this context it is noteworthy that whereas the repressive histone mark H3K27me3 increases globally from CB HSPCs to adult HSPCs, several studies have demonstrated an age-associated reduction of DNAm levels at the majority of gene loci [65,66]. Notably, although DNAm and H3K27me3 are mutually exclusive at numerous promoters under steady-state conditions, experimental inhibition of the DNAm machinery results in an efficient silencing of formerly DNA methylated genes through Polycomb-mediated trimethylation of H3K27 [55,67,68]. Based on these observations it could be hypothesized that increasing levels of H3K27me3 fulfill an important compensatory function on genes that lose DNAm by keeping them repressed. In this model, aberrant derepression of genes involved in nonhematopoietic differentiation processes due to loss of DNAm would be counteracted by increased H3K27me3 occupancy, which would help to preserve the stem cell characteristics of HSPCs (Fig. 6).
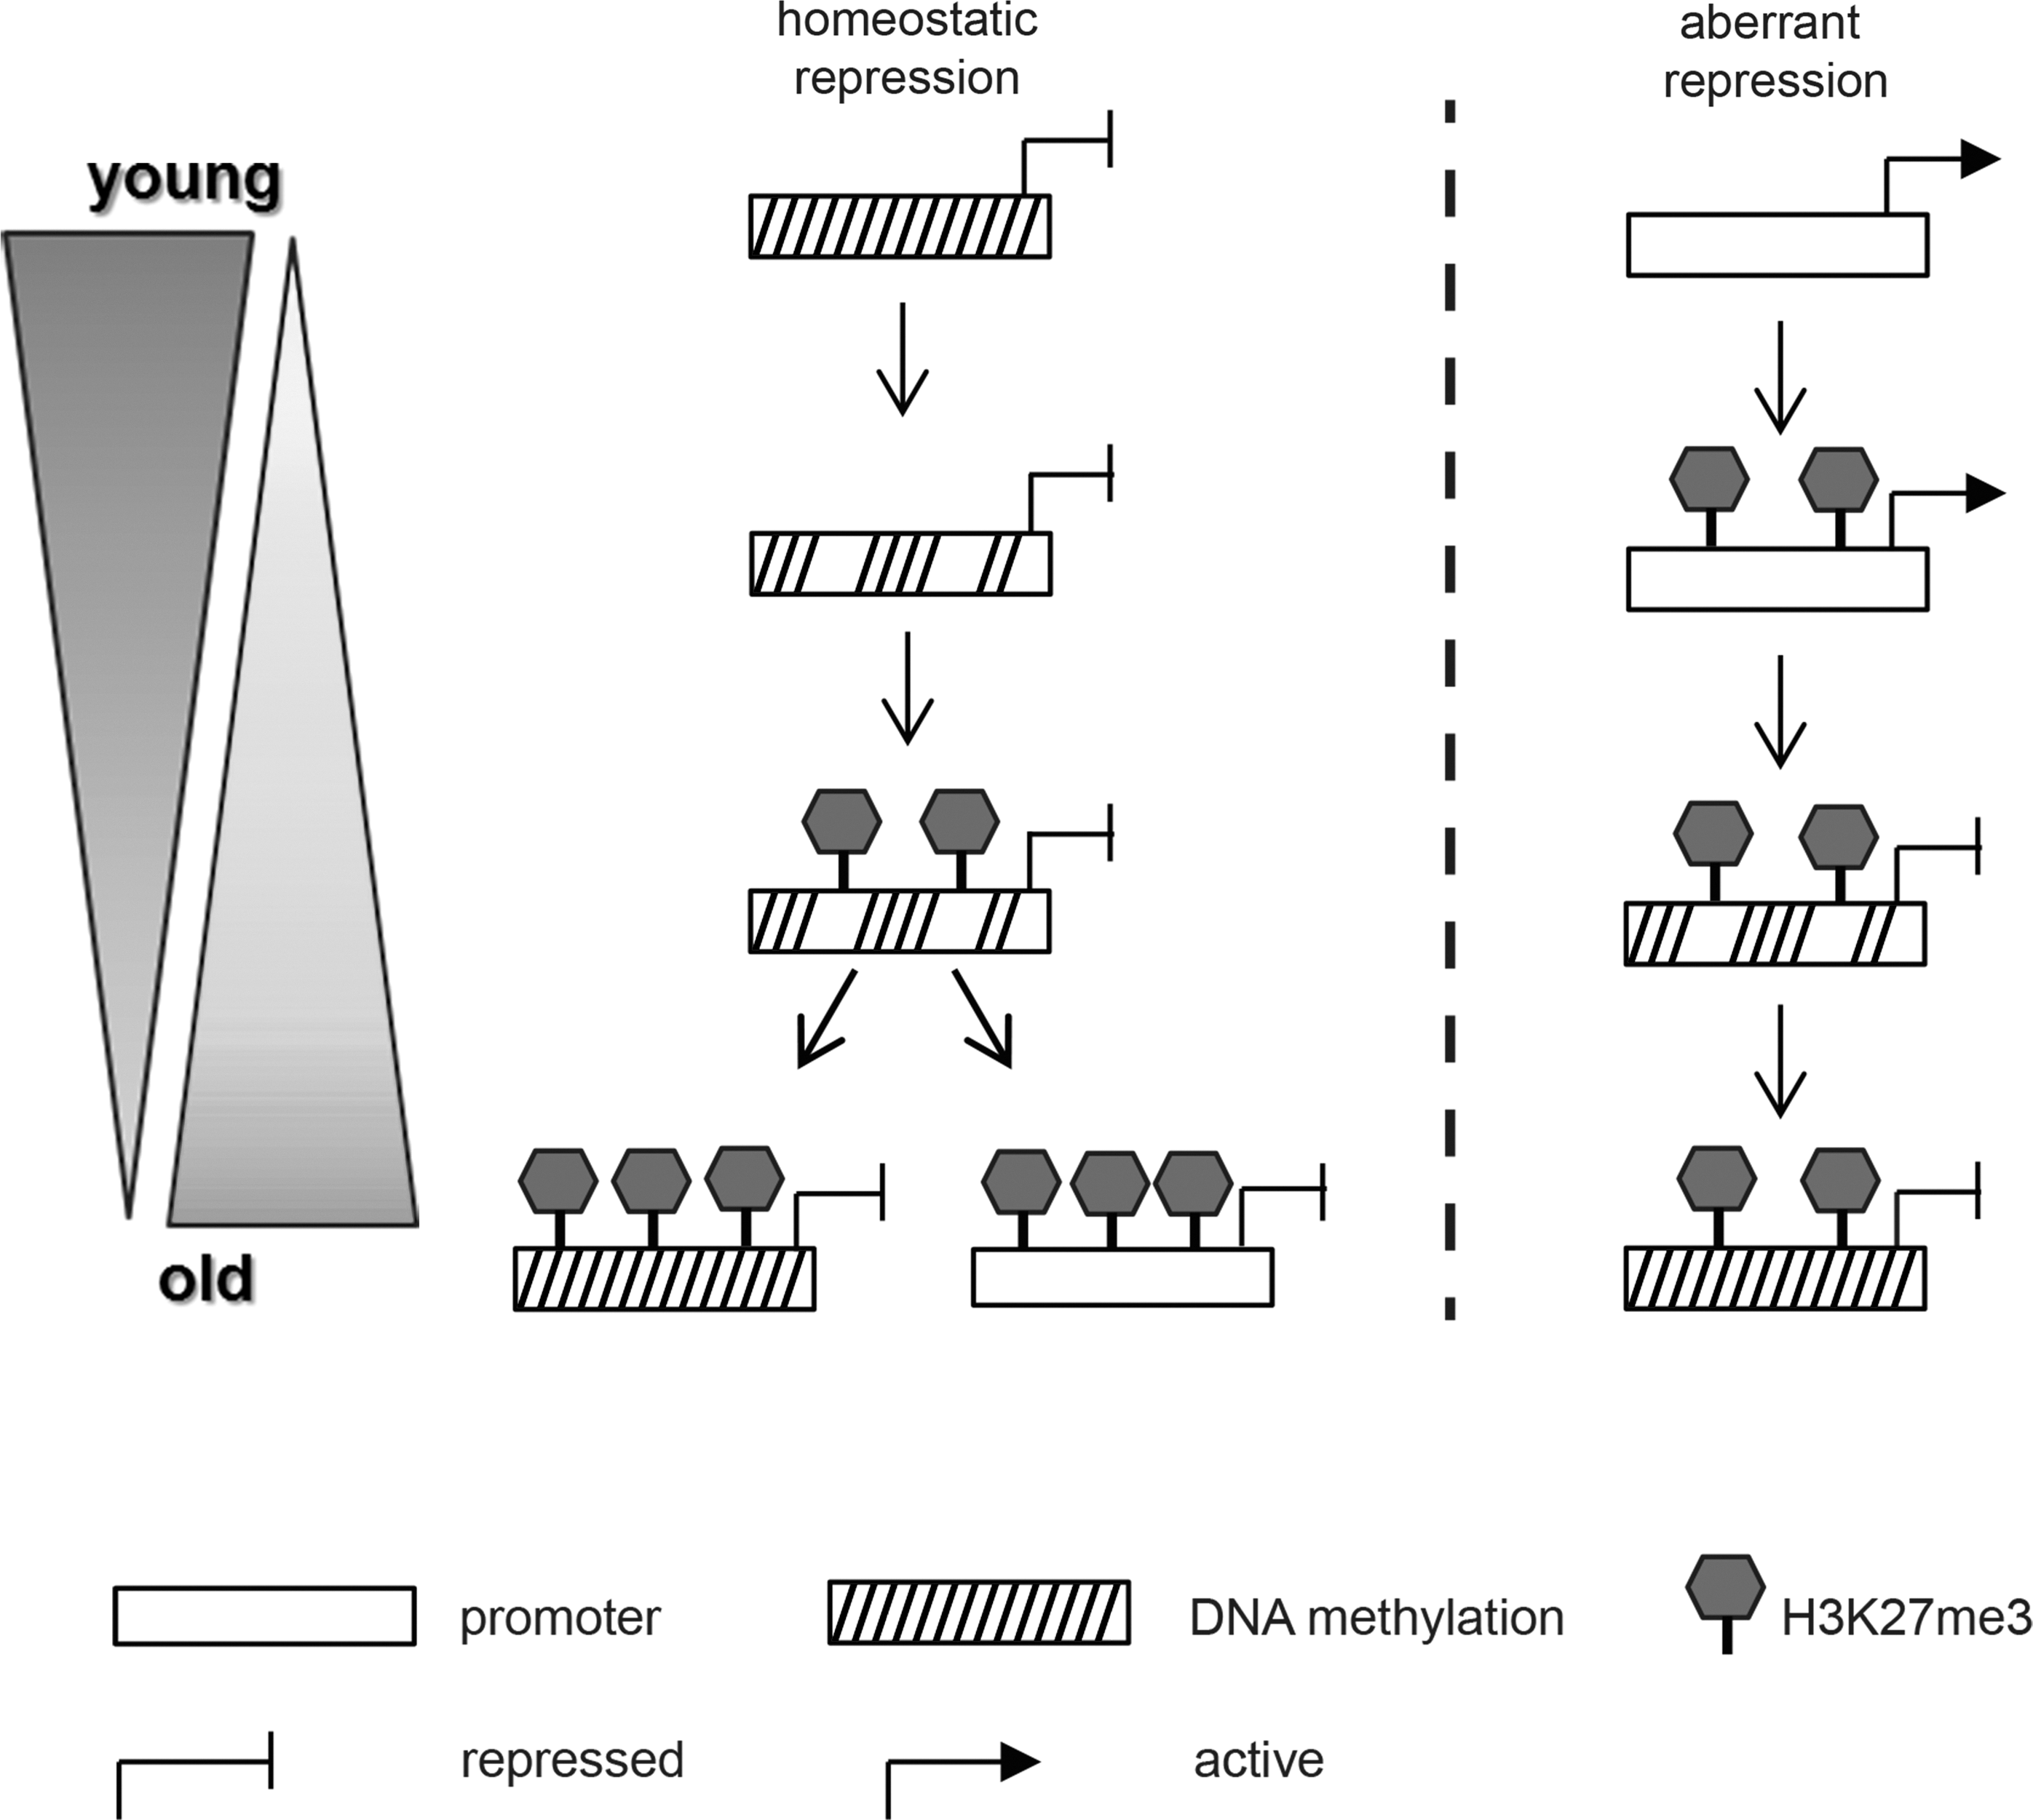
Schematic view of possible interactions between Polycomb-mediated gene silencing and DNAm. When DNAm decreases globally, as is observed, for example, during aging, formerly repressed genes become activated. Concomitantly however, Polycomb-mediated H3K27me3 increases and is able to compensate for the loss of DNAm, thus sustaining the repressed state (left panel). Although increased Polycomb action may prevent aberrant expression of normally silenced genes, it may also have detrimental effects, when aberrantly silencing genes that are expressed in young individuals such as tumor suppressors (right panel). Additionally, recruitment of DNA methyltransferases through Polycomb Factors may reinforce the silent state independently of the former DNAm status. DNAm, DNA methylation.
PRC2 activity not only ensures the repression of aberrantly DNA-demethylated genes but also has the potential to directly recruit the DNAm machinery toward its target genes [69]. It is thus likely that an increase of H3K27me3 in HSPCs from adults ultimately results in an increase of DNAm at specific PRC2 targets. Indeed, a recent study showed that genes known to be PRC2 targets in embryonic stem cells are much more likely to become DNA-hypermethylated with age and during carcinogenesis than non-PRC2 target genes. Interestingly, in our data set 93.5% of the investigated age-related PRC2 targets indeed exhibited an increase of H3K27me3 in HSPCs from adults compared to those of CB (Supplementary Fig. S6). Although we have not assessed the DNAm status of these genes, these data support a close connection between the H3K27me3 mark and DNA hypermethylation and ultimately suggest that elevated H3K27me3 levels could facilitate aberrant DNAm of tumor suppressor genes thereby promoting the development of cancer [70] (Fig. 6 right panel).
Our investigation of the expression of key hematopoietic transcription factors in the context of the respective histone modification pattern revealed some parallels to the described age-associated myeloid bias of murine and human HSCs [5,7 –9,11]. While LEF1 expression, which is important for lymphopoiesis [59], was reduced in HSPCs from adults, the expression of PML, a myelopoietic transcription factor [60], increased in these cells. These divergent expression changes correlated well with the underlying epigenetic structures and the fact that age-associated EED overexpression was most pronounced in the LM progenitor fraction. Additionally, they corroborate observations made in murine HSCs which suggest that lymphoid genes are predominantly downregulated during aging while myeloid genes are upregulated [4].
Another hallmark of hematopoietic aging is the gradual increase of the stem cell pool [9,11,71]. Concerning this, we observed in adult HSPCs an upregulation of two members of the HOX gene family, namely HOXA9 and HOXB4, which are both associated with stem cell proliferation. The changes in their expression levels described here correlated with an increase of the activating histone modification mark H3K4me3. Interestingly, HOXA9 has also been associated with the development of acute myeloid leukemia, a hematopoietic cancer with increasing incidence in older subjects [72,73]. Taken together, our data suggest a link between the increase in EED expression, H3K27me3 levels, and changes in the expression of several transcription factors, which could promote a myeloid bias in hematopoiesis and an expansion of the stem cell pool.
The direct functional consequences of the relatively high levels of EED in HPCs from adults are not fully resolved yet. Previous studies demonstrated that Ezh2 overexpression prevented murine HSPC exhaustion during serial transplantation and senescence of high-passage MEFs [74], suggesting that the enhanced expression of PRC2 members is connected to a prolonged healthy and functional lifespan of HSPCs. However, other studies indicate that overexpression of Ezh2 in murine HSC can result in myeloproliferative disorders [75]. Together with the observation that a tight Polycomb equilibrium is essential for normal embryonic stem cell development [76], these results suggest, that moderate upregulation of Polycomb action might protect HPC function in older donors, but at the cost of a higher risk for malignant transformation due to aberrant silencing of tumor suppressor genes.
Until now the effects of EED overexpression on the differentiation potential of HSPCs have not been directly investigated. Therefore, we analyzed the in vitro differentiation potential of human HSPCs overexpressing EED. HSPCs reacted very sensitive to an artificial elevation of EED expression, for example, by slowing down their growth rate. This demonstrates that an elaborated Polycomb equilibrium is essential for proper cell growth. To cope with this problem, we worked throughout our study with a system of only moderate EED overexpression.
EED-overexpressing HSPCs did not show any significant changes in their differentiation potential toward the myeloid lineage. In contrast, EED shifted the in vitro development of NK cells toward myeloid stages. Expression of the myeloid surface marker CD14 was prominent in EED-overexpressing progenitors at comparatively late stages of differentiation, when control cultures had already progressed to the stage of mature NK cells. Importantly, EED-overexpressing progenitors were still able to differentiate into NK cells.
The pronounced occurrence of myeloid cells in the lymphoid differentiation setup reflects the in vivo observations that myelopoiesis increases during aging while lymphopoiesis is impaired. Overall, our data indicate that the epigenetic equilibrium is more tightly kept in HPCs from CB than in those from adults. It seems that in HPCs from CBs the epigenetic landscape is in an ideal shape providing an optimal potential for all differentiation pathways. In adults, however, the epigenetic landscape is profoundly different, probably as a reaction to stresses that occur during lifetime. This might lead to a functional impairment of adult HPCs which is aggravated during aging and explains some of the problems occurring with elderly stem cell donors.
Footnotes
Acknowledgments
The authors are very grateful to the Stem Cell Department of the Red Cross Blood Service West for bone marrow samples, the Department of Gynecology and Obstetrics of the University Hospital Essen for umbilical cord blood samples, M. Jäger and C. Ziskoven for providing PB of healthy donors older than 55 years. The authors thank R. Margueron for providing the EED antibody and H. Hanenberg for providing the lentiviral vector. The authors are also grateful to K. Raba for assistance with flow cytometrically sorting cells. They thank the Research Commission of the University Clinic of Düsseldorf for financial support.
Part of the results were presented as posters at the Epigenetic Regulation in Cell Fate & Disease Conference, March 17–19, 2010, Vienna, Austria and at the EACR Symposium “Chromatin & Cancer,” July 6–8, 2009, Cambridge, United Kingdom.
Author Disclosure Statement
No competing financial interest exists.
References
Supplementary Material
Please find the following supplemental material available below.
For Open Access articles published under a Creative Commons License, all supplemental material carries the same license as the article it is associated with.
For non-Open Access articles published, all supplemental material carries a non-exclusive license, and permission requests for re-use of supplemental material or any part of supplemental material shall be sent directly to the copyright owner as specified in the copyright notice associated with the article.