
Abstract
Mesenchymal Stem Cells derived from Amniotic Fluid (AFMSCs) are multipotent cells of great interest for regenerative medicine. Two predominant cell types, that is, Epithelial-like (E-like) and Fibroblast-like (F-like), have been previously detected in the amniotic fluid (AF). In this study, we examined the AF from 12 donors and observed the prevalence of the E-like phenotype in 5, whereas the F-like morphology was predominant in 7 samples. These phenotypes showed slight differences in membrane markers, with higher CD90 and lower Sox2 and SSEA-4 expression in F-like than in E-like cells; whereas CD326 was expressed only in the E-like phenotype. They did not show any significant differences in osteogenic, adipogenic or chondrogenic differentiation. Proteomic analysis revealed that samples with a predominant E-like phenotype (HC1) showed a different profile than those with a predominant F-like phenotype (HC2). Twenty-five and eighteen protein spots were differentially expressed in HC1 and HC2 classes, respectively. Of these, 17 from HC1 and 4 from HC2 were identified by mass spectrometry. Protein-interaction networks for both phenotypes showed strong interactions between specific AFMSC proteins and molecular chaperones, such as preproteasomes and mature proteasomes, both of which are important for cell cycle regulation and apoptosis. Collectively, our results provide evidence that, regardless of differences in protein profiling, the prevalence of E-like or F-like cells in AF does not affect the differentiation capacity of AFMSC preparations. This may be valuable information with a view to the therapeutic use of AFMSCs.
Introduction
H
It is to be noted that all these cells maintain a normal karyotype during sub-culturing in vitro and do not retain tumorigenic activity when injected into immune-compromised mice [8]. Moreover, they can differentiate into the cells of the three germ layers [7]. These properties make AF-derived cells excellent candidates for cell therapy. Indeed, due to their immune-modulatory properties, AF-derived cells may be utilized in graft-versus-host disease as well as in other immune disorders [9,10].
Given the heterogeneity of cells derived from the AF, a full characterization of their phenotype is warranted before they are introduced in therapy [11].
Previous proteomic studies on the total amniotic fluid mesenchymal stem cell (AFMSC) population, including epithelioid, AF specific, and fibroblastic cells, revealed 2,400 spots that resulted in the identification of 432 different gene products. Among the proteins detected, 9 corresponded to epithelial cells, whereas 12 proteins were reported to be expressed in fibroblasts [12].
In 2007, Roubelakis et al. defined the proteomic map of AF-derived stem cells as compared with the map of Bone Marrow-MSCs (BM-MSCs) [13]. In a later study based on cellular and biochemical characterization of two distinct selected subpopulations from AF, F-like cells (Spindle Shape-AF-Mesenchymal Progenitor Cells, SS-AF-MPCs) and E-like cells (Round Shape-AF-Mesenchymal Progenitor Cells, RS-AF-MPCs) [14], 25 proteins were found to be differentially expressed in SS-AF-MPCs as compared with RS-AF-MPCs, reflecting their high proliferative rate, differentiation potency, lentiviral transduction efficiency, and long-term survival in vivo. These SS-AF-MPCs colonies, mechanically isolated by AF samples, can generate millions of cells with features that will be of great importance for cell and gene therapy.
In agreement with Roubelakis et al. [13,14], we recently observed that, at very early passages in vitro, unselected AFMSC cultures contained a mixture of both round/polyhedral shaped E-like and elongated F-like cell types at almost equal frequency. By contrast, at passage 7–8, the relative abundance of these phenotypes varied [15].
Interestingly, a proteomic analysis was also recently performed on various different culture passages of CD117+ AFSCs, which exhibited variations in protein expression mainly occurring at early passages [16].
We thus conjectured that a more detailed study of unselected AFMSC cultures might be useful at medium/late passages, exploring their proteomic identity and specific properties. We preferred the mixed cell approach to separation of the two cell populations so as to minimize cell manipulation in case these cells might be used clinically.
In vivo, however, AF-derived stem cells are a heterogeneous population composed of multiple categories of cells with specific morphological, biochemical, and growth features, suggesting the possibility that in the AF epithelial and stromal may coexist based on the epithelial mesenchymal transition, a molecular pathway necessary for AF epithelial cells to acquire a stromal phenotype with immunoreactivity and differentiative ability as expected of true stem cells [17].
The aim of this work supports this hypothesis, and it contributes to our knowledge of the biological and biochemical aspects of AF stem cell heterogeneous populations in vitro by discovering molecular markers indicative of phenotypical and functional cell clones from stromal and epithelial cells. Furthermore, this work shows that the heterogeneity of AF-derived cells could not interfere with their therapeutic potential.
Materials and Methods
Isolation and culture of human AFMSCs
Human AF samples were obtained from women undergoing prenatal diagnosis at 16–18 weeks of pregnancy after written informed consent approved by the Ethics Committee of the University of Chieti. After withdrawal, cells from AF samples were cultured in low-glucose DMEM (PAA Laboratories) supplemented with 20% fetal bovine serum (FBS, PAA), 5 ng/mL recombinant human basic FGF (R&D Systems) and incubated at 37°C with 5% CO2 in a humidified atmosphere. The first medium change was performed after 7 days. Once the cultures had reached 70%–80% confluence, cells were harvested and re-plated at 3,000 cells/cm2. The cells were kept in culture till eight passages. For all the experiments, cells were taken from passage 3 [18]. Phenotype characterization was performed using 12 cell samples at the third culture passage.
E-like and F-like AFMSC phenotypes were spontaneously obtained along the in vitro passages. We noted that at passages 7–8 the E-like AFMSC subtype was characterized by the presence of ∼70% of round/polyhedral cells, and the F-like AFMSC by the occurrence of ∼70% elongated/spindle-shaped cells.
We studied 12 cell samples and observed the prevalence of the E-like phenotype in 5, whereas F-like morphology was predominant in 7 samples. Phenotype characterization of both populations was performed at passage 7–8 (Table 2).
To obtain enough cells to further characterize the molecular and biochemical features of AFMSCs by proteomic analysis, we employed seven cell samples from both populations till the eight passage.
Phenotyping
Cell staining for flow cytometry analysis
Twelve cell samples were stained for surface or intracellular antigens, as previously described [19,20]. Briefly, 5×10⁵ cells/sample were incubated with 100 μL of 20 mM ethylenediaminetetraacetic acid (EDTA) at 37°C for 10 min and washed. Washing buffer (1×PBS, 0.1% sodium azide and 0.5% bovine serum albumin, BSA) was used for all washing steps (3 mL of washing buffer and centrifugation for 8 min at 4°C at 400 g).
Staining of surface antigens
Samples were suspended in 100 μL washing buffer containing the appropriate amount of surface antibody (Supplementary Table S1; Supplementary Data are available online at
Staining of intracellular antigens
Cells were suspended in 1 mL of Perm 2 (BD Biosciences) added to each tube and incubated at room temperature in the dark for 10 min. Then, the procedure was the same as described for surface antigens, using the appropriate amount of intracellular antibody (Supplementary Table S1).
Flow cytometry measurement
Cells were fixed with 1 mL 0.5% paraformaldehyde and stored at 4°C in the dark until acquisition. Finally, they were analyzed on an FACSCanto flow cytometer (BD Biosciences), using Diva™ software (BD Biosciences). Quality control included regular check-ups with Rainbow Calibration Particles (BD Biosciences). Debris was excluded from the analysis by gating on morphological parameters; 20,000 nondebris events in the morphological gate were recorded for each sample. To assess nonspecific fluorescence, we used specific irrelevant controls. All antibodies were titrated under assay conditions, and optimal photomultiplier gains were established for each channel [21]. Data were analyzed using FlowJo™ software (TreeStar). The Mean Fluorescence Intensity Ratio (MFI Ratio) was calculated by dividing the MFI of positive events by the MFI of negative events [22].
Real-time PCR
Total RNA from AFMSCs cultured in basal and osteogenic/adipogenic medium was isolated using the RNeasy Plus Universal Mini Kit (Qiagen, Inc.) according to the manufacturer's instructions. The quality of total RNA was assessed by measuring the A260/280 ratio using a spectrophotometer. For the reverse-transcriptase reaction, M-MLV Reverse Transcriptase reagents (Sigma-Aldrich) were used. Real-Time RT-PCR was carried out with the ABI Prism 7900 Sequence Detection System (Applied Biosystems). Expression of Alkaline Phosphatase (ALP), Runt-related transcription factor 2 (RUNX2), and Osteopontin (OPN) was evaluated at 3, 7, and 14 days in epithelial- and fibroblast-like AFMSCs cultured in osteogenic medium at passage 3. Commercially available TaqMan Gene Expression Assays (RUNX2, Hs00231692_m1, ALP, Hs01029144_m1, OPN Hs00959010_m1) and the TaqMan Universal PCR Master Mix (Applied Biosystems) were used according to standard protocols. For adipogenic differentiation, expression of the PPARγ (Hs01115513_m1), FABP4 (Hs01086177_m1), and LPL (Hs01012567) gene was evaluated till day 10. In both quantitative PCR, Beta-2 microglobulin (B2M, Hs99999907_m1; Applied Biosystems) was used for template normalization and duplicates were set up for each sample. P values <0.05 were considered statistically significant (Student's t test).
For chondrogenic differentiation, the expression of Cartilage Oligomeric Matrix Protein, COMP (Hs.PT.58.2694031; Tema Ricerca) was evaluated till day 21.
Measurement of intracellular Ca2+
The intracellular calcium was measured in single cells using Fura-2/AM (Molecular Probes, Life technologies Italia), an inverted Olympus microscope connected to a high-speed wavelength switcher (Polychrome II; Till Photonics), and a cooled charge coupled device (CCD) camera (C6790 model; Hamamatsu Photonics). The cells seeded into special-optics 96-well plates (Corning–Costar) were loaded with 5 μM Fura-2/AM for 30 min at 37°C in normal external solution (NES: 140 mM NaCl, 2.8 mM KCl, 2 mM CaCl2, 2 mM MgCl2, 10 mM glucose, 10 mM Hepes, pH 7.3) supplemented with 1% (w/v) BSA. Fura-2/AM loaded cells were sequentially and repetitively excited at 340 and 380 nm (one image ratio per second). The temporal plots (mean value of the fluorescence signal in a single cell) were calculated from the image ratios as 340/380. The [Ca2+]i was calculated using a Calcium Calibration Kit for video imaging (Molecular Probes) [23].
Morphological assays
For morphological assays, AFMSCs at the third passage in culture were observed with a Leica DMIL inverted microscope and 20 fields of vision were acquired with Zoom Browser EX software. For structural analysis, the cells were fixed in situ with EtOH 70°, stained with 1% methylene blue, and observed at light microscopy. Other cellular pools were fixed in situ with 2.5% glutaraldehyde in 0.1 M cacodylate buffer, pH 7.6 for 60 min at 4°C, postfixed with 1% osmium tetroxide for 60 min at 4°C, and embedded in Spurr resin as previously reported [24]. Semi-thin sections were cut with a Reichert (Reichert) ultramicrotome, stained with 1% toluidine blue solution, and observed at 20×or 40× magnification under a ZEISS Axioskop light microscope equipped with a Coolsnap digital camera to acquire computerized images. The MetaMorph 6.1 Software System (Universal Imaging Corp, Molecular Device Corp; Crisel Instruments) was employed to perform morphometric analysis as already described [25].
In vitro osteogenic differentiation and Alizarin Red S staining
Osteogenic differentiation was performed by culturing the AFMSCs with DMEM supplemented with 10% FBS, 0.05 mM ascorbic acid, 10 mM β-glycerophosphate, and 100 nM dexamethasone (Sigma-Aldrich) for 21 days, with changes of medium every 3 days.
To visualize calcium sediments, cultures were stained with Alizarin Red S (Sigma-Aldrich) and the images obtained were acquired with Zoom Browser EX software. The quantification of calcium mineralization was assessed in triplicate by spectrophotometric reading at 405 nm, according to the Gregory et al. protocol [26].
In vitro adipocyte differentiation and quantification of adipogenesis by Oil Red Oil staining
AFMSCs were seeded at a density of 1.5×10⁴ in six-well plates and grown in standard DMEM medium. At 90%–100% confluence, the medium was replaced with adipogenic induction medium formed of high-glucose DMEM supplemented with 10% FBS, 1% penicillin/streptomycin, 1 μM dexamethasone, 10 μg/mL insulin, 0.5 mM 3-isobutyl-1-methylxanthine, and 200 μM indomethacin. After 3 days, the medium was renewed with “maintenance” medium comprising high-glucose DMEM supplemented with only 10% FBS, 1% penicillin/streptomycin, and 10 μg/mL insulin. Cells were cultured in this medium for a further 3 days. This protocol was repeated for the next 3 weeks, feeding the cultures alternately with one or the other culture medium. Adipogenic differentiation was confirmed on day 21 using an Oil Red O stain as an indicator of intracellular lipid accumulation. To this end, as per our previous publication [27], cells were washed twice in PBS, fixed with 4% formaldehyde for 10 min at room temperature, rinsed once with 3% isopropanol, and stained with Oil RedO staining solution. Then, cells were rinsed with water and photographed using a Cool-SNAPcf digital CCD camera (PhotoMetrics). To quantify lipid accumulation, cells were incubated for 10 min with 100% isopropanol and the absorbance was measured at 490 nm using a microplate spectrophotometer (Spectramax SM190).
In vitro chondrogenic differentiation and Alcian Blue staining
Chondrogenic differentiation was performed in a monolayer culture following an adapted protocol reported by Iacono and collaborators [28]. Briefly 5×10³ cells/cm2 were seeded and cultured in chondrogenic medium, composed of DMEM, 1% FBS, 100 IU/mL penicillin, 100 mg/mL streptomycin, 50 nM ascorbate-2-phosphate, 0.1 mM dexamethasone, and 10 ng/mL human transforming growth factor (hTGF)-β1. The medium was replaced every 3 days. To detect glycosaminoglycan formation on the cell surfaces, Alcian Blue staining (Sigma-Aldrich) was performed after 21 days, as already established [29]. In short, cells were fixed in cold (4°C) acetone:methanol solution for 3 min and then incubated at room temperature in 1% Alcian Blue solution for 30 min followed by three rinses in 3% acetic acid for 2 min each. After rinsing in deionized water for 2 min, the surfaces were allowed to dry for imaging or placed in a 1% sodium dodecyl sulfate solution for 30 min on a 200 rpm shaker plate to dissolve the Alcian Blue stain. Absorbance of the solubilized solution was measured at 605 nm.
AFMSCs proteome characterization
Sample preparation
About 6±1.4×10⁶ AFMSCs from seven donors indicated as A, B, C, D, E, F, G, and H, samples, respectively, were harvested, washed five times with PBS, and then centrifuged at 4,000 g for 10 min to remove cell debris and unbroken cells. Each pellet was resuspended in lysis buffer containing 7 M urea, 2 M thiourea, 4% CHAPS, 10 mM 1,4-dithioerythritol (DTT), 1 mM EDTA, 1 mM phenylmethylsulfonyl fluoride, and a mixture of protease inhibitors. After sonication for approximately 15 s, the suspension was left at room temperature for 30 min and centrifuged at 14,600 g for 30 min at 20°C. The protein concentration was determined by the Bradford assay with BSA as standard [30].
2DE & image and statistical analysis
The lysed samples were loaded onto commercial 4–7 IPG strip, and the second dimension was performed on a 9%–16% polyacrilamide gel. Analytical gels were stained with ammoniacal silver nitrate [31], whereas gels used for MALDI-TOFMS protein identification were silver-stained without glutaraldehyde, according to the mass compatible method described by Sinha et al. [32]. After staining, gels were scanned by a MagicScan scanner (Amersham pharmacia Biotech) in transparency mode at 800 dpi and the images were stored as TIFF images. Once digitized, the gel images were analyzed by Image Master 2D Platinum software, 6.0 version (GE Healthcare Biotech).
To construct a master gel from all samples included in this study, three different gel runs for each biological replicate considered were performed and then subjected to image analysis. A spot was considered only if detected in three biological replicates for each sample and defined as “common spot” (ie, always present and in the same position on all polyacrilamide gels). Statistical analysis was performed using two sample t tests. Differences were considered significant at P<0.002.
MALDI TOF/TOF- MS analysis
After gel analysis, protein spots on preparatory AFMSCs-2DE gels were excised and analyzed by the peptide mass finger printing (PMF) approach with a MALDI-TOF-TOF mass spectrometer and by mass list probabilistic matching from MOWSE score algorithms on the NCBInr database. Protein spots, once excised from the gel, were washed in 100% ethanol and 100 mM ammonium bicarbonate (NH4HCO3). The pieces of gel corresponding to a single protein were incubated for 60 min at 56°C in a volume of 50 mM NH4HCO3 supplemented with 10 mM DTT and then for 30 min in the dark in 55 mM iodoacetamide in 100 mM NH4HCO3 at room temperature. Finally, the gel was reswollen in 50 mM NH4HCO3 containing trypsin and incubated overnight at 37° C [33].
Pathway analysis
Functional protein association was performed using the software STRING (
Statistical analysis
Data are reported as means±standard deviation (SD) of at least three independent experiments. Statistical comparisons were made using Student's t-test. A difference was considered significant at P<0.05.
Results
Cellular and molecular characterization of AFMSCs
Using flow cytometry, we extensively characterized the AFMSCs at the third passage (n=12) to assess the expression profile of the principal mesenchymal markers (Table 1). AFMSCs did not display surface expression of any hematopoietic marker (CD14, CD34, and CD45). On the contrary, they expressed a variety of mesenchymal markers (CD73, CD90, and CD105), several surface adhesion molecules (CD29, CD44, and CD166), and the stemness markers hTERT, Sox-2, Oct3/4, and SSEA-4; whereas neither CD117 nor surface endothelial marker CD144 was expressed. However, in some samples, we noted the expression of epithelial markers such as CD326 (Ep-CAM). Consistent with a stem cell profile, these cells stained positive for HLA-ABC and negative for HLA-DR.
–negative;+/−low;+moderate;++positive;+++high expression.
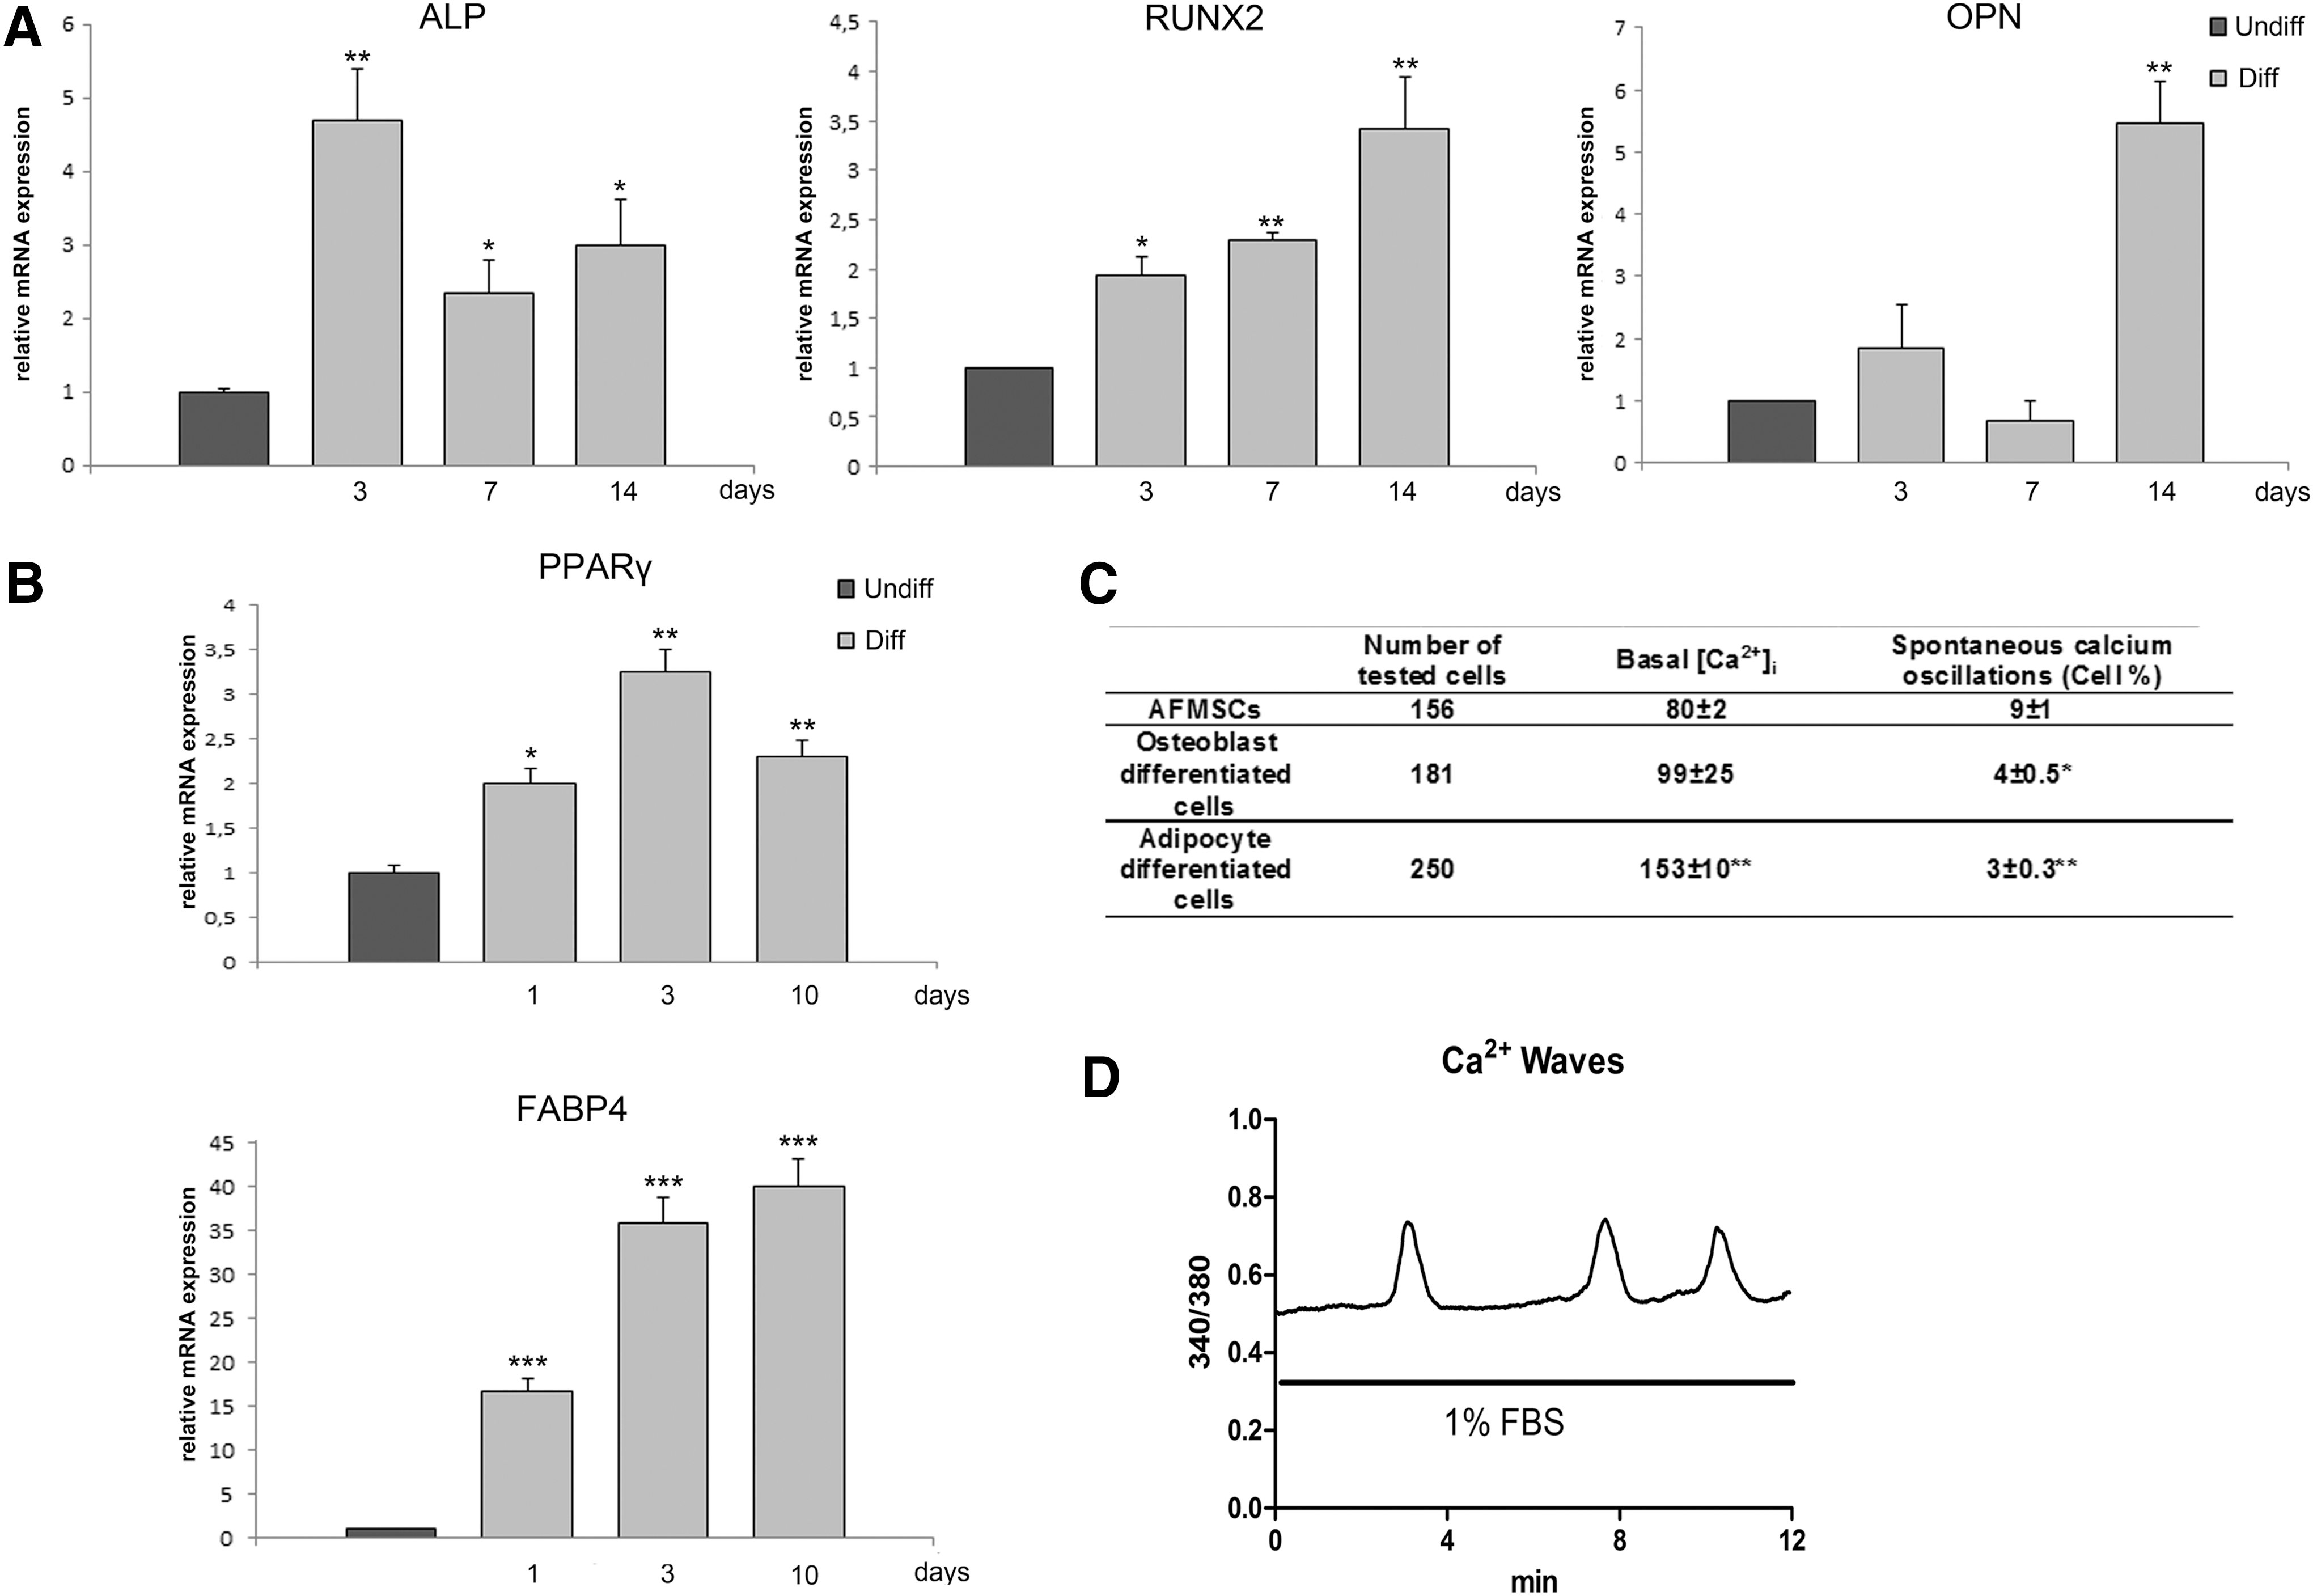
The osteogenic and adipogenic differentiation potential of AFMSCs at passage 3 or 4 was assessed by culturing cells in appropriate differentiation media. Expression of the specific osteogenic markers, ALP, RUNX2, and Osteopontin increased, although with different kinetics, after 3–14 days' exposure to osteogenic medium (Fig. 1A). Again, expression of the adipogenic markers PPARγ and FAPB-4 increased over time of exposure to the adipogenic medium (Fig. 1B).
Osteogenic, adipogenic, and chondrogenic differentiation of amniotic fluid mesenchymal stem cells (AFMSCs).
To further characterize intracellular signaling events associated with AFMSC differentiation, we performed single cell measurements of intracellular calcium. Basal [Ca2+]i was ∼80 nM, with less than 10% of the cell population showing spontaneous Ca2+ oscillations. In terminally differentiated osteoblasts, basal [Ca2+]i was approximately 99 nM, and 4.0%±0.5% cells showed spontaneous oscillations. This is consistent with the pattern recently reported by Sun et al., showing decreased spontaneous calcium waves in terminally differentiated osteoblasts from bone marrow-derived human MSCs [34].
Adipocyte-differentiated AFMSCs displayed higher basal [Ca2+]i than undifferentiated or osteoblastic differentiated AFMSCs. Spontaneous [Ca2+]i oscillations were also observed in 3%±0.3% cells (Fig. 1C). This percentage increased (30%±3%) after exposure to 1% FBS-containing bath medium with 1% (Fig. 1D).
To further characterize AFMSCs, we performed chondrogenic differentiation in a monolayer culture. The mRNA level of cartilage oligomeric matrix protein (COMP), which is expressed in articular cartilage as well as in proliferative chondrocytes, had increased 4.6 times by day 4 of chondrogenic differentiation when compared with cells cultured in the control medium. In accordance with published data [35], the increased level stayed significant until day 14 of differentiation (3.0-fold increase).
AFMSC preparations express mixed epithelial-like and fibroblast-like morphology
Phase-contrast light microscopy analysis revealed that AFMSCs are a heterogeneous population, containing both round/polyhedral epithelial-like cells (E-like, Fig. 2A, B) and more elongated fibroblast-like cells (F-like, Fig. 2A, C). Toluidine blue-stained semithin sections of both cell populations showed euchromatic round nuclei with one or more nucleoli. Moreover, both cell types exhibited numerous cytoplasmic granules and evident cytoskeleton elements (Fig. 2D). To better analyze the two cell types, both whole cell and nucleus areas, longitudinal (Length) and transversal (Width) axes, and the localization of intracellular granules were evaluated. As shown in Fig. 2, the longitudinal axis appeared much longer than the transverse axis in the F-like cells (144.80±26.73 μm vs. 49.14±8.18 μm; P<0.001), while length and width were equivalent in the E-like cells (49.14±8.18 μm vs. 32.78±3.84 μm). Moreover, cytoplasmic granules were mainly localized in the perinuclear region of the E-like cells, while they were widespread in the cytoplasm of the F-like cells (Fig. 2D).

Morphology and morphometric analysis of AFMSC population in Light Microscopy.
It should be noted that the relative abundance of these phenotypes varied among samples along in vitro passages, with the E-like AFMSC population preparations (E-like) being characterized by the presence of ∼70% of round/polyhedral cells, and the F-like AFMSC by the occurrence of ∼70% elongated/spindle-shaped cells.
Flow cytometric phenotyping of these cell subtypes performed at passage 7–8 showed that F-like cells exhibited higher CD90 and lower Sox2 and SEEA4 expression than epithelial-like cells. Interestingly, CD326 was expressed only in the epithelial-like phenotype (Table 2).
MFI-Ratio is the average of different biological samples±standard deviation; P is calculated versus epithelial like MFI-Ratio values; Bold values represent MFI-Ratio with P<0.01.
E-like and F-like AFMSCs exhibit equal osteogenic, adipogenic, and chondrogenic differentiation properties
Next, we determined the differentiation capability of E-like and F-like AFMSCs (Fig. 3A, B). Both populations cultured in osteogenic medium showed extracellular matrix mineralization, as monitored by ARS staining (Fig. 3C, D). Matrix mineralization was quantified by spectrophotometry. Both E-like and F-like AFMSCs, maintained in osteogenic medium, exhibited a greater time-dependent (7-14-21 days) increase in calcium deposition than cells maintained in normal medium (see histograms in Fig. 3C, D).

Osteogenic, adipogenic, and chondrogenic differentiation of E-like and F-like AFMSCs.
Similarly, the two phenotypes cultured in adipogenic medium showed a comparable increment in Oil Red O staining as well as in the presence of single adipocytes with multiple vacuoles. The absorbance readouts were consistent with this pattern (Fig. 3E, F). Both populations cultured for 21 days in chondrogenic medium showed positive Alcian Blue (Fig. 3G, H). This staining, used to assess mucosubstances and acetic mucin deposition, was quantified by spectrophotometry at 605 nm. Both E-like and F-like AFMSCs, maintained in chondrogenic medium, exhibited greater absorbance than cells maintained in normal medium (see histograms in Fig. 3G, H).
AFMSC proteome
To fully characterize the AFMSC phenotype, we performed proteomic analysis. Two-dimensional (2D) gel electrophoresis revealed 2,974±102 spots, 465 of which were common to all samples, with great reproducibility and significant statistical values (P<0.005). These can be considered housekeeping proteins. On the other hand, 326 spots, representing 200 unique proteins with a molecular mass ranging from 12 to 180 kDa and an isoelectric point in the 4–7 pH range were taken to mass spectrometry for identification. The list of assigned proteins is reported in Supplementary Table S2 and indicated in the 2D map (Supplementary Fig. S1). The proteins identified belong to at least five functional categories (Supplementary Fig. S1): cytoskeleton and motility, metabolism, protein biosynthesis folding and degradation, nucleotide biosynthesis, and cell signaling. Altogether, 55% of the total proteome was composed of proteins from the cytoskeleton compartment and involved in protein biosynthesis, folding, and degradation.
E-like and F-like AFMSC proteome
We also compared the proteome of E- and F-like AFMSCs. Heuristic cluster analysis of seven samples carried out by comparing 2D maps (three experimental replicates for each sample) allowed us to group all AFMSCs examined under two main phenotype classes HC1 (A, B, C, D) and HC2 (E, F, G) (Fig. 4). HC1 represents the protein profile of E-like AFMSC, while HC2 is the typical profile of F-like AFMSC. Comparative gel analysis of the HC1 and HC2 proteomes revealed proteins specifically expressed in each cluster. Twenty-five and eighteen protein spots were differentially expressed in HC1 and HC2 classes, respectively. Seventeen proteins exclusive to the E-like phenotype (HC1) were identified by MS analysis and are listed in Table 3. Some of these proteins were highly expressed, that is, specific isoforms of cytoskeletal keratin (K2C8, K2C7, K1C18, K1C19), alpha 5 integrin (ITA-V), a mitochondrial dihydrolipoyllysine–residue succinyltransferase (ODO2), and c-AMP-dependent protein kinase (KAP0) isoform 1 of a nuclear cell cycle regulatory protein (GRSF1) (Fig. 4). Four proteins were selectively expressed by the F-like phenotype (HC2); among them were a number of chaperonins, including two isoforms of heat shock protein beta 1 (HSPB1) and one heat shock protein beta 6 (HSPB6) (Table 3 and Fig. 4).
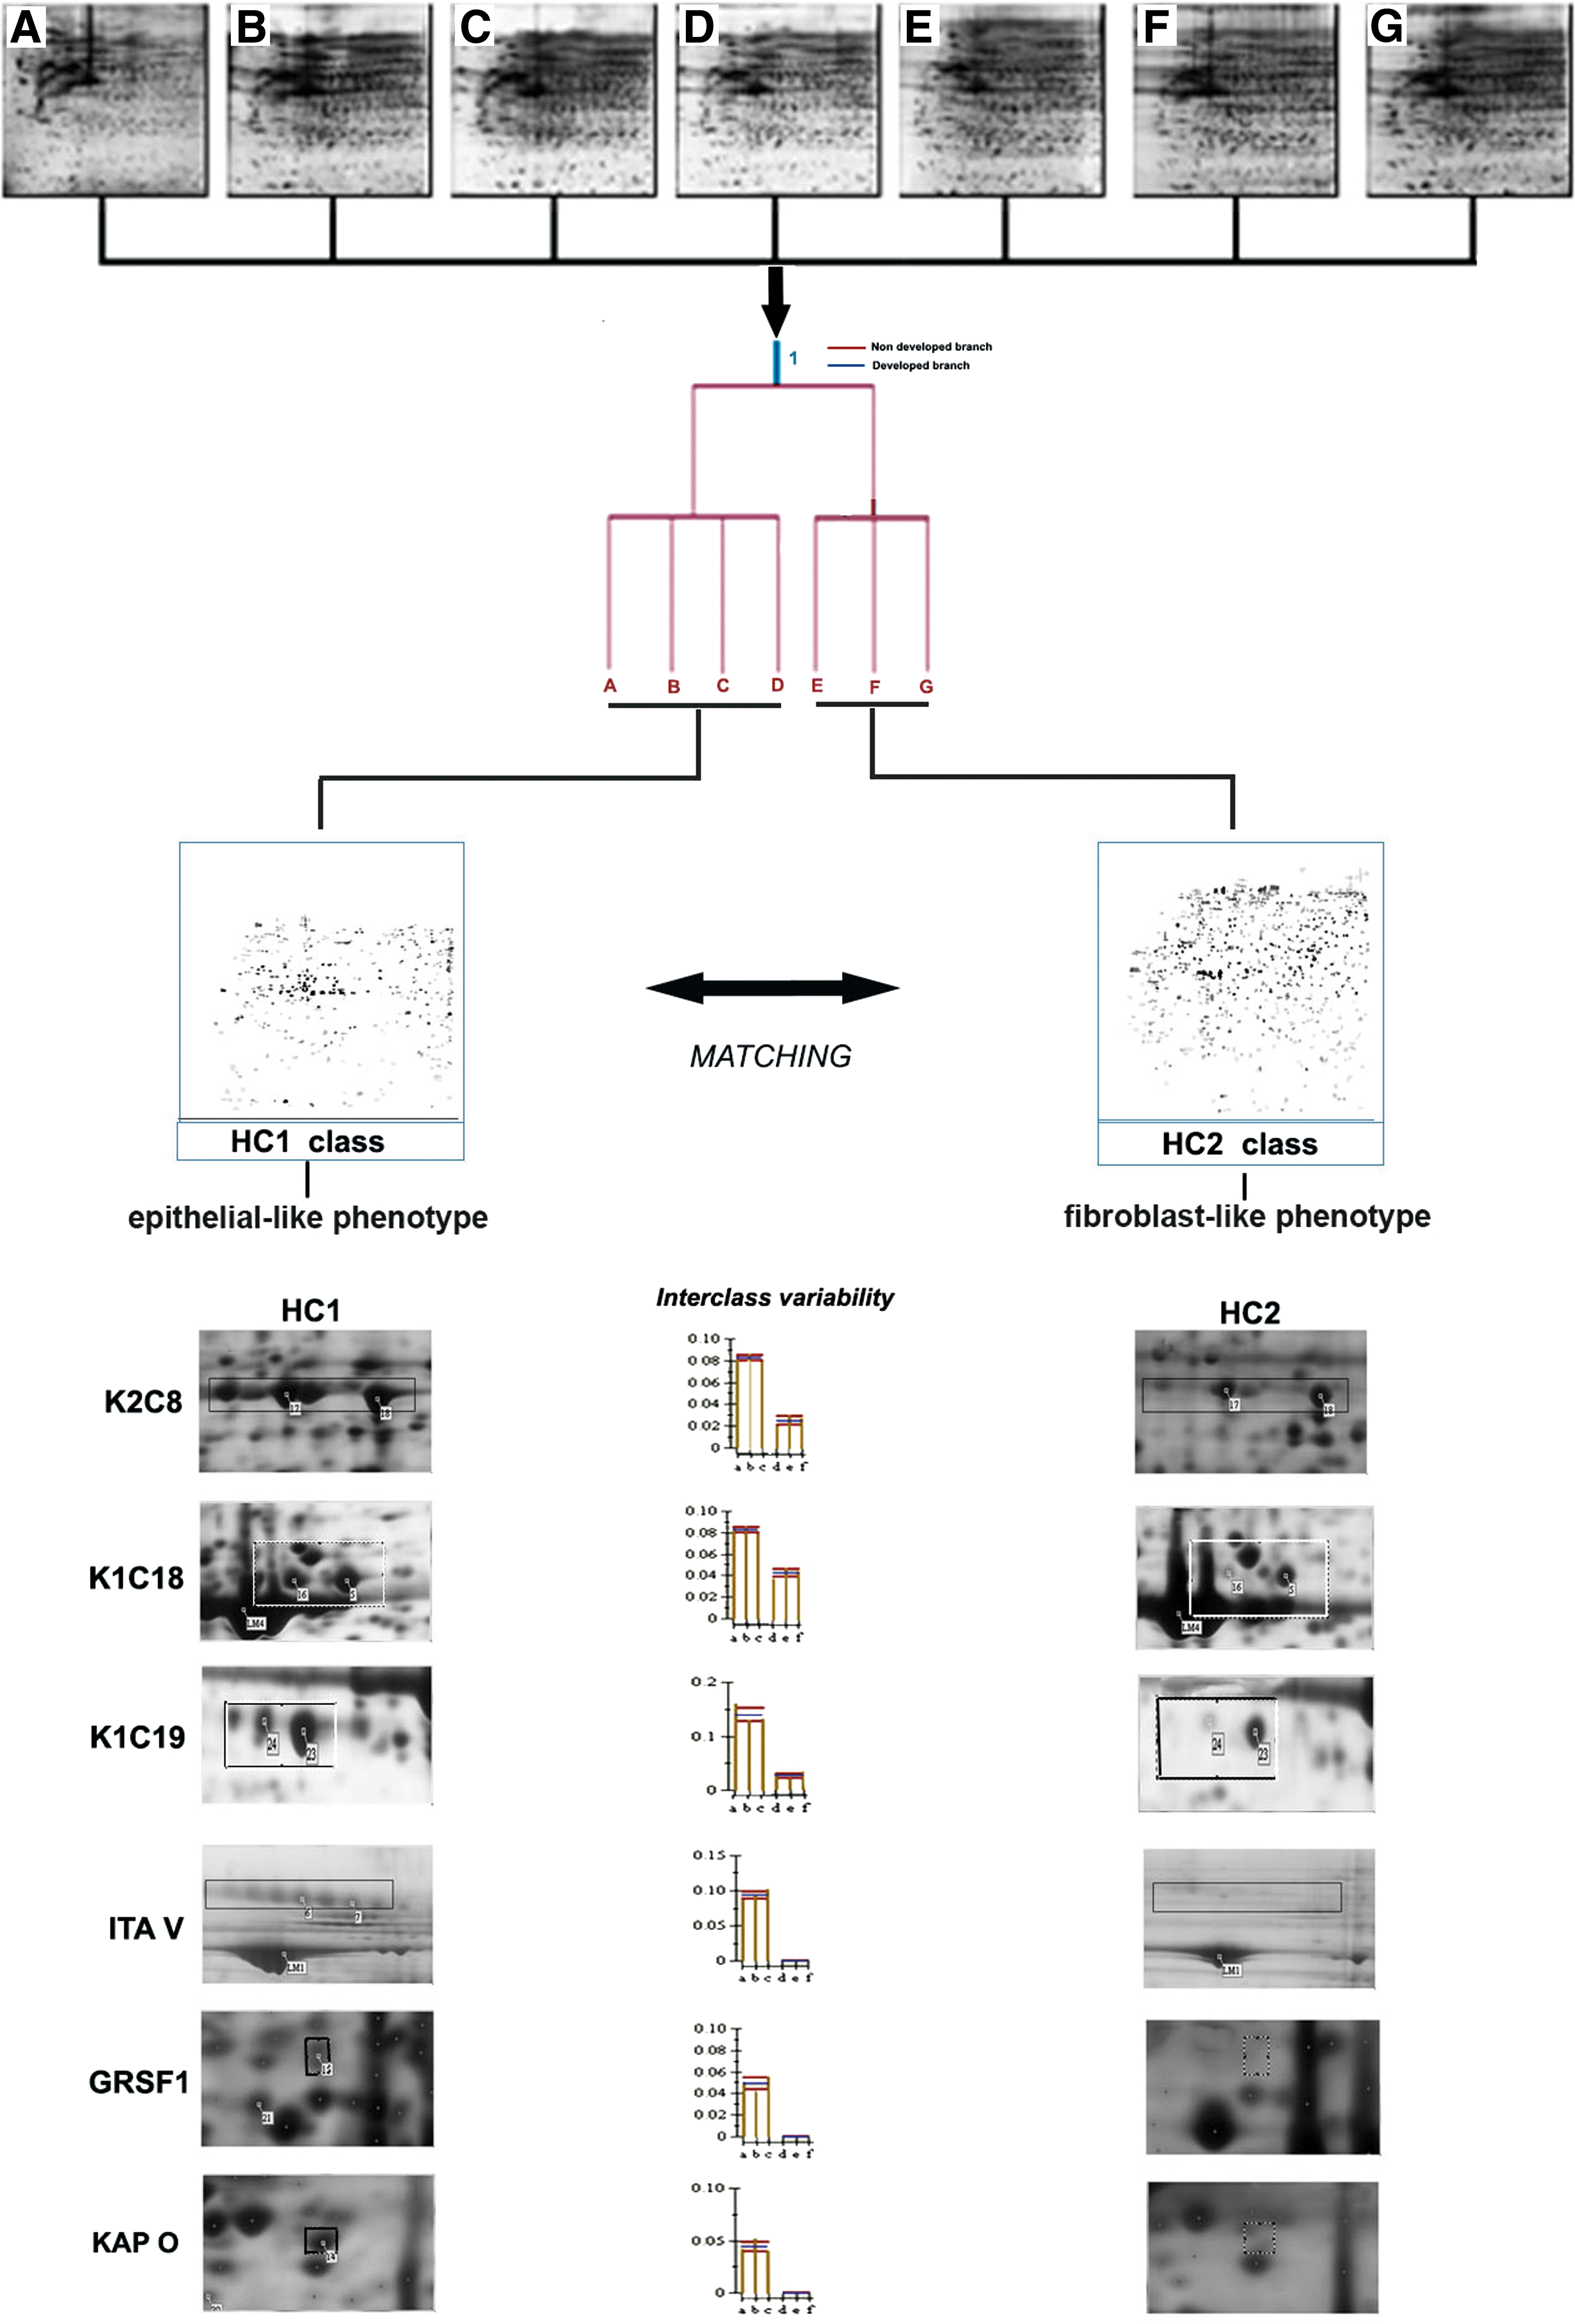
Proteomic differential display of AFMSC phenotypes. Heuristic clustering analysis after the image processing of eight 2D gels (three gels for each AFMSCs batch analyzed,
Abbreviation it is omitted the _Human.
Accession number in integrated UniProtKB/Swiss-Prot.
Score It is -log10(P), where P is the probability that the observed mach is a random event, it is based on Swiss Prot database using the MASCOT searching program.
% Sc Sequence coverage means the ratio of portion sequence covered by matched peptide to the full length of the protein sequence.
Number of peptide matched.
The protein-interaction networks (PIN) for both phenotypes show strong interactions between specific AFMSC proteins and molecular chaperones, such as preproteasomes and mature proteasomes, both of which are important for cell cycle regulation and apoptosis. (Fig. 5A, B).
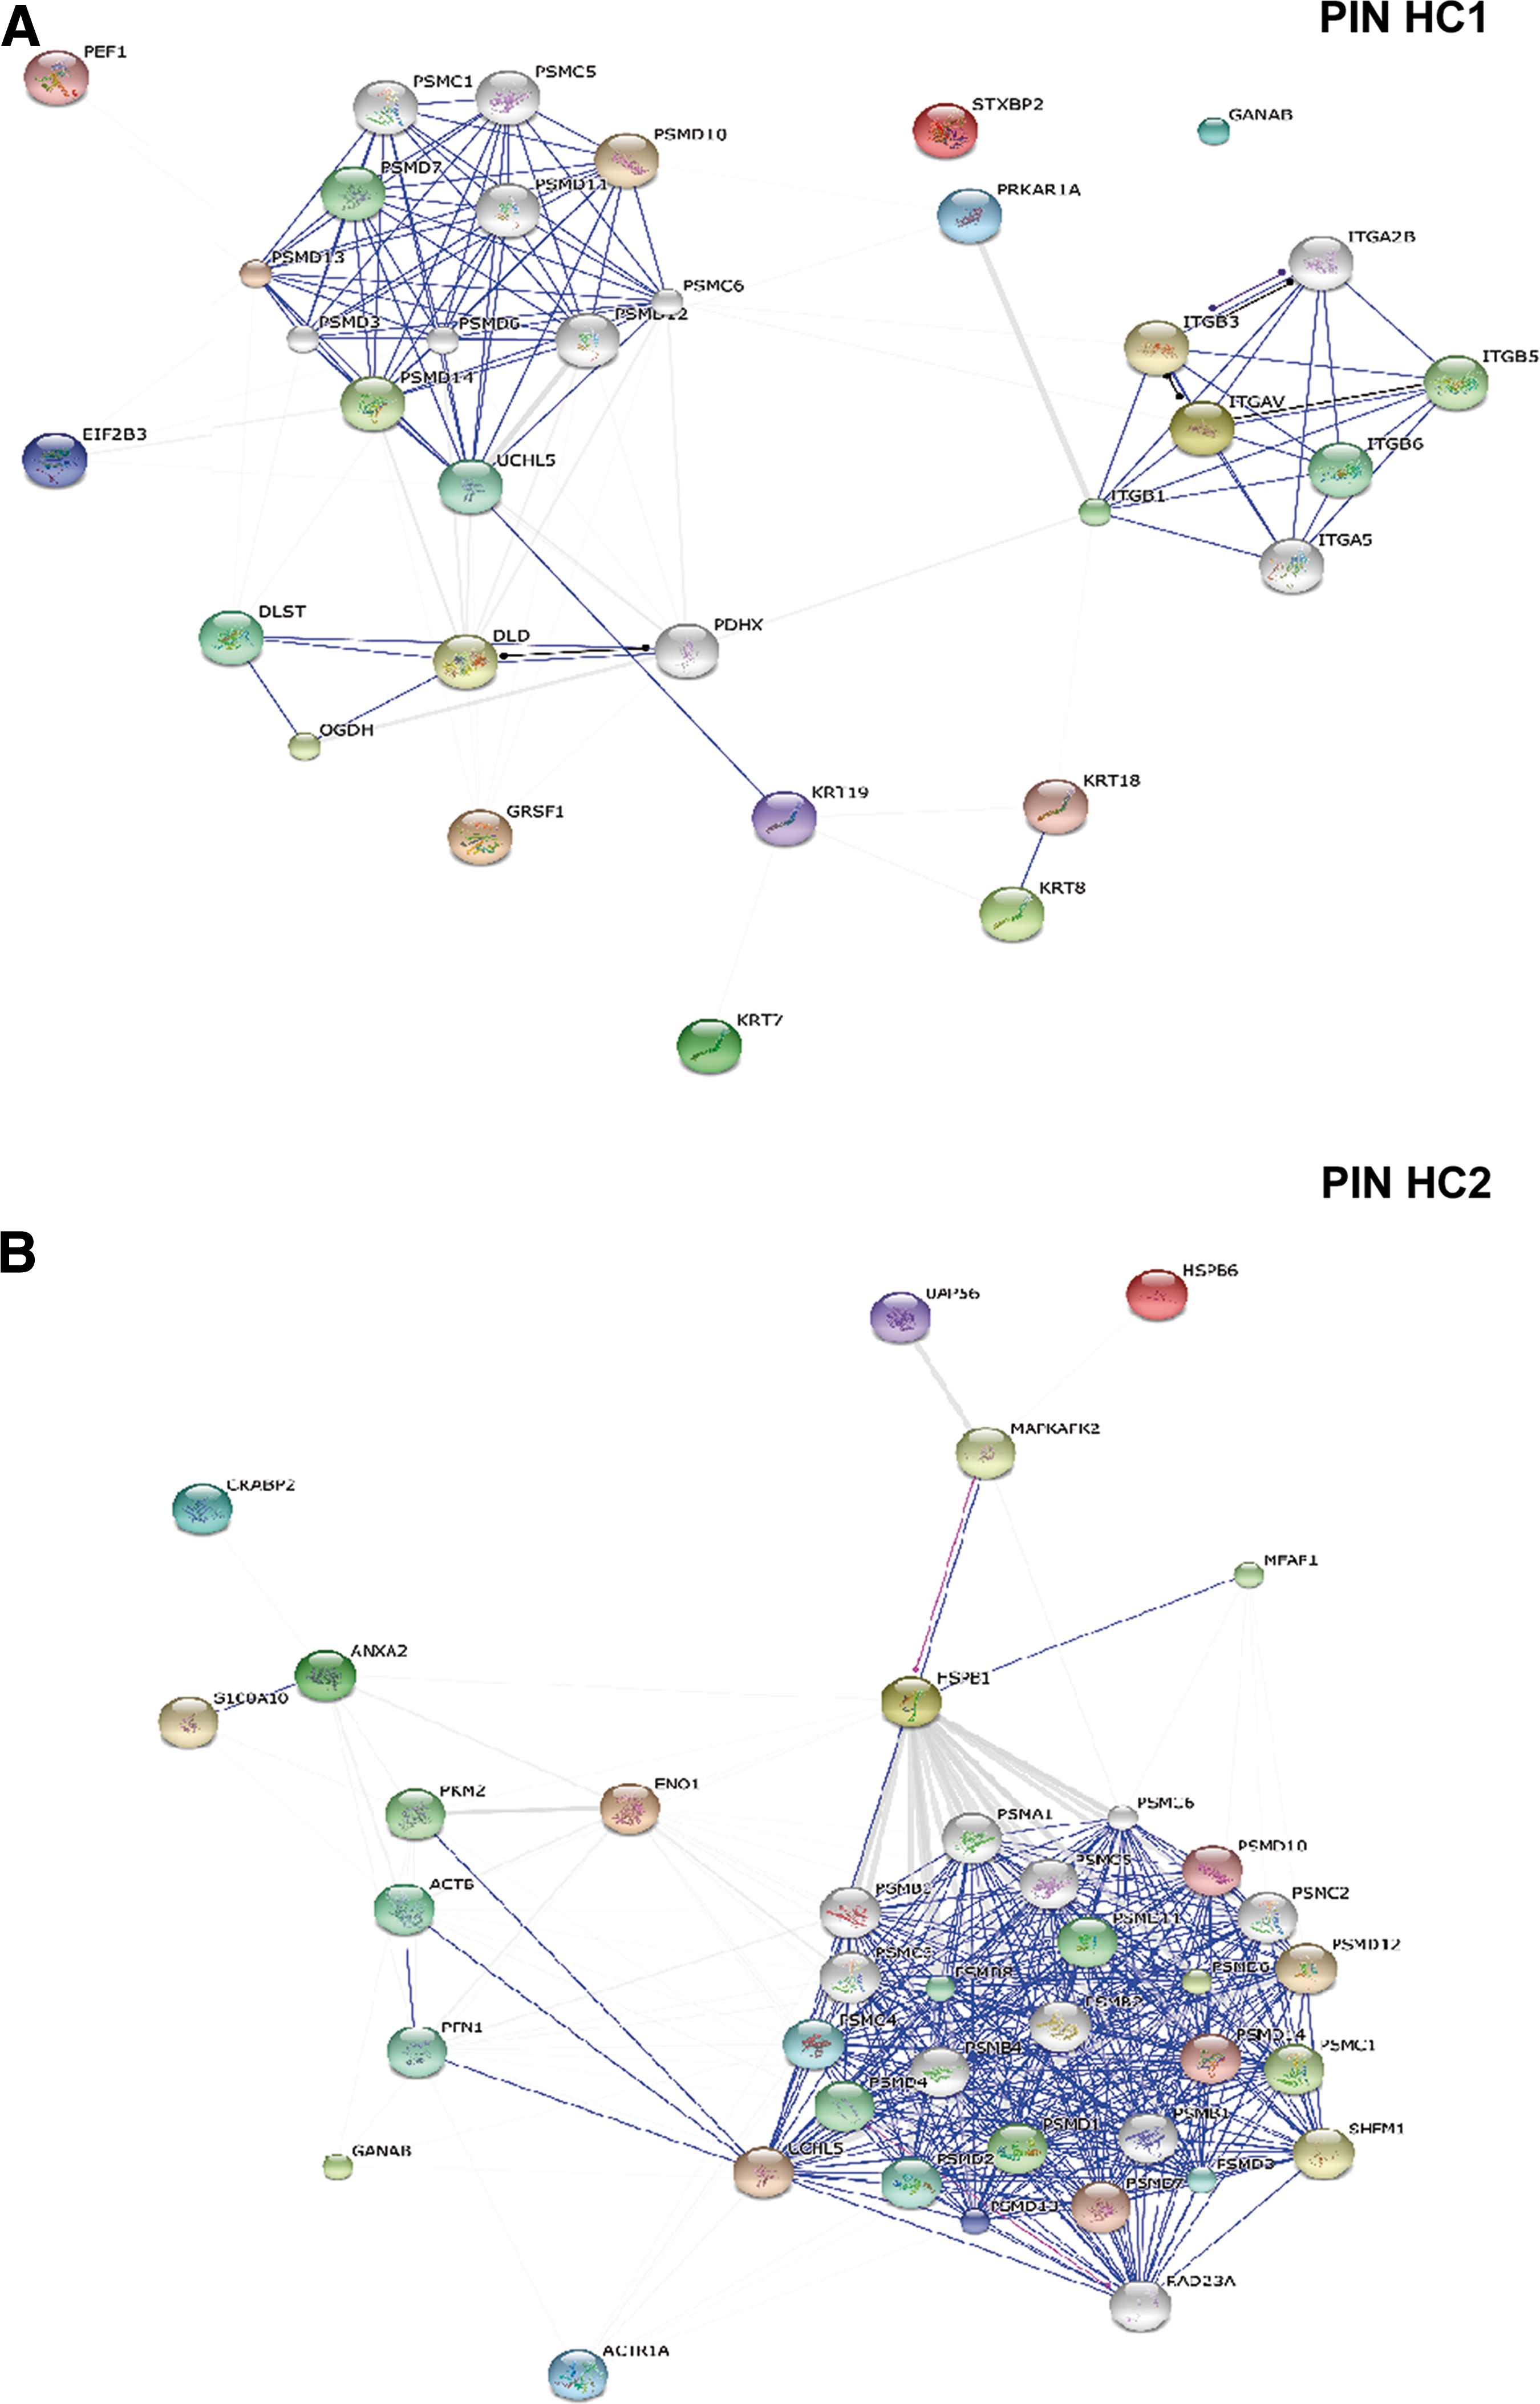
STRING protein – protein interaction analysis in HC1 (E-like AFMSCs) and HC2 (F-like AFMSCs) phenotype classes.
It is worth noting the strong functional link in E-like preparations between an isoform of ubiquitination enzyme UCHL5 and proteasome components, which could be related to cytoprotection and stemness preservation (Fig. 5A).
On the other hand, the F-like AFMSC PIN is characterized by the presence of HSB1, a protein involved in cell redox homeostasis and regulation of normal cytoskeleton architecture (Fig. 5B) [36]. Notably, Enolase I (ENOA1), a multifunctional enzyme with a prevalent role in glycolysis as well as in a number of cell processes (eg, growth control, hypoxia, and allergic responses) is a central node of the F-like AFMSC PIN (Fig. 5B).
Discussion
The evidence indicates that AF-derived cells may be useful in regenerative medicine [37]. Thus, an accurate definition of their phenotype is mandatory before any clinical use.
In this report, we confirm that AFMSCs are a heterogeneous cell population expressing mesenchymal surface antigens, but not hematopoietic markers (Table 1). AFMSCs stained positive for some embryonic stemness markers, thus showing intermediate characteristics between embryonic and adult cells. Grown in an appropriate medium, they differentiated into osteogenic, adipogenic, and chondrogenic cells and expressed molecular markers of these phenotypes. Moreover, during differentiation, changes in basal as well as spontaneous [Ca2+]i oscillation were observed (Fig. 1C, D). This is consistent with data from human bone marrow- and adipose tissue-derived MSCs [38,39]. Moreover, the decrease in Ca2+ oscillation during AFMSC osteoblastic differentiation (Fig. 1C, D) is in agreement with previous reports [34,40]. On the other hand, the observed increment in basal [Ca2+]i is in line with the adipocyte differentiation program [41], as an increment in [Ca2+]i upregulates the expression of PPARγ, a nuclear hormone receptor that acts as a critical transcriptional factor in adipocyte differentiation [42]. Consistent with this, we observed an increment in PPARγ expression during adipocyte differentiation of AFMSCs (Fig. 1B).
In agreement with previous reports [13,14], we observed that AFMSC cultures are not homogeneous, with round/polyhedral shaped E-like and elongated F-like (Fig. 2) being the two main phenotypes represented. The relative abundance of these phenotypes varied among the different preparations and along in vitro passages. This allowed us to select at medium/long period mixed preparations with predominant (>70%) E-like or F-like phenotype, with a view to determining the impact of the predominant phenotype on various functional and structural parameters. The mixed cell approach was preferred to separation of the two cell populations as reported by Roubelakis et al. (2011) so as to minimize cell manipulation in case these cells should be used clinically.
The two phenotypes differentiated equally well into osteogenic, adipogenic, and chondrogenic lineages (Fig. 3). This is an intriguing observation, in apparent contrast with previous data showing differences in osteogenic and adipogenic differentiation capacity of the two phenotypes [14]. One likely explanation is that cross-talk between the two phenotypes may stabilize functions of either cell type, thus maintaining homogeneous differentiation properties regardless of predominance or relative abundance.
To gain a broader view of the phenotypic profile of AFMSC, we carried out proteomic and protein-protein network analyses (Figs. 4 and 5). Interestingly, the E-like and F-like phenotypes shared ∼200 proteins with ∼43% of the total proteome being represented by cytoskeletal proteins and by components of the protein biosynthesis machinery. Unlike what we had observed in Wharton's jelly MSCs [43], the metabolism enzymes mainly involved in energy catabolic processes were the second most abundant class. In addition, AFMSCs expressed several isoforms of vinculin, which regulates cell morphology during lamellipodia formation [44,45] and cell mechanics [46]. They also expressed Cofilin-1, a differentiation marker related to in vitro expansion [12], as well as a large number of proteins related to proliferation and cell homeostasis, similar to ubiquitin-1. In agreement with earlier data [14], Galectin 1 (GAL1) and Transgelin (TAGLN), which regulate differentiation in other stem cell types, were abundant in our AFMSCs. Moreover, a high amount of Vimentin (VIM), a marker of MSCs, was found in the AFMSC proteome [44]. Antioxidant proteins such as thioredoxin, peroredoxin, and glutathione transferases were also present in these cells. Overall, this profile is consistent with cells with good plasticity, proliferative capability, and resistance to oxidative stress.
Heuristic cluster analysis suggested the total AFMSC population contained two main phenotype classes, which we termed HC1 (E-like phenotype) and HC2 (F-like phenotype). Approximately 21 proteins were differentially expressed in these classes. For instance, K2C8, K1C18, and K1C19 were significantly higher expressed in E-like cells (Fig. 4), confirming a previous observation with purified populations [14]. Since K2C8 and K1C18 are considered markers of a more undifferentiated phenotype and K1C19 is expressed in incompletely differentiated cells [47], the increased K2C8, K1C18, and K1C19 expression in the HC1 class is consistent with a higher degree of stemness. This is also supported by the higher ITA V expression in HC1, as ITA V may be functionally involved in the maintenance of a highly migratory, mesenchymal phenotype as well as in the acquisition of a stem phenotype [48]. Consistent with this, E-like cells express CD326, which is not detected in F-like preparations.
Other proteins exclusively expressed in the HC1 class are related to the control of protein biosynthesis, such as an isoform of KAP 0, a major component of PKA, which regulates post-transcriptional mitochondrial gene expression [49] and is involved in several intracellular pathways, including gene transcription, ion transport, metabolism, cell division, and differentiation [50].
Among the proteins more abundantly expressed in class HC2, we found isoform 2 of cellular retinoic acid binding proteins (RABP2), also termed CRABP II (Table 3) and belonging to a family of small cytosolic lipid-binding proteins, which are highly conserved during evolution [51,52]. HSPB1 was also overexpressed in HC2 cells. This protein is closely associated with the regulation of actin polymerization.
The analysis of PINs from both cell phenotypes revealed a remarkable functional link: Proteins involved in the regulation of cell integrity (ACTB, PFN1, HSPB1, MFAP1, KRT19, KRT8, KRT18) and cytoskeleton remodeling (cell structure and motility) are associated with the proteasome 26S complex (PSMC1,5,6; PSMD3,6,7,10,11,12,13,14; RAD23A), which modulates protein biosynthesis, folding, and degradation (Fig. 5A, B), suggesting an additional role of proteasomes from the major cell proteolitic pathway, the so-called ubiquitine-proteasome pathway (UPP) [53].
Unlike HC1, the HC2 PIN showed a potential synergism between UPP and antioxidant molecular chaperons that is, HSPs (HSPB1, HSPB6). This may prevent abnormal protein synthesis, promoting proper repair and adequate proteostasis [53,54]. The HC2 PIN also revealed multiple associations with ENOA1. This ties up with the involvement of ubiquitination events in key signaling pathways, such as innate immunity and inflammation [55].
To conclude, in this work, we provide a biological and molecular characterization of the main phenotypic subpopulations in mixed AFMSC cultures in vitro taking advantage of proteomic inventories created by a 2DE comparative approach.
This approach confirmed the cellular heterogeneity of the AF and provided evidence of separate interactome networks for the E-like and F-like populations. The pathophysiological and clinical relevance of such differences as well as whether these populations have different origins or represent stages of phenotype transition remains to be determined.
Footnotes
Acknowledgments
This study was partially supported by CARICHIETI Foundation. The authors thank MA Centurione for technical support with microscopy analysis.
Author Disclosure Statement
No competing financial interests exist.
References
Supplementary Material
Please find the following supplemental material available below.
For Open Access articles published under a Creative Commons License, all supplemental material carries the same license as the article it is associated with.
For non-Open Access articles published, all supplemental material carries a non-exclusive license, and permission requests for re-use of supplemental material or any part of supplemental material shall be sent directly to the copyright owner as specified in the copyright notice associated with the article.