
Abstract
Secondary neurulation is an embryonic progress that gives rise to the secondary neural tube, the precursor of the lower spinal cord region. The secondary neural tube is derived from aggregated Sox2-expressing neural cells at the dorsal region of the tail bud, which eventually forms rosette or tube-like structures to give rise to neural tissues in the tail bud. We addressed whether the embryonic tail contains neural stem cells (NSCs), namely secondary NSCs (sNSCs), with the potential for self-renewal in vitro. Using in vitro neurosphere assays, neurospheres readily formed at the rosette and neural-tube levels, but less frequently at the tail bud tip level. Furthermore, we identified that sNSC-generated neurospheres were significantly smaller in size compared with cortical neurospheres. Interestingly, various cell cycle analyses revealed that this difference was not due to a reduction in the proliferation rate of NSCs, but rather the neuronal commitment of sNSCs, as sNSC-derived neurospheres contain more committed neuronal progenitor cells, even in the presence of epidermal growth factor (EGF) and basic fibroblast growth factor (bFGF). These results suggest that the higher tendency for sNSCs to spontaneously differentiate into progenitor cells may explain the limited expansion of the secondary neural tube during embryonic development.
Introduction
N
Different regions of the developing nervous system require NSCs with different proliferation and differentiation potentials by virtue of their own function [9 –13]. For instance, at embryonic day 12.5 (E12.5), NSCs in the embryonic cerebral cortex (cNSCs) actively self-renew to fulfill cortex enlargements during later development [14 –16], whereas the caudal spinal cord formed by sNSCs progressively regresses to a small structure with limited expansion [17]. It has been revealed that there are regional differences among NSC populations [13,18,19], suggesting that the regional heterogeneity of NSCs contributes to regional differences in neural mass and the time course of neurogenesis. Considering that sNSCs are unique with regard to their developmental origin and that the caudal-most spinal cord is the least expansive region of the embryonic CNS, we speculated that sNSCs should have unique characteristics in terms of their proliferation and differentiation potential. As an initial step to address this issue, we established an in vitro culture of sNSCs and examined their proliferation and differentiation properties.
Materials and Methods
Animals
Pregnant female C57BL/6 mice at E12.5 were purchased from DAEHAN BIOLINK. All experiments were carried out in accordance with the ethical guidelines of Korea University and with the approval of the Animal Care and Use Committee of Korea University (KUIACUC-2012-137).
NSC culture
Embryonic cerebral cortices and tails from E12.5 mice were used for each primary neurosphere culture. Embryonic tissues were dissected from the brain and the spinal cord underlying the tail region, which is discriminated at somite level 36 as the secondary neural tube. Tissues were isolated and incubated with Accutase (Innovative Cell Technologies) for 5 min at 37°C. Dissociated cells were seeded on an ultralow attachment surface of a six-well dish and maintained as neurospheres in N2 media containing 1% serum-free N2, 2% B27 supplement, and 1% penicillin–streptomycin (Gibco BRL) in DMEM/F12 medium (Welgene) as previously described [20]. Neurospheres were grown for 7 days in culture media containing basic fibroblast growth factor (bFGF, 20 ng/mL; R&D) and epidermal growth factor (EGF, 20 ng/mL; Invitrogen). The number of primary neurospheres was counted on day 7 in vitro. For passaging, dissociated cells from neurospheres (5,000 cells) were reseeded in the presence of growth factors. A serial passage growth curve was obtained between culture phases, passages 0–5 (P0–P5). The number of viable cells was assessed using a cell counter (Logos Bio). For differentiation, NSCs were maintained for 6 days in N2 media without EGF/bFGF. For clonal pair assay, pair-cell analysis was performed as described previously [21]. Cultured cells were plated onto coverslips coated with poly-
Reverse transcription polymerase chain reaction
Total RNA was isolated from neurospheres using an RNeasy Micro Kit (Qiagen). RNAs (0.5–1 μg) were reverse transcribed (RT) with reverse transcriptase (MMLV; Promega), an oligo-dT primer, and RNasin (Promega) to synthesize cDNAs. cDNAs were then subjected to polymerase chain reaction (PCR) amplification with specific primers for the target genes. The set of primers used in this study is listed in Table 1. To obtain semiquantitative data, conditions for all reactions were optimized. Equivalent amounts of generated cDNAs were run in triplicate for quantification and analysis of the expression levels of genes of interest. Amplified PCR products were separated and analyzed by 1% agarose gel electrophoresis. Signal densities were measured using an ImageJ program. GAPDH was used as an internal control to normalize each primer.
Immunostaining
For immunostaining, mouse embryos or neurospheres were fixed with 4% paraformaldehyde and subsequently immersed in phosphate-buffered saline (PBS) containing 30% sucrose. Tissues/neurospheres were sectioned (16-μm thickness) using a cryostat and attached to the gelatin-coated slides. After blocking with PBS containing 3% bovine serum albumin (BSA) and 0.1% Triton X-100 for 1 h, primary antibodies were applied overnight: rabbit anti-Sox2 (1:500; Millipore), mouse anti-S100β (1:1,000; Sigma Aldrich), rat anti-BrdU (1:500; Abcam), goat anti-DCX (1:500; Santa Cruz), mouse anti-Tuj1 (1:1,000; Sigma-Aldrich), mouse anti-Ki67 (1:500; BD Biosciences), rabbit anti-NG2 (1:500; Millipore), and mouse anti-GFAP (1:500; Cell Signaling Technology) at 4°C. Samples were washed with PBS and incubated with secondary antibodies at room temperature for 30 min: Hoechest 33342 for bromodeoxyuridine (Brdu) staining, fixed cells were pretreated with 2 N HCl for 30 min at 37°C to denature the DNA. Subsequently, samples were washed, mounted, and observed by confocal microscopy (Zeiss LSM 700).
Cell cycle analysis by flow cytometry
Neurospheres derived from the cerebral cortex or secondary neural tube were collected and digested into single cells. Single cells were harvested, fixed in 70% ice-cold ethanol at 4°C for 1 h, and washed twice with PBS containing 1% BSA. After centrifugation, cells were resuspended in 0.5 mL PBS and treated with 20 μg/mL RNase A and 50 μg/mL propidium iodide (Sigma-Aldrich) for 20 min. The resulting DNA histogram was examined and analyzed in a flow cytometry system (FACS Canto; BD Biosciences).
Statistical analysis
Data are expressed as the mean±standard deviation of the mean of independent experiments. Statistical analysis was carried out using Sigma Plot 12. Minimal statistical significance was defined at P<0.05.
Results
Secondary neural tube formation
We first conducted whole-mount immunohistochemistry of an E12.5 embryo using the NSC marker, Sox2, to elucidate the progression of secondary neural tube formation (Fig. 1A). At the caudal-most region of the tail bud, cell clusters located at the dorsal regions were labeled with Sox2, but they did not form neural tube-like structures (Fig. 1B). An image of the cross-sectioned caudal-most region clearly shows the Sox2-labeled cells in this area (Fig. 1B′). Rostrally, Sox2-labeled cells aggregated to form rosettes, and cavitation occurred to form the lumen of the secondary neural tube (Fig. 1C, C′). At this level, we also observed the presence of the notochord on the ventral side of the neural rosettes. Eventually, the entire lumen of the tube was formed and joined the primary neural tube (Fig. 1D, D′). The morphology of the primary neural tube at somite levels 30–36 from E12.5 mice was clearly different from the structures derived from secondary neurulation (Fig. 1F), while the morphology of the primary neural tube at E10.5 somehow resembled the secondary neural tube at somite level 47 (Fig. 1D′, E). These data support the distinct formation of the secondary neural tube in contrast with the primary neural tube, which is spatially associated along the longitudinal axis.
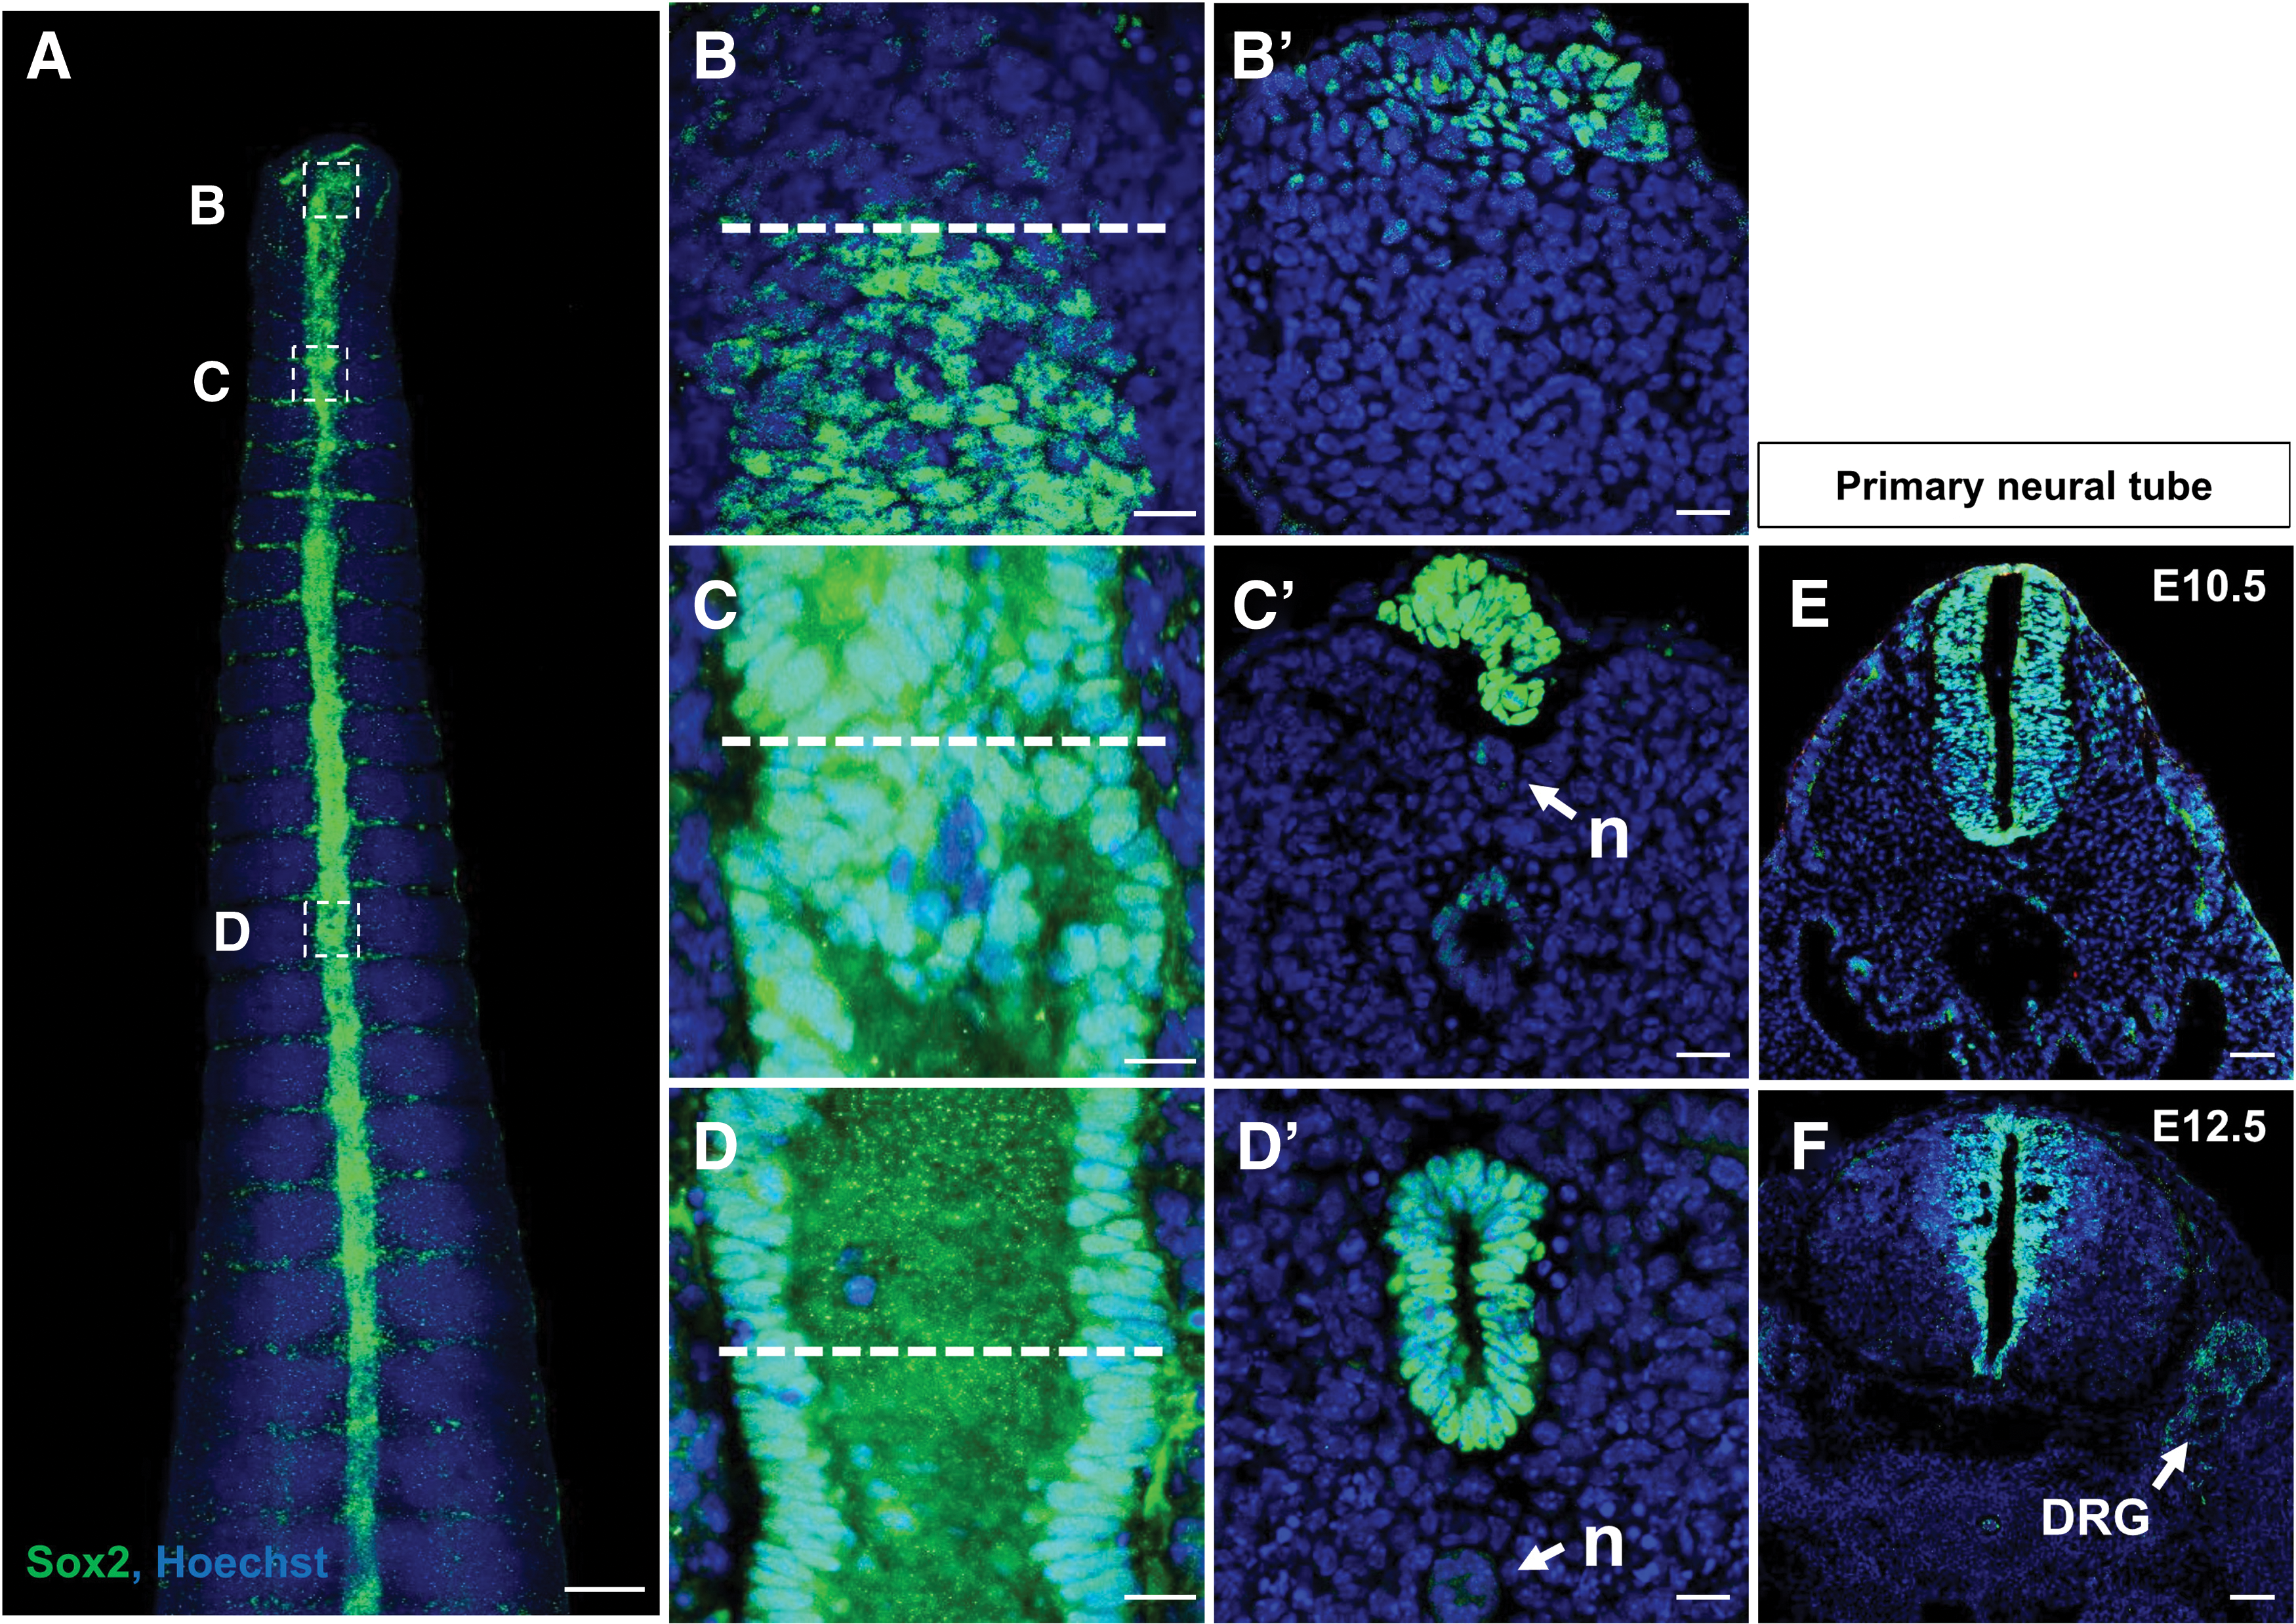
Mouse secondary NT formation.
Neurosphere formation from the embryonic tail bud in vitro
To test whether sNSCs in the embryonic tail bud can produce neurospheres, we performed conventional neurosphere culture in the presence of EGF/bFGF [22]. We successfully produced neurospheres from the tail bud below somite level 45, which contains secondary neural tube-derived NSCs, as well as from the cerebral cortex (Fig. 2A). The gross morphology of neurospheres from these two regions was similar. When we quantified the number of neurospheres derived from both sources, it was evident that the tail bud produced a significantly smaller number of neurospheres than the cerebral cortex, which was similar after passaging (Fig. 2B). We also noticed that neurospheres from the tail bud were significantly smaller than those derived from the cerebral cortex (Fig. 2C), suggesting that sNSCs produce fewer cells than cNSCs over a given time. However, sNSCs could be maintained and passaged at least six times (Fig. 2D), suggesting that NSCs in the secondary neural tube-derived pool have the ability to self-renew, although it is significantly inferior to that of brain NSCs. In addition, Sox2-expressing cells derived from the secondary neural tube were capable of generating three major neural cell lineages: neurons, astrocytes, and oligodendrocytes (Fig. 2E, F), indicating that these cells are indeed multipotent.
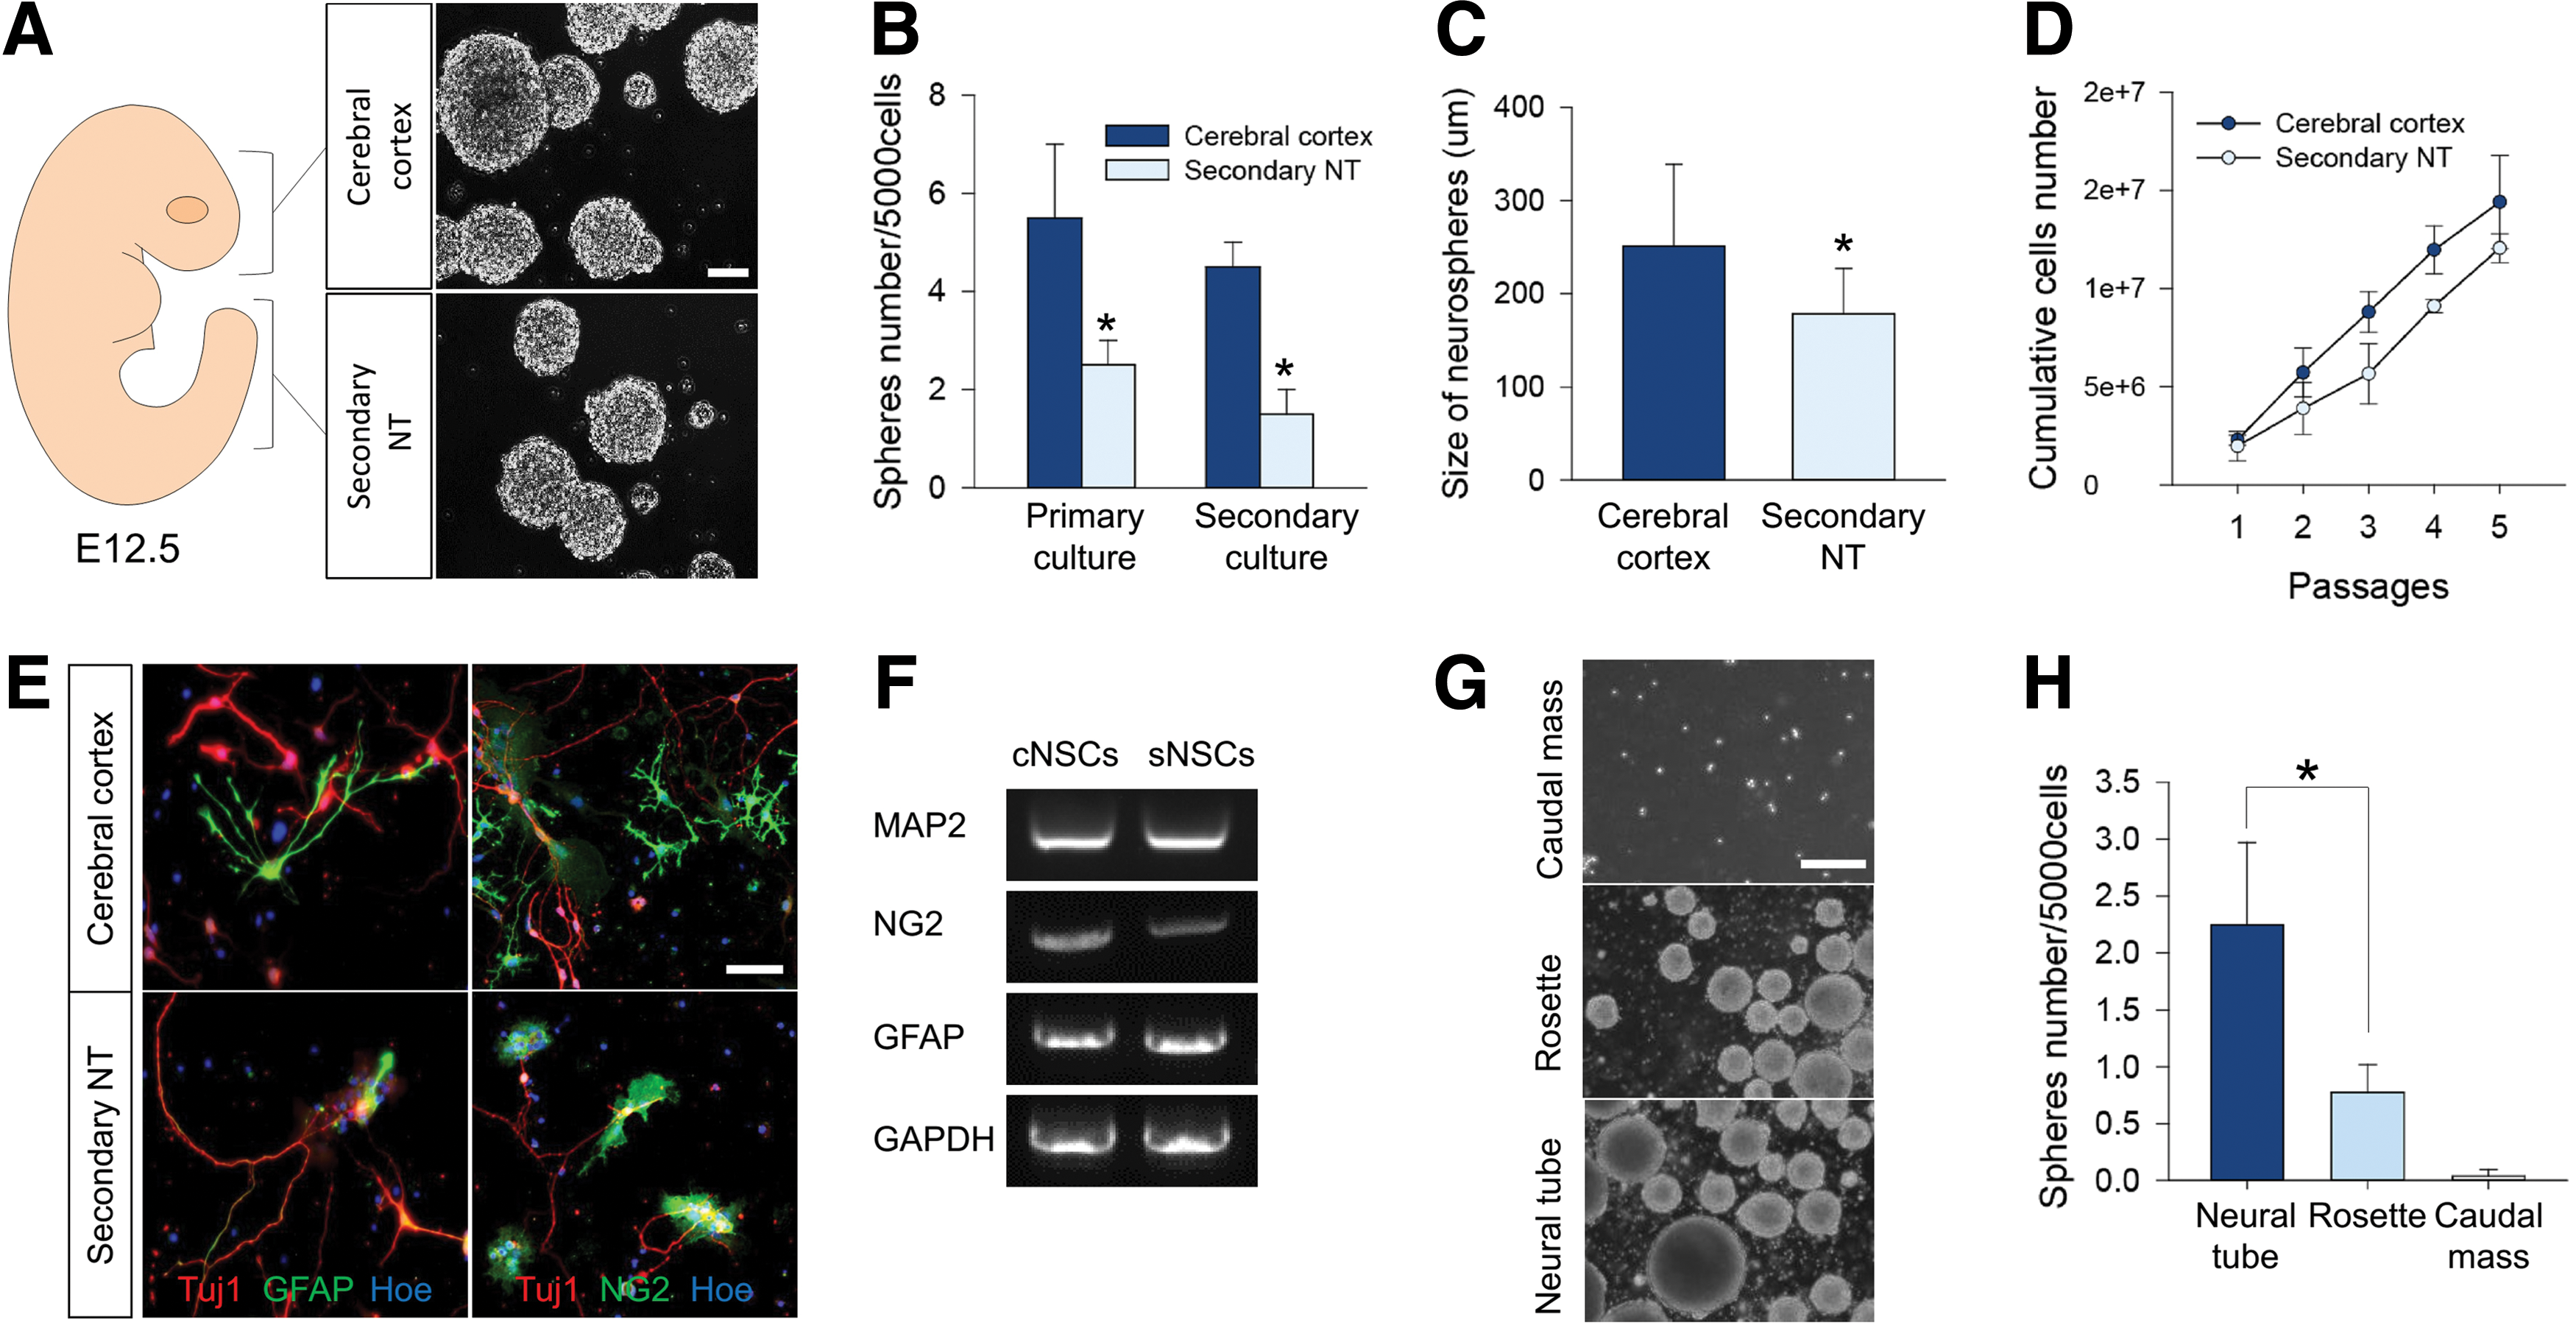
Generation of neurospheres from the embryonic tail bud.
We further asked whether different areas of the tail bud, as shown in Fig. 1, exhibit different neurosphere-generating potentials. To address this, we isolated and separately cultured tissues containing the cell mass, rosettes (at somite level 2 posteriorly), and the neural tube. Interestingly, the cell mass in the tail bud tip failed to generate neurospheres (Fig. 2G), whereas at the anterior rosette level, neurospheres readily formed, but at a significantly reduced number compared with those formed from the neural tube level at a similarly seeded cell number (Fig. 2H).
EGF and bFGF demonstrate similar effects on embryonic sNSCs in vitro
During the embryonic development of the brain, at least two different NSC populations are identifiable depending on their growth factor dependency. For example, NSCs are either dependent on the EGF or bFGF, and EGF-responsive NSCs can be derived from the bFGF-dependent NSCs [23]. In addition, different regions of the embryo require distinct signaling pathways for development, and ablation of the FGF receptor induces severe tail malformation [24]. Thus, we tested whether sNSCs exhibit different responses to growth factors. First, the expression of EGF and bFGF receptors in embryonic NSCs was analyzed by RT-PCR. Distinctions between the cerebral cortex and tail bud were confirmed by the selective expression of the regional markers; Hoxd10 (caudal maker) and Emx2 (rostral marker, and both receptors for EGF (EGFR1) and bFGF (FGFR1) were similarly expressed in both populations of embryonic NSCs (Fig. 3A, B).
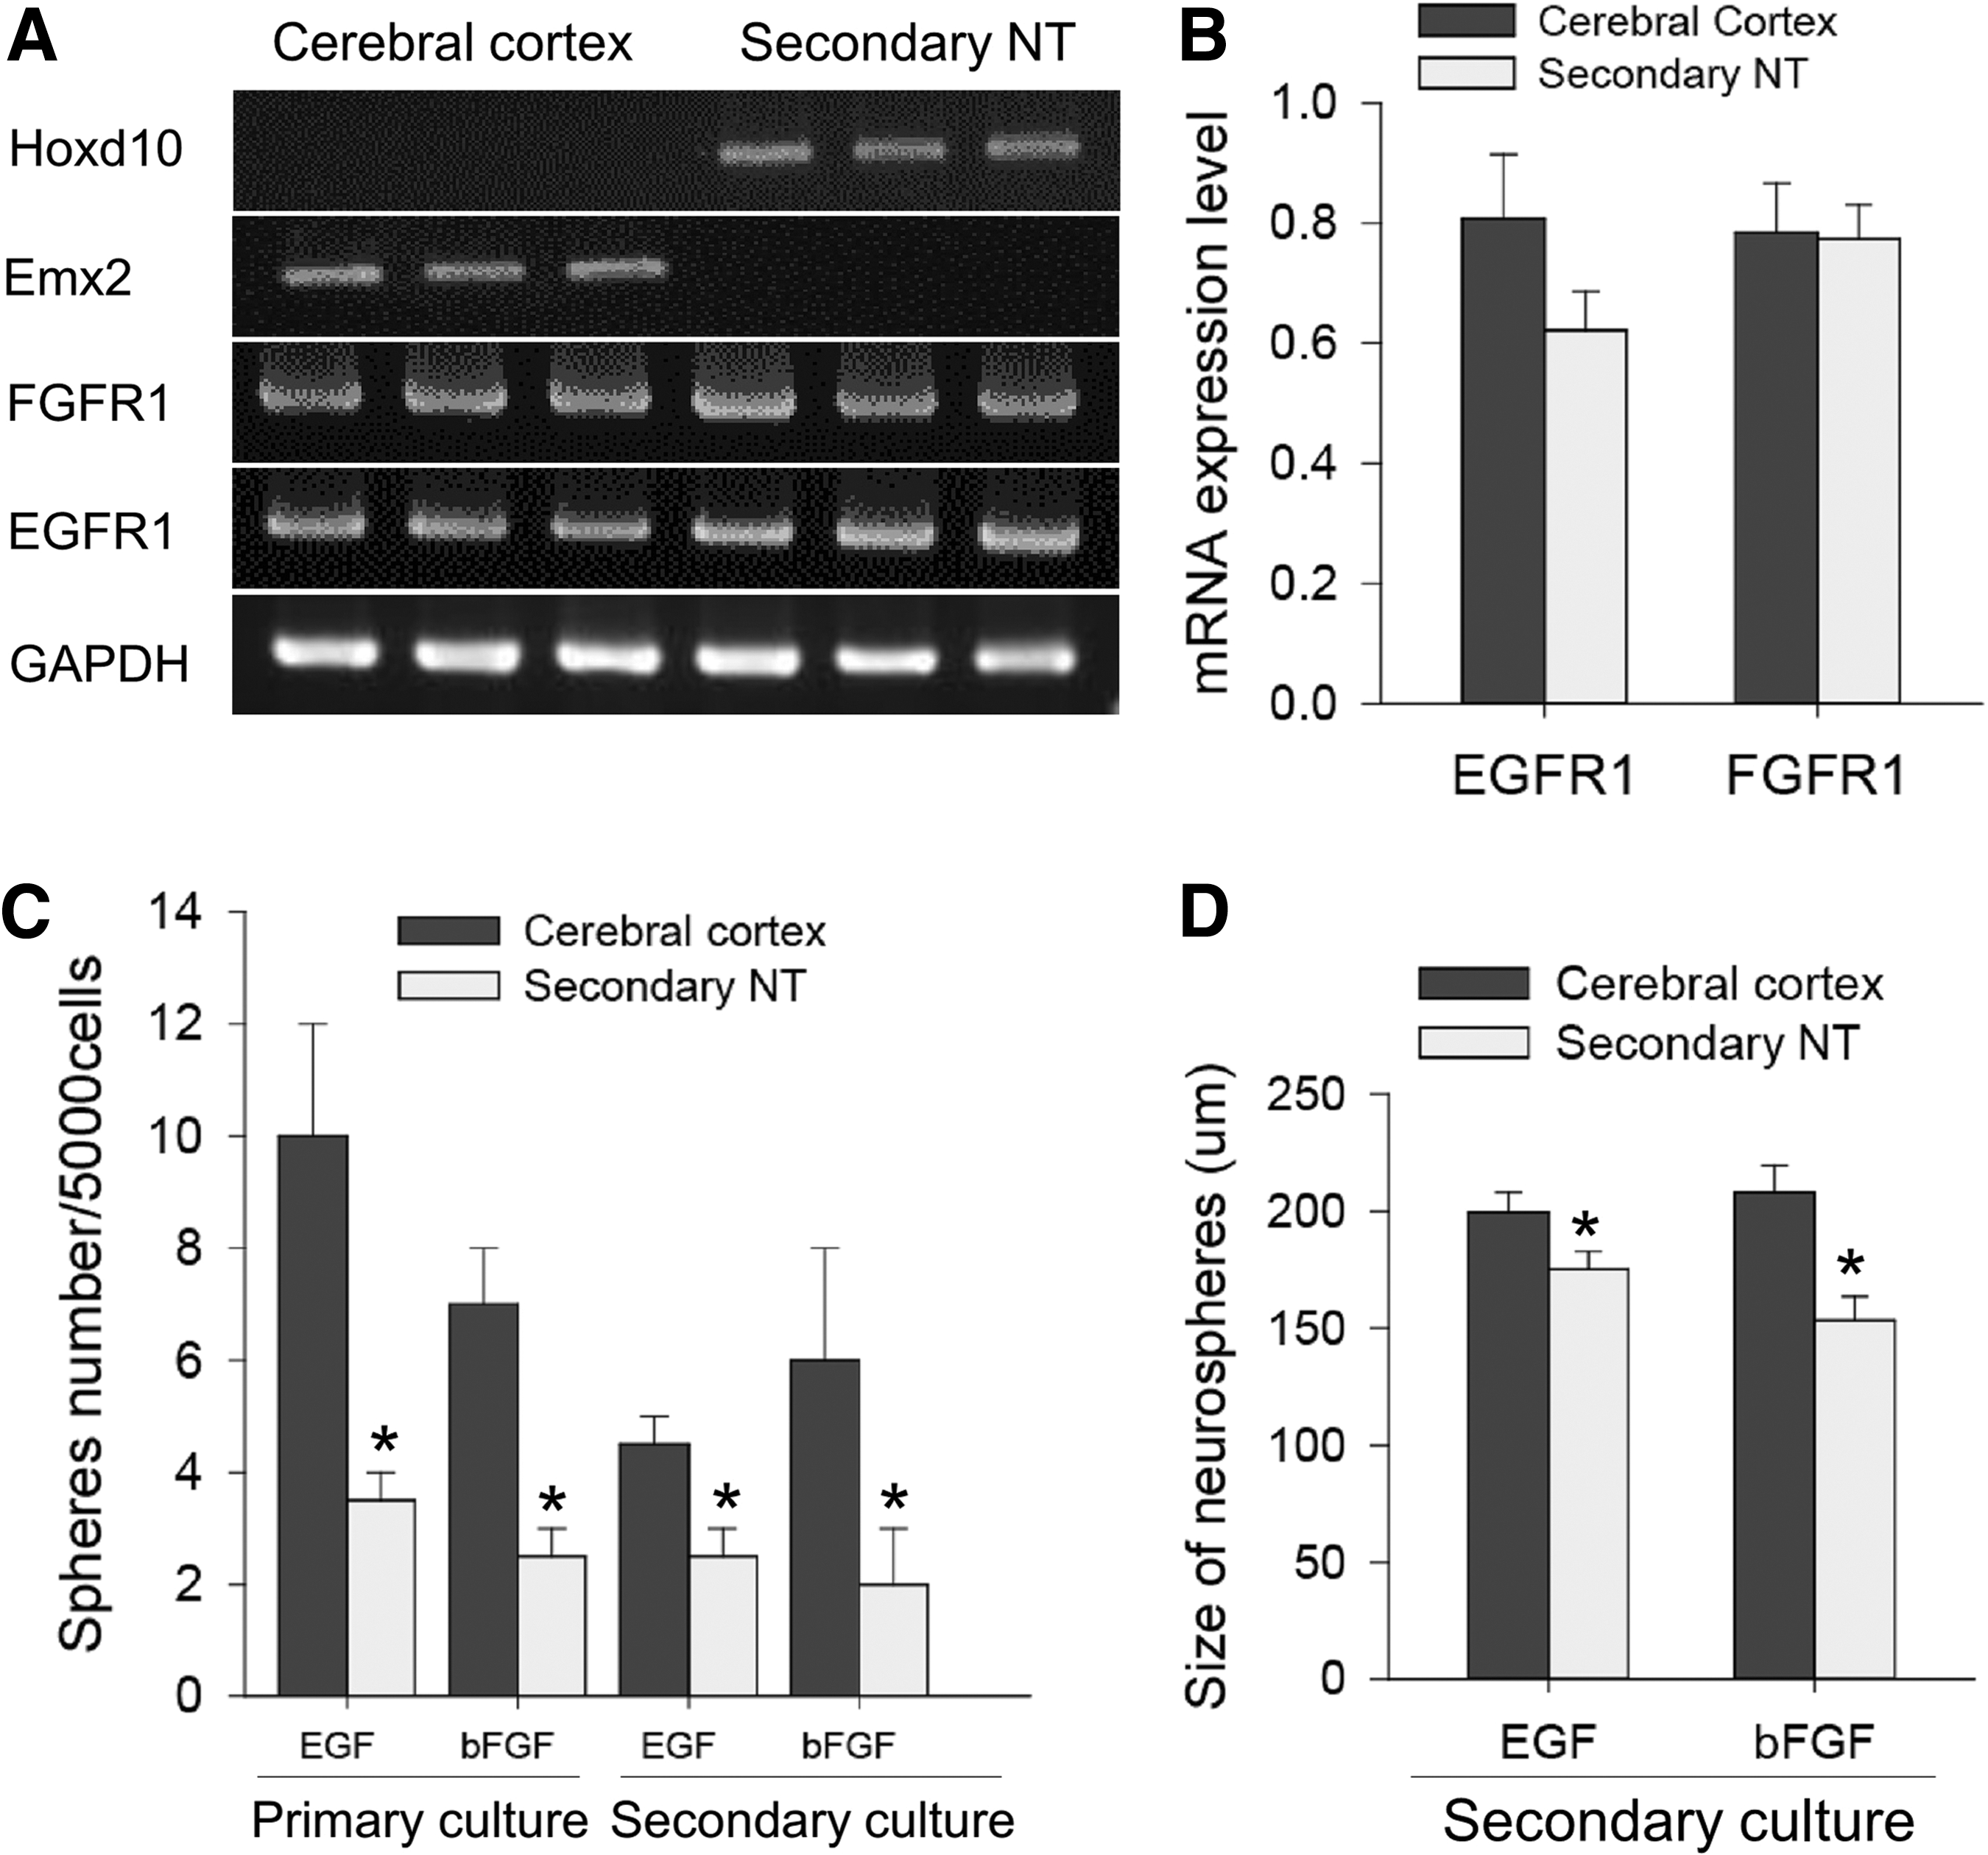
We further examined the number of bFGF- and EGF-dependent sNSCs by neurosphere assay in the presence of a single growth factor (Fig. 3C, D). With either EGF or bFGF alone, significantly smaller numbers of neurospheres formed from the sNSC population (Fig. 3C), suggesting that both EGF- or bFGF-dependent NSCs are present in the secondary neural tube area, although they are small in number. In addition, sNSC-derived neurospheres exhibited significantly (t-test P>0.05) smaller diameters than cNSC-derived neurospheres (Fig. 3D). These data suggest that both EGF- and bFGF-dependent NSCs behave similarly and that a small neurosphere size in the presence of EGF/bFGF is unlikely due to different proportions of distinct NSC populations.
Rate of proliferation of sNSCs in vitro
Next, we assessed the proliferation of sNSCs in the presence of EGF/bFGF. We performed RT-PCR to detect the amount of mRNA of selected genes (cyclin B, cyclin Ds, p27, and p21) known to regulate the cell cycle (Fig. 4A, B). Expression levels of cyclin B, cyclin D2, p27, and p21 did not differ between the two groups. However, we found that cyclin D3 was upregulated in sNSCs (Fig. 4B). Conversely, expression of cyclin D1 was significantly downregulated in sNSCs, which might compensate for the reduction of Cyclin D3 expression (Fig. 4B). For BrdU labeling, neurospheres were dissociated and plated on a coverslip coated with PDL and laminin, and BrdU was added for 1 h to label S-phase cells. Under EGF/bFGF-containing culture conditions, however, sNSCs and cNSCs exhibited a similar proportion of BrdU-labeled cells (Fig. 4C). Consistently, we failed to detect any significant differences in the proportion of cell cycle phases in two groups as explored by FACS analysis (Fig. 4D). These data strongly suggest that sNSCs exhibit similar cell cycle progression profiles to those of cNSCs. Changes in the average diameter of neurospheres derived from sNSCs are not apparently due to differences in proliferation potential.
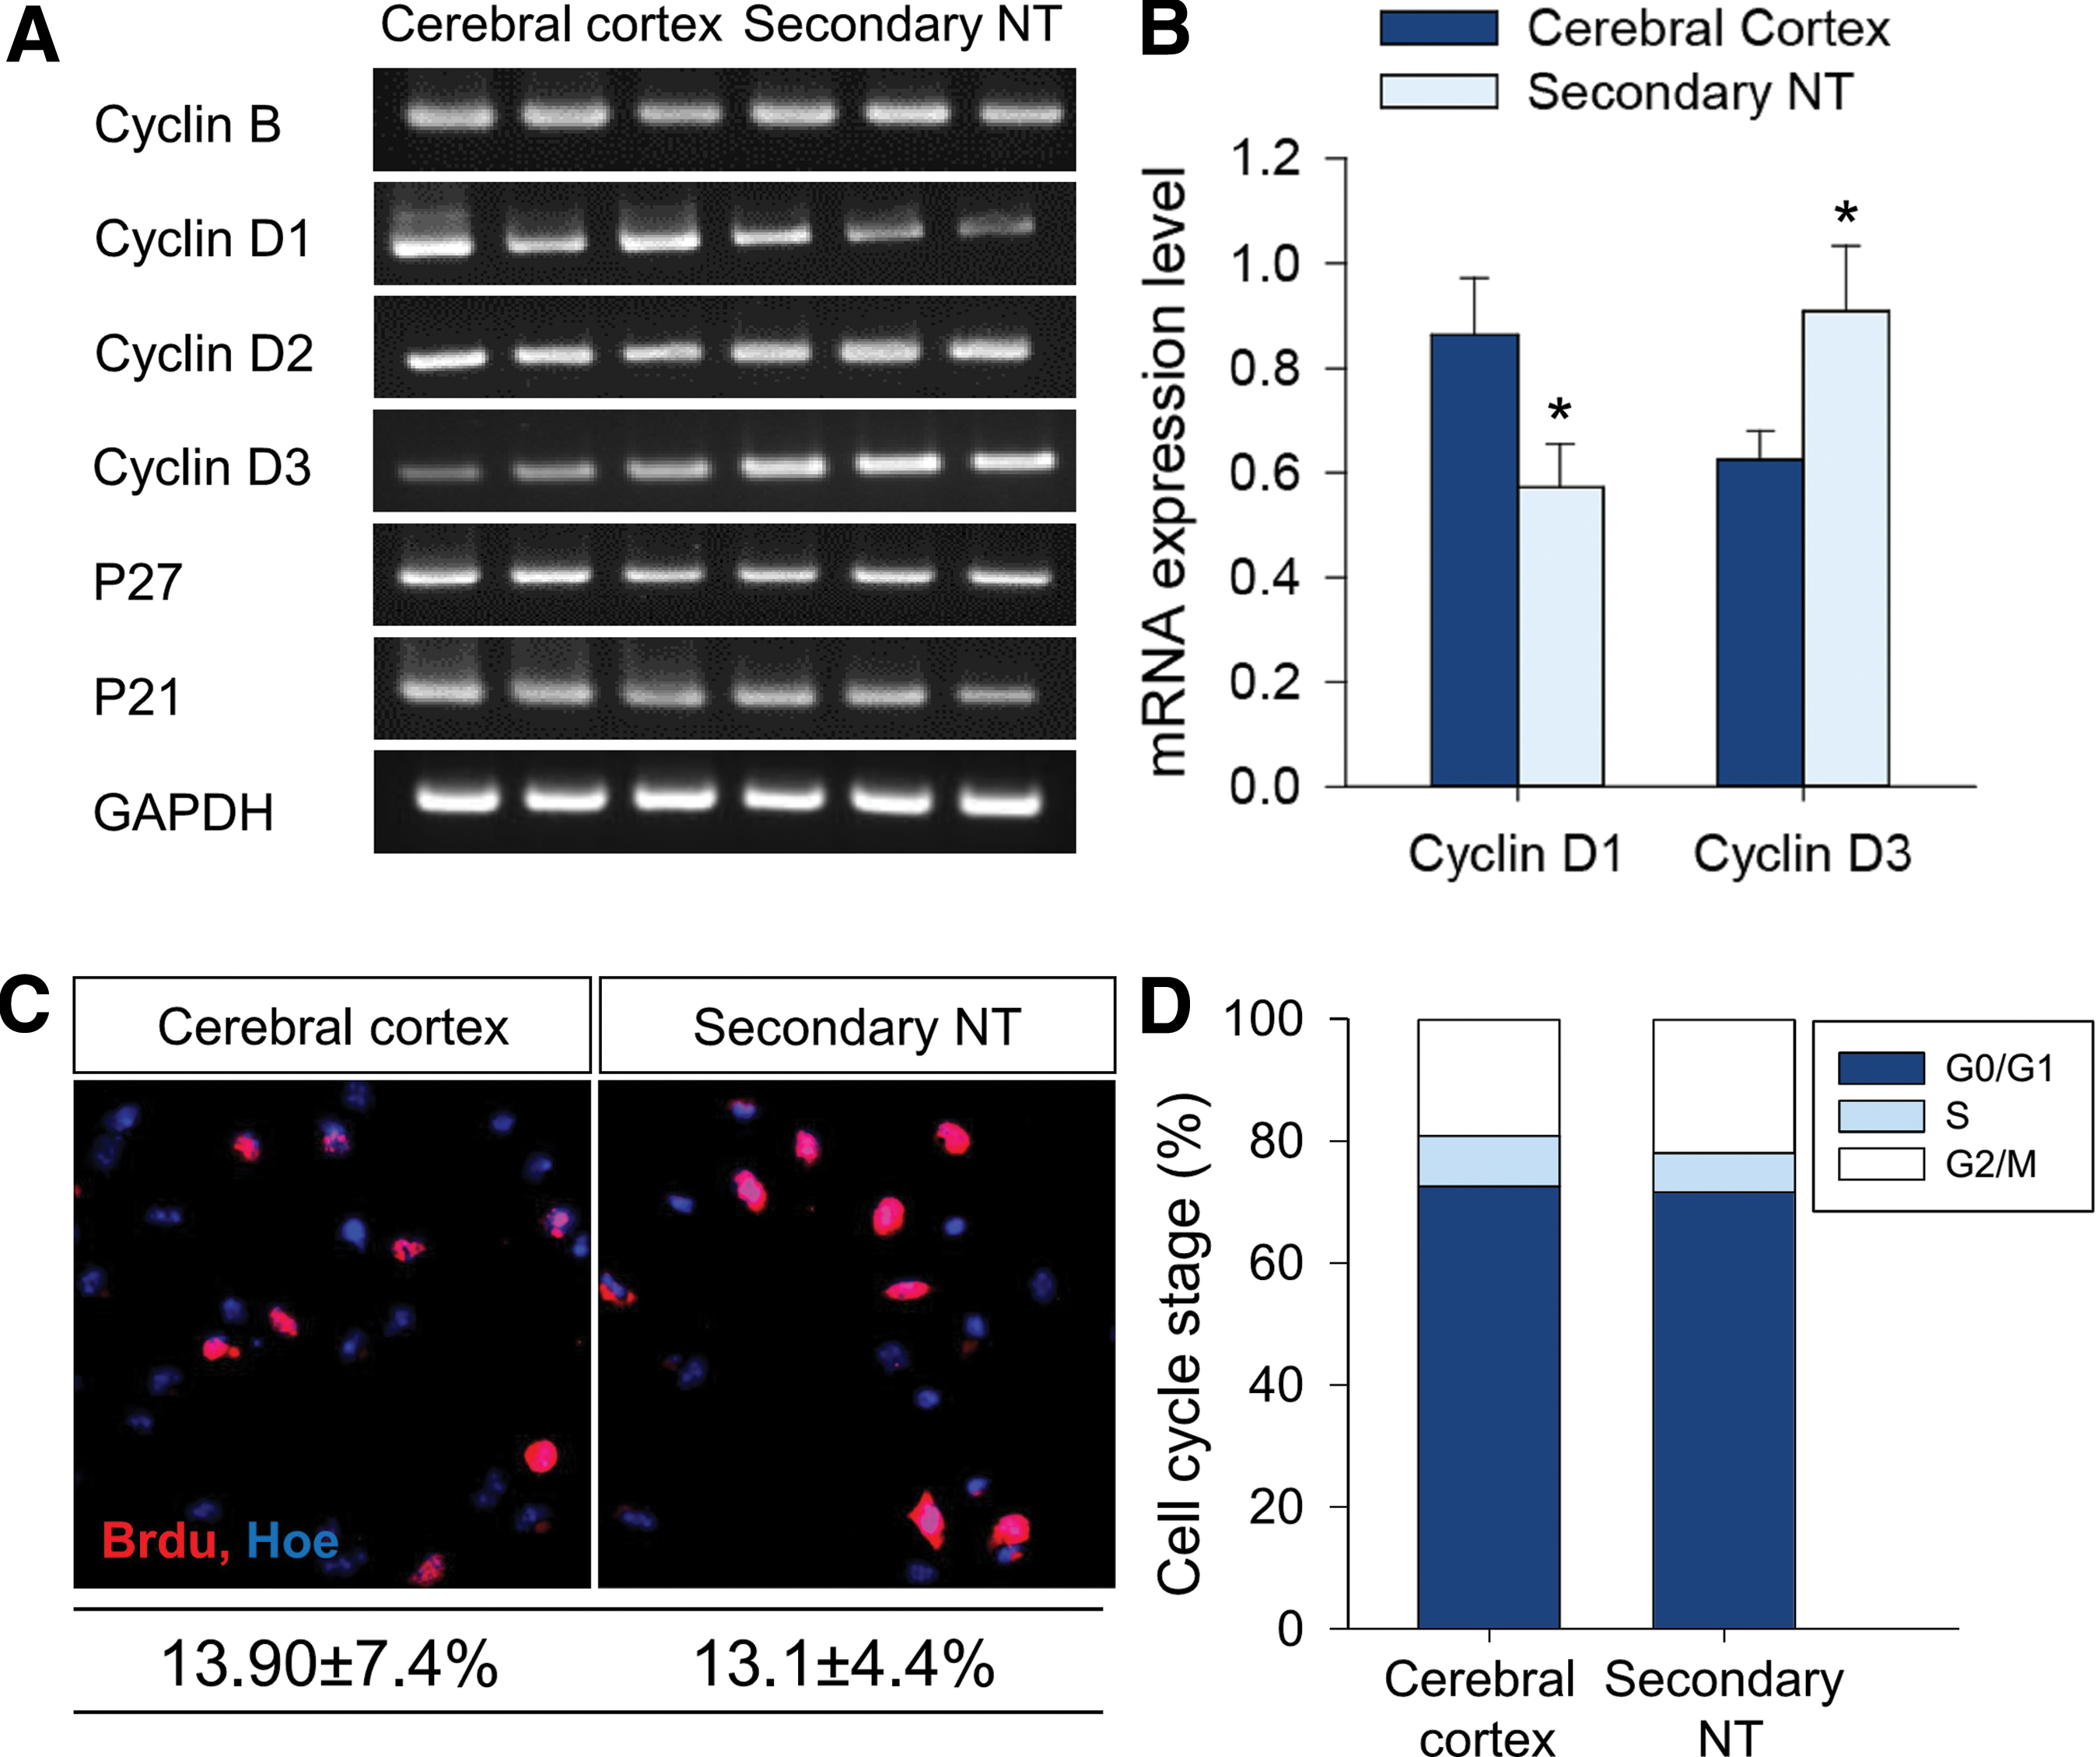
Cell cycle analyses of sNSCs in vitro.
sNSCs display enhanced differentiation in vitro
We then hypothesized that a subset of sNSCs might spontaneously differentiate into neural progenitors/neuroblasts that exhibit limited proliferation potential and eventually exit the cell cycle. To address this, we collected neurospheres from the cerebral cortex and secondary neural tube on day 6, and analyzed Sox2 and S100β expression as markers for NSCs and differentiated neural progenitors, respectively. We found that a small subset of cells began to express S100β and Sox2, whereas some cells appeared to completely lose Sox2 expression. The S100β-expressing cell layers were considerably thicker in neurospheres derived from the secondary neural tube (Fig. 5A). Because the cytoplasmic distribution of S100β made accurate quantification difficult, we estimated the proportion of Sox2-expressing cells and found that virtually all cells in the neurospheres from the cerebral cortex expressed Sox2, whereas about 20% of cells in the neurospheres from the secondary neural tube lost Sox2 expression (Fig. 5B). These data suggest that sNSCs have a higher tendency to divide asymmetrically and generate progenitors with limited proliferation potential than cNSCs.
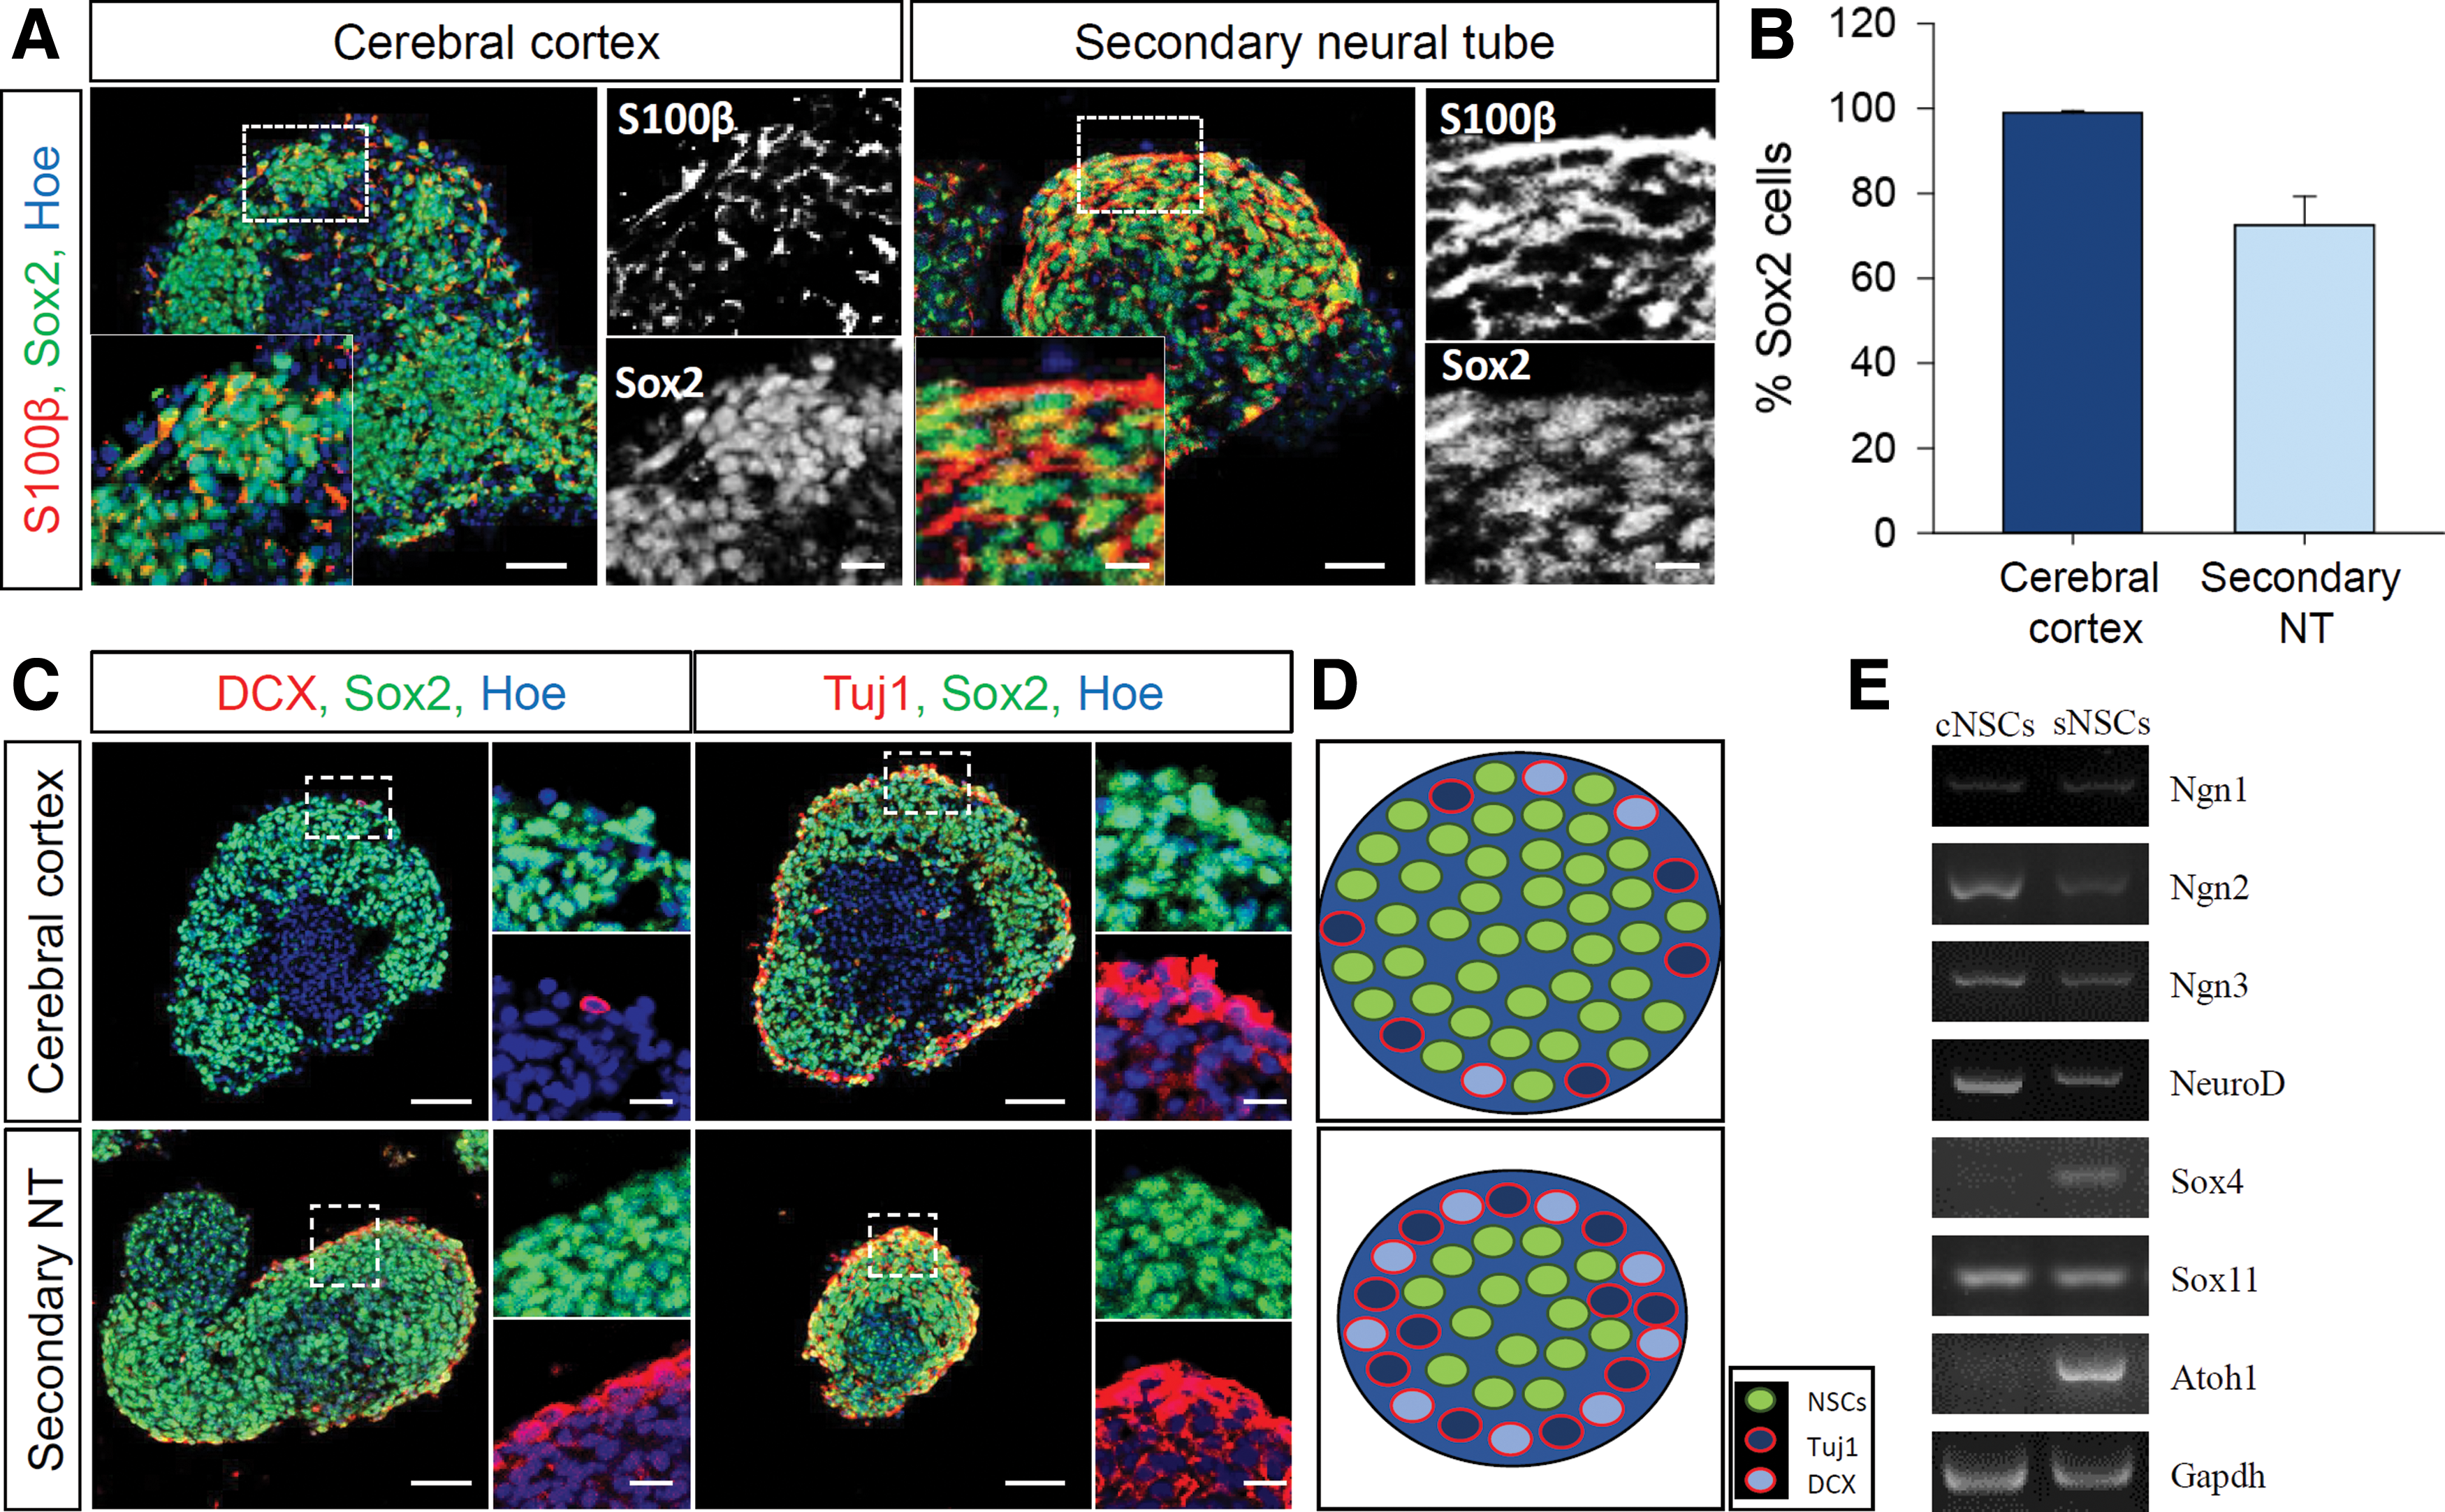
Distribution of stem/progenitor cells within neurospheres.
To examine sNSC commitment, neurospheres were immunostained with neuroblasts immature neuron markers, DCX and Tuj1 respectively. Consistent with the abundance of S100β-expressing cells in secondary neural tube-derived neurospheres, these neurospheres exhibited substantially more DCX- and Tuj1-labeled cells (Fig. 5C). These data suggest that sNSC-derived neurospheres are more prone to generate neuronal cells. The distributions of different cell populations in the NSCs are summarized in Fig. 5D.
The gene expression profile of the mouse embryonic tail region has been largely neglected. As such, it has never been identified which proneuronal gene family regulates the neuronal fate of sNSCs. Due to higher fraction of NPCs in the sNSC colony, we have further examined the well-known proneuronal gene family members (Fig. 5E). While we failed to find a distinct expression level of the basic helix–loop–helix (bHLH) domain containing neurogenic transcription factors (Neurog1-3 and NeuroD) and Sox11 between cNSC and sNSC groups, expression of Sox4 and Atoh1 was markedly higher in sNSCs. These data suggest that Sox4 and Atoh1 may play significant roles in the spontaneous differentiation of sNSCs into neurons.
Progenitors in sNSC-derived neurospheres maintain proliferation ability
Although we found that a substantial subset (>20%) of cells differentiated into progenitors/neuroblasts in the neurospheres from the tail bud, their overall cell proliferation rate, as assessed by BrdU labeling or FACS analyses, remained relatively unaltered. Therefore, we sought to examine whether these Sox2-negative cell populations also proliferate. To address the proliferation potential within expanded neurospheres, sectioned neurospheres were immunostained with Ki67, a marker of proliferating cells, and Sox2 (Fig. 6A). Quantification of the proportion of Ki67-positive cells revealed no significant differences between the two neurosphere populations (Fig. 6B). However, when we quantified the proportion of Ki67-positive cells among the Sox2-negative cells, we found that about 20% of Sox2-negative cells were proliferating in the sNSC colony, whereas this population was absent in the cNSC colony (Fig. 6C). These data indicate that sNSC-derived neuronal progenitors maintain proliferative ability.
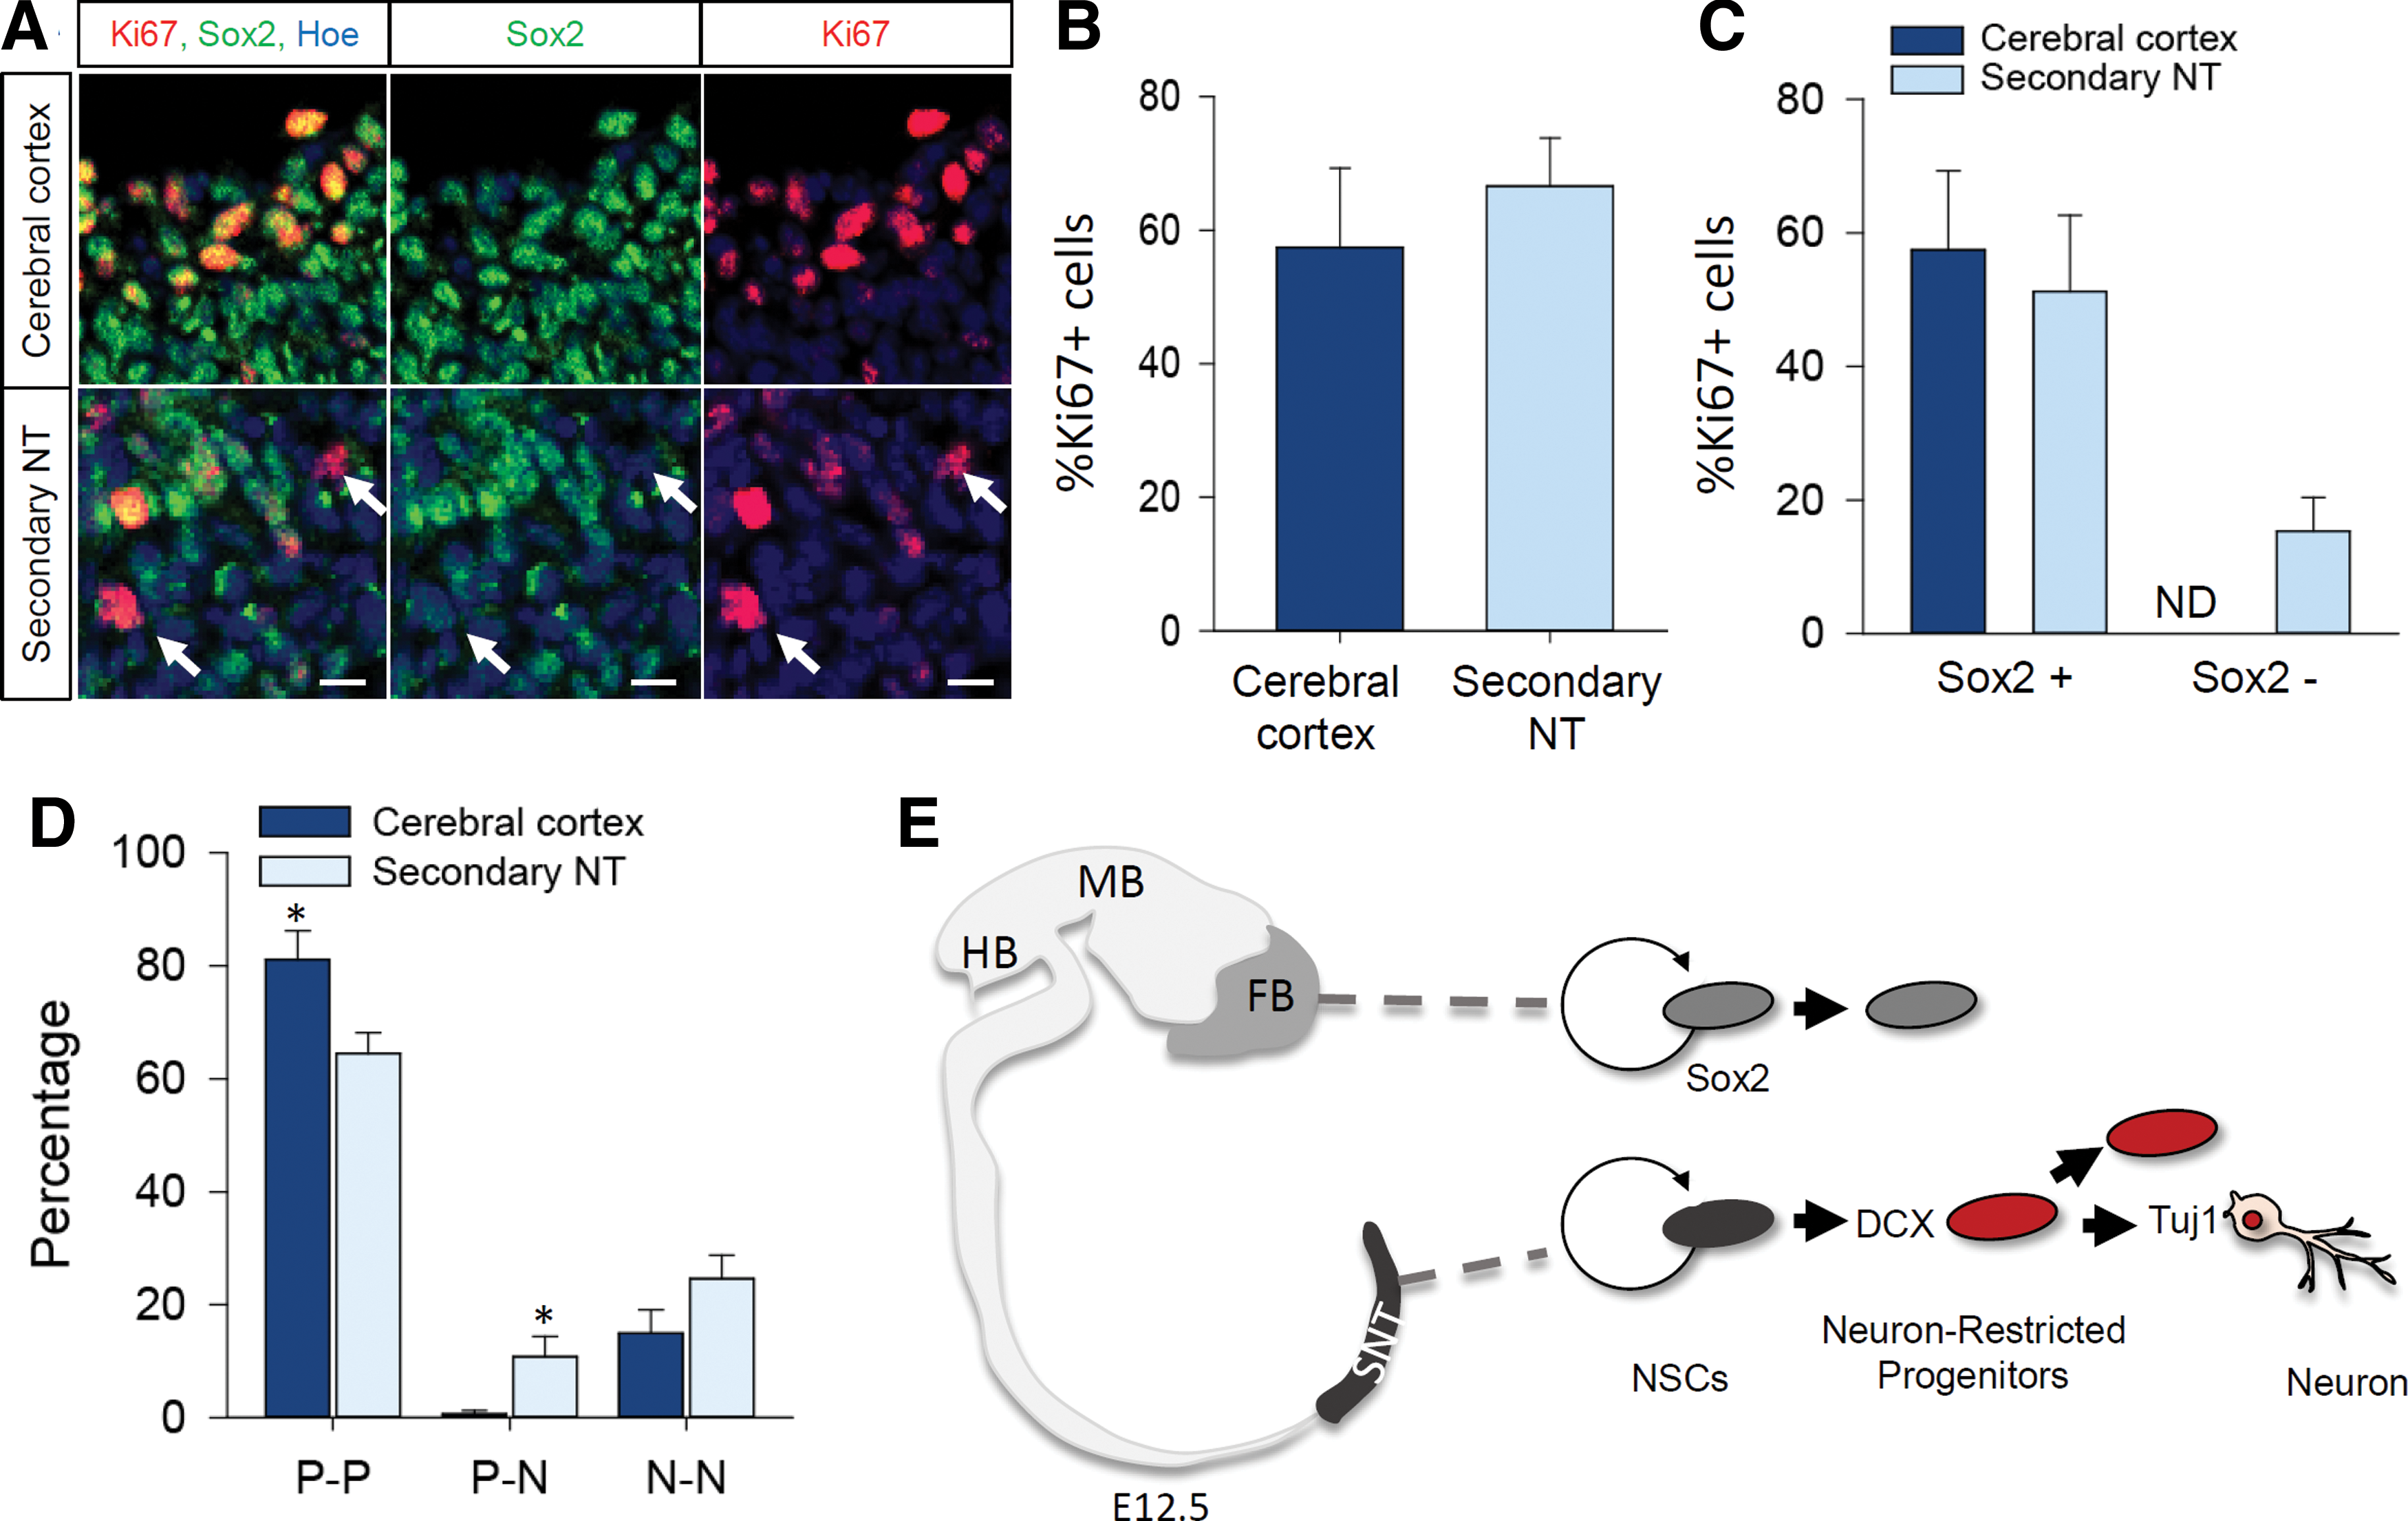
Proliferation of neuronal progenitor cells.
Having found that a fraction of sNSCs displayed neuronal progenitor commitments (Fig. 5C), we asked whether sNSCs demonstrate cell fate specification and asymmetric cell division. To test whether sNSCs exhibit asymmetric division, we adopted an assay, which has been used widely to clearly assess symmetric versus asymmetric cell division [21,25]. We examined the expression of tuj1 and nestin in dividing daughter cells under the NSC proliferation condition. Interestingly, we found that asymmetric cell division is significantly higher in sNSCs, but to a much lesser extent in cNSCs during the mitotic phase (Fig. 6D). These data suggest that sNSCs generate neuronal progenitors in a higher fraction than cNSCs. This ratio of asymmetric sNSC division coincides well with our finding that sNSCs demonstrate an enhanced differentiation rate with proliferation ability at this developmental stage.
Discussion
The brain and spinal cord distinguish themselves from each other and continually become more specialized. Many studies have demonstrated that developmental regionalization signals affect and produce NSC heterogeneity in the brain [26]. For example, NSCs in the anterior domain of the telencephalon express Pax6 [27,28], whereas posterior NSCs express Otx2 [29]. Likewise, NSCs in the caudal region of the CNS express regional markers such as Hox [30]. These regionalized signals appear to be maintained following in vitro expansion, indicating that these regionalized signals are cell autonomous. However, NSCs of the secondary neural tube have never been explored in detail. In this study, we addressed whether embryonic NSCs derived from primary (brain) and secondary (tail bud) neural tubes are similar.
The cranial and caudal parts of the amniote neural tube are formed by completely distinct mechanisms, termed as primary and secondary neurulation, respectively. Sequential events of convergent extension, elevation, bending, adhesion, and fusion mark the unique process of neuroectoderm morphogenesis to form the primary neural tube [31]. Primary neurulation occurs at a very early stage of development, during which all anterior tissues and a large proportion of the posterior CNS are derived. On the other hand, the most-caudal portion of the CNS is formed by secondary neurulation [32]. It is believed that the node and primitive streak consolidate to give rise to the tail bud where mesenchymal cells are enriched. Histological studies indicate that cavitation of mesenchymal cells induces the formation of the lumen of the secondary neural tube that rostrally joins the primary neural tube [3]. We have also found an aggregation of NSCs in the dorsal tail bud, which exhibit epithelization to form rosette-like structures, forming the secondary neural tube. As the junction of the primary and secondary neural tubes is localized at somite level 36 during E12.5 [17], we utilized the region of the tail bud below somite level 36 to completely exclude the neural tube derived from primary neurulation.
To generate and expand NSC colonies in vitro, neurosphere cultures were used in this study, allowing single NSCs to proliferate and form free-floating three-dimensional colonies [33,34]. A neurosphere assay is considered an excellent tool to obtain and expand NSCs and test their properties. As such, two types of NSCs have been identified: FGF and EGF dependent [22]. The readouts of the neurosphere assay are size (representing their proliferating potential) and number of spheres (representing the number of sphere-forming NSCs) [34]. In this study, we first showed that the secondary neural tube domain had fewer NSCs with self-renewal capacity. In addition, we also found that an endogenous population of NSCs in the secondary neural tube was smaller than that in the cerebral cortex. The average diameter of sNSC-derived neurospheres was smaller than that derived from cNSCs. This inability to generate neurospheres with similar diameters was neither due to the different subtypes of growth factor-dependent NSCs nor due to different proliferation profiles, as revealed by RT-PCR, BrdU labeling, and FACS analyses. While we failed to identify significant differences in the two populations with the above-mentioned tests, we found that the expression levels of cyclin D1 and D3 were significantly and inversely altered in sNSCs. Consistent with our current observations, the endogenous level of cyclin D3 was shown to be more abundant in the spinal cord than in the brain [35,36], suggesting that the upregulation of cyclin D3 appears to be a regional signature of the caudal CNS. In this respect, reduced expression levels of cyclin D1 might compensate for enhanced cyclin D3 expression levels in sNSCs.
Not all NSCs, however, maintain their identity during in vitro culture, and a subset of NSCs appears to asymmetrically divide to generate neural progenitor cells with restricted differentiation potentials. A previous study showed that neurospheres derived from different domains of the CNS had distinct proliferation and differentiation rates in vitro [10]. Our results demonstrate that sNSC-derived neurospheres contain more neural progenitors and neuroblasts labeled by S100β, DCX, and Tuj1. The gradual shift from purely symmetrical self-amplifying divisions of NSCs to asymmetrical divisions that generate progenitors and neurons is dependent on the regions and developmental stages (Fig. 6D) [37]. Given the ability of progenitor cells to proliferate as well, we found that many proliferative neuron-restricted progenitors were accompanied by fewer proliferative NSCs in neurospheres derived from sNSCs than from cNSCs. Additionally, the time required for the development of the cerebral cortex is markedly long compared with spinal cord development [38,39], and E12.5 is the time for the cerebral cortex to generate a large pool of NSCs for further expansion [14,40,41]. On the other hand, sNSCs presented in this study are committed to the production of progenitor cells. This was additionally supported by symmetry versus asymmetry division assay, providing further evidence that sNSCs display enhanced asymmetric division for the spontaneous generation of NPCs.
In adult and developing CNS, proneuronal genes are expressed in progenitor cells that already acquired neuronal identity. We found strong expression of Neurog2 in cultured cNSCs compared with the sNSCs, although a smaller fraction of tuj1-positive cells was found in the cNSC colony. It is known that proneuronal genes are expressed in a regionalized manner, especially Neurog2, which appears to play critical roles in the brain development. For instance, knockout of Neurog2 causes multiple defects of brain development, including mesencephalic of dopaminergic neuron system development [42,43], and dentate gyrus [44], while the development of the spinal cord is spared. On the other hand, we found that Sox4 and Atoh1 expression was strong in the sNSCs, suggesting that these could be the transcription factors, which act in the stream of sNSC neuronal fate determination. Sox4 and Sox11 expressed in the committed neuronal cells and suggested to control neuronal differentiation [45]. Atoh1 is another proneuronal bHLH transcription factor [46]. Our study implies that Sox4 and atoh1 may function in a combinational manner to specify neuronal identity in the developing tail. Further functional studies are required to elucidate the molecular mechanism of neuronal induction in the developing tail.
Immunocytochemical analyses illustrate a zonal distribution of NSCs and progenitor cells: Those differentiated cells expressing DCX or Tuj1 preferentially localize at the edges of neurospheres (Fig. 5D). In human embryonic stem cell-derived neurospheres, nestin-expressing cells were peripherally distributed, whereas GFAP and Tuj1 expressing cells resided in the centers of the neurospheres [47]. However, when these spheres were left to differentiate, Tuj1 cells migrated to the edges of the spheres [47]. Another study also demonstrated a similar pattern of cell distribution depending on their differentiation status in postnatal, ventricular zone-derived neurospheres [48]. Adult, olfactory bulb-derived neurospheres have a peripheral distribution of progenitor glial cells, including nestin-, GFAP-, and O4-labeled cells, whereas neuronally restricted progenitors are located mainly at the centers of the neurospheres [49]. These data suggest that NSCs maintain self-organizing properties, and neurospheres thus exhibit a high complexity of cell type. Considering that the microenvironments of the surface versus the center of the neurospheres are strikingly different in many respects, including growth factor dependence, nutrient requirements, oxygen concentrations, and cell–cell adhesions, these factors might differentially affect the proliferation and differentiation properties of NSCs from different origins. Further study is required to identify the signaling pathway that determines the cellular compositions and distributions of neurospheres.
In tail development, signals provided by the microenvironment regulate tail growth through a tight balance of proliferation and differentiation of progenitor cells, presumably including NSCs within. The development of the tail has been reported to be influenced by morphogens, such as Brachyury T [50], Wnts [51], BMPs [52], and FGFs [24]. For instance, Wnt3a and Netrin1 were shown to be expressed in the secondary neural tube at E12.5 [17], and Netrin1 receptor was reported to have a correlation with neurogenin induction [53]. In the adult NSCs, Netrin1 contributes to the commitment and migration of NPCs [54]. On the other hand, Wnt3a promotes the differentiation of neurosphere cells and human NSCs into neurons and glia [55,56]. The behavior of neural crest cells (NCCs) derived from the secondary neural tube in vitro suggests higher tendency to differentiate and generate neurons with a sensory identity in contrast to primary neural tube-derived NCCs [57]. This is consistent with our current findings that embryonic cells in the secondary neural tube domain are intrinsically different in contrast to the primary neural tube, with higher differentiation sympathy. One study reported that caudal neural tube-derived NSCs under differentiation culture condition generated a higher percentage of glia than neurons [13], which is in contrast to our current observations. Considering that these two studies were executed at different developmental stages and regions of the spinal cord (E12.5 tail in our study vs. E14.5 spinal cord in the previous study), this might further illustrate the spatiotemporal dynamics of NSC specification in the spinal cord.
Footnotes
Acknowledgment
This research was supported by the Brain Research Program through the National Research Foundation of Korea (NRF) funded by the Ministry of Science, ICT and Future Planning (NRF-2012M3A9C6049933 and NRF-2013R1A1A3011896).
Author Disclosure Statement
No competing financial interests exist.