
Abstract
The ability of human mesenchymal stromal/stem cells (hMSCs) to differentiate into various mesenchymal cell lineages makes them a promising cell source for the use in tissue repair strategies. Since the differentiation potential of hMSCs differs between donors, it is necessary to establish biomarkers for the identification of donors with high differentiation potential. In this study, we show that microRNA (miRNA) expression levels are effective for distinguishing donors with high differentiation potential from low differentiation potential. Twenty hMSC donors were initially tested for marker expression and differentiation potential. In particular, the chondrogenic differentiation potential was evaluated on the basis of histological matrix formation, mRNA expression levels of chondrogenic marker genes, and quantitative glycosaminoglycan deposition. Three donors out of twenty were identified as donors with high chondrogenic potential, whereas nine showed moderate and eight showed low chondrogenic potential. Expression profiles of miRNAs involved in chondrogenesis and cartilage homeostasis were used for the distinction between high-performance hMSCs and low-performance hMSCs. Global mRNA expression profiles of the donors before the onset of chondrogenic differentiation revealed minor differences in gene expression between low and high chondrogenic performers. However, analysis of miRNA expression during a 7-day differentiation period identified miR-210 and miR-630 as positive regulators of chondrogenesis. In contrast, miR-181 and miR-34a, which are negative regulators of chondrogenesis, were upregulated during differentiation in low-performing donors. In conclusion, profiling of hMSC donors for a specific panel of miRNAs may have a prognostic value for selecting donors with high differentiation potential to improve hMSC-based strategies for tissue regeneration.
Introduction
H
Unfortunately, large interdonor variation of the differentiation potential is a general complication for the practical implementation of hMSC-based tissue engineering approaches [8,9]. Donor age, method or location of harvest, culture conditions, and culture time are known to affect the differentiation potential of hMSCs [10 –16]. Jansen et al. suggested that distinctions in mRNA gene expression profiles might be predictive for the differentiation potential [17]. However, specific biomarkers indicative for the differentiation potential of undifferentiated hMSCs remain to be defined.
Studies on the genetic and epigenetic mechanisms that control the differentiation potential of hMSCs have focused on characterizing variation in both mRNA and miRNA expression levels [18 –21]. MicroRNAs (miRNAs) control cell fate by negatively regulating protein accumulation through effects on the stability and/or translation of mRNAs for transcription factors and their phenotypic target genes. Hence, miRNAs are very relevant molecular candidates for mapping the proliferation and differentiation potential of hMSCs.
In this study, we tested a series of bone marrow-derived hMSCs from a cohort of donors for their potential to undergo chondrogenesis. This cohort has previously been characterized in great detail with respect to the osteogenic, adipogenic, endothelial cell differentiation potential and CD marker expression [22,23] and meets the criteria proposed by the Mesenchymal and Tissue Stem Cell Committee of the International Society for Cellular Therapy [24]. Similar to differentiation into other cell types, the chondrogenic potential varied significantly between donors.
The biological properties of these hMSCs were correlated with global mRNA expression profiles using microarray assays and quantitative polymerase chain reaction (qPCR) expression analysis of a select panel of miRNAs. To permit identification of miRNAs with a predictive value for chondrogenic differentiation, we examined miRNA expression both before the onset of differentiation and after the induction of chondrogenic differentiation at day 7 in pellet culture. We found that miRNA profiling of hMSC donors and patients may have a prognostic value in regenerative medicine by permitting identification of hMSCs that are most effective in supporting differentiation.
Materials and Methods
Cell expansion and differentiation
The use of human bone marrow aspirates was approved by the local medical ethics committee with written informed consent by the donors [25]. Aspirates were retrieved during total hip replacement surgery from the acetabulum or iliac crest (average age: 52 years, 25% male and 75% female). Aspirates were resuspended using a 20G needle and plated at a density of 0.5 million mononucleated cells/cm2. MSCs were selected by plastic adherence in proliferation media [alpha modified minimum essential medium, 10% fetal bovine serum (Lonza), 0.2 mM ascorbic acid, 2 mM
Chondrogenic differentiation
To induce chondrogenic differentiation, 250,000 hMSCs were seeded in round-bottom 96-well plates [26] at passage 2. Pellets were formed by centrifugation (500 rcf, 5 min) and maintained in chondrogenic differentiation media. This medium consists of Dulbecco's Modified Eagle's Medium supplemented with 40 mg/mL of proline, 50 mg/mL ITS-premix, 50 mg/mL of ascorbic acid, 100 mg/mL of sodium pyruvate, 100 U penicillin/mL, 100 mg/mL streptomycin, 10 ng/mL of transforming growth factor-β, and 10−7 M of dexamethasone. Cells were cultured for 4 weeks for determination of glycosaminoglycan (GAG) deposition (quantitative and qualitative) and qPCR of chondrogenic markers and 1 week for the qPCR analysis of chondrogenesis-related miRNAs, as previously described [26]. Media were changed twice a week.
Histology: Alcian Blue staining
After 4 weeks, chondrogenic culture pellets were fixed with 10% buffered formalin for 15 min, dehydrated, and embedded in paraffin using routine procedures. Sections of 5 μm were cut and stained for sulfated GAGs with Alcian Blue (0.5%, in H2O, pH=1 adjusted with HCl, 30 min) combined with counterstaining of Nuclear Fast Red (0.1% in 5% aluminum sulfate, 5 min). Scoring of histology was performed by three independent blinded observers according to the intensity of Alcian Blue staining and morphology of the formed pellets.
mRNA isolation and qPCR
After 4 weeks of chondrogenic culture, total RNA was isolated from pellet cultures with the NucleoSpin RNA II Kit (Bioke) and 1 μg of RNA was reverse-transcribed into cDNA using the iScript cDNA Synthesis Kit (Bio-Rad) according to the manufacturer's protocols. The primers for qPCR are listed in Table 1. mRNA expression levels were normalized with GAPDH and B2M as housekeeping genes.
All reagents were purchased from Invitrogen, unless otherwise stated. Common chemicals were purchased from Sigma-Aldrich.
Microarray expression profiling
Gene expression profiling of 20 hMSC donors was carried out using the Affymetrix microarray platform. RNA isolated at passage 2 before the initiation of the chondrogenic differentiation was hybridized to the Human Genome U133A 2.0 Array (Affymetrix) and scanned with a GeneChip G3000 scanner (Affymetrix). Measurements were normalized for technical effects related to efficiency of hybridization and amplification of nucleic acids, as well as the physical location on the array. Data processing and statistical testing were performed using R and Bioconductor statistical software (
In this study, the described data set was previously used by Portalska et al. and Mentink et al. [22,23]. We reanalyzed this data set after the formation of two groups: good and low chondrogenic performing hMSC donors. To correlate donor variation with chondrogenic differentiation ability, we scored different donor-derived hMSCs based on their histological pellet culture appearance, GAG deposition, and expression of mRNA markers of chondrogenesis after 28 days of differentiation. Subsequently, a list of genes ranked on fold change between the highest and lowest chondrogenically performing donors was generated using the approach described above.
miRNA isolation and qPCR
Small RNAs were isolated from monolayer hMSC cultures at passage 2 and from pellet cultures at day 7 after initiation of chondrogenic differentiation with the AllPrep DNA/RNA/Protein Mini Kit in combination with the RNeasy® MinElute® Cleanup Kit according to the manufacturer's protocol (Qiagen). Nucleic acid concentrations were measured with the NanoDrop 2000. The small RNA fraction cDNA was prepared using the RevertAid H Minus First Strand cDNA Synthesis Kit (Fermentas). SYBR (N′,N′-dimethyl-N-[4-[(E)-(3-methyl-1,3-benzothiazol-2-ylidene)methyl]-1-phenylquinolin-1-ium-2-yl]-N-propylpropane-1,3-diamine) green mRNA Primer sequences are listed in Table 2. The QuantiMir RT Kit (Systems Biosciences) was used according to the manufacturer's instruction to convert small RNAs into cDNA. Expression levels were analyzed by quantitative reverse transcription–polymerase chain reaction (qRT-PCR; SYBR Green supermix and iCycler IQ detection system; Bio-Rad) using conventional protocols [30]. The relative expressions were calculated by the ΔCT method normalized to U6 expression.
The qRT-PCR data were analyzed using one-way analysis of variance with Tukey as the post hoc test (different sized groups) in SPSS. Significance levels of P≤0.05 are indicated with an asterisk (*).
Results
Limited chondrogenic potential of hMSC donors
hMSCs from a cohort of 20 donors were tested previously for their endothelial, adipogenic, osteogenic, and chondrogenic differentiation potential. All donor hMSCs expressed the anticipated CD marker profile of hMSCs [22,23]. We compared the chondrogenic potential in depth based on histological appearance, GAG deposition, and chondrogenic mRNA expression. This analysis revealed that only three donors show substantial chondrogenesis after 28 days of pellet culture. Another nine donors show moderate levels of chondrogenesis and eight donors have only a low potential to undergo chondrogenesis (Supplementary Fig. S1; Supplementary Data are available online at
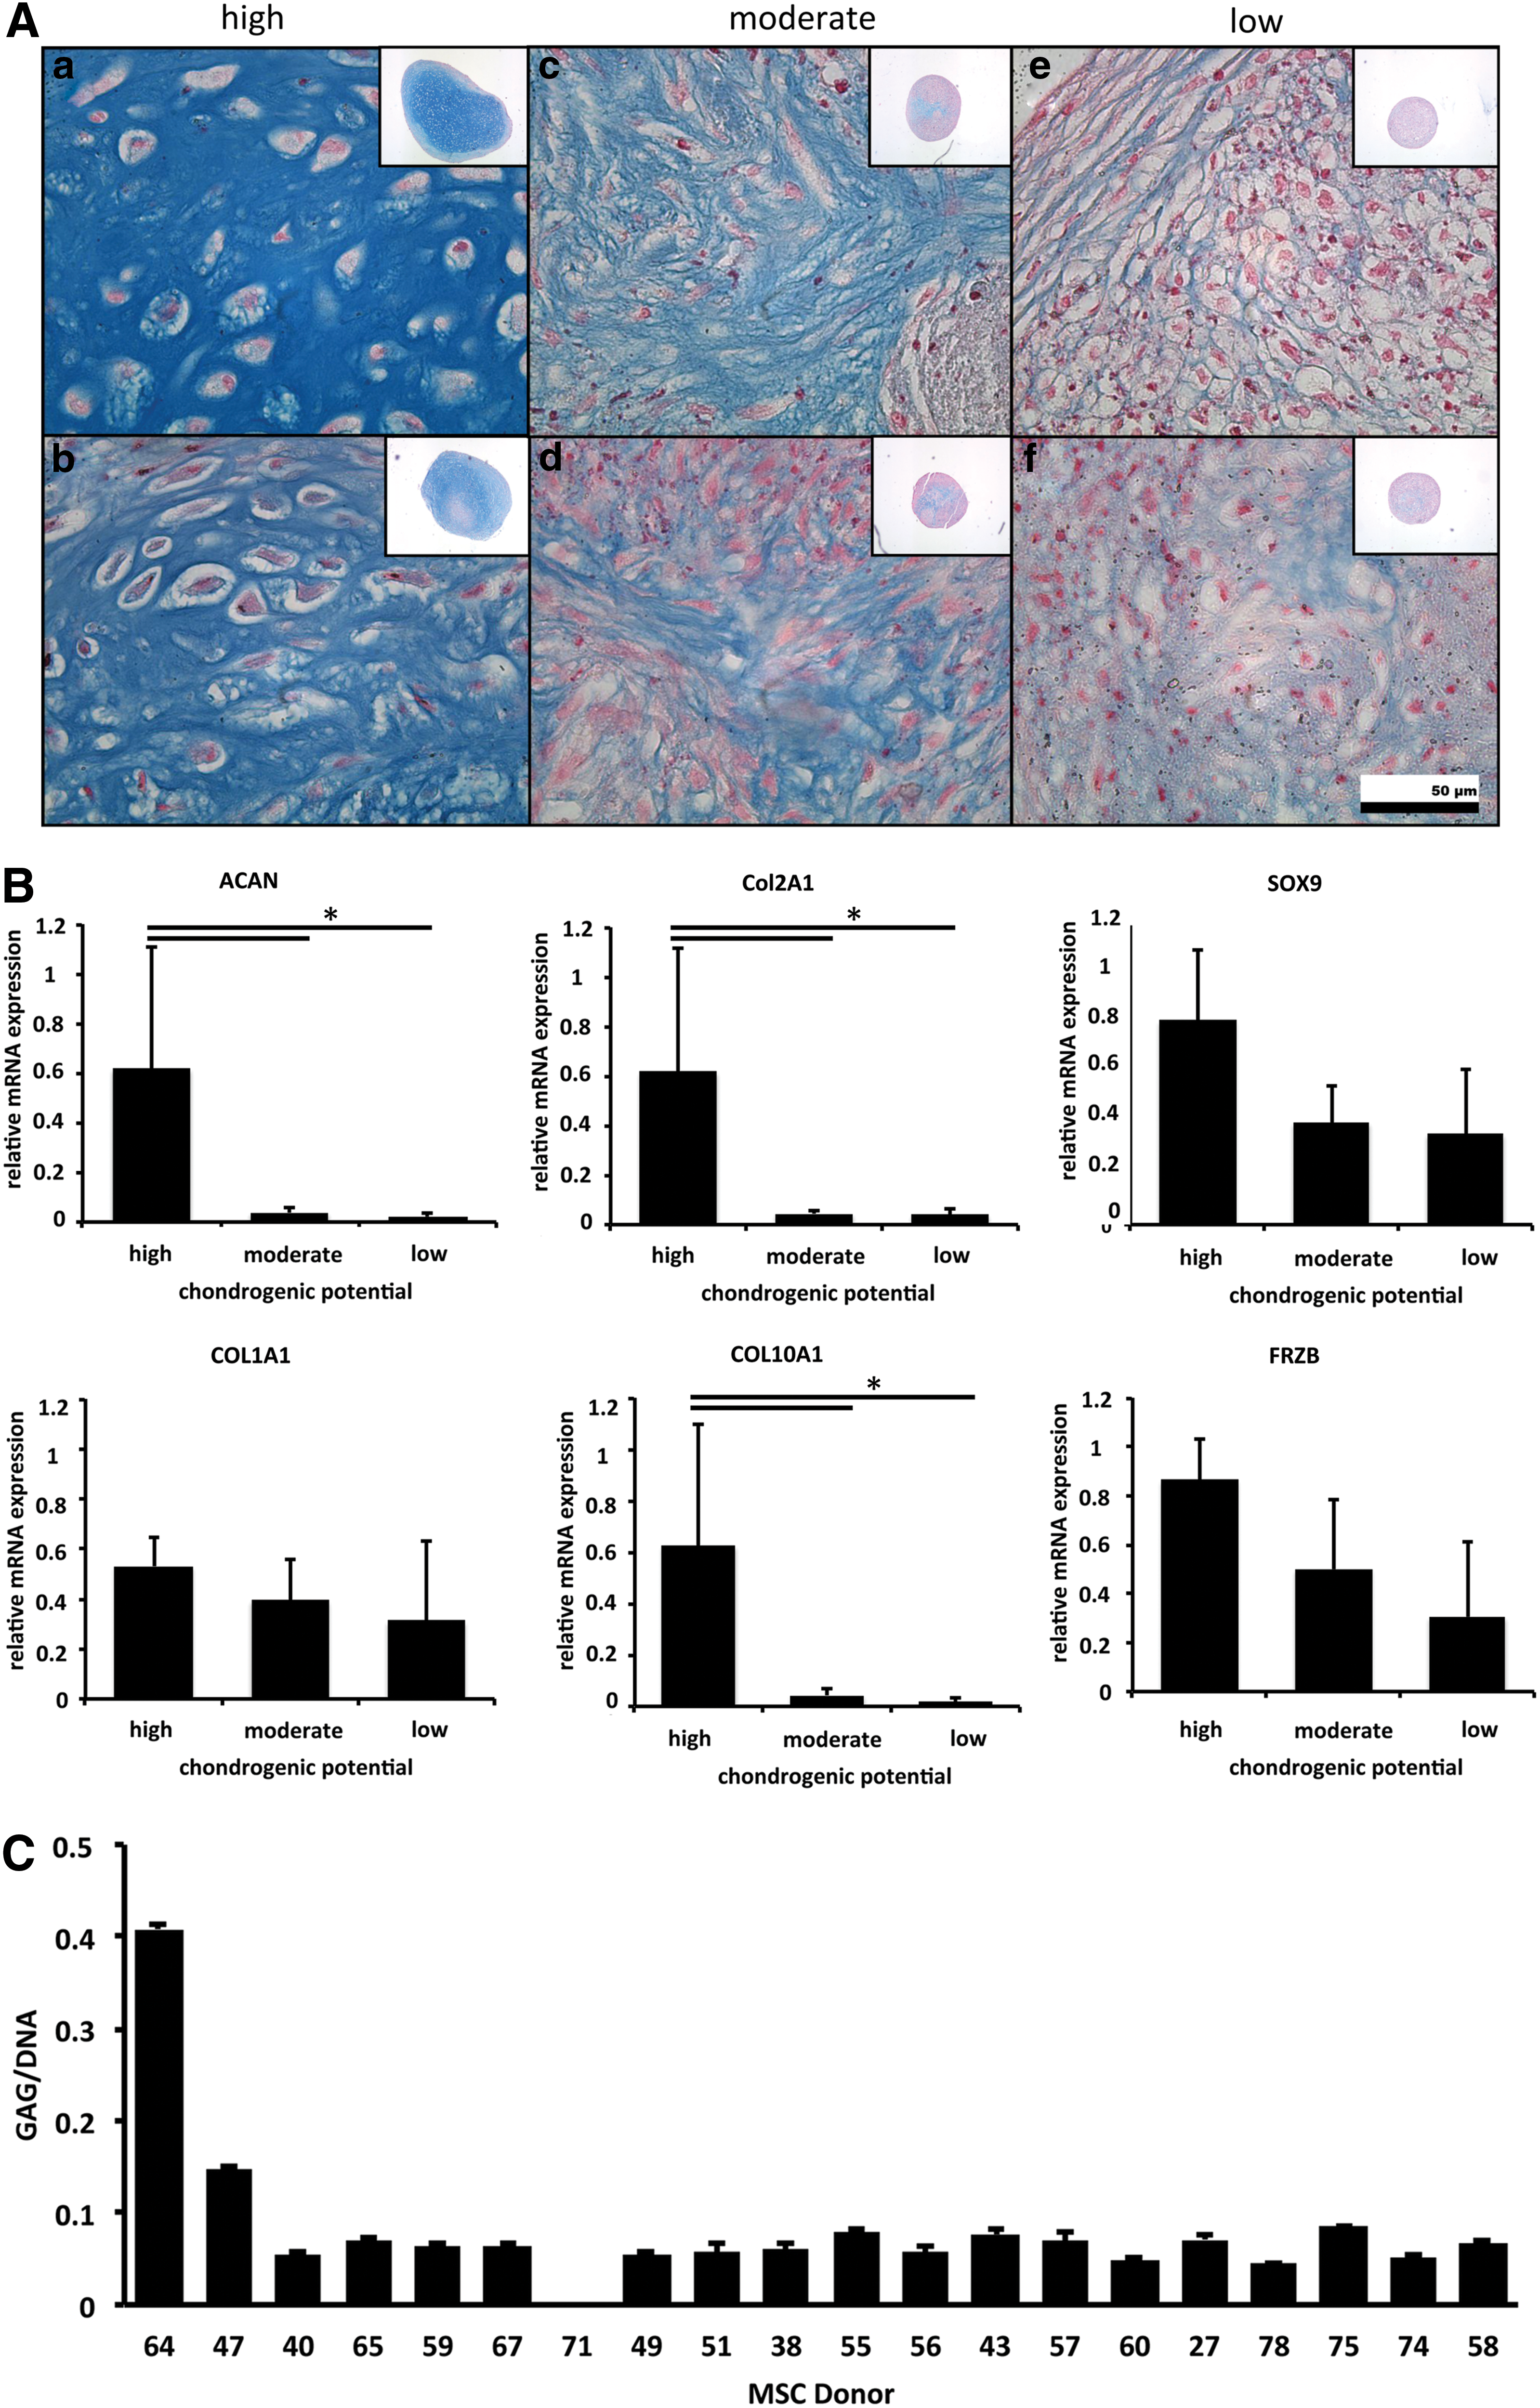
Comparison of 20 human mesenchymal stromal/stem cell (MSC) donors for their chondrogenic potential based on histological appearance, mRNA expression, and glycosaminoglycan (GAG) deposition.
Gene expression levels of the chondrogenic genes ACAN and COL2A1 were significantly upregulated in donors with high chondrogenic potential. The chondrogenic transcription factors SOX9 and FRZB, a recently identified marker for articular cartilage, were nonsignificantly higher expressed in good chondrogenic performers. COL10A1, a marker for cartilage hypertrophy, was significantly higher expressed in high-performing donors. COL1A1, a dedifferentiation marker, exhibits limited variation in expression between the different groups (Fig. 1B). Donors with high chondrogenic potential show distinct quantitative GAG levels from moderate to low performers (Fig. 1C). Histologically assessed GAG levels did not distinguish moderate from low-performing donors (Fig. 1C). Thus, high-performing chondrogenic hMSCs are distinct from biologically low-performing hMSCs by both histochemical and molecular criteria.
Microarray-based mRNA expression profiling shows limited distinctions between hMSCs with different chondrogenic potential
Analysis of global gene expression levels between all 20 donors revealed minor mRNA expression differences between the high-, moderate-, and low-performing donors. To improve detection of molecular differences, we compared mRNA levels upon biological stratification of the donors into two groups with either high or low chondrogenic potential (n=3 in each case) using the extremes at both ends of the spectrum of chondrogenic differentiation based on histology, quantitative GAG assessment, and gene expression analysis. Statistical evaluation of these highly distinct groups increased the number of significantly differentially expressed genes, but differences in global gene expression levels were small (Supplementary Table S1).
STRING network analysis of genes with a minimal 1.6-fold (log ratio 0.5) upregulation in donors with high chondrogenic potential compared to low-performing donors demonstrated changes in regulatory networks associated with transcriptional control and signal transduction. One major network includes the basic helix-loop-helix family member E40 (BHLHE40), which is a transcription factor modulating chondrogenesis [31]. Furthermore, several other gene regulatory factors were identified, such as the nuclear receptor group 4A2 (NR4A2, also known as NURR1) as well as the basic leucine zipper (bZIP) proteins ATF3, MAFB, FOSB, and FOS. Each of these regulators has been linked to signal transduction, cell proliferation, and differentiation [32] (Fig. 2A).

Microarray mRNA analysis as a result of the comparison of three high-performing chondrogenic donors versus low-performing chondrogenic donors.
Network analysis of genes with a minimal 1.4-fold downregulation in donors with low chondrogenic potential compared to donors with high chondrogenic potential revealed major networks associated with extracellular matrix proteins, such as ACAN, COL4A1, TIMP3, and EFEMP1, as well as a network of signaling proteins, JAG1, dickkopf-related protein 1 (DKK1), and tumor necrosis factor receptor superfamily member 11B (TNFRSF11B, also known as osteoprotegerin/OPG) (Fig. 2B).
Ingenuity pathway analysis revealed that the 10 most differentially regulated cellular functions between the three high- and low-performing donors were linked to development as well as cell growth and survival (Fig. 2C). Transforming growth factor (TGF)-β1 was identified as a major upstream contributor to the differences in gene expression between donors with high and low chondrogenic potential (Fig. 2D).
Differential expression of miRNAs between groups with distinct chondrogenic potential
Since mRNA expression changes did not reveal clear markers of chondrogenic potential, we investigated the potential of miRNA expression as markers of chondrogenic potential in hMSCs. The expression of previously identified miRNAs known to be involved in chondrogenesis was evaluated before onset of chondrogenic differentiation and after 7 days in a three-dimensional cell mass under chondrogenic conditions (pellet culture). miRNA levels of the same three donors with high chondrogenic potential (n=3) were compared with the same three donors with lowest chondrogenic potential (n=3).
Two miRNAs, which are known to negatively influence osteoblast and chondrocyte differentiation (miR-30b and -221), display a higher expression in high-performing donors before the onset of chondrogenesis (fold upregulation high-performing donor/low-performing donor: miR-30b: 1.63, miR-221: 1.83). Both miRNAs were strongly downregulated during chondrogenic differentiation (fold downregulation day 0/day 7: miR-30b: 4.10, miR-221: 7.86). However, these same miRNAs were not or weakly downregulated in low-performing chondrogenic donors, marked by a lower fold change between day 0 and 7 after induction of chondrogenic differentiation (fold downregulation day 0/day 7: miR-30b: 0.94, miR-221: 2.72).
One set of miRNAs (miR-34a, -23b, -26, -181) was more highly expressed in donors with high chondrogenic potential before the onset of chondrogenesis (fold difference between high- vs. low-performing donors: miR-34a: 2.46-fold, miR-23b: 1.25-fold, miR-26: 1.54-fold, miR-181: 1.15-fold). These miRNAs were all downregulated during differentiation (fold downregulation day 0/day 7: miR-34a: 3.70-fold, miR-23b: 1.67-fold, miR-26: 1.20-fold, miR-181: 1.10-fold). Remarkably, while their expression in poor performing donors was lower compared to good performing donors before the onset of chondrogenic differentiation, their expression was upregulated during differentiation (fold upregulation day 0/day 7: miR-34a: 1.90-fold, miR-23b: 1.30-fold, miR-26: 1.60-fold, miR-181: 1.39-fold). Notably, miR-34a and miR-23b are known to negatively influence cartilage homeostasis and/or chondrogenic differentiation.
In contrast, expression of miR-630, a positive regulator of chondrogenesis, and miR-210, a marker of the hypoxic cell response, is upregulated during chondrogenesis (fold upregulation day 0/day 7: good donors miR-630: 1.99, miR-210: 14.14; low donors: miR-630: 3.52, miR-210: 21.93). Remarkably, their upregulation was even more pronounced in the poor performing donors, demonstrating discordance. Other regulators of chondrogenesis (miR-140, -145, and let-7e) display only minor differences between the different groups (Fig. 3; Table 3).

MicroRNA (miRNA) level regulation of high-performing vs low-performing donors. Expression of miRNAs known to be involved in chondrogenesis was evaluated before chondrogenesis and at day 7 of chondrogenic pellet culture. miRNA levels of donors with high chondrogenic potential (n=3) were compared with donors with low chondrogenic potential (n=3). miR-30, -221, 34a, -23b, -26, -181 display a higher expression in high-performing donors before the onset of chondrogenesis and were strongly downregulated during chondrogenic differentiation. miR-630 and miR-210 are upregulated during chondrogenesis. Negative regulators of chondrogenesis (miR-145 and let-7e) are slightly downregulated during the differentiation process in high- and low-performing donors. Data represent the mean of three independent hMSC donors. Color images available online at
TGFβ, transforming growth factor-beta; MSC, mesenchymal stromal/stem cell; BMP, bone morphogenetic protein.
Discussion
By the comparison of the chondrogenic differentiation potential of previously well-characterized hMSCs from a cohort of human donors (n=20), it was shown that only 15% of these donors provide hMSCs with the natural capability to undergo efficient chondrogenic differentiation ex vivo [22,23], while chondrogenic performance was moderate (45%) or even poor in the remaining donors (40%). Good chondrogenic differentiation potential was mainly marked by increased GAG deposition, better histological cartilage formation, including increased formation of matrix encapsulated chondrocytes (ie, chondron formation), limited fibrous cartilage formation, as well as the significantly higher mRNA expression of ACAN and COL2A1.
The main focus of our study was, therefore, to define molecular differences that predict high differentiation hMSC donors at the start of the differentiation experiment. We would like to emphasize that this pool of MSCs was isolated from bone marrow biopsies by virtue of plastic adherence using protocols routinely applied for isolation and culture expansion of bone marrow MSCs for clinical practice [33]. Our MSCs were not clonally selected and they are likely to present a heterogenic cell population as previously noted [24].
Previous studies have mainly focused on the osteogenic differentiation of hMSC donors. In these studies, only differences in differentiation potential were noticed and no scoring was done. Differences in performances were shown to be independent of donor age, gender, and source of isolation [9,22,34]. As demonstrated by Mentink et al. [22], high osteogenic potential of a particular donor does not imply that this donor also exhibits high chondrogenic, adipogenic, or endothelial differentiation potential. We, therefore, want to emphasize that prognostic markers have to be identified for each differentiation lineage separately.
In our study, we tested if donors with high chondrogenic potential could be identified in a pool of donors based on their global gene expression profile determined by Affymetrix microarray analysis before the onset of differentiation. Groups with high and low chondrogenic differentiation potential were separated with a maximum 1.6-log ratio in transcript expression levels (Supplementary Table S1).
Donors with low chondrogenic potential mainly exhibited higher expression of matrix-associated proteins. Donors with high chondrogenic potential showed increased expression of mRNAs involved in transcriptional processes, although overall differences were small. Two regulatory networks that differ between the donor groups with high and low chondrogenic potential are centered around the BHLHE40, as a transcriptional factor modulating chondrogenesis [31], and the transcription factors FOS, FOSB, and ATF3, which have general roles in signal transduction, cell proliferation, and differentiation [35] (Fig. 2A). FOS and ATF members are leucine zipper proteins that dimerize with the JUN family and, thereby, form a large number of AP-1-related transcription factor complexes. The activation of AP-1 is linked to terminal chondrocyte differentiation and cartilage homeostasis by modulating MMP13 expression [36]. Modulation of this transcription factor network may therefore have impact on the chondrogenic performance of hMSCs. Hence, subtle differences in the expression of transcription factors may contribute to distinctions in the chondrogenic potential of hMSCs.
Our studies suggested that genes, which differ between donors with high or low chondrogenic potential, are linked to TGFβ1 as a principal upstream regulator. TGFβ signaling supports embryonic development and cartilaginous matrix formation [37]. It is plausible that differences in TGFβ responsiveness of hMSC donors might lead to distinct chondrogenic performance of hMSCs. Indeed, exogenous supplementation of TGFβ is a main driver of chondrogenic differentiation in hMSC pellet cultures [38]. In addition, TGFβ is a key upstream regulator of AP-1 activity through its downstream effectors SMAD2 and SMAD3 [39]. Thus, differences in the TGFβ/SMAD/AP1 regulatory axis could account, in part, for differences in the chondrogenic ability of hMSCs from different donors.
We next extended our analysis by analysis of a selected panel of miRNAs previously implemented in chondrogenic differentiation, including miR-210, miR-630, and miR-140 [40 –43]. We confirmed positive regulation of miR-210 and miR-630 within 7 days after chondrogenic induction, with miR-630 being slightly higher expressed in good donors. Bakhshandeh et al. showed that miR-630 is part of a chondrogenic miRNA signature [43]. Among the pathways predicted to be targeted by miR-630 are erbB signaling, gap-junction communication, MAP-Kinase signaling, and TGFβ signaling. Both MAP-Kinase/Erk signaling and TGFβ signaling are mediators of early stages of chondrogenic differentiation [44,45].
We find that miR-181 and miR-34a, which are negative regulators of chondrogenesis, were upregulated during differentiation in low-performing donors. Of these two, miR-34a perturbs cartilage homeostasis by inducing apoptosis, cell cycle arrest, and senescence while targeting for E2F3, cyclin E2, CDK6, and others [46,47], but is otherwise unremarkable. However, similar to one of the predicted functions for miR-630, miR-181 acts as a negative regulator of the TGFβ pathway [43]. Thus, our current findings converge on a hypothetical molecular model, in which miR-630, miR-181, as well as the TGFβ/SMAD/AP-1 regulatory axis may form a tightly connected network that modulates and predicts the chondrogenic potential of hMSCs from different donors.
In conclusion, our findings indicate that a panel of miRNAs encompassing miR-210, miR-630, miR-181, and miR-34a can be informative for prognostically separating high-performing hMSCs from low-performing hMSCs. Our data suggest that a short preclinical differentiation period of 7 days suffices to provide insight into the chondrogenic potential of different hMSCs based on miRNA expression profiling. Furthermore, modulation of TGFβ responsiveness appears to be a common mechanistic denominator in both the observed differences in mRNA expression profiles and the differences in miRNA expression between biologically distinct hMSCs from different donors. We anticipate that experimental and therapeutic manipulation of TGFβ-dependent miRNA/transcription factor networks may be useful for enhancing the chondrogenic potential of hMSCs and minimizing the biological differences among diverse patients who will undergo autologous tissue regeneration using hMSCs.
Footnotes
Acknowledgments
The authors gratefully acknowledge the support of the TeRM Smart Mix Program of the Netherlands Ministry of Economic Affairs and the Netherlands Ministry of Education, Culture and Science, the support of National Institutes of Health grant R01 AR049069 (to A.J.v.W.) as well as the EMBO and the Alexander von Humboldt Foundation support (post-doctoral fellowships H.T.). M.K. is supported by a long-standing program grant of the Dutch Arthritis Association.
Author Disclosure Statement
No competing financial interests exist.
References
Supplementary Material
Please find the following supplemental material available below.
For Open Access articles published under a Creative Commons License, all supplemental material carries the same license as the article it is associated with.
For non-Open Access articles published, all supplemental material carries a non-exclusive license, and permission requests for re-use of supplemental material or any part of supplemental material shall be sent directly to the copyright owner as specified in the copyright notice associated with the article.