
Abstract
Reprogramming is one of the most essential areas of research in stem cell biology. Despite this importance, the mechanism and correlates of reprogramming remain largely unknown. In this study, we investigated the cytoplasmic remodeling and changes in metabolism that occur during reprogramming and differentiation of pluripotent stem cells. Specifically, we examined the cellular organelles of three pluripotent stem cells, embryonic stem cells (ESCs), induced pluripotent stem cells (iPSCs), and epiblast stem cells (EpiSCs), by electron microscopy. We found that the cellular organelles of primed pluripotent EpiSCs were more similar to those of naive pluripotent ESCs and iPSCs than somatic cells. EpiSCs, as well as ESCs and iPSCs, contain large nuclei, poorly developed endoplasmic reticula, and underdeveloped cristae; however, their mitochondria were still mature relative to the mitochondria of ESCs and iPSCs. Next, we differentiated these pluripotent stem cells into neural stem cells (NSCs) in vitro and compared the morphology of organelles. We found that the morphology of organelles of NSCs differentiated from ESCs, iPSCs, and EpiSCs was indistinguishable from brain-derived NSCs. Finally, we examined the changes in energy metabolism that accompanied mitochondrial remodeling during reprogramming and differentiation. We found that the glycolytic activity of ESCs and iPSCs was greater compared with EpiSCs, and that the glycolytic activity of EpiSCs was greater compared with NSCs differentiated from ESCs, iPSCs, and EpiSCs. These results suggest that a change in the cellular state is accompanied by dynamic changes in the morphology of cytoplasmic organelles and corresponding changes in energy metabolism.
Introduction
P
Recent studies have shown that the organelle shape and metabolism are also distinct according to the developmental stage of cells and that they change during reprogramming [8,9]. In a high-resolution electron microscopy analysis, naive pluripotent stem cells (mouse ESCs and iPSCs) contained rounded mitochondria and immature cristae [8], while primed pluripotent EpiSCs contained relatively elongated mitochondria with more mature cristae [10]. Similarly, reprogramming of fibroblasts into iPSCs led to changes in membrane-bound organelles, including mitochondria and endoplasmic reticula [8], and during differentiation of pluripotent stem cells, globular mitochondria developed into elongated structures with dense matrices and mature cristae [9,11 –14]. Recently, we demonstrated that naive and primed pluripotent stem cells could be differentiate into neural stem cells (NSCs) in vitro, which were similar to brain-derived NSCs in morphology and differentiation potential [15,16]. However, the change of cellular organelles and metabolic system of the differentiated NSCs still remains largely unknown. In this study, we investigated the dynamics of mitochondrial morphology during reprogramming and differentiation of pluripotent cells. Cellular organelles of pluripotent stem cells and their differentiated counterparts were observed by high-resolution electron microscopy. We found that the cellular organelles were remodeled during reprogramming and differentiation; and furthermore, this remodeling was accompanied by changes in energy metabolism.
Materials and Methods
Cell cultures
ESCs were cultured on a dish layered with inactivated mouse embryonic fibroblasts (MEFs) in an ESC medium, consisting of Dulbecco's modified Eagle's medium (DMEM) supplemented with 15% fetal bovine serum (FBS), 1× penicillin/streptomycin/glutamine, 0.1 mM nonessential amino acids, 1 mM β-mercaptoethanol (Gibco BRL), and 103 U/mL leukemia inhibitory factor (ESGRO, Chemicon International). EpiSCs (OG2+/−) were cultured on inactivated MEF feeder cells, as described previously [4], which were cultured in an EpiSC medium, consisting of DMEM/F12 supplemented with 20% knockout serum replacement, 2 mM glutamine, nonessential amino acids, 20 ng/mL activin A (PeproTech), and 5 ng/mL basic fibroblast growth factor (bFGF; Invitrogen).
Generation of iPSCs by retrovirus
pMX-based retroviral vectors encoding the mouse cDNAs of Oct4, Sox2, KLf4, and c-Myc were separately cotransfected by packaging defective helper plasmids into 293T cells by using the Fugene 6 transfection reagent (Roche). Forty-eight hours after transfection, virus supernatants were collected, filtered, and concentrated as previously described [17]. MEFs (OG2+/−/ROSA26+/−) were seeded at a density of 1×10⁵ cells per six-well plate and incubated for 24 h with virus-containing supernatants of the four factors (1:1:1:1) supplemented with 6 μg/mL protamine sulfate (Sigma). After retroviral infection, green fluorescent protein (GFP)-positive colonies were transferred onto inactivated MEF feeders and then trypsinized, replated, and cultured in the ESC medium as described above.
Differentiation of ESCs, iPSCs, and EpiSCs into NSCs
ESCs, iPSCs, and EpiSCs were cultured for 2–3 days with 15% MEF medium, consisting of 15% FBS, 1× penicillin/streptomycin/glutamine, 0.1 mM nonessential amino acids, and 1 mM β-mercaptoethanol (Gibco BRL) in DMEM. After 2–3 days, ESCs, iPSCs, and EpiSCs were cultured without feeder cells in the N2B27 medium [20 ng/mL epidermal growth factor (EGF; Gibco BRL), 20 ng/mL bFGF, B27 supplement (Gibco BRL), 8 mM HEPES, 2 mM glutamine, 100 U/mL penicillin, and 100 mg/mL streptomycin in the DMEM-F12 medium (Gibco BRL)] for 2 days in the suspension culture dish and then plated onto a 0.1% gelatin-coated dish for 3 days with the NSC expansion medium [NS-A medium (Euroclone), including N2 supplement, 10 ng/mL EGF, 10 ng/mL bFGF (Invitrogen), 50 μg/mL bovine serum albumin (Gibco BRL), and 1× penicillin/streptomycin/glutamine].
RNA isolation and quantitative reverse transcription–polymerase chain reaction analysis
Total RNA was isolated using the RNeasy Mini Kit (Qiagen) and treated with DNase to remove genomic DNA contamination. One microgram of total RNA was reverse transcribed with the SuperScript III Reverse Transcriptase Kit (Invitrogen) and oligo(dT) primer (Invitrogen) according to the manufacturer's instructions. Quantitative PCRs were set up in duplicate with the Power SYBR Green Master Mix (Takara) and analyzed with the Roche LightCycler 5480 (Roche). The primers for quantitative reverse transcription–polymerase chain reaction (qRT-PCR) used were as follows: Oct4 (endo) sense 5′-GATGCTGTGAGCCAAGGCAAG-3′, Oct4 (endo) antisense 5′-GGCTCCTGATCAACAGCATCAC-3′; Nanog (endo) sense 5′-CTTTCACCTATTAAGGTGCTTGC-3′, Nanog (endo) antisense 5′-TGGCATCGGTTCATCATGGTAC-3′; FGF5 sense 5′-GCGACGTTTTCTTCGTCTTC-3′, FGF5 antisense 5′-ACAATCCCCTGAGACACAGC-3′; T sense 5′-ATCAGAGTCCTTTGCTAGGTAG-3′, T antisense 5′-GTTACAATCTTCTGGCTATGC-3′; Sox17 sense 5′-GGAGGGTCACCACTGCTTTA-3′, Sox17 antisense 5′-AGATGTCTGGAGGTGCTGCT-3′.
Immunocytochemistry experiments
For immunocytochemistry, cells were fixed with 4% paraformaldehyde for 20 min at room temperature. After the cells were washed with phosphate-buffered saline (PBS), they were treated with PBS containing 10% normal goat serum and 0.03% Triton X-100 for 45 min at room temperature. The primary antibodies used were anti-Nestin (monoclonal, 1:500; Millipore) and anti-Sox2 (polyclonal, 1:500; Millipore). For detection of primary antibodies, fluorescently labeled (Alexa Fluor 488 or 568; Molecular Probes) secondary antibodies were used according to the specifications of the manufacturer.
Extracellular acidification rate measurements using seahorse cellular flux assays
ESCs, iPSCs, EpiSCs, NSCs, differentiated NSCs, and MEFs were seeded in growth media onto seahorse plates with 2×10⁴ cells per XF96 well to ensure about 90% surface coverage at the time of the experiment. Culture media were exchanged for base media (DMEM) supplemented with 2 mM glutamine 1 h before the assay and for the duration of the measurement. Substrates and selective inhibitors were injected during the measurements to achieve final concentrations of 10 mM glucose, 2 μM oligomycin, and 100 mM 2-deoxyglucose (2-DG). The baseline extracellular acidification rates (ECARs) were defined as the average values measured from time point 1 to 5 (0–45 min) during the experiments. Changes in the ECAR in response to the addition of substrates and inhibitors were defined as the maximal change after the chemical addition compared with the baseline levels. Due to variations in the absolute magnitude of ECAR measurements in different experiments, the relative ECAR levels were used to compare and summarize independent biological replicates. Data are presented as mean±standard deviation (SD) of triplicates (n=3).
Electron microscopy
For transmission electron microscopic (TEM) observations, the samples were fixed in 4% paraformaldehyde and 2.5% glutaraldehyde in a 0.1 M phosphate buffer for overnight. After washing in a 0.1 M phosphate buffer, the samples were postfixed with 1% osmium tetroxide in the same buffer for 1 h. Then, the samples were dehydrated with a series of the graded ethyl alcohol. The samples were embedded in Epon 812 and then polymerization was performed at 60°C for 3 days. Ultrathin sections (60–70 nm) were obtained by ultramicrotome (Leica Ultracut UCT). Ultrathin sections collected on grids (200 mesh) were examined in the transmission electron microscope (JEM 1010) operating at 60 kV and images in the TEM were recorded by the CCD camera (SC1000; Gatan).
Statistical analysis
All experiments were performed in triplicate and data represented as mean value±SD. Significance of difference was assessed by an unpaired t-test at P<0.05.
Results
Organelle morphology in naive and primed pluripotent stem cells differed from organelle morphology in somatic cells
We used Oct4-GFP transgenic (OG2) mouse embryos for derivation of ESCs and EpiSCs and generation of iPSCs. As OG2 mice express the GFP under the control of the Oct4 promoter and distal enhancer [18], the GFP is expressed only in naive pluripotent cells and germ cells, but not expressed in primed pluripotent cells such as EpiSCs [16]. iPSCs were reprogrammed from MEFs by enforced expression of reprogramming factors (Oct4, Sox2, Klf4, and c-Myc). The naive pluripotent ESCs and iPSCs expressed Oct4-GFP, grew on a feeder layer as domed colonies, and were strongly stained by alkaline phosphatase (Fig. 1A, B). EpiSCs derived from OG2 epiblasts did not express Oct4-GFP because Oct4 expression in EpiSCs is controlled by a distinct promoter and proximal enhancer. In addition, EpiSCs were weakly stained by alkaline phosphatase when compared to naive pluripotent ESCs and iPSCs (Fig. 1A, B). Real-time reverse transcription-polymerase chain reaction (RT-PCR) analysis showed that pluripotency markers Oct4 and Nanog were expressed in ESCs, iPSCs, and EpiSCs (with lower expression of Nanog in EpiSCs), but primed pluripotency markers FGF5, Sox17, and T were highly expressed only in EpiSCs (Fig. 1C).
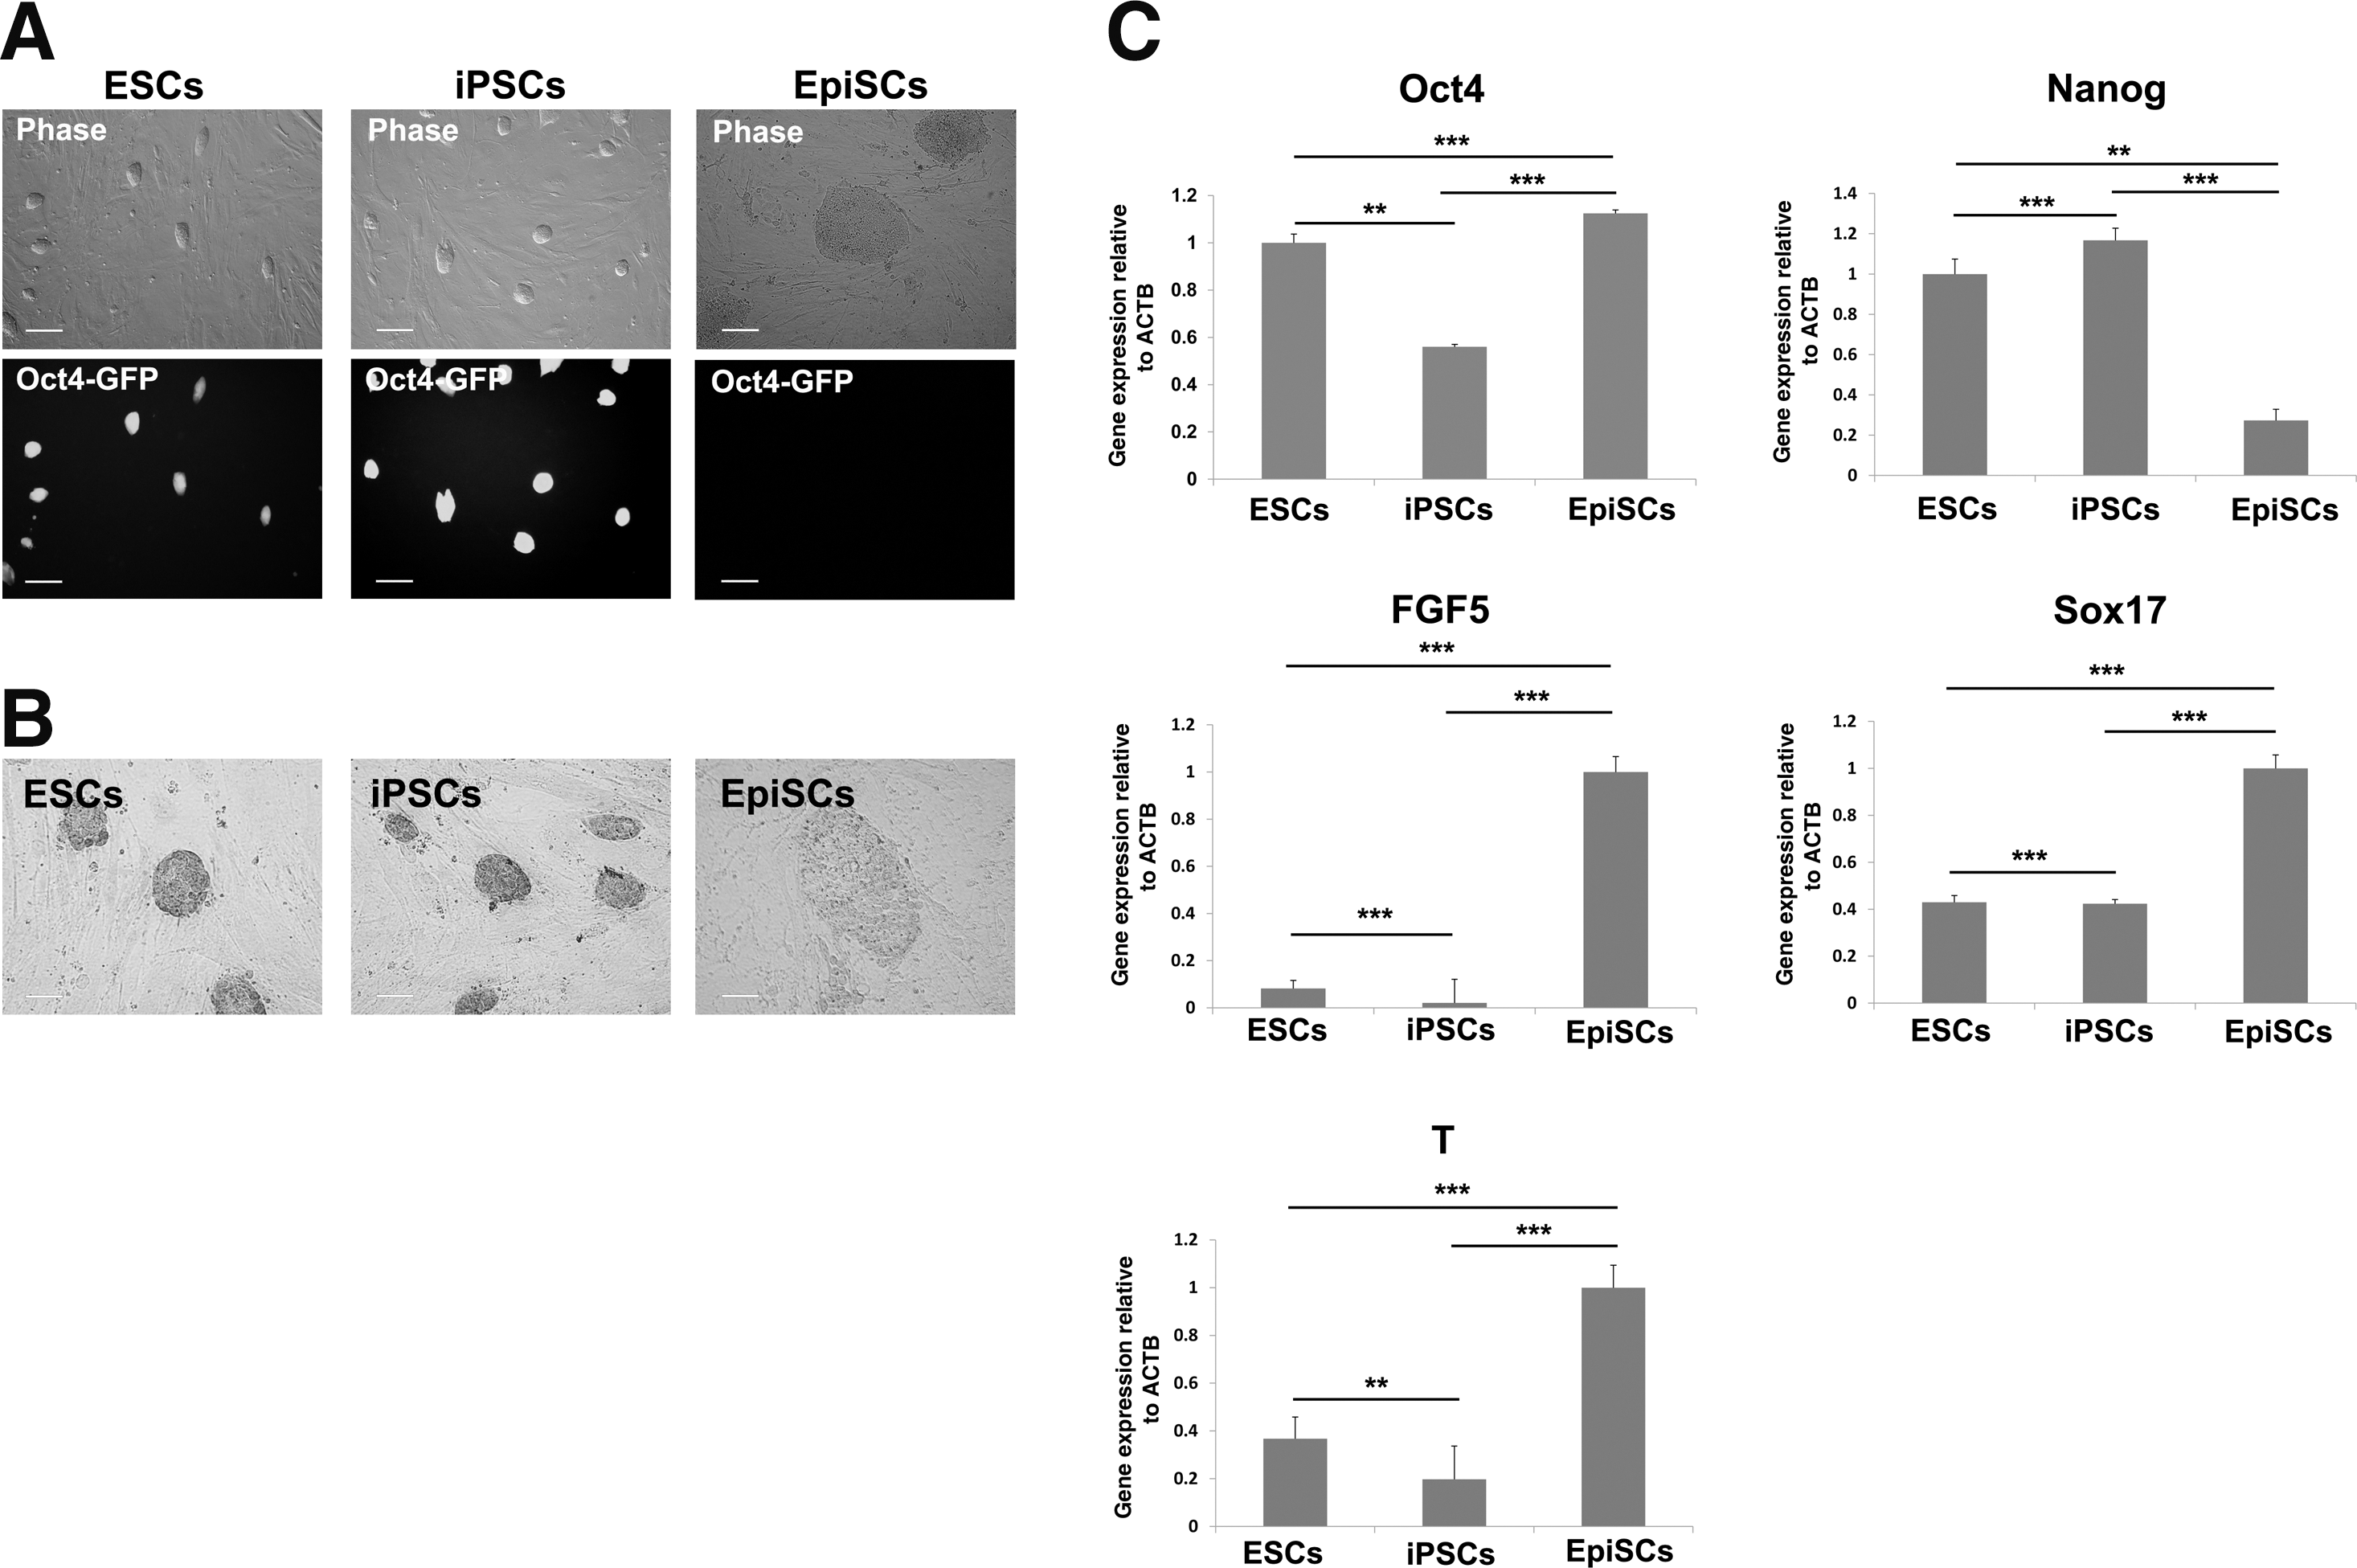
Characteristics of naive and primed pluripotent stem cells.
To compare cellular organelles in ESC, iPSCs, and EpiSCs, we first examined the morphology of nuclei and mitochondria in these three pluripotent stem cells using electron microscopy (Fig. 2A–C, Supplementary Fig. S1; Supplementary Data available online at
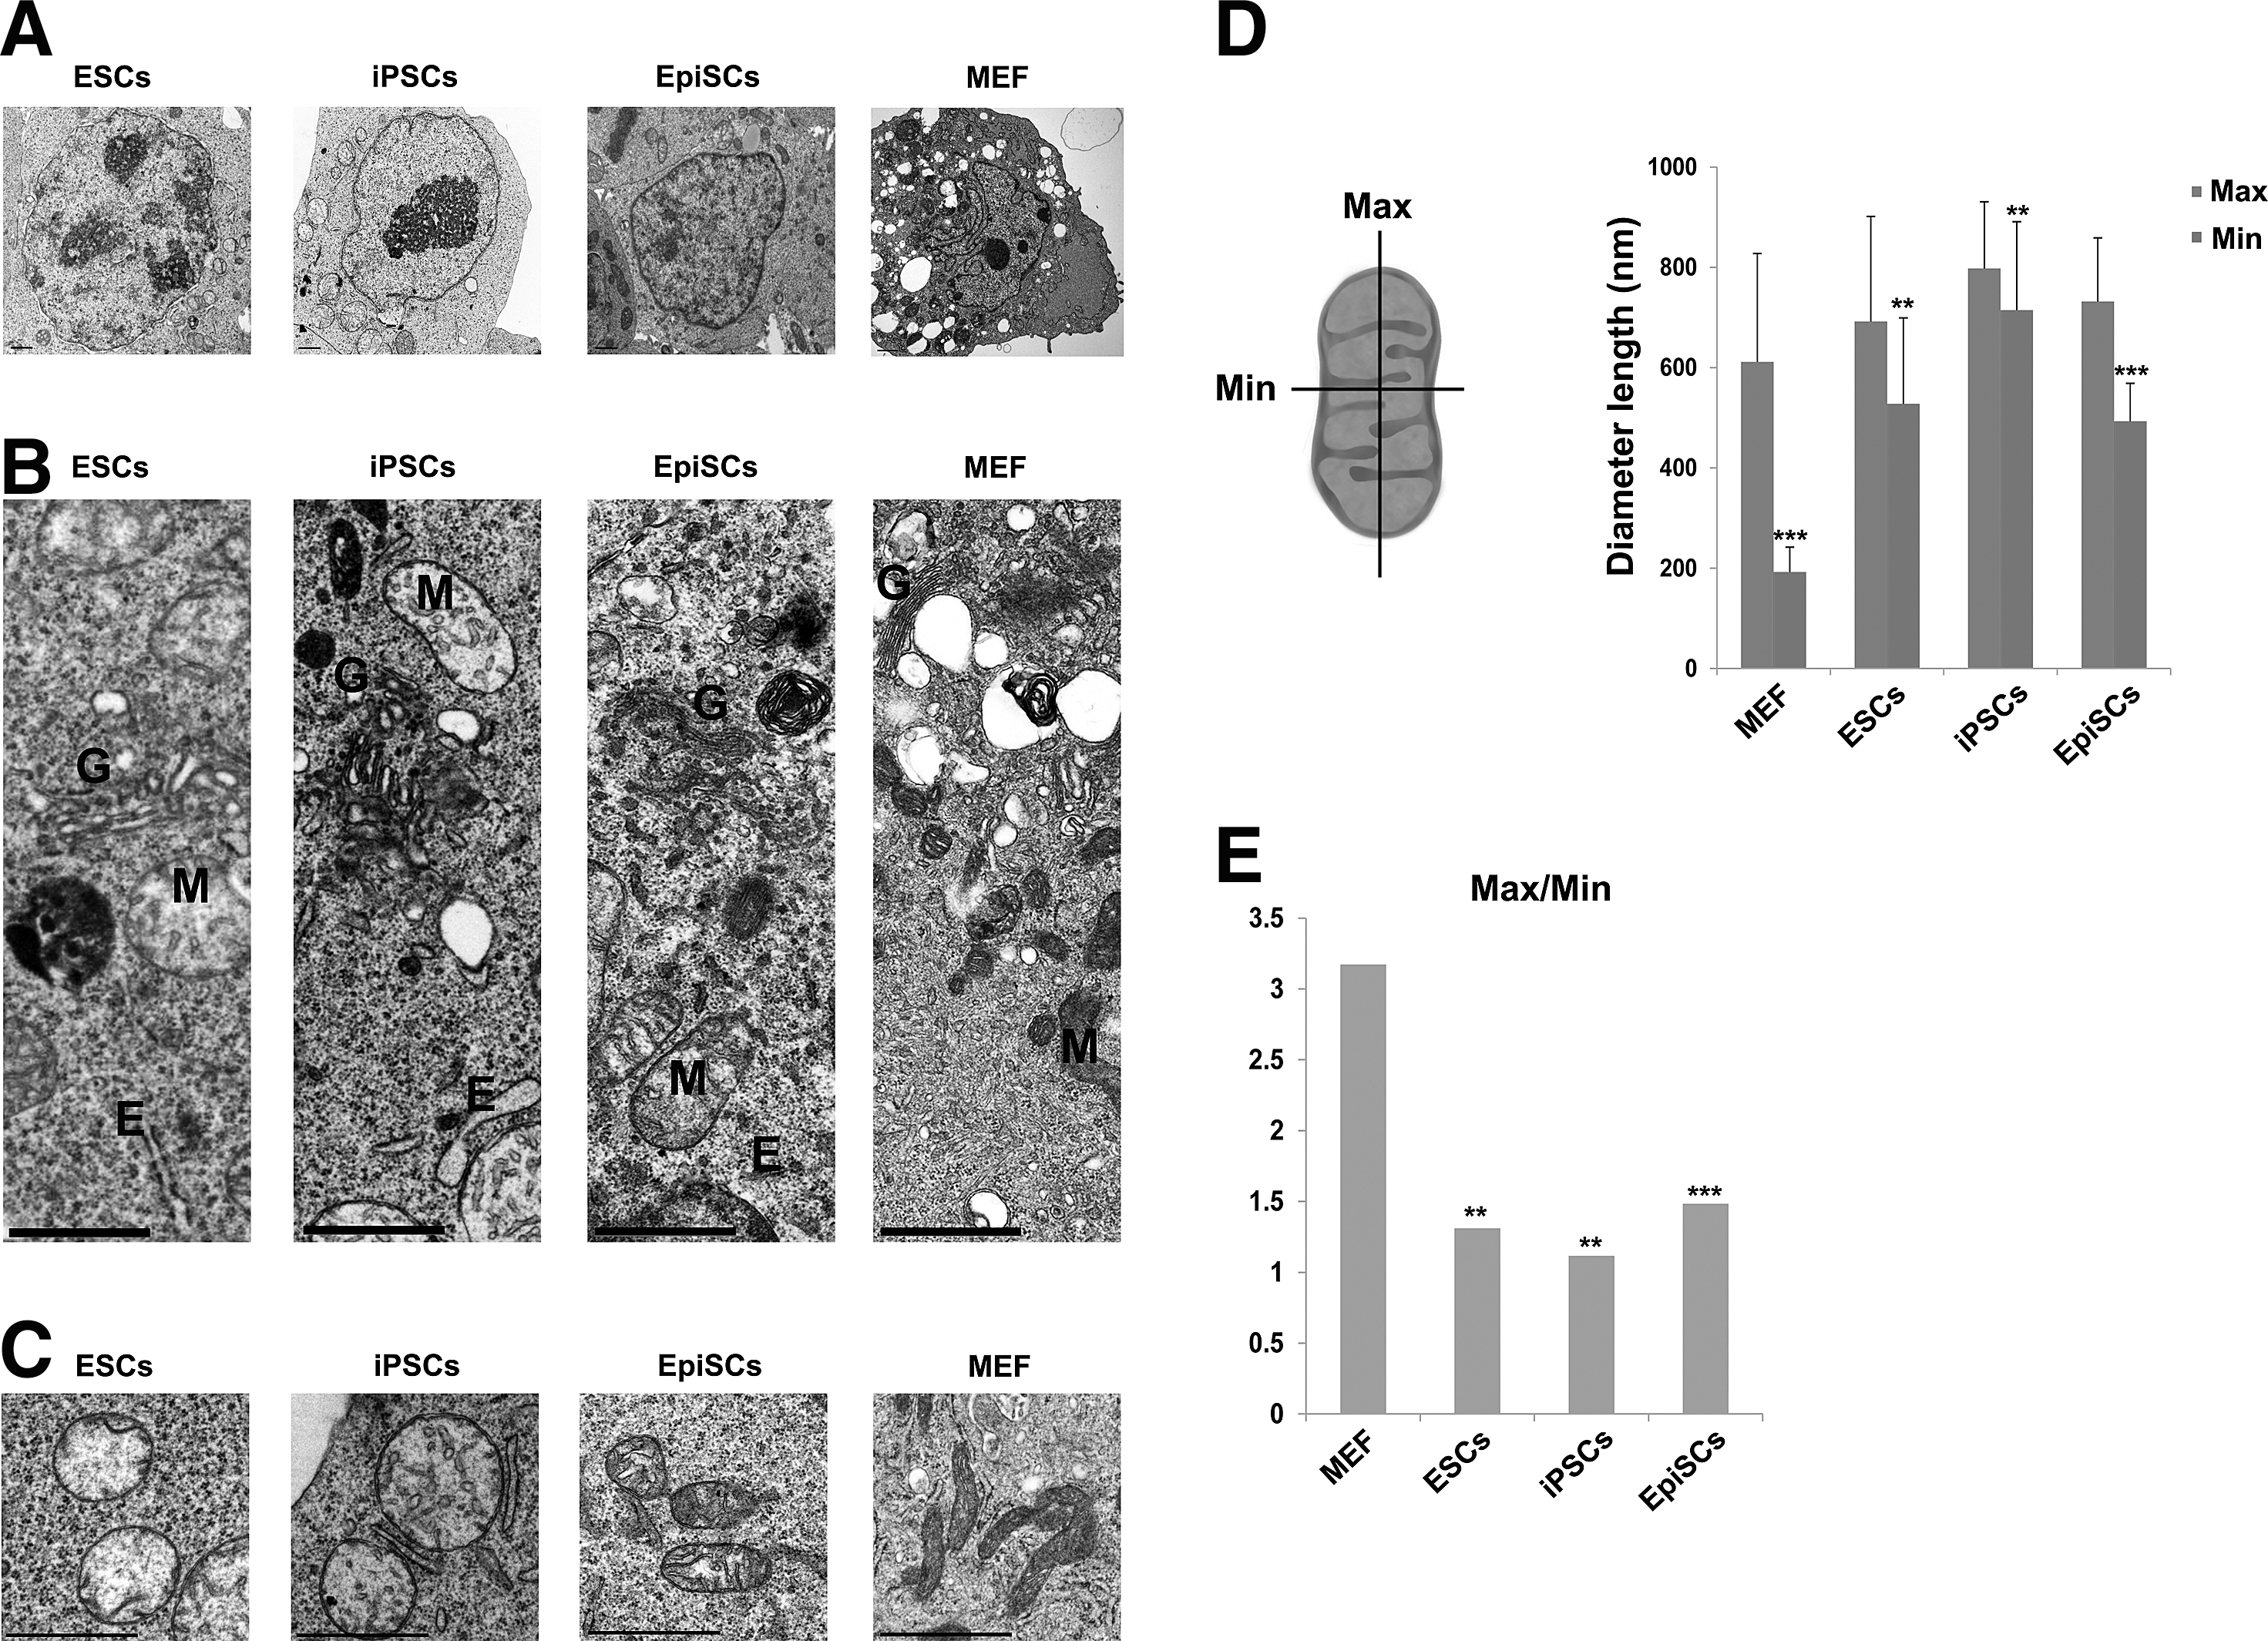
Ultrastructural images of pluripotent stem and somatic cells by electron microscopy.
NSCs differentiated from ESCs, iPSCs, and EpiSCs were indistinguishable from brain-derived NSCs at the ultrastructure level
To observe the changes of cellular organelles upon differentiation, three different naive and primed pluripotent stem cells were differentiated into NSCs and maintained in the NSC expansion medium containing EGF and bFGF according to the previously reported protocol [15,16,19,20]. The efficiency of NSC derivation was ∼1%–2%. All NSCs differentiated from ESCs, iPSCs, and EpiSCs were morphologically indistinguishable and were similar to brain-derived NSCs (Fig. 3A). These NSCs all stained positive for the NSC markers Nestin and Sox2 (Fig. 3B). Next, morphological features of the nuclei and cytoplasmic organelles in NSCs differentiated from the three pluripotent stem cell types were examined and compared with brain-derived NSCs by electron microscopy (Fig. 4A–C). The cytoplasm to nucleus ratios of NSCs, differentiated from those of ESCs, iPSCs, and EpiSCs, were higher than those of their originating pluripotent stem cell types (Figs. 2A and 4A, F). The cytoplasm to nucleus ratio was lower in naive and primed pluripotent stem cells (ESCs: 1.564, iPSCs: 1.538, and EpiSCs: 1.273) than MEFs (3.188) and increased in, respectively, differentiated NSCs (NSCs: 1.932, ESC-NSCs: 1.982, iPS-NSCs: 1.927, and EpiSC-NSCs: 2.14) (Fig. 4D). The morphology of cellular organelles was indistinguishable between pluripotent stem cell-derived NSCs and control brain-derived NSCs (Fig. 4A, B). The mitochondria in NSCs, which were differentiated from ESCs, iPSCs, and EpiSCs, were elongated with a tubular morphology and contained well-developed cristae, as shown in brain-derived NSCs (Fig. 4C). As expected ESCs, iPSCs, and EpiSCs contained larger nuclei than MEFs and NSCs derived from brain tissue ESCs, iPSCs, and EpiSCs (Fig. 4D).
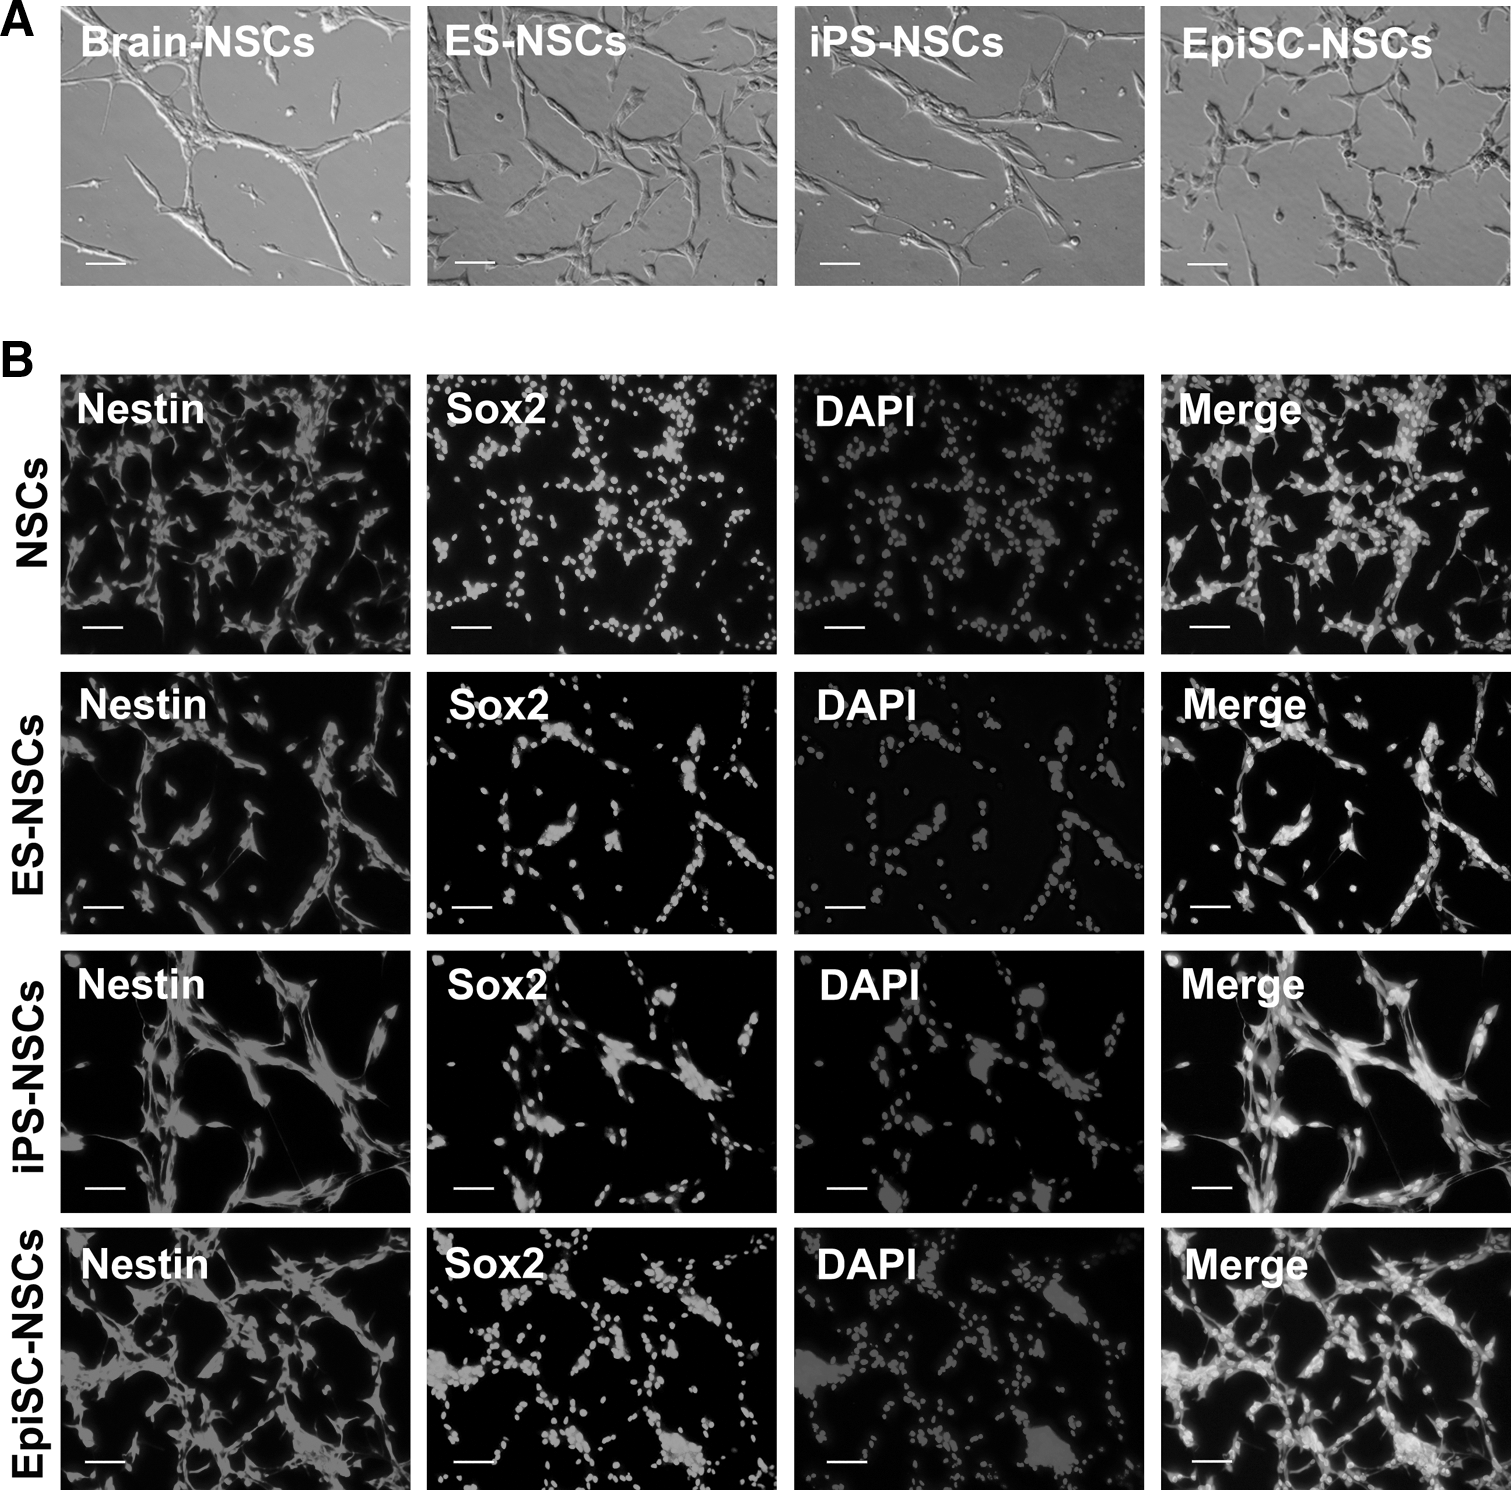
Generation of neural stem cells (NSCs) from three different types of pluripotent stem cells.
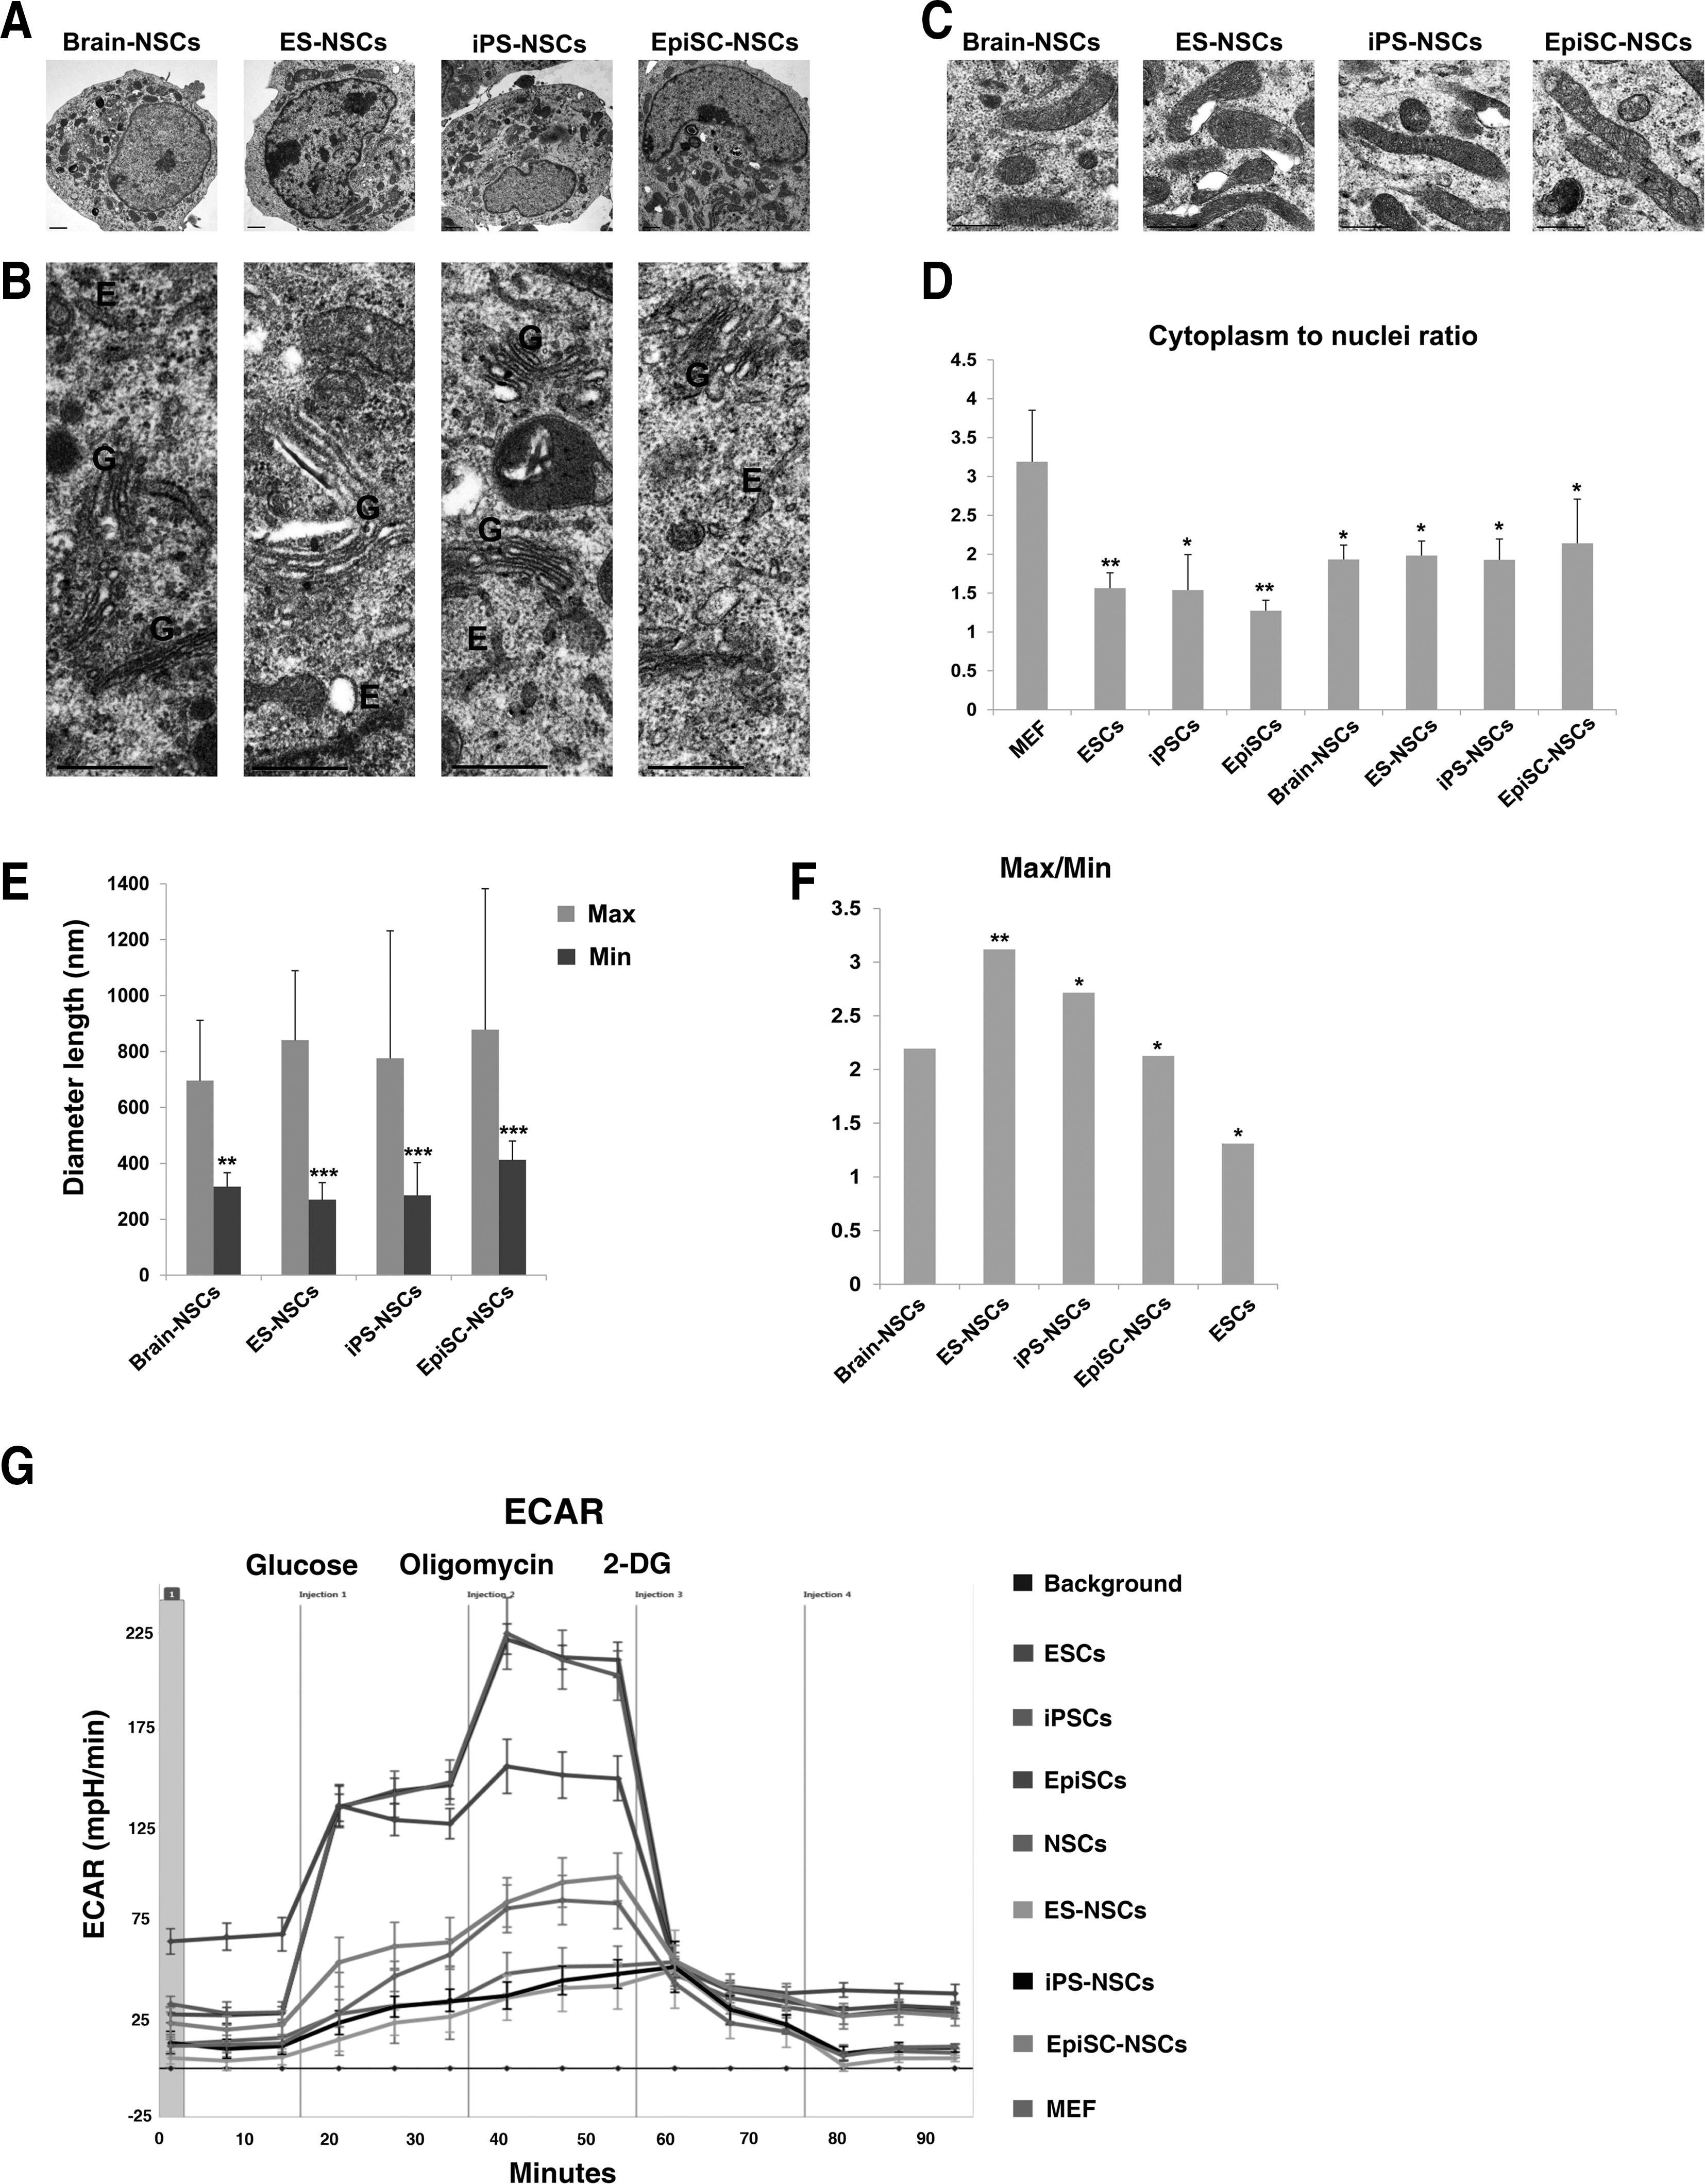
Cellular organelles of NSCs differentiated from pluripotent stem cells and brain-derived NSCs and metabolic changes during reprogramming and differentiation.
The extent of elongation in mitochondria was measured as the Max/Min of mitochondria in NSCs differentiated from ESCs, iPSCs, and EpiSCs, and from brain-derived NSCs. The mean value for Max/Min of ESC-, iPSC-, and EpiSC-derived NSCs was 3.12, 2.71, and 2.13, respectively, which was closer to that of brain-derived NSCs (Max/Min=2.19). The mean values for Max/Min of these pluripotent stem cell-derived NSCs were higher compared with pluripotent ESCs (Fig. 4E, F), indicating that immature mitochondria develop to mature mitochondria during differentiation. It seems that NSCs differentiated from pluripotent stem cells contain a bit longer mitochondria than brain-derived NSCs. Thus, the in vitro differentiation procedure may affect the extent of the Max/Min ratio of mitochondria. Taken together, these data indicate that ESCs, iPSCs, and EpiSCs follow a path of development that is apparent in organelle size and morphology, and that NSCs derived from both naive and primed stem cells are structurally indistinguishable from brain tissue-derived NSCs.
Metabolism changes accompany morphological changes of mitochondria during reprogramming and differentiation of pluripotent stem cells
Maturity of mitochondria is related to energy metabolism. Cells containing immature mitochondria primarily require glycolysis for energy production, but cells containing mature mitochondria mainly use aerobic respiration [13,21,22]. To compare the metabolic status in pluripotent stem cells and differentiated cells, we measured ECARs, which correlate with the glycolytic activity. After treatment with glucose, ECARs for ESCs and iPSCs were almost identical, but substantially higher compared with EpiSCs, which in turn were higher than those of differentiated cells, NSCs, and MEFs (Fig. 4G). Although ECARs increased in all samples after treatment with oligomycin (an ATP synthase inhibitor), ECARs of ESCs and iPSCs were distinctive (Fig. 4G), indicating that naive pluripotent stem cells were more highly glycolytic than primed pluripotent stem cells and differentiated cells. To measure the requirement for glycolysis, all samples were treated with an inhibitor of glycolysis, 2-DG. ECARs were dramatically decreased in both naive and primed pluripotent stem cells, but the decreased ECAR of EpiSCs was less than those of ESCs and iPSCs, indicating again that naive pluripotent stem cells are more glycolytic than primed pluripotent stem cells. On the other hand, ECARs dropped mildly in NSCs differentiated from the three types of pluripotent stem cells. These results indicate that naive pluripotent stem cells carrying immature mitochondria mainly use anaerobic metabolism and that, conversely, glycolysis is no longer the main source of energy in NSCs carrying mature mitochondria that allow for aerobic metabolism. Taken together, these results demonstrate the metabolic changes that accompany the mitochondrial remodeling induced by reprogramming and differentiation.
Discussion
In this study, we compared the morphology of mitochondria between naive and primed pluripotent stem cells and between these cells and pluripotent stem cell-derived NSCs. The naive pluripotent ESCs and reprogrammed iPSCs from MEFs contained round-shaped mitochondria and immature cristae, indicating that reprogramming toward a naive pluripotent state entails the remodeling of cytoplasmic organelles. The primed pluripotent EpiSCs contained both round and elongated mitochondria and more mature cristae than ESCs. We found that NSCs differentiated from naive or primed pluripotent stem cells were indistinguishable from control brain-derived NSCs with respect to the morphology of mitochondria and other cellular organelles. Mitochondrial remodeling during reprogramming and differentiation was also accompanied by a change in energy metabolism. ESCs and iPSCs were more glycolytic than EpiSCs; and EpiSCs, in turn, were more glycolytic than NSCs differentiated from ESCs, iPSCs, and EpiSCs. Previous reports demonstrated that naive pluripotent cells, mouse ESCs, used mitochondrial respiration for cellular ATP demands, but that primed pluripotent cells, EpiSCs and human ESCs, were defective in mitochondrial function, mainly relying on glycolysis for cellular ATP demands despite their more mature mitochondria [10]. These data are not in accordance with our results. In the earlier study, negative controls and somatic cells were not used for comparison with pluripotent stem cells. Somatic cells such as MEFs or NSCs can provide a standard for highly elongated mature mitochondria, which actively produce ATP using aerobic respiration. Many other researchers have suggested that the change in metabolic regulation is associated with cellular differentiation. Compared to adult somatic cells that utilize aerobic metabolism for energy production, pluripotent stem cells depend heavily on anaerobic glycolysis [13,21,22]. Therefore, mitochondrial morphology and function are associated with cell potency. We argue that if cells do not need aerobic metabolism, they may not waste energy in developing mature mitochondria.
Previous results demonstrated that NSCs could be differentiated from naive and primed pluripotent stem cells in vitro [15,16,19,20]. NSCs from different types of pluripotent stem cells were similar to brain-derived NSCs in morphology, NSC marker expression, and capacity to further differentiate into neurons and glial cells. Recently, we showed that EpiSC-derived NSCs were slightly distinct from brain-derived NSCs, and were very similar to ESC-derived NSCs in their gene expression pattern [16]. In the present study, however, we demonstrated that NSCs differentiated in vitro from naive and primed pluripotent stem cells were indistinguishable from brain-derived NSCs at the ultrastructure level. Moreover, we found that mitochondrial remodeling during differentiation entails a change in the main source of energy metabolism. Taken together, these results suggest that differentiation of pluripotent stem cells (irrespective of a naive or primed pluripotent progenitor) into NSCs results in the remodeling of mitochondria and a change in energy metabolism. Immature mitochondria developed into mature mitochondria, and the primary metabolic pathway changed from glycolysis to mitochondrial respiration during differentiation. In this study, we clearly showed that cellular reprogramming and differentiation are accompanied by the dynamic remodeling of cellular organelles and metabolic systems and that these changes may be essential for complete reprogramming.
Footnotes
Acknowledgment
This article was supported by the Konkuk University in 2014.
Author Disclosure Statement
No competing financial interests exist.
References
Supplementary Material
Please find the following supplemental material available below.
For Open Access articles published under a Creative Commons License, all supplemental material carries the same license as the article it is associated with.
For non-Open Access articles published, all supplemental material carries a non-exclusive license, and permission requests for re-use of supplemental material or any part of supplemental material shall be sent directly to the copyright owner as specified in the copyright notice associated with the article.