
Abstract
Cellular adhesion enables communication between cells and their environment. Adhesion can be achieved throughout focal adhesions and its components influence osteoblast differentiation of human mesenchymal stem cells (hMSCs). Because cell adhesion and osteoblast differentiation are closely related, this article aimed to analyze the expression profiles of adhesion-related proteins during osteoblastic differentiation of two hMSCs subpopulations (CD105+ and CD105−) and propose a strategy for assembling bone grafts based on its adhesion ability. In vitro experiments of osteogenic differentiation in CD105− cells showed superior adhesion efficiency and 2-fold increase of α-actinin expression compared with CD105+ cells at the maturation stage. Interestingly, levels of activated β1-integrin increased in CD105− cells during the process. Additionally, the CD105− subpopulation showed 3-fold increase of phosphorylated FAKY397 compared to CD105+ cells. Results also indicate that ERK1/2 was activated during CD105− bone differentiation and participation of mitogen-activated protein kinase (MAPK)-p38 in CD105+ differentiation through a focal adhesion kinase (FAK)-independent pathway. In vivo trial demonstrated that grafts containing CD105− showed osteocytes embedded in a mineralized matrix, promoted adequate graft integration, increased host vascular infiltration, and efficient intramembranous repairing. In contrast, grafts containing CD105+ showed deficient endochondral ossification and fibrocartilaginous tissue. Based on the expression of α-actinin, FAKy,397 and ERK1/2 activation, we define maturation stage as critical for bone graft assembling. By in vitro assays, CD105− subpopulation showed superior adhesion efficiency compared to CD105+ cells. Considering in vitro and in vivo assays, this study suggests that integration of a scaffold with CD105− subpopulation at the maturation stage represents an attractive strategy for clinical use in orthopedic bioengineering.
Introduction
T
Cell contact with ECM proteins plays a critical role in regulating osteogenesis from human mesenchymal stem cells (hMSCs) [19 –21]. Osteoprogenitors, as well as other cell types, need to be firmly attached to the substrate to initiate differentiation. In bone formation, the expansion of the osteoblast population ultimately leads to maturation and mineralization of the bone matrix. In vivo and in vitro, osteoblasts exhibit three functional stages: (1) cell proliferation and synthesis of the organic component of the bone matrix, (2) bone matrix maturation, in which changes in the composition and organization of the matrix foster mineralization, and (3) mineral deposit. In vitro, these stages overlap and can be defined by the activation of genes like c-FOS, c-JUN, CBFA1, and type I collagen as observed during the first stage [22,23]. CBFA1 is essential for osteoblast differentiation and bone formation in this stage [22].
The alkaline phosphatase (ALP) activity increases during the second stage and reaches its peak during the third stage before decreasing during the matrix maturation stage. In this stage, bone sialoprotein, osteopontin, and osteocalcin present their highest expression levels [23 –25]. We previously isolated two subpopulations of hMSCs based on the coexpression of the surface markers CD44, CD73, and CD105. We demonstrated the presence of a transcription factor triad (OCT3/4, SOX3, and NANOG) to confirm their undifferentiated state and characterized the immunophenotype profile, including MSC and hematopoietic stem cell markers. In both subpopulations, an MSC profile was consistent [26]. Both subpopulations were able to initiate differentiation. However, differences in the time required to reach osteoblastic maturity and mineralization efficiency during induction with dexamethasone were evidenced [26].
Because cell adhesion and osteoblast differentiation of hMSCs are closely related [27 –29], in this study we propose a strategy for the cohesive assembling of a successful bone graft, based on the expression of adhesion-related proteins and mitogen-activated protein kinase (MAPK) pathways of the CD105+ and CD105− subpopulations to support osteogenic differentiation in vitro and in vivo.
Materials and Methods
Isolation of CD105+ and CD105− hMSC subpopulations from the amniotic membrane by fluorescence-activated cell sorting
Thirty caesarean-delivered term placentas were collected from healthy donor mothers. This research was approved by the Ethics Committee at the Dr. Manuel Gea González General Hospital and each donor provided a written consent. The amniotic membrane was mechanically separated from the underlying chorion by blunt dissection. Membrane fragments were subjected to enzymatic digestion [26]. For cell sorting, a single suspension of amniotic membrane-hMSCs (7 × 10⁶) was stained with anti-human-specific antibodies CD73-phycoerythrin (BioLegend), CD44-biotin (Serotec), and CD105-APC (BioLegend). Isotype-matched controls were applied in parallel as controls. The sorted CD44+/CD73+/CD105+ (CD105+ subpopulation) and CD44+/CD73+/CD105− (CD105− subpopulation) cells were expanded for the subsequent assays.
Osteogenic differentiation
Cells were plated at 2 × 10³ cells/cm2 in osteogenic medium, which contained Dulbecco's modified Eagle's medium (DMEM; Gibco) supplemented with 10% fetal bovine serum, 10 mM β-glycerophosphate, 0.25 mM ascorbic acid, and 10−8 M dexamethasone (Sigma-Aldrich). The cultures were maintained for 3 weeks and the phenotype was confirmed by bone ALP activity assay.
Assessment of the proliferation by alamarBlue's method
Cells at a density of 2,000 cells/well were seeded into six-well plates and grown for 5 days at 37°C and 5% CO2. Each day, the culture media were removed and DMEM (Gibco) containing 10% alamarBlue (AB) (Invitrogen) was added to the cell culture. After 4 h, the reduction of AB was quantified at 570 nm using an EPOCH™ spectrophotometer (BioTek Instruments, Inc.)
Bone ALP activity assay
Cells (106 cells/mL) cultured in six-well plates were harvested on days 0, 3, 5, 7, 9, and 14 postinduction days (PID). Additionally, subpopulations were cultured with DMEM as negative controls. The cell lysis was achieved with 1% Triton X-100 in 0.9% NaCl at 4°C. After centrifugation, the supernatant was assayed for ALP activity using the MicroVue kit (Quidel Corporation) in accordance with the manufacturer's instructions. The quantitative kinetic determination of cell-associated ALP activity (U/mg protein) was determined at 405 nm using an EPOCH spectrophotometer (BioTek Instruments, Inc.) and normalized to total protein concentration, which was determined through the Lowry protein assay [30].
Calcium deposition quantification
Cells (104 cells/mL) cultured in six-well plates were harvested at days 0, 9, 14, and 21 PID and decalcified with 0.6 M HCl at 37°C for 24 h to extract the intracellular calcium content. The supernatant from the acid extraction was analyzed by staining with Alizarin red using the Osteogenesis Quantitation Kit (Millipore Corporation) according to the manufacturer's instructions. The absorbance was determined at 405 nm using an EPOCH spectrophotometer (BioTek Instruments, Inc.) and normalized by the protein concentration.
RNA extraction and reverse transcription–polymerase chain reaction
The total RNA was extracted from 0.5 × 10⁶ cells using the TRIzol reagent (Invitrogen). Single-stranded cDNA was synthesized using the ImProm Reverse Transcription System kit (Promega) according to the manufacturer's instructions. For polymerase chain reaction (PCR) amplification, 250 ng of cDNA was used as the template and mixed with 10 mM of each dNTP, 1.5 mM MgCl2, 10 picomoles of each primer, and 0.5 U/μL Taq DNA polymerase (Promega). The reaction was performed in a MaxyGene thermal cycler (Stuart Scientific). The PCR programs were performed according to the primer specifications described in Table 1. The amplification products were examined by electrophoresis in a 2% agarose gel stained with ethidium bromide and documented in a UV transilluminator. α-TUBULIN was used as the control. The pixel density of each fragment and their ratios were determined with LabWorks 4.0 (Image Acquisition and Analysis Software; UVP BioImaging Systems, UVP). These ratios represented the relative expression of each mRNA and were used for semiquantitative analysis.
Western blotting
Western blotting was performed using standard methods. Cells were washed with cold phosphate-buffered saline (PBS) and lysed using RIPA buffer [20 mMTris-HCl (pH 7.5), 150 mM NaCl, 1 mM EDTA, 1% Nonidet P-40, 1% sodium deoxycholate] containing Complete™ (Roche, Molecular Biochemicals). Lysates were centrifuged at 14,000 rpm for 15 min at 4°C. Proteins were resolved by sodium dodecyl sulfate–polyacrylamide gel electrophoresis and transferred to a polyvinylidene difluoride membrane (Millipore Corporation). Immunoblotting was performed with one of the following antibodies: rabbit anti-human paxillin, FAK, CBFA1, COL1, SPARC, and β1-integrin (Santa Cruz Biotechnology), mouse anti-human talin, vinculin, and α-actinin (Santa Cruz Biotechnology), rabbit anti-human pβ1-integrinT788/T789 and pFAKT397 (Invitrogen), and mouse anti-human actin (kindly donated by Dr. Manuel Hernandez), as per the antibody manufacturer's details.
Analysis of ERK and p38 activation by immunobead multiplex assay
According to the osteoblastic differentiation stages, the CD105+ and the CD105− subpopulations were harvested, and the phosphorylated (phospho-) and total protein levels were analyzed by a multiplex immunobead-based assay according to the manufacturer's protocol (Millipore). In addition, an assay specificity control was incorporated; the CD105+ and CD105− subpopulations were induced to differentiate and preincubated for 1 h with 15 μM of PD98059 (Sigma-Aldrich) or SB203580 (Sigma-Aldrich) (inhibitors for the ERK1/2 and p38-MAPK pathways, respectively).
Cells were homogenized and 2 μg of total protein from each sample was added to beads coupled to phospho-ERK1/2 and phospho-p38-specific capture antibodies (Millipore). A separate assay was run with mixture of beads coupled to total ERK1/2- and total p38-specific capture antibodies (Millipore). Fluorescence signals of phospho- and total ERK1/2 and p38 kinases (determined as the median fluorescence intensity in arbitrary units for each molecule in each sample) were measured (Luminex 100 IS 2.3 system; Luminex) and analyzed in triplicate using the Bio-Plex Manager software version 4.1.
Indirect immunofluorescence
Cells (2 × 10³ cells/cm2) were plated on glass coverslips in six-well culture plates and induced with osteogenic medium. Cells were rinsed with cytoskeleton buffer (CB) (10 mM MES pH 6.1, 138 mM KCl, 3 mM MgCl2, 2 mM EGTA, and 0.32 M sucrose) and then fixed with 3% formaldehyde-CB. Fixed cells were then incubated overnight with rabbit anti-human β1-integrin (Santa Cruz Biotechnology), and incubated again with FITC-conjugated goat anti-rabbit (Zymed) and phalloidin-rhodamine (Sigma-Aldrich) included at 0.1 μg/μL. The slides were assembled with VECTASHIELD® Mounting Media (Vector Laboratories, Inc.) containing DAPI. Fluorescent labeling was visualized under an Olympus FluoView FV1000 confocal microscope with an attached MRC1024 LSCM system (Bio-Rad).
Adhesion assays
To evaluate the in vitro adhesion of subpopulations at the maturation stage, 2,000 cells/well were seeded into six-well plates coated with collagen I (Corning) and induced with the osteogenic medium for 6 or 4 days (CD105+ or CD105− subpopulation, respectively). Agitation of the cultured cells was achieved for 5 min in a shaker rotating at 1,500 rpm using a microplate shaker (Micromixer mx2; Daigger). The nonadherent cells were removed through three gentle washes with PBS, and the remaining adherent cells were estimated using AB's method (Invitrogen) as described above.
Bone graft preparation and transplantation
Before implantation, CD105+ and CD105− cells were cultured with osteogenic media as a monolayer during 9 or 5 days, respectively. Then, 5 × 10⁵ cells were cultured 1 week more onto a premoistened bovine bone matrix Nukbone® (NKB) as a three-dimensional structure. NKB is a human bone biomimetic material from the bovine distal femoral condyle that preserves its physiological topography after a gentle method of scaffold recovery [31].
The assembled bioactive scaffolds were implanted in critical-size defects created bilaterally over the tibia of 6 Beagle dogs (1–2 years old). The dogs were anesthetized using a combination of ketamine and xylazine (60 and 4 mg/kg, respectively) administered through intramuscular injections. A midline skin incision over the proximal tibial metaphysis of the right and left was made ∼5–8 inches, then proceeded to drilling 5 mm diameter by 20 mm in length with a conventional drill. The right defects were grafted with acellularized NKB as control, and defects on the left with CD105+ allograft or CD105− allograft. After 7 weeks, animals were sacrificed and samples were subjected to histological sectioning. Bone-implant contact and bone area were evaluated by staining with Hematoxylin and eosin (H&E). It should be noted that all animal surgery procedures were performed under protocols approved by the University Committee of Animal Resources.
Histological studies
The harvested tibias were placed in 10% buffered formaldehyde. Using an oscillating saw, histological specimens were segmented longitudinally and then decalcified in 10% HCl for 10 days. After complete decalcification, samples were embedded in paraffin, sectioned at 4 μm and stained with H&E and Masson's Trichrome. At least three nonconsecutive sections were prepared from each specimen and imaged using an Olympus VS110 Virtual Microscopy System for whole slide scanning.
Immunohistochemistry analysis
Following paraffin removal from the tissue sections, they were hydrated by incubation in 95%, 90%, 80%, and 70% ethanol for 5 min. After antigen retrieval with Tris-EDTA (pH 9.0) solution for 30 min, sections were immersed in PBS-H2O2 (0.01 mL, pH 7.0, PBS 99 mL+30% H2O2 1 mL) for 20–30 min, at room temperature to eliminate the endogenous peroxidase. The sections were washed in distilled water for 5 min, and then washed in PBS for another 5 min. Before incubation in primary antibody, sections were immersed in nonimmune serum (6% bovine serum albumin). Subsequently rabbit anti-human RUNX2 (Santa Cruz Biotechnology), anti-human osteopontin (Abcam, Inc.), anti-human Sox9 (Abcam, Inc.), and anti-human Collagen II (Abcam, Inc.) all at a 1:200 dilution were incubated at 4°C overnight. Then the biotinylated secondary antibody and ABC complex were applied and diaminobenzidie substrate was used to stain the section. The sections were counterstained with Hematoxylin to provide enhanced orientation of the tissue topography. As negative controls, slides were incubated with PBS 1% instead of primary specific antibodies. The images were acquired using a Nikon E600 microscope (Nikon Instruments, Inc.).
Statistical analysis
The data were analyzed with the SPSS 13.0 software (
Results
Temporality of the stages of osteoblast differentiation of the CD105+ and CD105− subpopulations
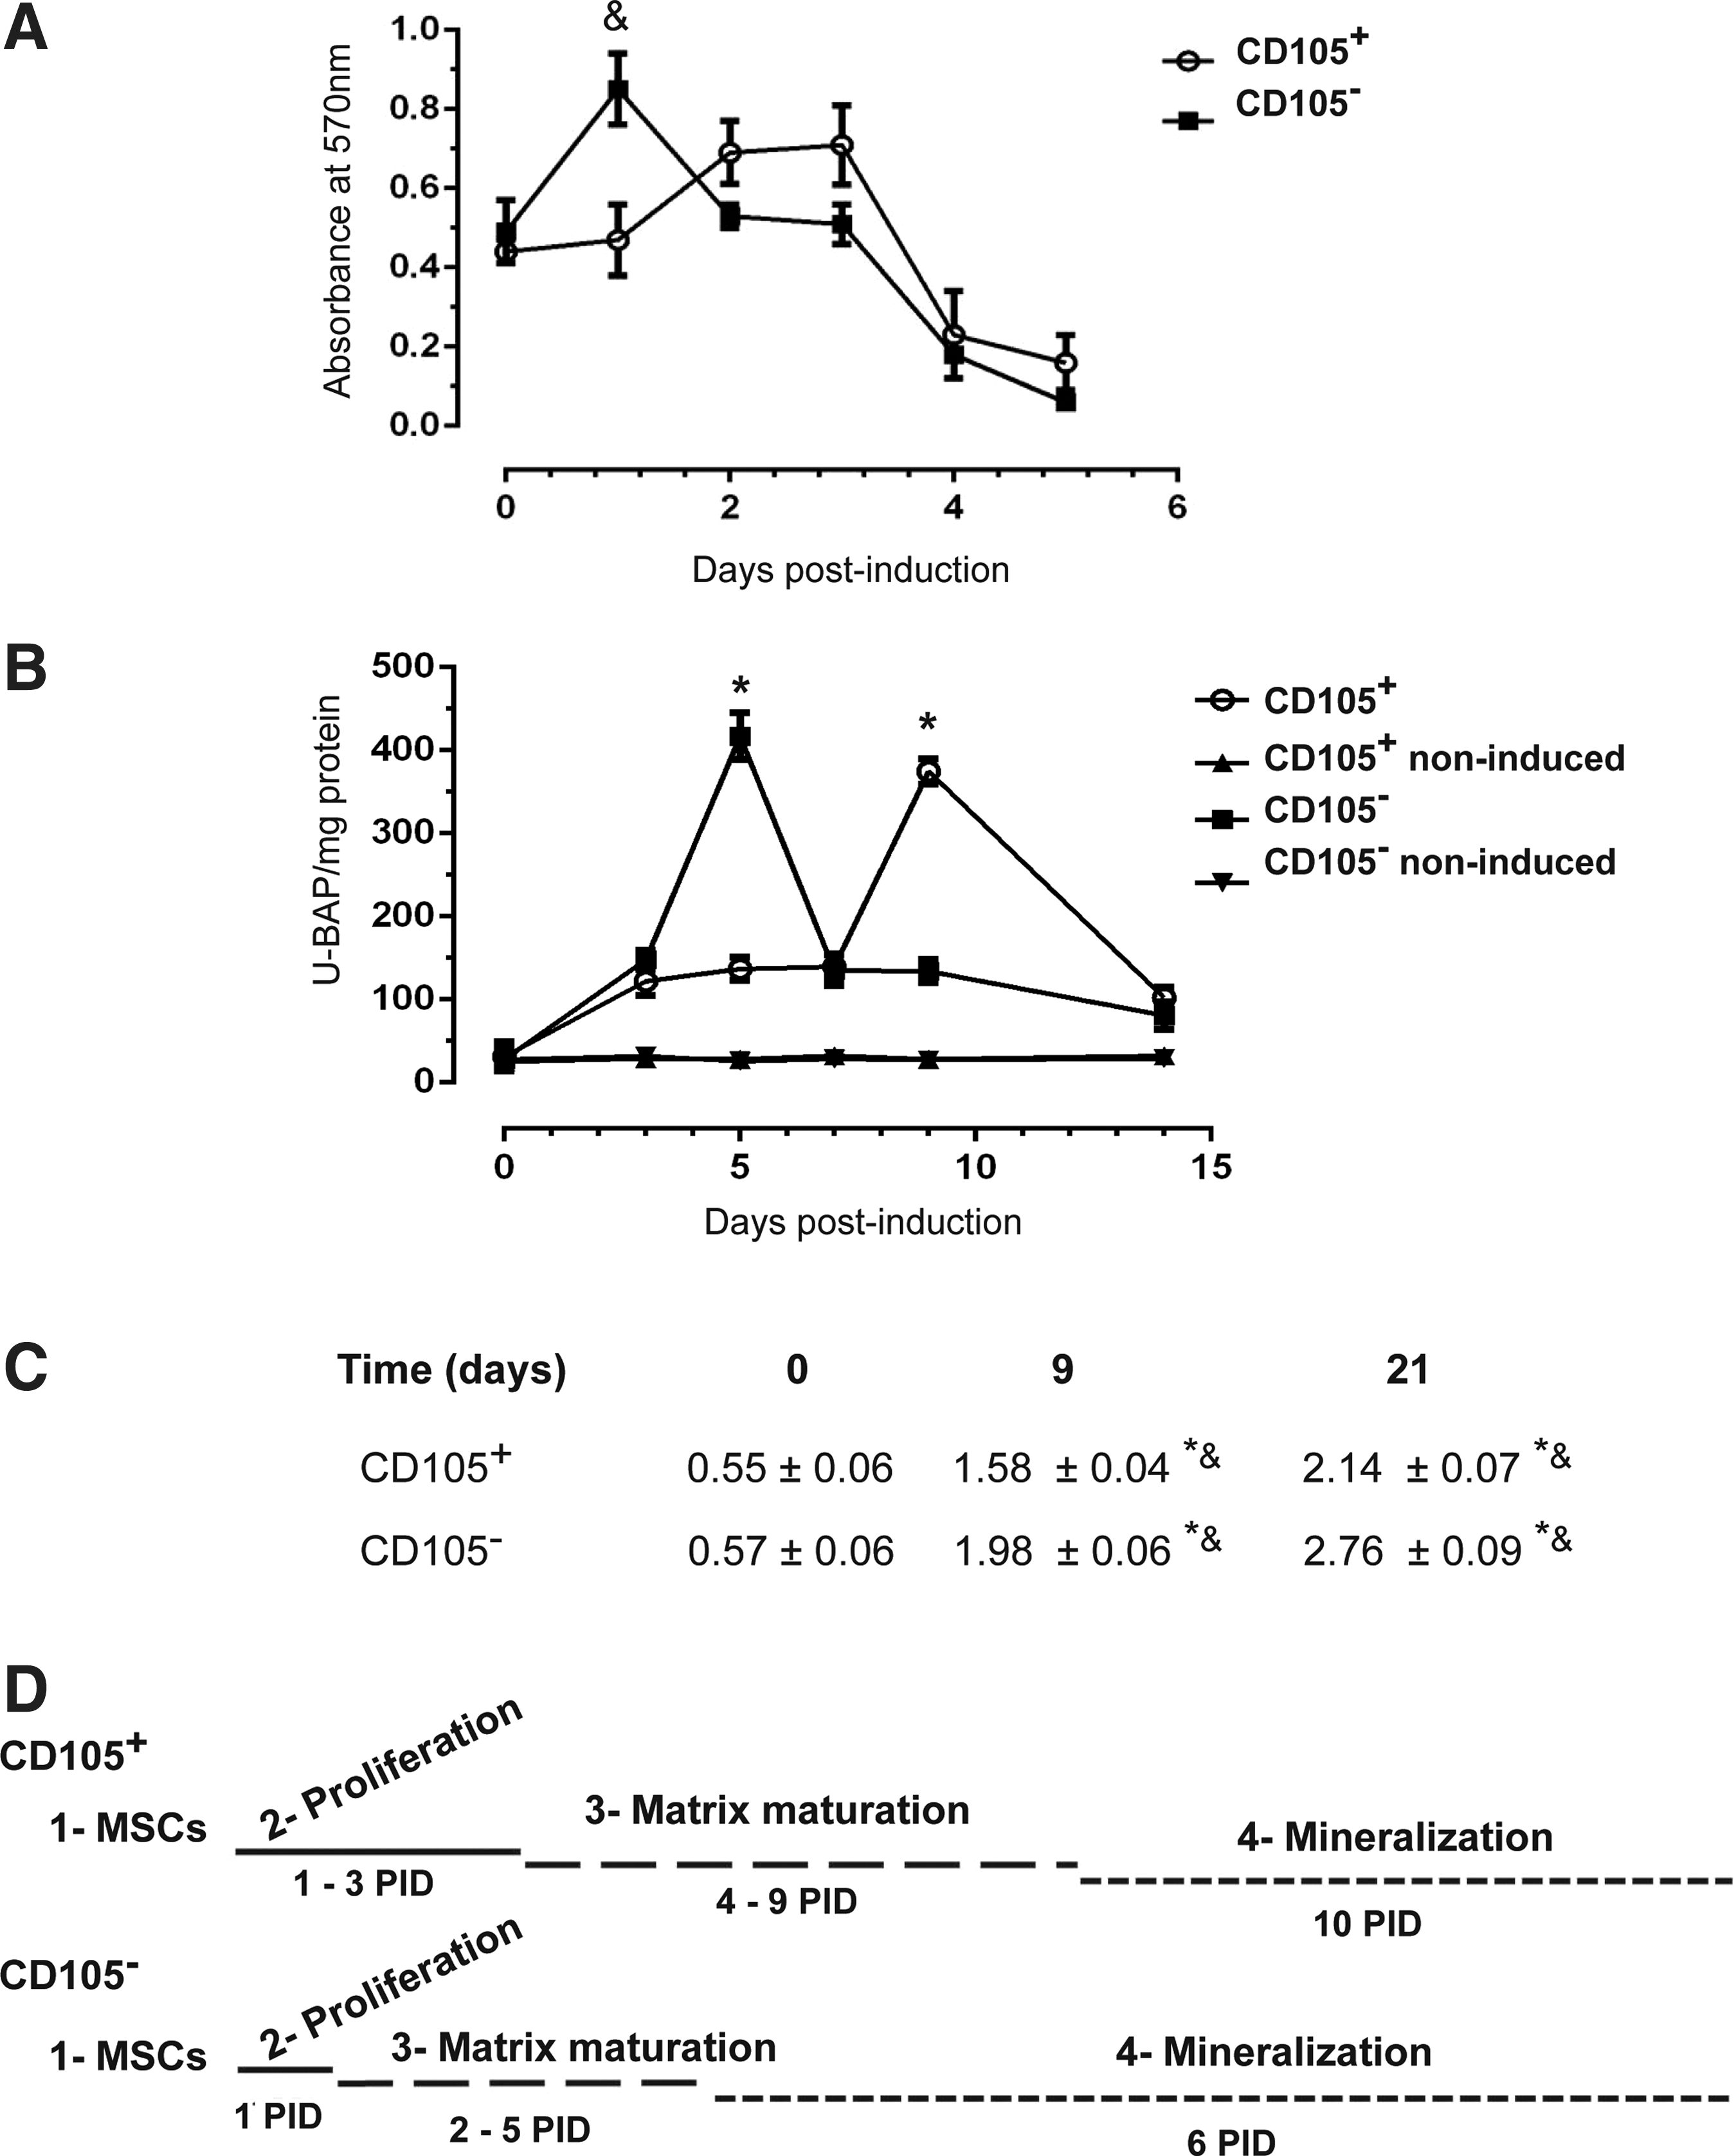
In our previous study, we isolated the CD105+ and CD105− subpopulations, characterized their immunophenotype, and demonstrated their osteoblastic differentiation ability [26]. To describe the temporality of each of the three stages of osteoblastic differentiation induced by dexamethasone, we analyzed molecular and cellular markers in both subpopulations. To define the first stage, the proliferation rate of subpopulations was measured in cultures whose confluence did not exceed 80%. The CD105+ subpopulation shows a gradual increase until day 3 after differentiation, at which proliferation begins to decrease (Fig. 1A, D).
Stages of osteoblastic differentiation in CD105+ and CD105− subpopulations.
In contrast, the CD105− subpopulation reached its maximum proliferation peak on day 1, which was thus defined as the conclusion of the first stage (Fig. 1A, D), and this was followed by a decrease in the proliferation rate with a concurrent increase in ALP activity. The end of the second stage is determined by a peak in ALP activity. An increase of four times compared with the baseline was observed for the CD105− subpopulation on day 5 and for the CD105+ subpopulation on day 9 (Fig. 1B, D).
Calcium accumulation in the extracellular space and its organization into hydroxyapatite crystals are important markers of osteoblast maturation. We measured calcium deposition by Alizarin red quantification and observed that the CD105+ subpopulation showed a less effective mineralization process in comparison with the CD105− subpopulation (Fig. 1C).
Based on these data, we summarized that the CD105+ subpopulation undergoes its proliferation stage during the first 3 days after induction, and this state is followed by matrix maturation between the 4th and 9th days. Finally, the mineralization stage is established since 10th day postinduction. In contrast, the CD105− subpopulation has a short first stage followed by a maturation stage between the 3rd and 5th days and the mineralization stage as early as the 6th day (Fig. 1D).
Expression of osteoblast-related genes during osteoblastic differentiation
The levels of mRNA transcripts and corresponding proteins from specific stage genes were examined in the dexamethasone-induced subpopulations. The expression of CBFA1 was observed since day 3 after differentiation. In the CD105+ subpopulation, the mRNA level remains low on day 3; however, we detected the protein until the 5th day (Fig. 2A, D). In contrast, the CD105− subpopulation showed the expression of both, the mRNA and protein, until the 7th day after induction (Fig. 2B, E).

Expression of osteoblast-related genes during osteoblastic differentiation of the CD105+ and CD105− subpopulations.
To determine the bone cell phenotype during the proliferation period, several genes associated with the formation of the ECM are actively expressed. The expression of type I collagen had no significant changes during the differentiation process in both the CD105+ and CD105− subpopulations (Fig. 2D–F). During the second stage, the ECM proteins undergo a series of modifications in their composition and organization that renders mineralization competence. With the mineralization onset at the beginning of stage three, other genes, such as SPARC, begin to be expressed. Given that SPARC is one of the main proteins involved in the fixation of calcium, its expression was analyzed. Although the trend in SPARC expression between the subpopulations was very similar, the expression level in the CD105− subpopulation was up to 4-fold greater than that observed for the CD105+ subpopulation (Fig. 2D–F).
The phosphorylation state of β1-integrin is modified during osteoblastic differentiation
To determine whether the delay in osteoblast differentiation and the efficiency of mineralization are associated with differences in the mechanisms related to cellular adhesion, the expression of some adhesion-related proteins was analyzed. The following assays were performed according to the temporality defined for each stage for both subpopulations (Fig. 1D).
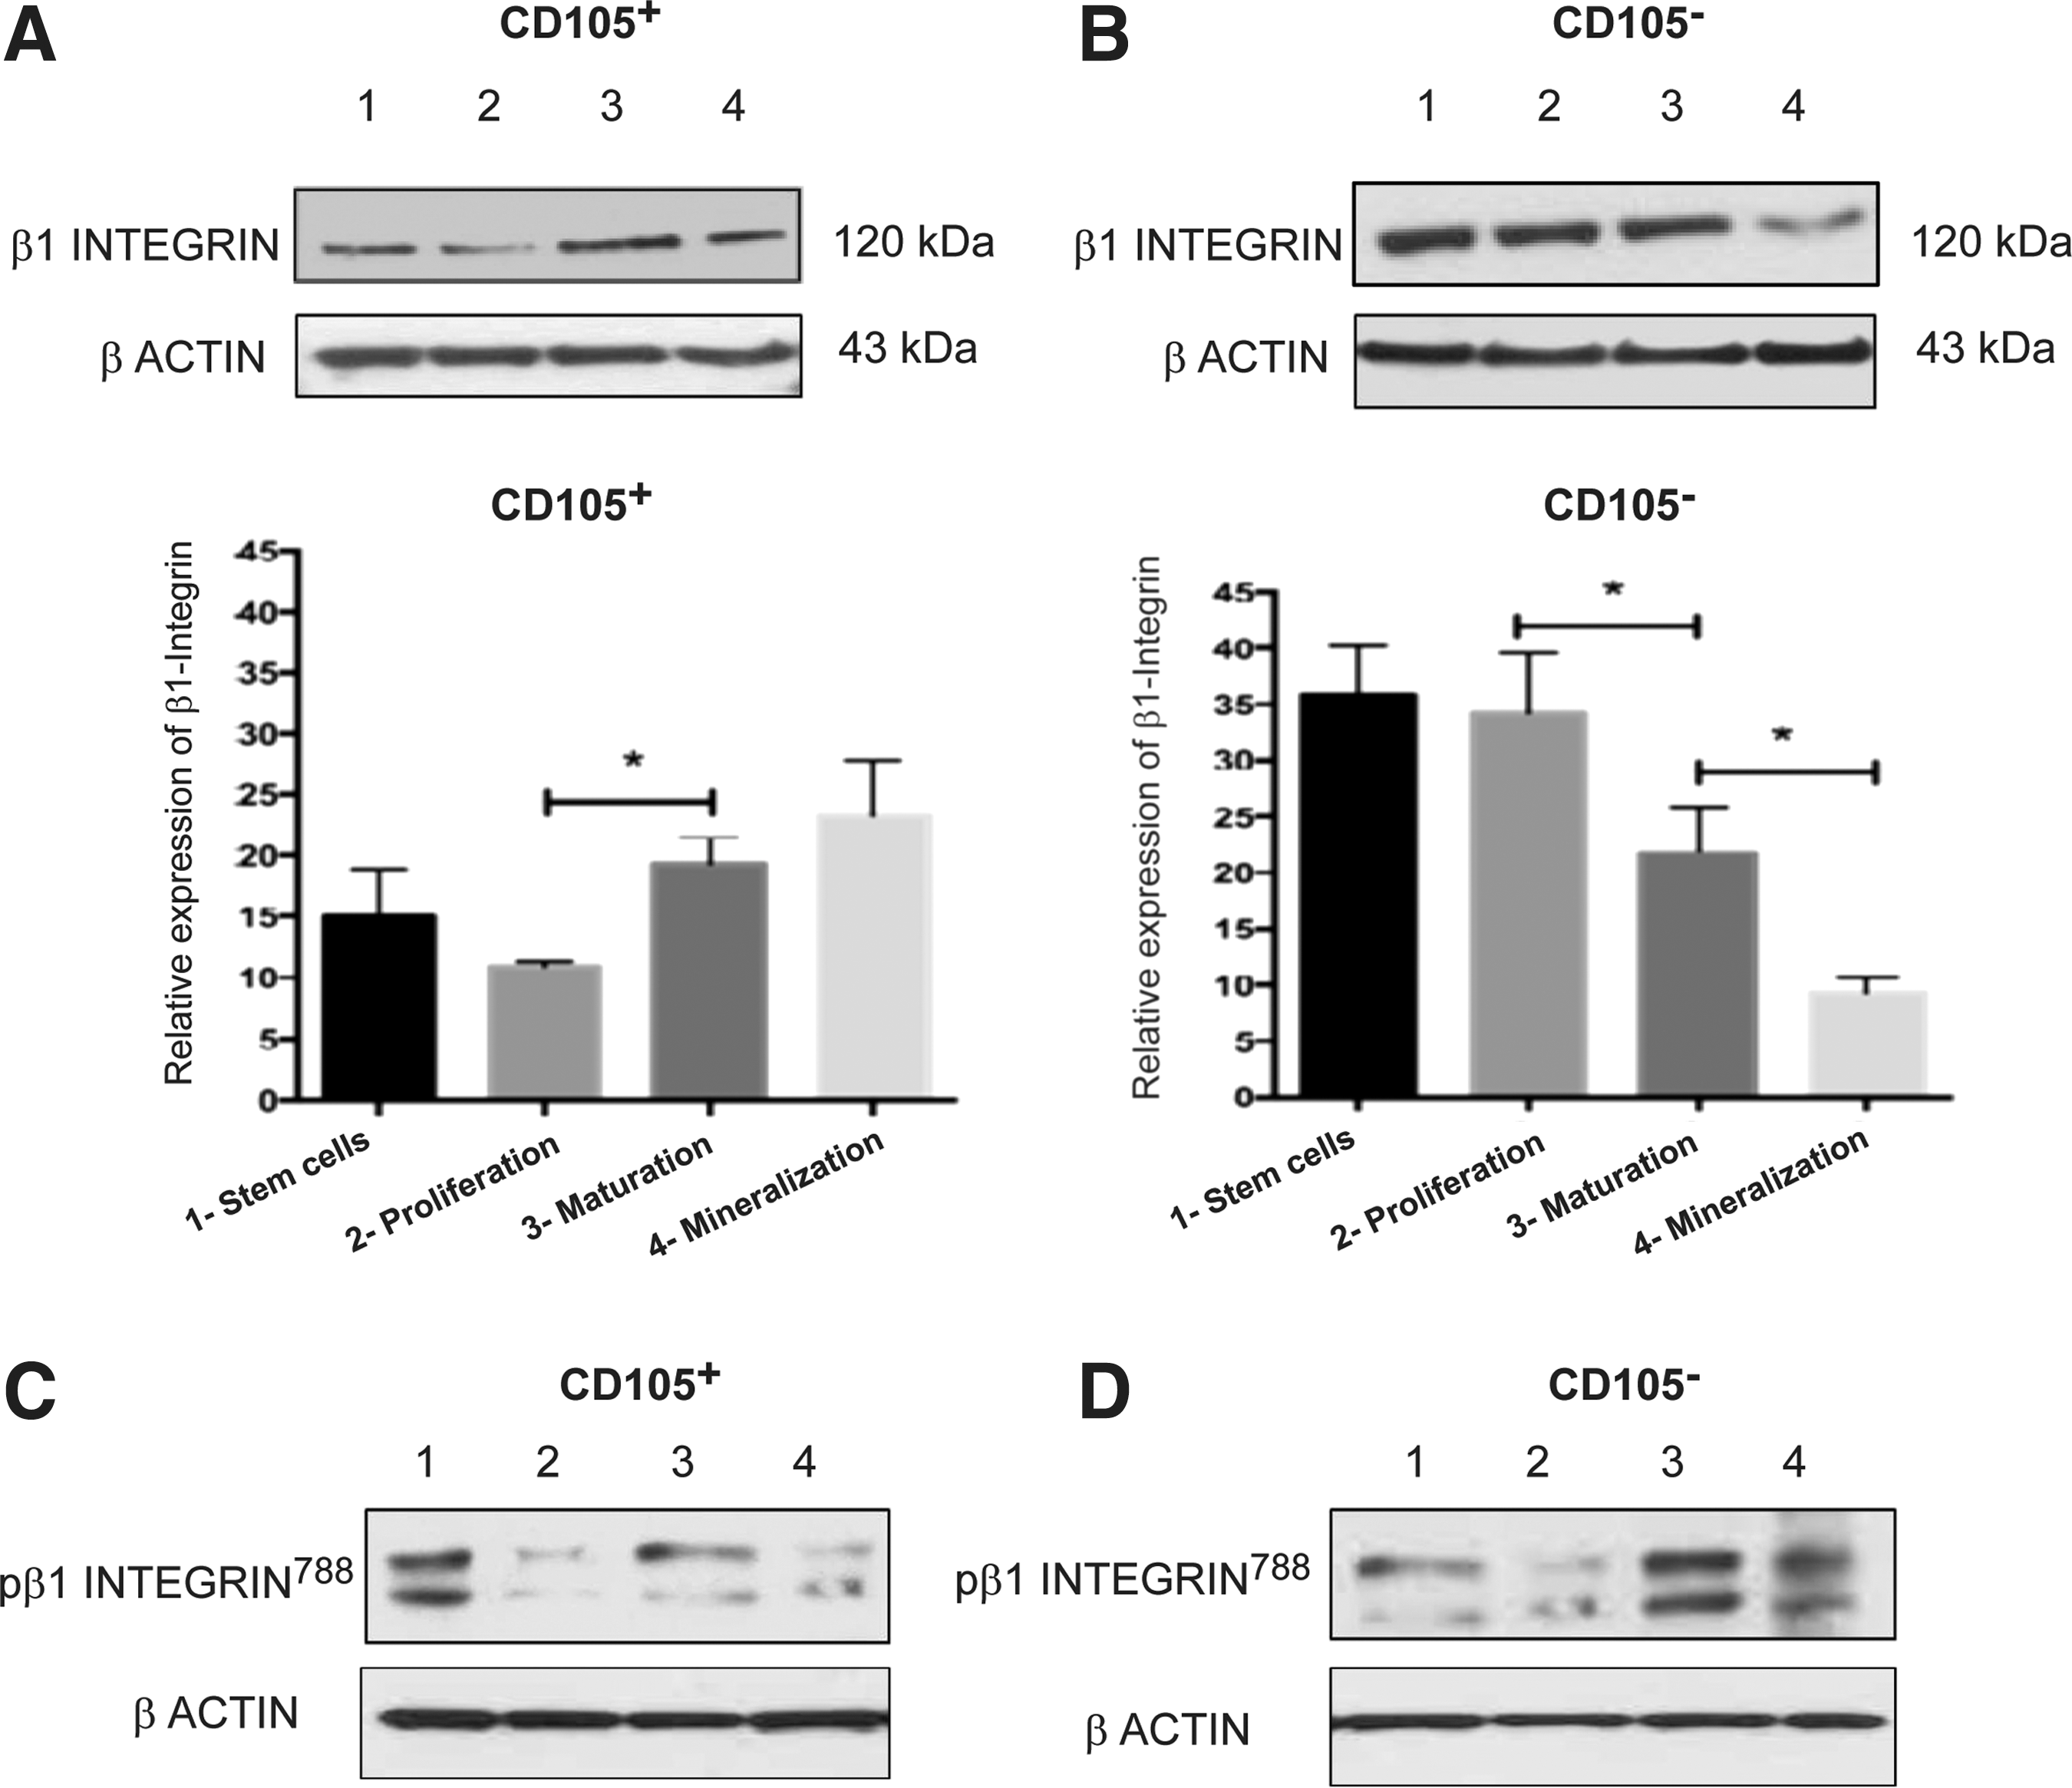
At the undifferentiated state, β1-integrin was expressed mainly in the CD105− subpopulation, that is, its expression in this population was 2.3-fold greater than that observed in the CD105+ subpopulation. The highest expression levels of this protein were observed in the CD105− subpopulation before the induction and triggering differentiation. However, the β1-integrin expression decreases by half on the second stage (Fig. 3A, B). Because this protein must be phosphorylated at residue Thr788 (pβ1-integrin) to undergo conversion from a low- to a high-affinity receptor, this form was studied. The CD105+ subpopulation shows the presence of β1-integrin in its active form. Additionally, when osteoblastic differentiation begins, the phosphorylated state decreased (Fig. 3C). In the CD105− population, the highest accumulation of pβ1-integrin was detected at the second differentiation stage, and this level was maintained until mineralization (Fig. 3D lane 3 and 4).
Expression of β1-integrin and pβ1-integrin788 along with osteoblastic differentiation of CD105+ and CD105−.
Expression profile of adhesion-related proteins during osteogenic differentiation
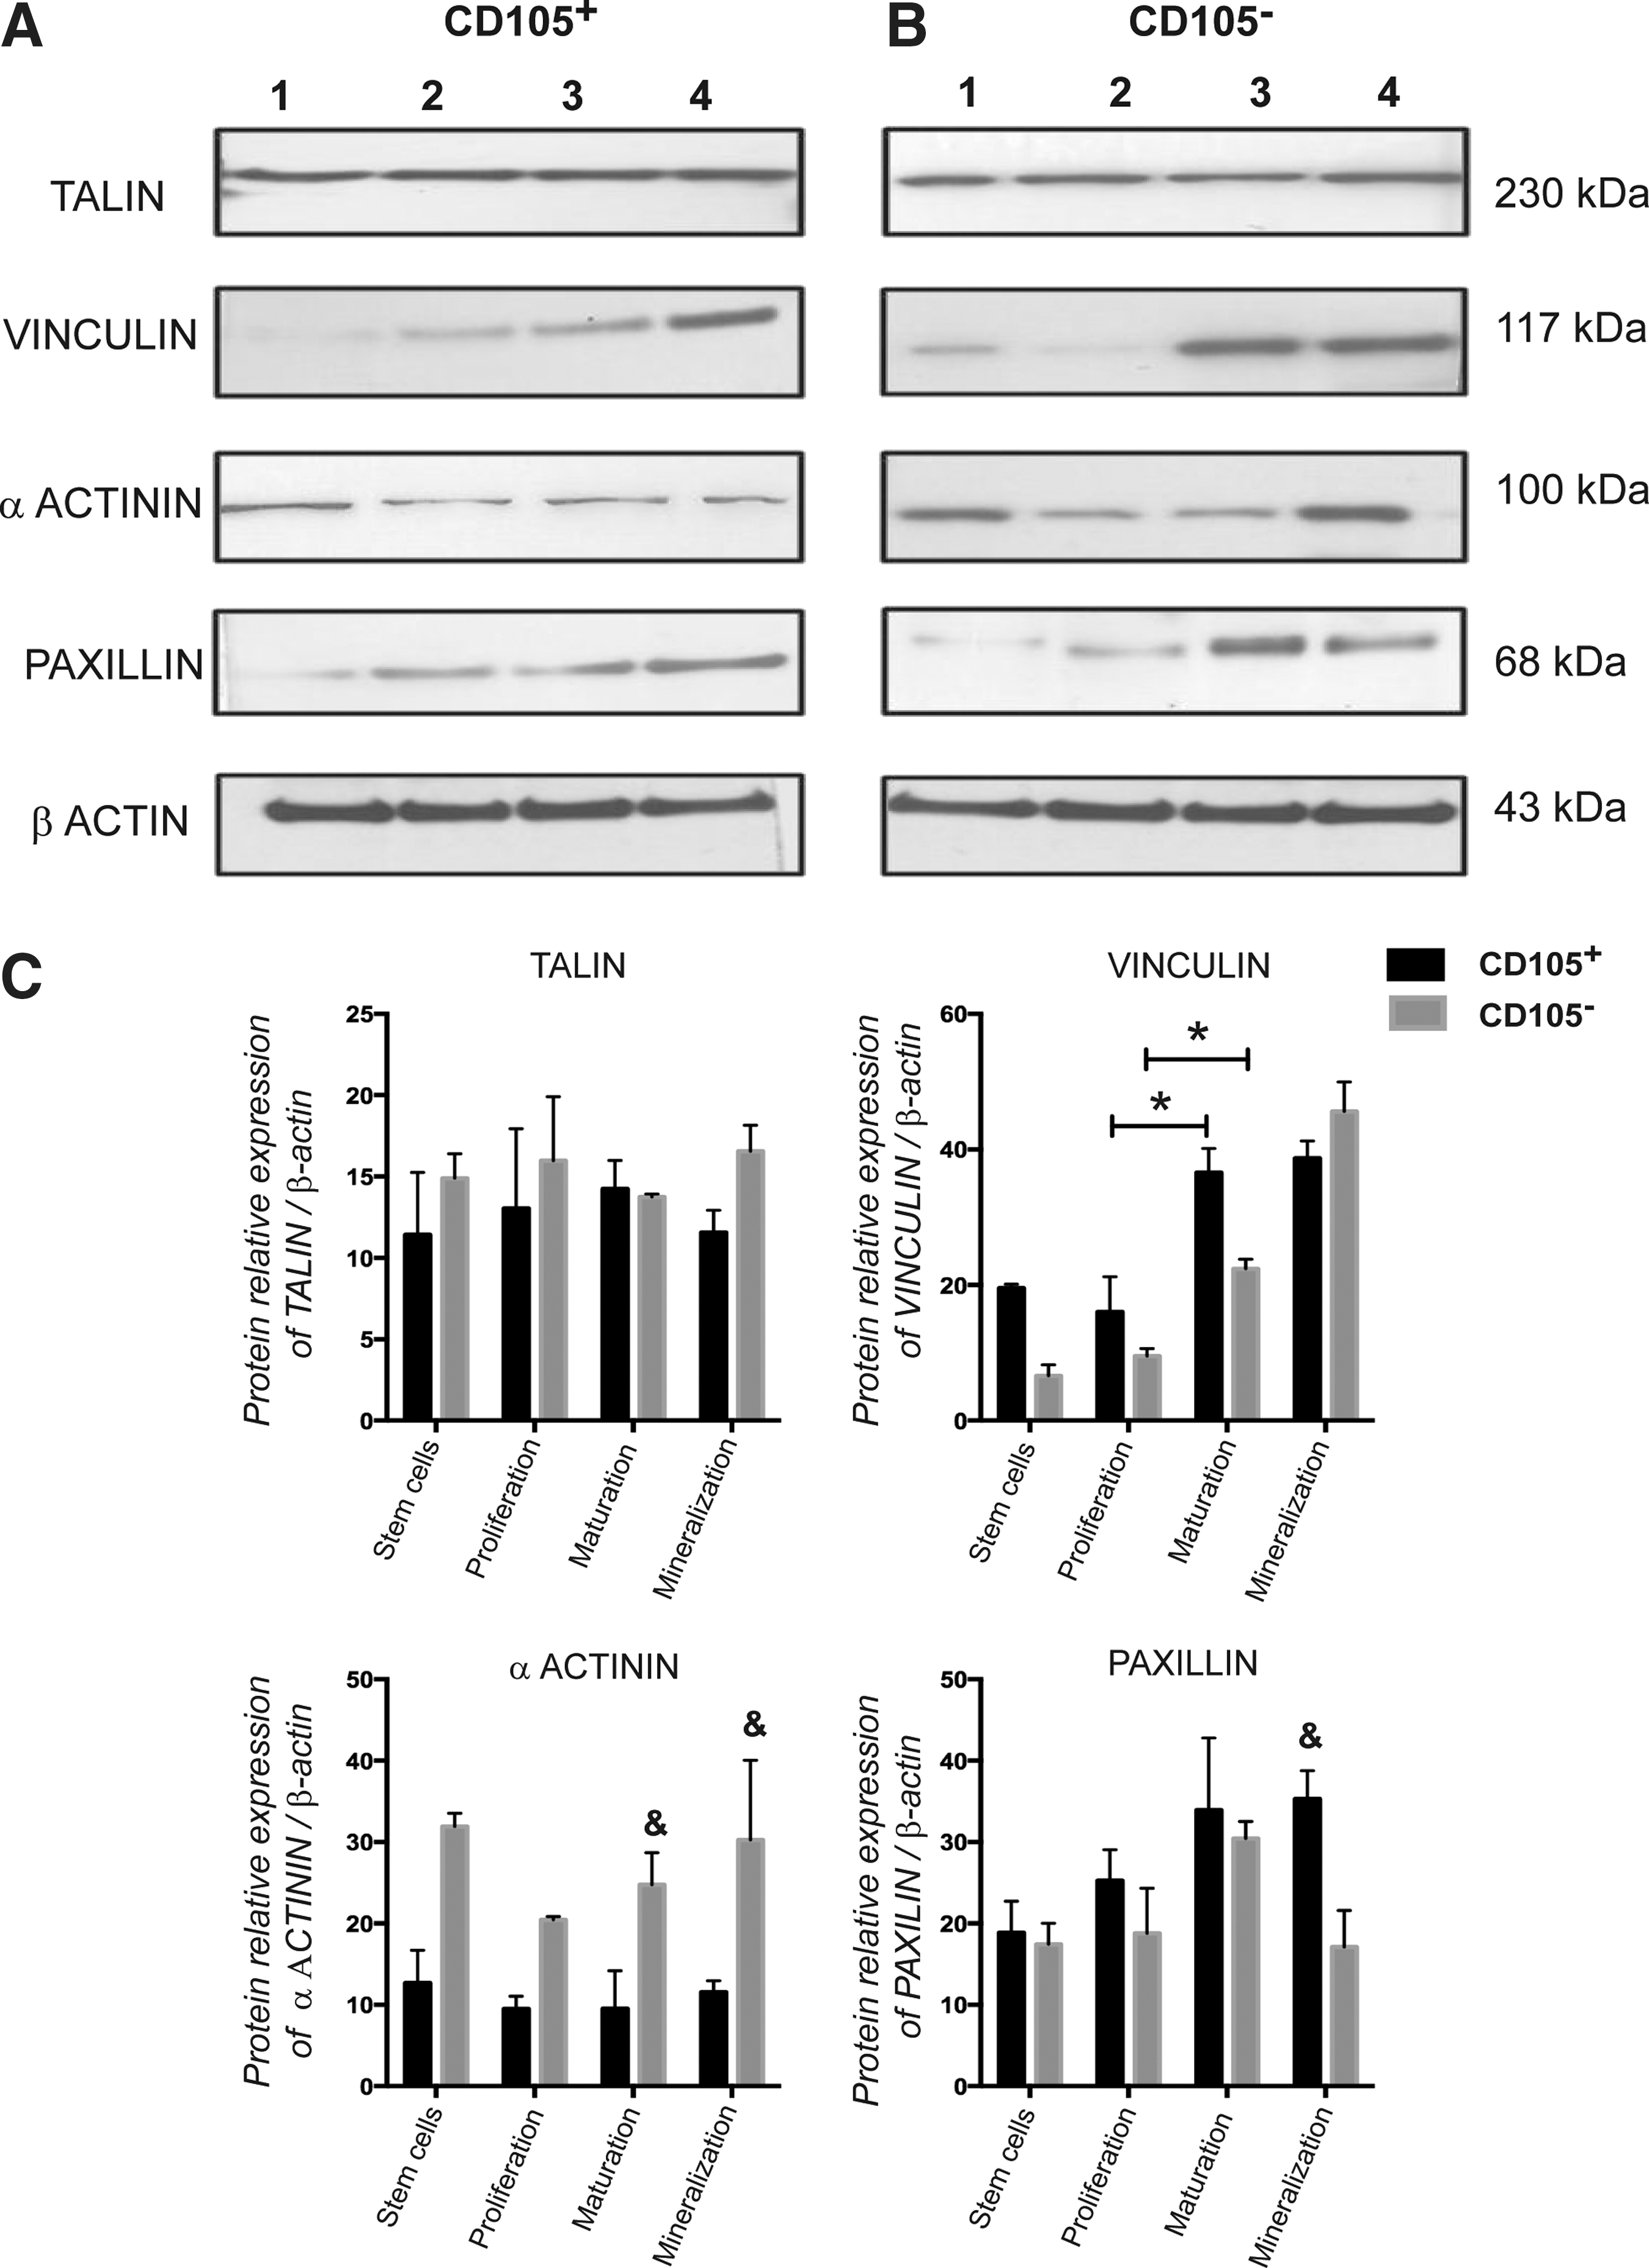
According to the stages of differentiation, the expression of talin, vinculin, α-actinin, and paxillin was analyzed in subpopulations. Talin expression showed no significant variations between the subpopulations or differentiation stages (Fig. 4). Moreover, the expression of vinculin showed a similar pattern through the differentiation stages and between the subpopulations. For the CD105+ subpopulation, the highest expression of vinculin was observed toward the second and third stages of maturation and the mineralization of the ECM, whereas in the CD105− subpopulation, it reached its peak during the third stage (Fig. 4).
Expression of adhesion-related proteins during osteoblastic differentiation of CD105+ and CD105−.
The expression of α-actinin, which provides stability to FAs, displayed a similar trend between the CD105+ and CD105− subpopulations with two peaks, the first before induction and a second one during the mineralization stage. Outstandingly, the levels of α-actinin in the CD105− subpopulation were 2-fold higher compared with those observed in the CD105+ subpopulation (Fig. 4).
Once the CD105+ subpopulation begins to differentiate, the expression of paxillin gradually increases until the third stage, during which it reaches its maximum. In contrast, in the CD105− subpopulation, the peak of paxillin expression is reached at the second stage, and the expression level then decreased to half of the peak value (Fig. 4).
FAK phosphorylation and MAPK pathways throughout osteoblast differentiation
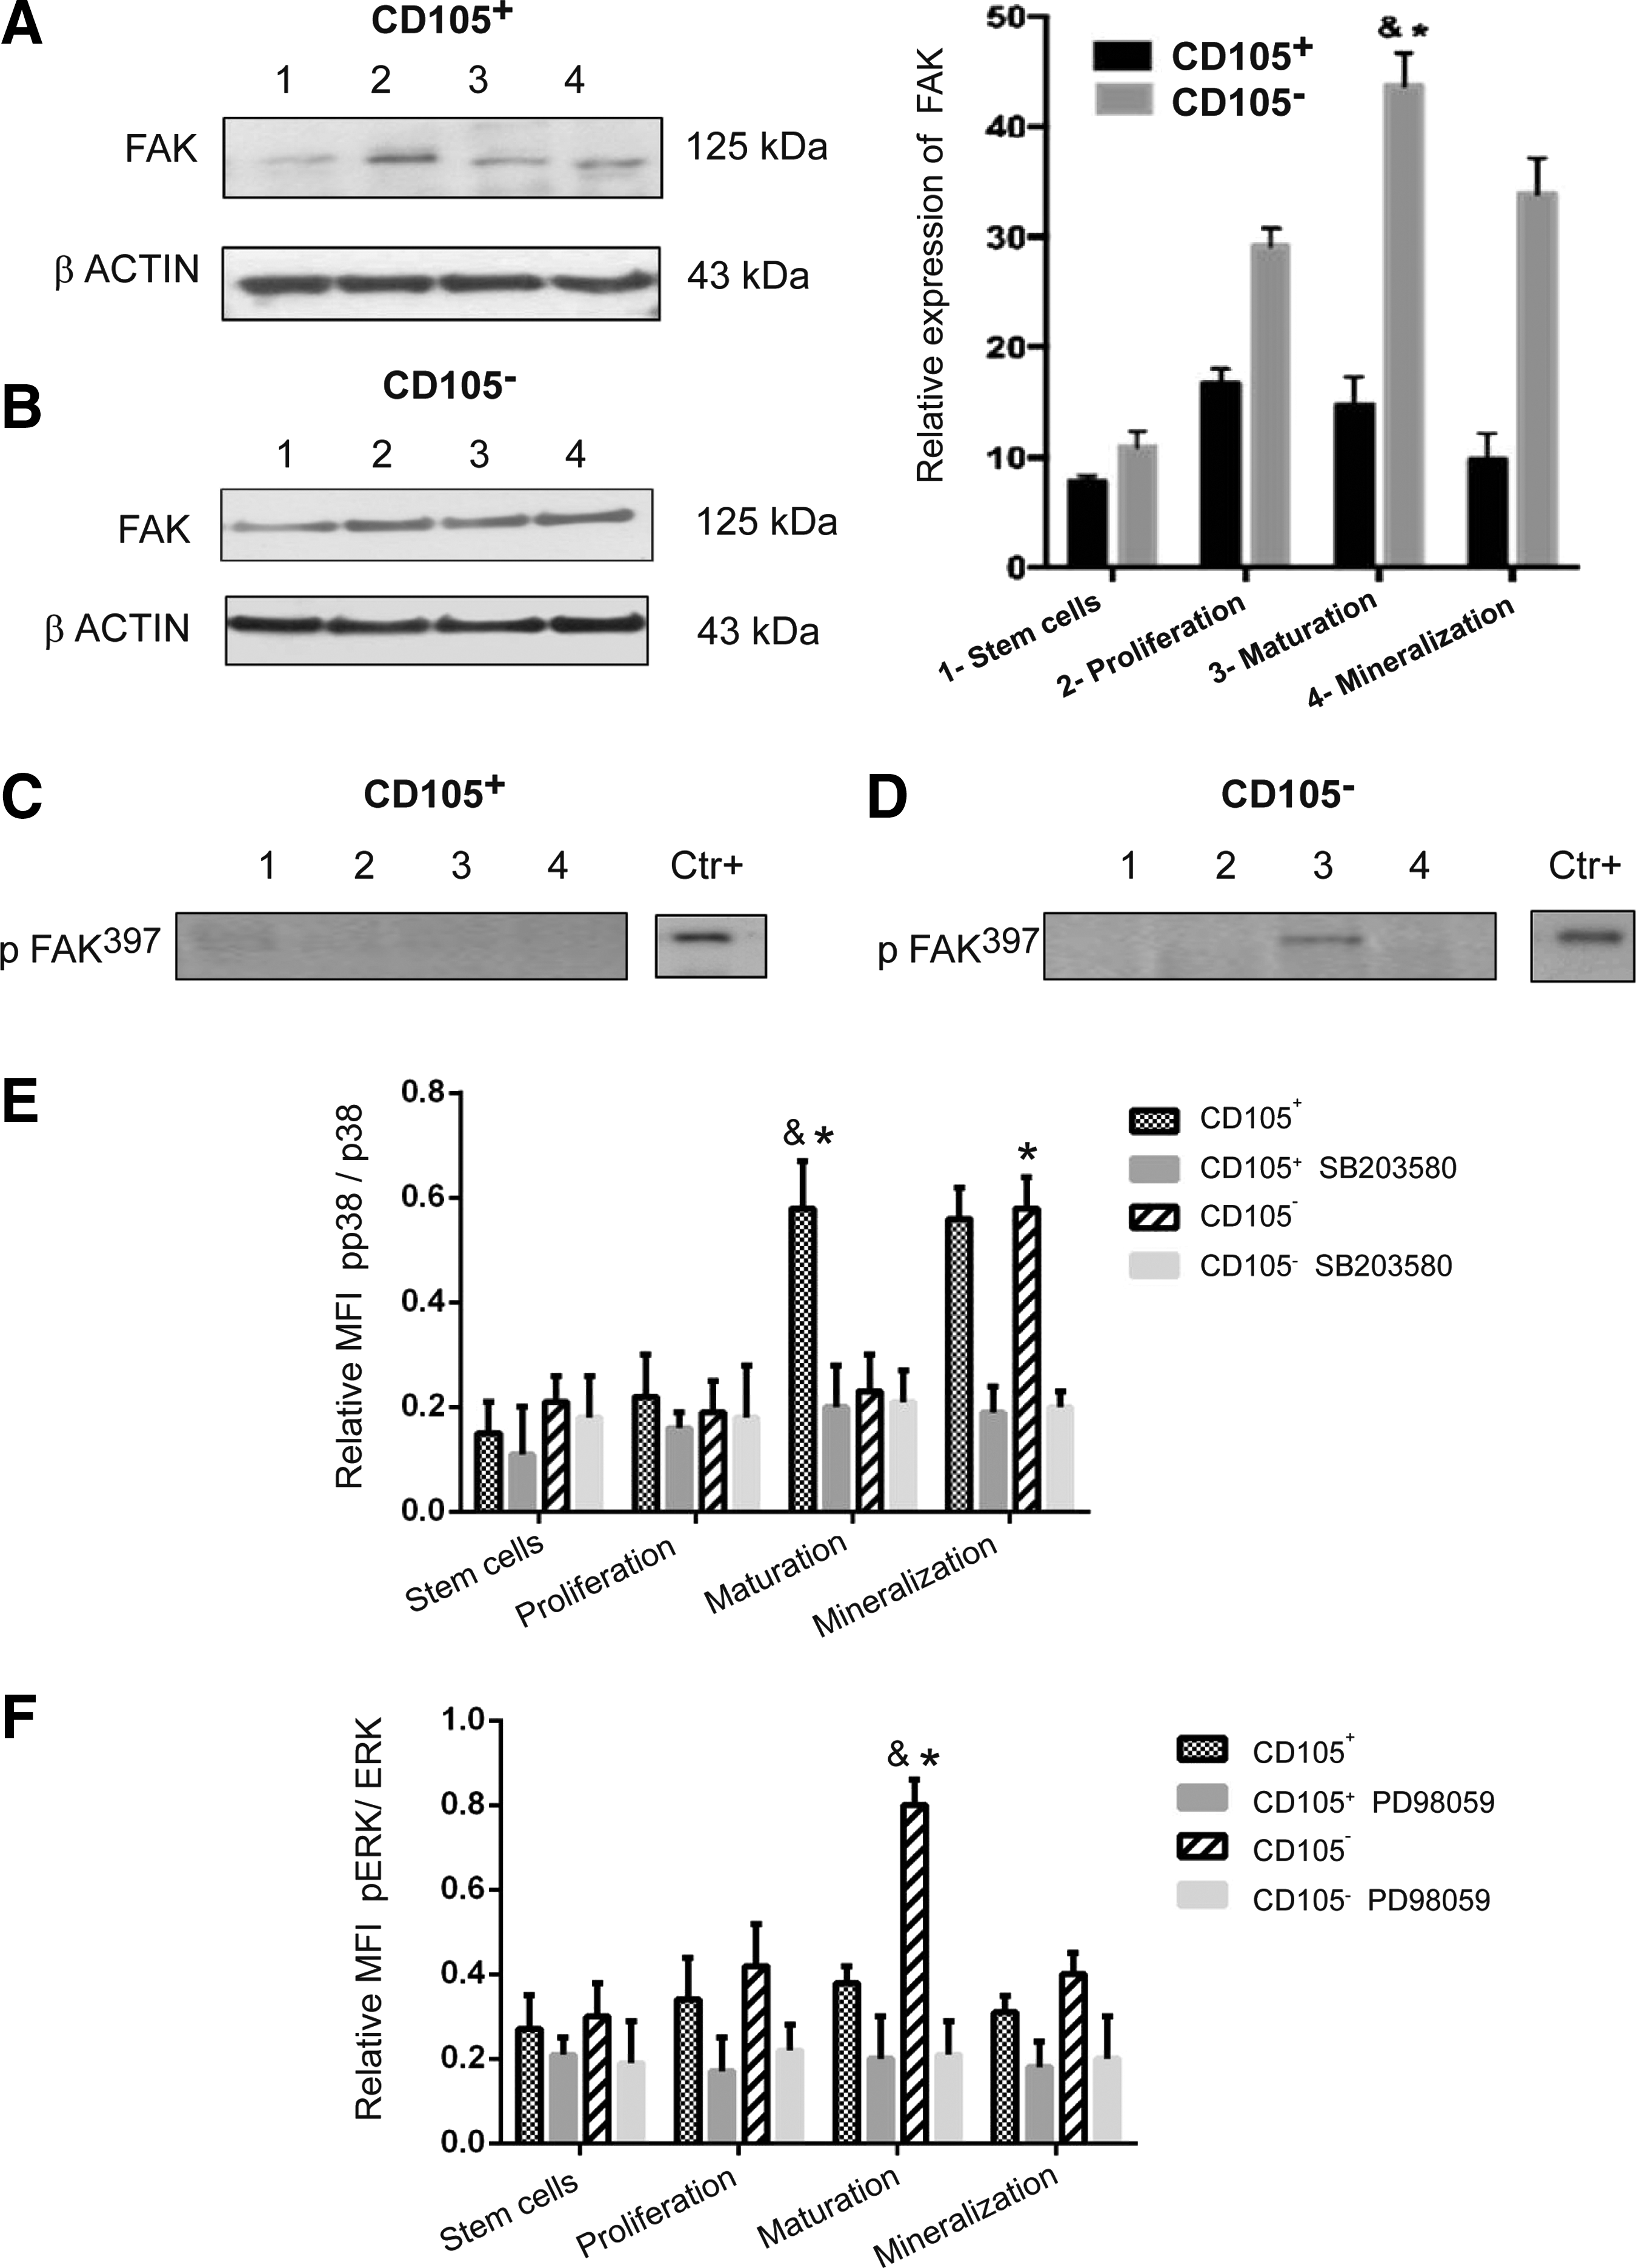
The CD105+ subpopulation exhibits poor expression of FAK. Although the expression is slightly increased after the triggering of osteoblastic differentiation, the expression level is low compared to the levels for the CD105− subpopulation (Fig. 5A). Moreover, the CD105− subpopulation shows an approximately 3-fold increase in FAK expression compared with the basal level after dexamethasone induction, and the expression of FAK reaches its peak during the maturation stage (Fig. 5B). The function of this kinase is determined by the phosphorylation of tyrosine; particularly, FAK phosphorylated at the Y397 residue represents the active form. pFAK397 was detected only during the maturation stage of osteoblasts differentiated from the CD105− subpopulation (Fig. 5D).
FAK phosphorylation and MAPK pathway involvement in the osteoblastic differentiation of the CD105+ and CD105− subpopulations.
To gain insight into the signaling events involved during the osteoblast differentiation, a multiplex bead immunoassay was used to detect changes in the activation of ERK/MAP kinase1/2 and p38. Activation of MAPK was determined as the ratio between the levels of phosphorylated (phospho-) and total ERK1/2 and p38. In the CD105+ subpopulation (Fig. 5E), p38-MAPK was substantially increased at the maturation stage with a ratio of 0.58, and this increase was maintained until the mineralization stage. Moreover, the CD105− subpopulation involved the ERK signaling cascade mainly at the maturation stage, as evidenced by a ratio of 0.8 (Fig. 5F). Unexpectedly, the ERK pathway was not inactivated in the CD105+ subpopulation.
β1-integrin colocalization with actin cytoskeleton at the maturation stage in the CD105+ and CD105− subpopulations
According to the expression of adhesion-related proteins, both subpopulations showed an adherent profile toward the maturation stage (at day 9 and 5 for CD105+ and CD105− cells, respectively). We then explored the organization of the actin cytoskeleton and its colocalization with β1-integrin. The cytoskeleton organization was revealed by phalloidin staining of filamentous actin (F-actin). In both subpopulations, we observed a similar cytoskeleton rearrangement with a widespread morphology and the presence of extensive stress fibers, indicating an adhesive state (Fig. 6A). Regarding the presence of β1-integrin, there were no differences between the subpopulations in the signal intensity (Fig. 6B). These data are consistent with the protein expression results evaluated by western blot (Fig. 3A, B). However, β1-integrin was uniformly distributed along the cytoplasm in the CD105+ subpopulation, but colocalization points with F-actin were not revealed. In contrast, in the CD105− subpopulation, clusters of β1-integrin were scattered at the cell periphery, and multiple FAs were displayed, as indicated by the colocalization of β1-integrin with F-actin (Fig. 6B, arrowheads).
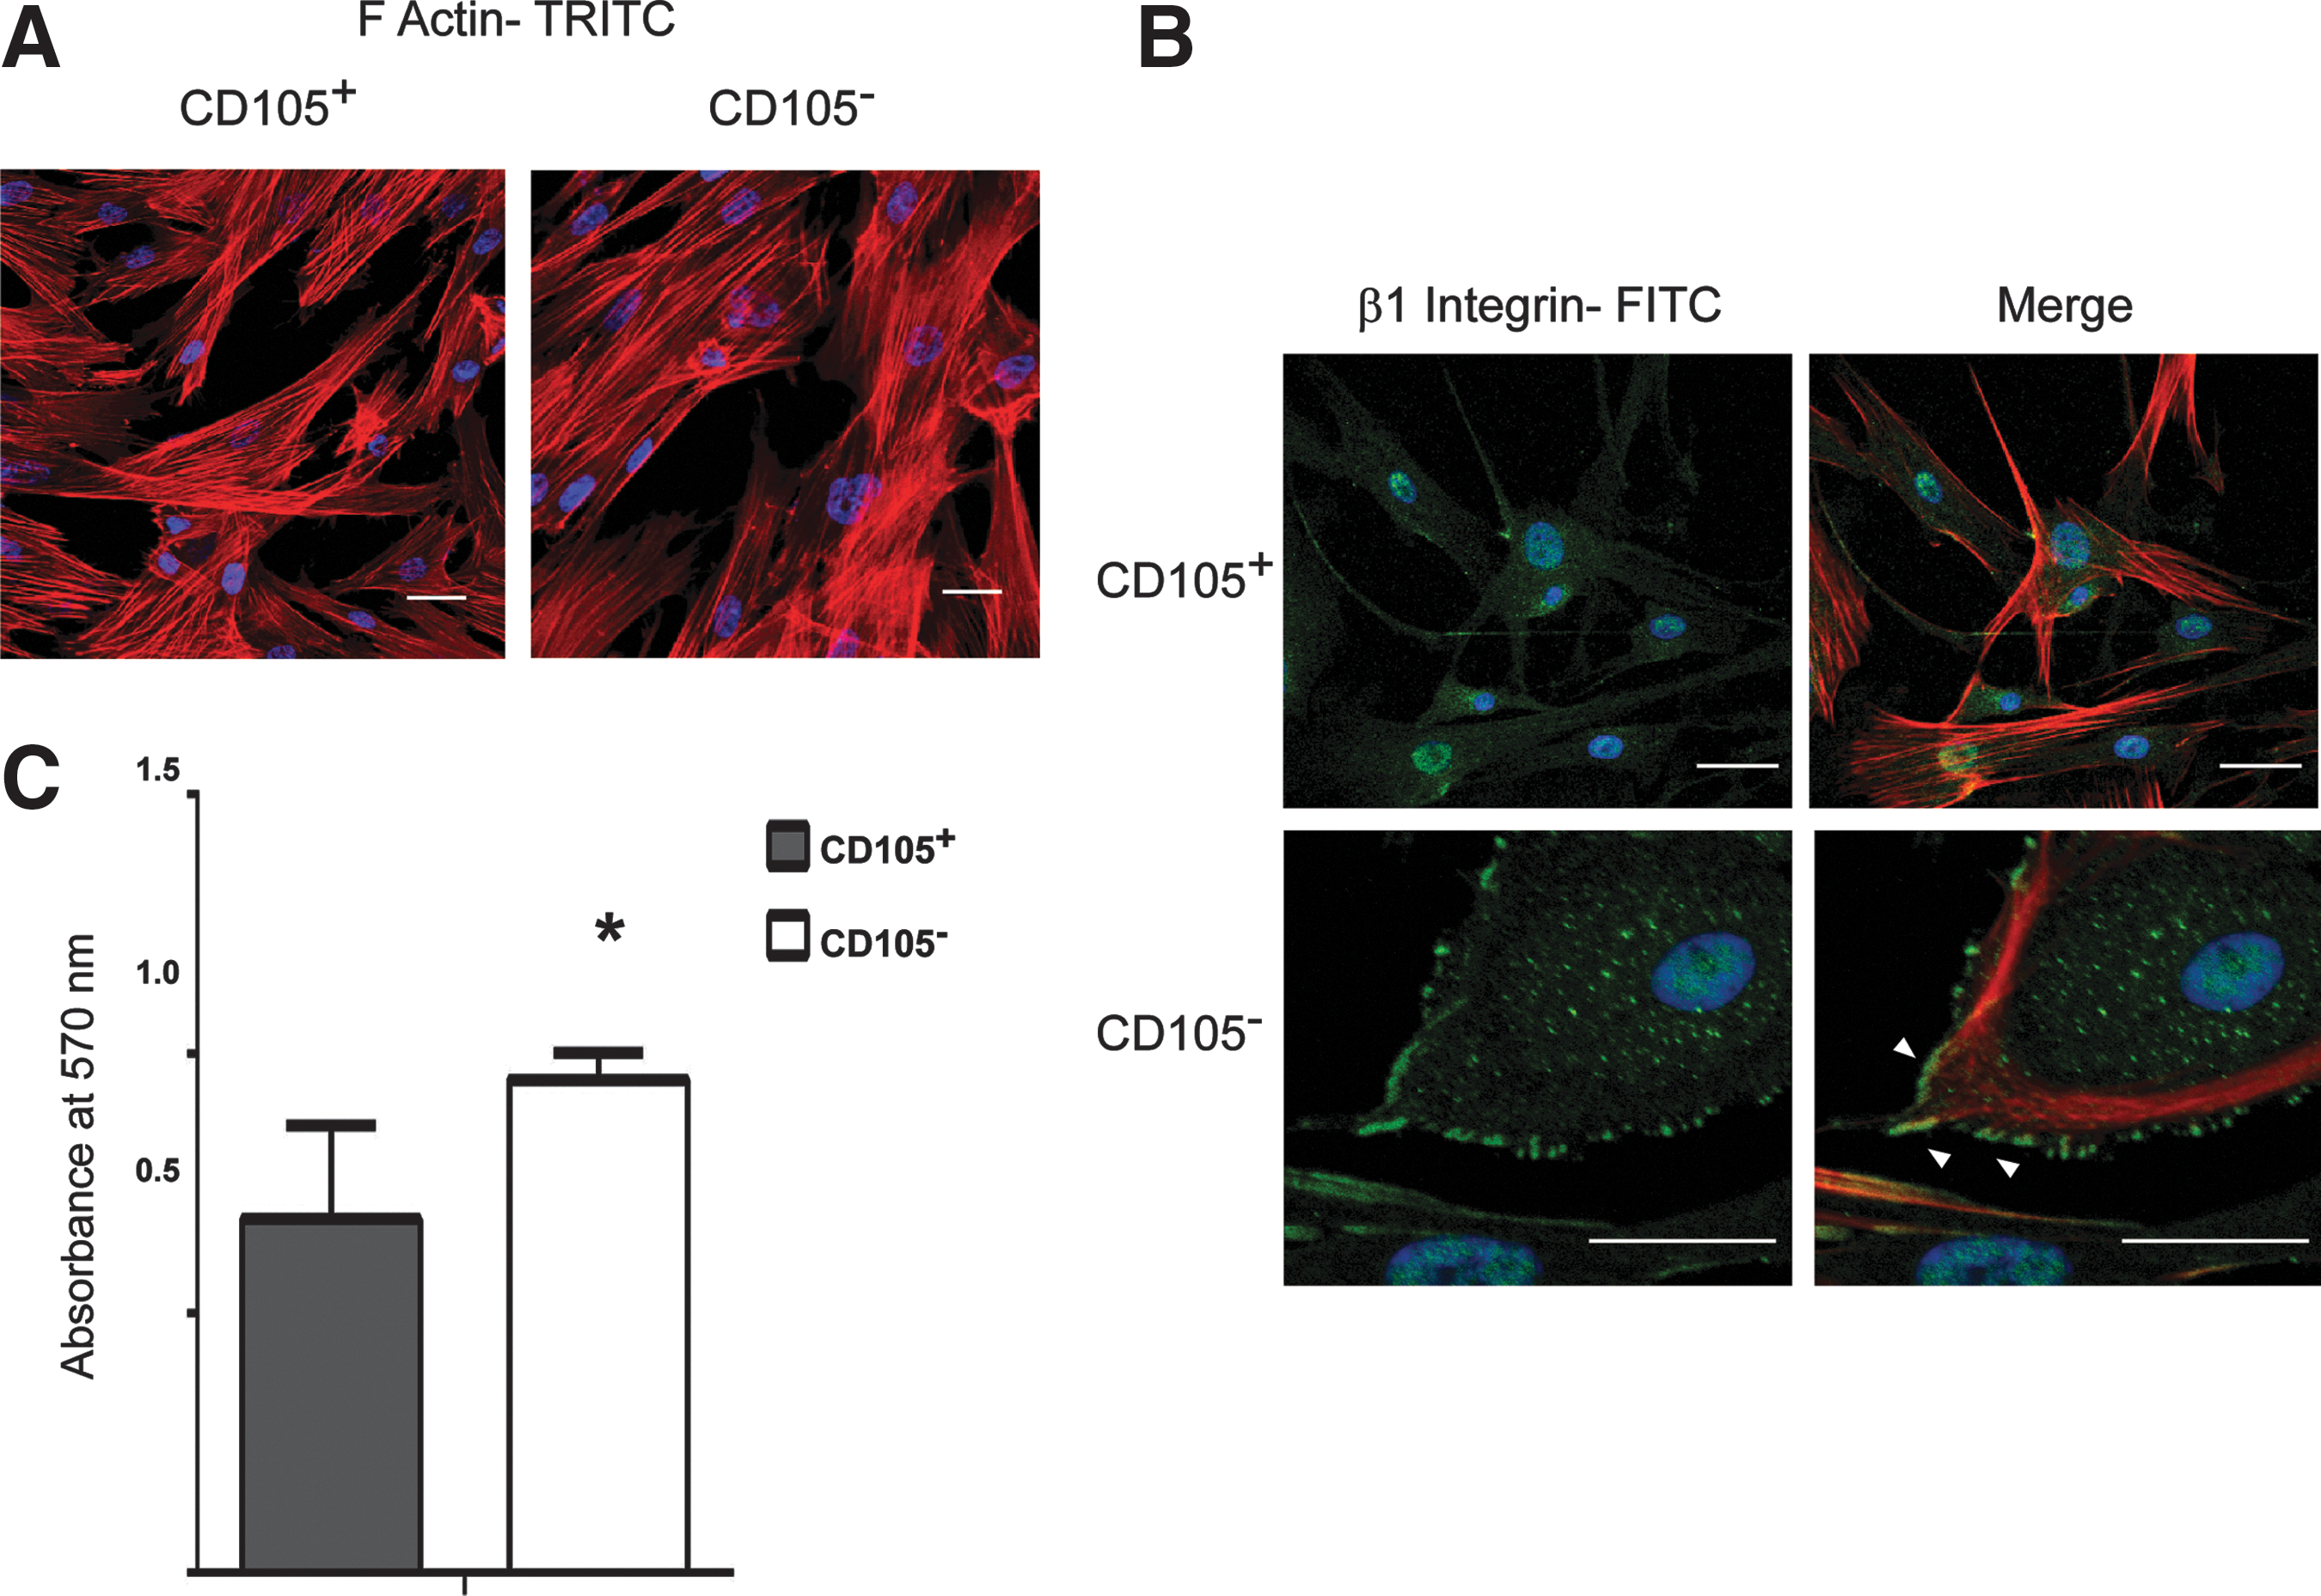
Cytoskeleton organization and adhesive ability of CD105+ and CD105− subpopulations at the maturation stage.
Due to the scaffold for the bone graft construction consisting of collagen I, a quantitative assay to evaluate cell adhesion at the maturation stage on collagen I-coated plates was performed. Both subpopulations showed adhesion to the substrate; nevertheless, as shown in Fig. 6C the adhesive ability of the CD105− subpopulation was significantly greater than that of the CD105+ subpopulation.
In vivo evaluation of the grafts cellularized with CD105+ and CD105− subpopulations
After establishing the specific stage for graft assembling, we sought to investigate the effect of this approach on healing in a canine tibia defect model. No adverse inflammatory responses were observed in any of the animals used in the study and the operated legs were used normally at daily exercise.
In terms of the implant integration, H&E-stained sections confirmed that no significant callus formation was shaped in grafts cellularized with CD105+ and persistent cartilage between the graft and adjacent bone at 7 weeks (Fig. 7C). In contrast, a large bridging callus was observed surrounding the NKB control and grafts cellularized with CD105−, where the gap between graft and host bone had disappeared due to the formation of a bony union (Fig. 7A, B). Grafts cellularized with CD105+ failed to remodel, and the repair area showed increased bridging cartilaginous matrix production. Cells within these regions exhibited hypertrophic condensation phenotype consistent with an endochondral regeneration process (Fig. 7F). Nevertheless, the majority of sections exhibited no new bone with the remaining sections having very little bone. Sections were instead populated predominantly by fibrocartilaginous tissue surrounding the NKB particles (Fig. 7I).
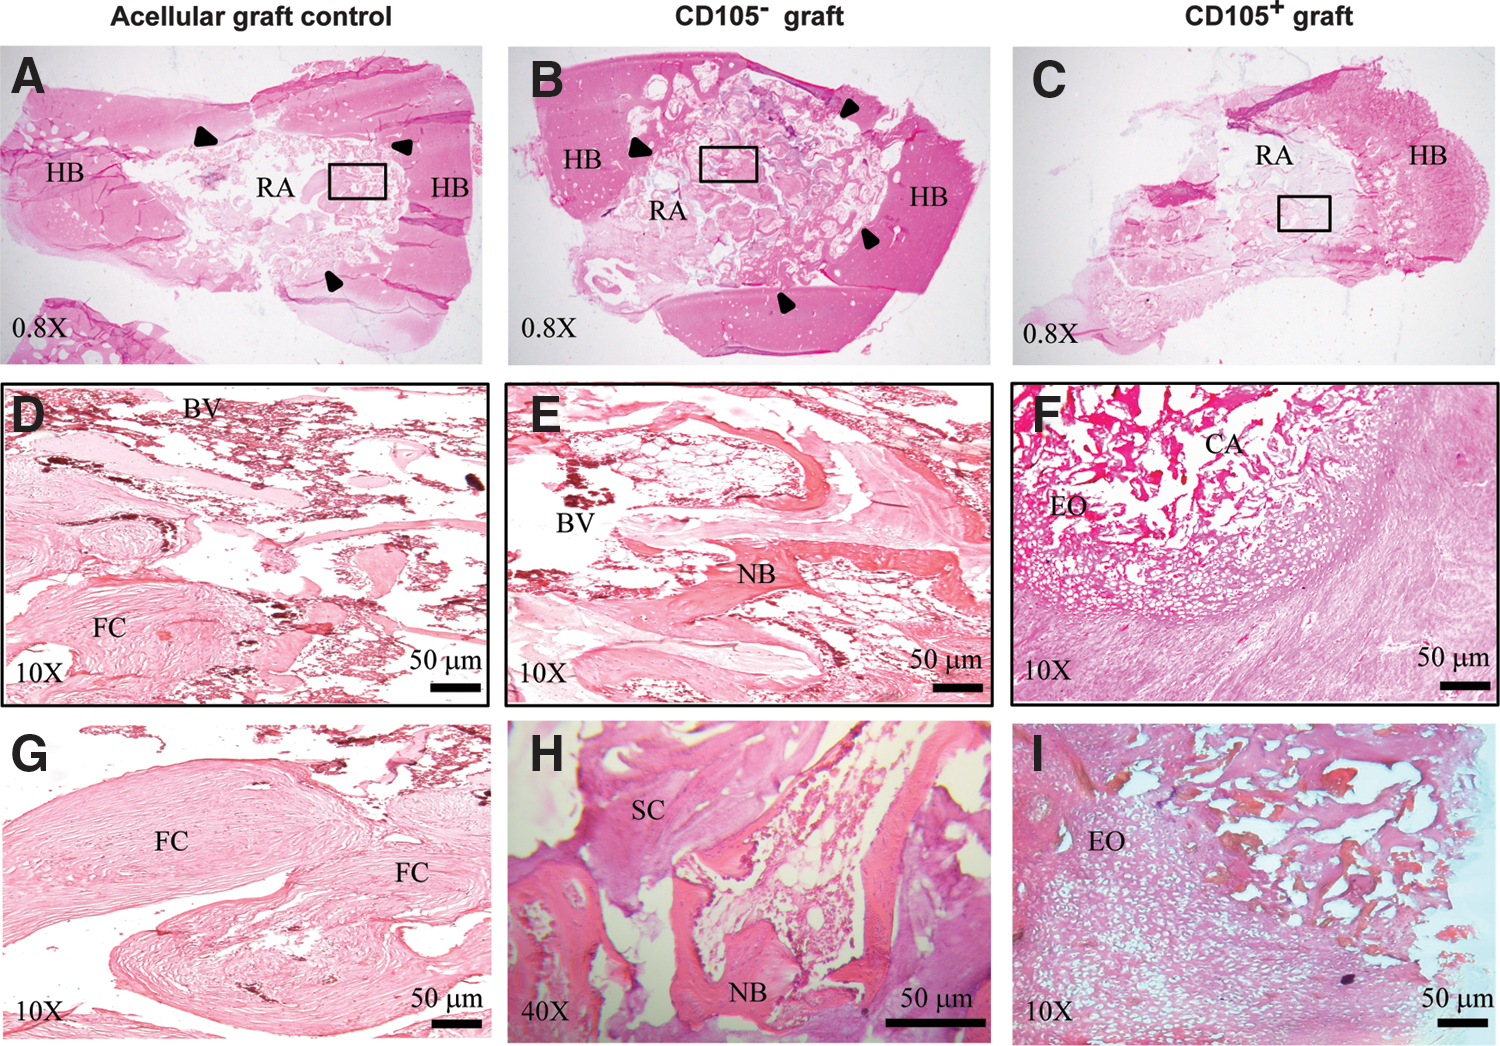
Photomicrographs of treated lesions at 7 weeks after surgery. Histological sections stained with Hematoxylin and eosin.
The sections were stained with Masson's Trichrome to identify new bone formation within the defect site. Consistent with the H&E analysis, Masson's Trichrome images revealed differences in the amount, pattern, and distribution of the novo bone formation between groups. Lesion treated with the graft cellularized with CD105+, displayed a more dispersed pattern at the fracture callus as well as fibrocartilage (Fig. 8C, F). In contrast, graft cellularized with CD105− evidenced the callus tissue in a compact blue color (Fig. 8B). The newly formed bone presented high amounts of well-integrated bone. Moreover, osteocytes were seen embedded in the mineralized matrix, indicating the physiologic nature of the deposited mineral (Fig. 8E).

Photomicrographs of treated lesions at fracture callus. Histological sections stained with Masson's Trichrome showing the deposition of collagen fibers in blue
To make further confirmation, immunohistochemical staining was applied to detect RUNX2, SOX9, collagen II, and osteopontin. In the lesion treated with the graft cellularized with CD105+, low expression of SOX9 (Fig. 8O) accompanied by a matrix of collagen II into the area of callus was observed (Fig. 8R). These results indicate that injury was repaired through endochondral ossification. However, also evident was the presence of abundant fibrocartilage tissue at the site of the lesion. In a fracture, callus area from grafts cellularized with CD105−, RUNX2 expression and osteopontin-rich matrix were observed, indicating the activity of mature osteoblasts (Fig. 8N, Q). Instead, cartilage was not detected, as demonstrated by the lack of staining for SOX9 and collagen II (Fig. 8H, K). These data confirm that bone injury was repaired by intramembranous ossification.
Remodeling features associated with new bone formation were observed including: (1) visible areas of stromal matrix, (2) pockets of osteoblasts and osteocytes, and (3) fatty bone marrow, as well as the formation of new blood vessels were observed in grafts cellularized with CD105− (Fig. 7E). Microvascular invasion, in the form of capillary ingrowth, was present and preceded the appearance of new bone trabeculae (Fig. 7H). Acellular graft control showed fibrous tissue with abundant vessels, and new trabeculae gradually replaced the surface of cartilage (Fig. 7D, G).
Discussion
The CD105+ and CD105− subpopulations investigated in the current study showed differences in time required to reach osteoblastic maturity and efficiency of mineralization as a result of induction with dexamethasone. To understand the events related to cell adhesion in a functional framework, we define as the first goal, a timeline that recapitulates osteoblast differentiation (Fig. 1D).
CBFA1/Runx2 is a key transcription factor for osteoblast differentiation [32,33]. We observed that the expression of this transcription factor started on day 3 in both subpopulations. Although its expression in the CD105+ subpopulation was markedly reduced starting on the 1st days postinduction (Fig. 2D), its expression period was sufficiently long to allow progression of osteoblastic differentiation. Molecular studies have established an important role for Runx2 in osteoblast differentiation [32,33]. However, Tu et al., using a CBFA1/Runx2-null mouse embryo, confirmed that osteoblast lineage markers, such as ALP and bone sialoprotein, are expressed [34]. These findings demonstrate that the mechanism through which MSCs acquire an osteoblast mature phenotype requires other effectors in addition to CBFA1/Runx2.
SPARC is the most abundant noncollagen ECM protein in bone [35], and on third stage, this protein participates actively in the mineralization of the ECM. Striking differences were found between the subpopulations: the CD105+ subpopulation presents low expression levels of this protein accompanied by relatively low calcium levels (Figs. 2D and 1C). Instead, the CD105− subpopulation exhibited significantly higher SPARC expression and calcium content (Figs. 2E and 1C).
These data correlate well with other studies. For example, SPARC-null mice develop profound osteopenia with poor matrix quality related to low mineralization ability [36 –38].
In the past decade, there have been many significant advances in bone tissue engineering; however, proper cellular attachment to scaffolds remains a problem for bone graft construction. For instance, in studies involving engineering, several methods have been developed to facilitate the adhesion and proliferation of osteoprogenitors and to support their differentiation and matrix deposition.
In this study, we addressed this challenge based on the expression profile of the adhesion-related proteins; we also appointed a subpopulation specific stage for the successful application of bone graft assembly.
In this regard, we demonstrated that the CD105+ and CD105− subpopulations display differences regarding the expression profile of the proteins α-actinin and paxillin and the phosphorylation states of FAK and β1-integrin. Once initial adhesion complexes are structured, the presence of α-actinin becomes a key element for their stabilization because it determines a state of suitable adhesion [39]. We observed that α-actinin is expressed predominantly in the CD105− subpopulation and that its expression remained constant throughout the differentiation process (Fig. 4B).
Phosphorylation of FAK at residue T397 is directly related to the expression of α-actinin. When analyzing the phosphorylation pattern of FAK in both subpopulations during their differentiation, we observed a correlation between the expression of α-actinin and the presence of pFAK397 at the maturation stage (Fig. 5D).
The posttranslational modification of β1-integrin is necessary to activate the whole signal cascade downstream of integrin contact with the ECM proteins [40]. In particular, its activation by phosphorylation at residue Thr788 is the trigger that confers proper adhesive state and consequent association with talin [40].
Similarly, vinculin constitutes a scaffolding core for FAs and is responsible for strengthening these structures. The development of the initial adhesion into a focal complex is marked by recruitment of this protein [41]. In both subpopulations, we evidenced the highest expression levels of vinculin at the maturation and mineralization stages (Fig. 4), indicating the structuring of a greater number of adhesive structures and a more adherent state.
During bone differentiation, the MAPK signaling cascade is activated due to the expression of various osteomarkers [42]. In agreement, we have shown that the osteoblast differentiation of the CD105− subpopulation involves the ERK pathway with a maximum signal (2.8-fold greater than baseline) during the stages associated with the synthesis and maturation of the bone matrix proteins (Fig. 5F). These data are consistent with the effective activation of FAK, which mediates signaling pathways and supplies a link between cell surface integrin–ECM binding and the activation of ERK1/2 [42].
During the osteoblast differentiation of the CD105+ subpopulation, p38-MAPK pathway is activated (Fig. 5E) instead of ERK1/2 pathway. In the absence of an efficient activation of FAK, other pathways independent of FAK are activated. However, these display different efficiencies in relation to subsequent events. It has been reported that overexpression of FAK antisense mRNA prevents the expression of ERK-dependent ALP activity in osteoblast-like cell lines, consequently preventing further osteoblastic differentiation [43]. Primary mechanism of cellular adhesion is related to reorganization of the actin cytoskeleton. We did not observe marked differences in F-actin between the subpopulations (Fig. 6A). F-actin reorganization observed in the cells suggests that the type of subpopulation has no influence on the mechanical properties of the cell. That is, bone cells may produce stress fibers to maintain their morphology. However, the functions of the structures related to cell adhesion extend beyond the structural impact. The presence of FAs mediated by β1-integrin observed in the CD105− subpopulation at the maturation stage (Fig. 6B) had important functional implications related with the activation of the α-actinin–FAK–ERK1/2 axis, which directly impacts the maintenance of CBFA1 expression. This is supported by the fact that the arrangement of adhesive structures is mandatory for the activation of the mechanisms related to osteoblast differentiation.
Our results show that osteoblasts at the mineralization stage induced from the CD105− subpopulation appear to exhibit increased cell adhesion, unlike those induced from the CD105+ subpopulation, which present a less adhesive profile and poor mineralization efficiency.
Although the ability of MSC populations to enhance allograft repair has been recognized, attaining the appropriate delivery and retention of MSCs for skeletal repair therapeutic strategies have proven to be difficult. Cell culture techniques in which MSCs have been directly cultured on allografts have demonstrated some success; however, among significant drawbacks are the uneven cell distribution across allografts and the weak adhesion of MSCs seeded on allograft, which can result in detachment following surgical transplantation. To overcome them, we described a strategy for bone graft assembly based on the cellular adhesive ability of two subpopulations. Since our results indicate that both subpopulations have a more adhesive profile during the second stage of osteoblast differentiation, bone implants were assembled at this cellular point. Interestingly, by in vivo assay we evidenced that differences between subpopulations involve more than its maturation rate; also the mechanism and effectiveness for bone repair were quite dissimilar. The CD105− subpopulation promoted bone regeneration through an intramembranous mechanism (Figs. 7E, 8E, and 8K), which might be related to the activation of the Integrin-β1–FAK–ERK1/2 axis. Whereas CD105+ subpopulation, which showed no activation of FAK (Fig. 5C) and consequently did not activate CBFA1 and SPARC (Fig. 2D), evidenced an endochondral repair process (Figs. 7F, 7I and 8R). Since implant was assembled with preosteoblasts, endochondral repair could be the result of the host's mechanisms and not due to the influence of the graft.
This work adds to previous reports on the role of FAK and ERK1/2 as activation triggers of effective differentiation and bone maturation, and this is the first demonstration in an in vivo model that cells with different patterns on these adhesion-related proteins recapitulated a repair process by a particular mechanism.
Footnotes
Acknowledgments
The authors are grateful to Dr. Manuel Hernández (Department of Cellular Biology, CINVESTAV-IPN, Mexico City) for supplying anti-actin monoclonal antibody and to chemist Guadalupe Esparza-González (Department of Embryology, School of Medicine, UANL) for her valuable help with staining of histological sections. This work was partially financed by CONACYT-87537/SALUD-2008.
Author Disclosure Statement
No competing financial interests exist.