
Abstract
Murine postnatal neural stem cells (NSCs) give rise to neurons, astrocytes, or oligodendrocytes (OLs); however, our knowledge of the genes that control this lineage specification is incomplete. In this study, we show that nuclear factor I X (NFIX), a transcription factor known to regulate NSC quiescence, also suppresses oligodendrogenesis (ODG) from NSCs. Immunostaining reveals little or no expression of NFIX in OL lineage cells both in vivo and in vitro. Loss of NFIX from subventricular zone (SVZ) NSCs results in enhanced ODG both in vivo and in vitro, while forced expression of NFIX blocks NSC differentiation into OLs in vitro. RNA-seq analysis shows that genes previously shown to be differentially expressed in OL progenitors are significantly enriched in RNA from Nfix−/− versus wild-type NSCs. These data indicate that NFIX influences the lineage specification of postnatal SVZ NSCs, specifically suppressing ODG.
Introduction
N
Previously, we reported that Nfix knockout mice had an expanded cerebral cortex, excess PAX6+ progenitor cells in the subventricular zone (SVZ), fewer subgranular zone neural progenitor cells, and delayed neurogenesis in the hippocampus [10,11]. These findings indicate a role for NFIX in regulating neural stem cells (NSCs) and their differentiation. In addition, we reported that NFIX regulates NSC quiescence in vitro [12]. While ChIP-seq analysis has shown that NFIs bind to some genes that regulate the differentiation of NSCs (eg, Mash1) [12,13], the role of NFIX in oligodendrogenesis (ODG) has not been well studied.
Oligodendrocytes (OLs) are one of two main glial types [14 –16]. They myelinate axons of neurons to both protect them and promote signal conduction [17,18]. OL formation begins around birth in mice and peaks at postnatal day 14 (P14) [14,19,20]. Murine OLs are derived mostly from preexisting OL progenitor cells (OPCs) present in multiple locations in the brain [14,21]. However, some OLs are derived from NSCs in the SVZ rather than from existing OPCs [14,21,22]. Indeed, NSC-derived OLs can play a major role in remyelination after brain injury or induced demyelination [23,24], suggesting the potential for NSC-based therapy for brain injury and demyelination diseases. However, the TFs that regulate OL formation from NSCs are only partially defined. In this study, we show that NFIX expression decreases as NSCs undergo ODG and that this downregulation appears essential for normal NSC-derived OL formation. This suggests an important role for NFIX in the lineage specification of NSCs in postnatal mouse brain.
Materials and Methods
Nfix−/− and Nfix iKO mice
Germline Nfix−/− mice were generated as described previously [11] and were analyzed as C57Bl/6/129 F2 hybrid animals. This avoided the hydrocephalus seen in inbred C57Bl/6 Nfix−/− mice. NestinCreERT2/R26R-EYFP/Nfix+/+ and NestinCreERT2/R26R-EYFP/Nfix flox/− or flox [inducible knockout (iKO)] mice were maintained on a C57Bl/6 background and were generated by crossing the appropriate progeny of Nfix +/+, Nfix flox/− , or Nfix flox/flox and NestinCreERT2/R26R-EYFP mice (provided by Dr. Amelia J. Eisch [25,26]). Mice were genotyped by polymerase chain reaction (PCR) and sequences of the primers are available upon request. 180 mg/kg tamoxifen (T-5648; Sigma) in sunflower oil was administered by daily intraperitoneal injection for 4 days into 4-week-old NestinCreERT2/R26R-EYFP/Nfix+/+ and NestinCreERT2/R26R-EYFP/Nfix flox/− (or Nfix flox/flox) mice [25]. All protocols were approved by the IACUC at Roswell Park Cancer Institute.
Tissue preparation and immunofluorescence
Animals were perfused with 4% PFA and brains were dissected and postfixed in 4% PFA overnight at 4°C. Serial coronal sections (40–45 μm) through the dentate gyrus were collected and every sixth section was used for staining. Primary antibodies are listed in Supplementary Table S1 (Supplementary Data are available online at
Cell culture and staining
Brains were dissected at postnatal day 10 (P10) and a 2-mm coronal slice containing the SVZ was dissociated with 0.05% Trypsin. Cells were seeded onto wells or coverslips at 2×10⁵ cells/cm2. For monolayer cultures, wells/coverslips were coated with 0.001% poly-l-lysine (P8920; Sigma) and 10 μg/mL laminin (L2020; Sigma) before seeding [27]. Proliferation medium consisted of DMEM/F12 (Gibco), B27 (1:50), 2 mM L-glutamine, 20 ng/mL human EGF, and 20 ng/mL human FGF2 [28,29]. For differentiation, the medium was replaced with medium lacking growth factors [28,29].
Neurospheres and monolayer-cultured cells were fixed with 4% PFA and stained with antibodies (Supplementary Table S1). For O4 staining, live neurospheres or monolayer cells were incubated with primary antibody at 37°C for 1 h, and then fixed with 4% PFA. Total cell number was assessed by DAPI staining. For quantification of the neurosphere assay, neurospheres with at least 10 TUJ1+ or O4+ cells were counted as TUJ1+ or O4+ neurospheres, respectively. For classifying NFIX expression levels, the average intensity of NFIX staining in each nucleus (area defined by DAPI staining) was quantified using ImageJ. Nuclei with an average intensity value above half the maximum intensity value in the same view were classified as NFIX-high with the remainder being NFI-low or NFIX negative. P10 was chosen for cell isolation to maximize the number of postnatal NSCs available, which begin to decrease after P10.
Electroporation of Nfix−/− cultured NSCs
Primary Nfix− /− NSCs were expanded for 10 days and electroporated with pCAGGS plasmids expressing NFIX2-IRES-GFP or IRES-GFP as described previously [12]. Cultures were detached using Accutase and counted using a Nexcelom cell counter. 2×10⁶ cells were mixed with 4 μg plasmid DNA and electroporation was performed with a Nucleofector II (Lonza VAPG-1004 kit, Program A-33). Cells were seeded in medium containing growth factors on coated coverslipped 24-well plates and shifted to the differentiation medium after 24 h. Cells were fixed and stained on differentiation days 0, 2, and 4 (D0, D2, and D4) or proliferation days 1, 3, and 5 (P1, P2, and P5).
Brain RNA extraction and RT-qPCR
Brains minus olfactory bulbs and cerebella were dissected, RNA was extracted with TRIzol reagent, and cDNA generated by random hexamer-primed cDNA synthesis (iScript; Bio-rad). Transcript levels were assessed by quantitative PCR (qPCR; Bio-Rad iCycler) using SYBR Green detection, as described previously [5]. β2-Microglobulin transcript levels were used to normalize expression levels. All primers are listed in Supplementary Table S2.
RNA-seq and receiver operating characteristic analysis
RNA was harvested from proliferating WT and Nfix−/− monolayer cells and used for RNA-seq analysis on an Illumina HiSeq2000 with 50 bp single-end sequencing. Data were analyzed using Tophat 2.0.7 and Cufflinks 1.3.0 with the mm9 UCSC annotation file [12,30]. Primers used for qPCR are shown in Supplementary Table S2. Analysis was performed with DAVID [31] on GO Fat, Kegg, and Panther pathways with cutoffs of Log2FC (fold change) >1.5 and P<0.05. The top 10 up or downregulated clusters using gene function classification are shown. Data were deposited in the Gene Expression Omnibus (#GSE65337). The RNA-seq list from Cufflinks was sorted (high to low) by Log2FC of FPKM values (Nfix−/− /WT). This list was compared with gene lists from known OPC gene sets to generate receiver operating characteristic (ROC) curves.
Mouse cell type-specific gene lists were generated by differential gene expression analysis utilizing profiles of OPCs (PDGFαR+), OLs (GalC+ & MOG+), astrocytes (S100B+), and neuronal populations [32]. Cell type-specific gene lists were generated by comparison against all other cell types using a linear model and regulated genes identified using greater than five-fold change (FC) and 1% false discovery rate (FDR) cutoffs. The gene list of human fetal CD140a+ OPCs was generated by comparison against the profile of CD140a − cells (>3FC, 5%FDR) [33]. The gene list of human adult A2B5+ OPCs (from subcortical white matter) was generated by comparison with unsorted white matter and the profiles of sorted microglia (CD11b+) and astrocytes (GLT1+) (>3FC and 5% FDR) [34].
Results
NFIX is expressed in most neural stem and progenitor cells in postnatal DG and SVZ, but not in SOX10+ OPCs
Previously, we showed that NFIX is expressed in both the SVZ and DG [10,11], the two main niches for NSCs in adult mice. To assess NFX expression in NSCs and their progeny in the DG, we performed immunostaining on WT postnatal day 12 (P12) DG sections with markers that distinguish the cell types present, as described previously [25,35] (Supplementary Fig. S1). NFIX was expressed in ∼65% of NSCs (GFAP+S100B−) (Supplementary Fig. S1A, A′, white arrows, quantified in Supplementary Fig. S1E), most transit amplifying progenitors (Ki67+DCX−) (Supplementary Fig. S1B, B′, white arrows), neuroblasts (Ki67+DCX+) (Supplementary Fig. S1B, B″, yellow arrows), and immature neurons (Ki67-DCX+) (Supplementary Fig. S1B, B′″, cyan arrows). While most mature neurons were NFIX negative (Supplementary Fig. S1C, C′, yellow arrowheads), ∼1/4 expressed NFIX (Supplementary Fig. S1C, C″, yellow arrows) and few mature astrocytes (GFAP+S100B+) (Supplementary Fig. S1A, A‴, yellow arrowheads) expressed NFIX. SOX10 is a marker of committed OPCs, and essentially no OLs or OPCs (SOX10+) (Supplementary Fig. S1D, D′, yellow arrowheads) expressed NFIX. In summary, NFIX was expressed in most NSCs and some of their progeny, but not in OLs or OPCs in postnatal DG. This is consistent with previous data in postnatal SVZ [35], indicating a role for NFIX in NSCs at both locations. In addition, the absence of NFIX expression in SOX10+ cells in both DG (Supplementary Fig. S1D, E) and SVZ (0/48, Supplementary Fig. S2A, A′ and [35]) showed that NFIX expression is normally downregulated when NSC progeny commit to the OL lineage.
We next assessed NFIX expression in OL lineage cells in other regions of the postnatal brain. In P12 corpus callosum (CC), NFIX was expressed in most astrocytes (S100B+), but not in SOX10+ OL lineage cells (0/50, Supplementary Fig. S2B, C). In the cortex, NFIX expression was seen in most neurons (NEUN+) and a few astrocytes (S100B+), but not in SOX10+ OL lineage cells (0/71, Supplementary Fig. S2D, E). These data indicate that NFIX expression is suppressed in OL lineage cells in multiple regions of the postnatal mouse brain.
NFIX expression is lost when NSCs generate OL lineage cells in vitro
To assess NFIX expression during NSC lineage determination in vitro, we generated SVZ-derived primary neural stem and progenitor cells from P10 WT brains. The cells were induced to differentiate into multiple lineages by removal of growth factors for 4 days [36] and stained for NFIX and differentiation markers. All presumptive astrocytes showed strong NFIX expression (GFAP+, Fig. 1A, B), while only 16% of neurons strongly expressed NFIX (TUJ1+, Fig. 1C, D). Consistent with our in vivo data, no mature OLs (0/285) were NFIX+ (O4+, Fig. 1E, F), indicating loss of NFIX expression during ODG from NSCs.
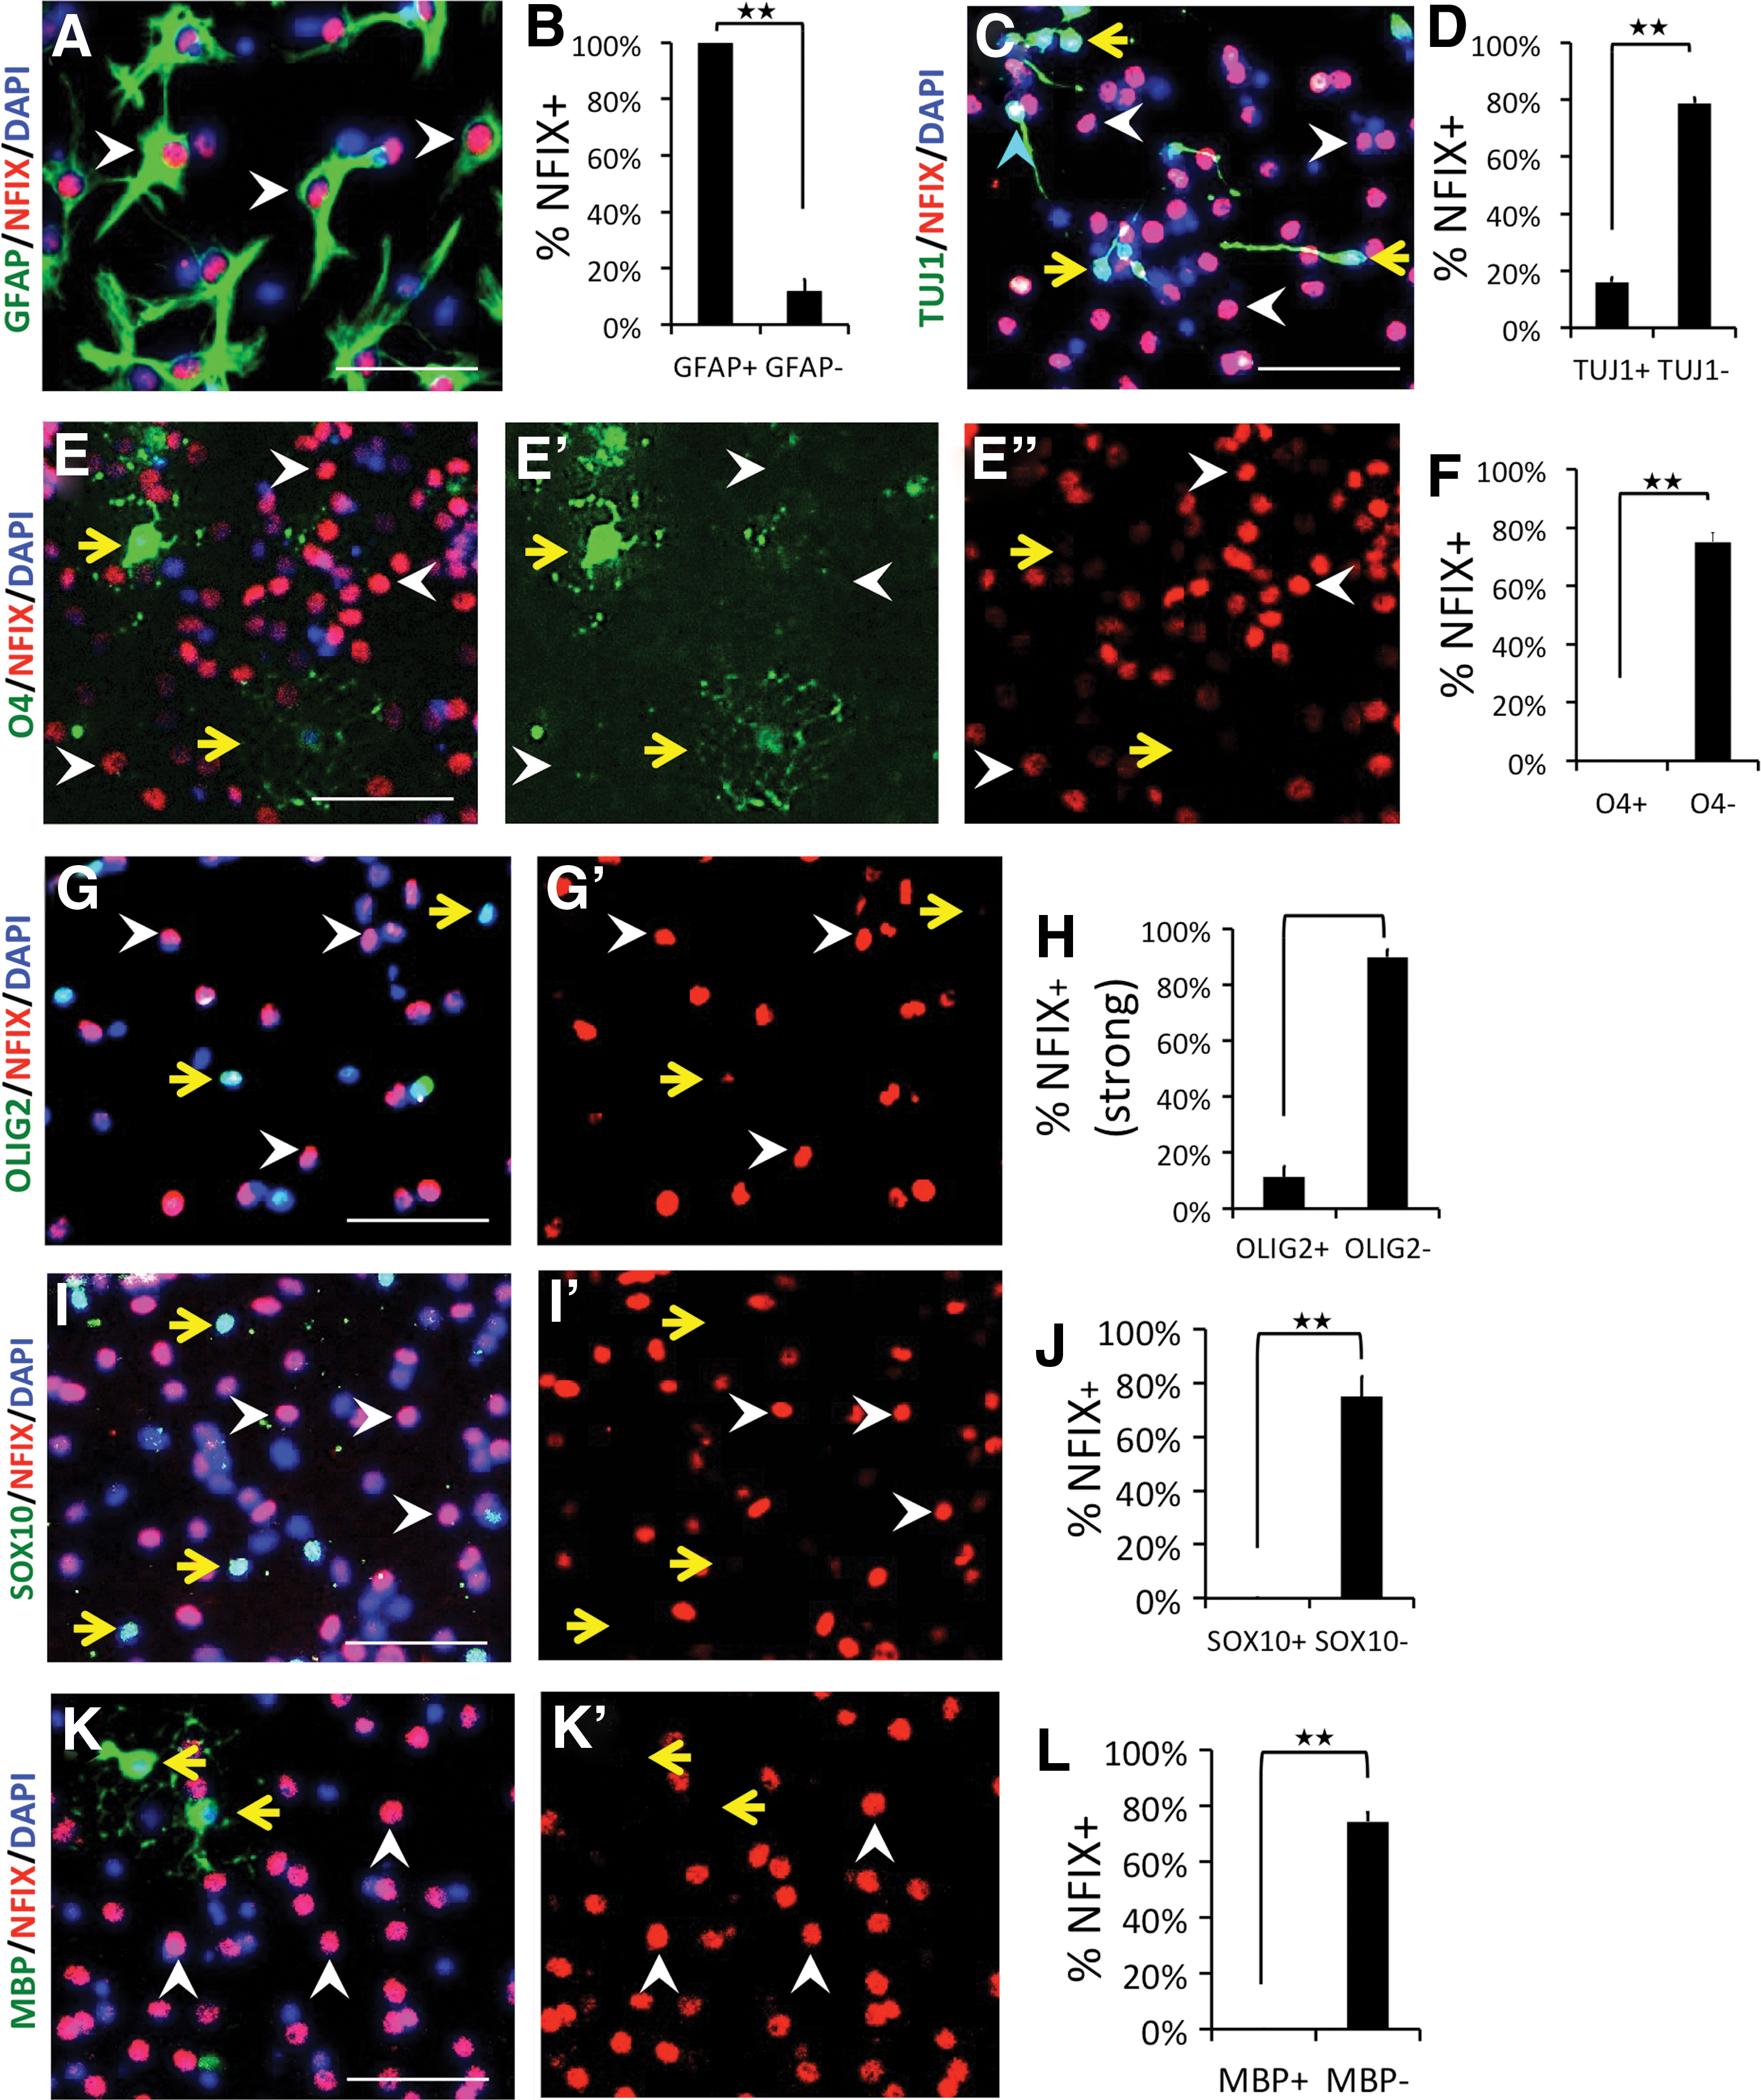
Expression of NFIX in differentiated lineages of cultured NSCs in vitro. WT NSCs were cultured in differentiation conditions for 4 days and stained for differentiation markers and NFIX.
To ask when NFIX expression is lost during ODG in vitro, we stained cells that had been differentiated for 4 days for markers representing various stages of ODG: OLIG2, expressed in NSCs and very early OPC stages; SOX10, expressed at a later OPC stage and in mature OLs; and MBP, expressed only in myelinating OLs. While ∼90% of OLIG2− cells were NFIX+, only ∼10% of OLIG2+ cells were NFIX+ (Fig. 1G, H). In addition, while ∼80% of SOX10− cells were NFIX+, no (0/580) SOX10+ cells were NFIX+ (Fig. 1I, J). Similarly, no MBP+ cells expressed NFIX (Fig. 1K, L). These data show the loss of NFIX expression in all OL lineage cells beginning at the early OPC state. This is consistent with our in vivo IHC data showing no SOX10+/NFIX+ cells in either SVZ or DG ([35] and Supplementary Figs S1 and S2).
Loss of NFIX promotes ODG from NSCs in vitro
NFIX expression is high in proliferating NSCs, but very low or absent in cells undergoing ODG, suggesting that NFIX expression may be incompatible with ODG. However, is the loss of NFIX expression a cause or an effect of ODG? To address this, we assessed the lineage specification pattern of P10 WT and Nfix−/− SVZ-derived NSCs; >95% of both WT and Nfix−/− proliferating NSCs were Nestin+ (data not shown), indicating a uniform high percentage of NSCs in each population. After withdrawal of growth factors for 4 days, there was an approximately four-fold higher percentage of O4+ cells in Nfix−/− versus WT cultures (Fig. 2A–C). In contrast, the percentage of TUJ1+ and GFAP+ cells was similar in both (Fig. 2D, H, respectively). The lack of a statistically significant decrease in the percentage of TUJ1+ and GFAP+ cells is likely due to the relatively low percentage of O4+ cells present in both populations. Consistent with the increased percentage of O4+ cells, Nfix− /− cultures also showed a significantly higher percentage of SOX10+ (Fig. 2E–G) cells versus WT cultures.
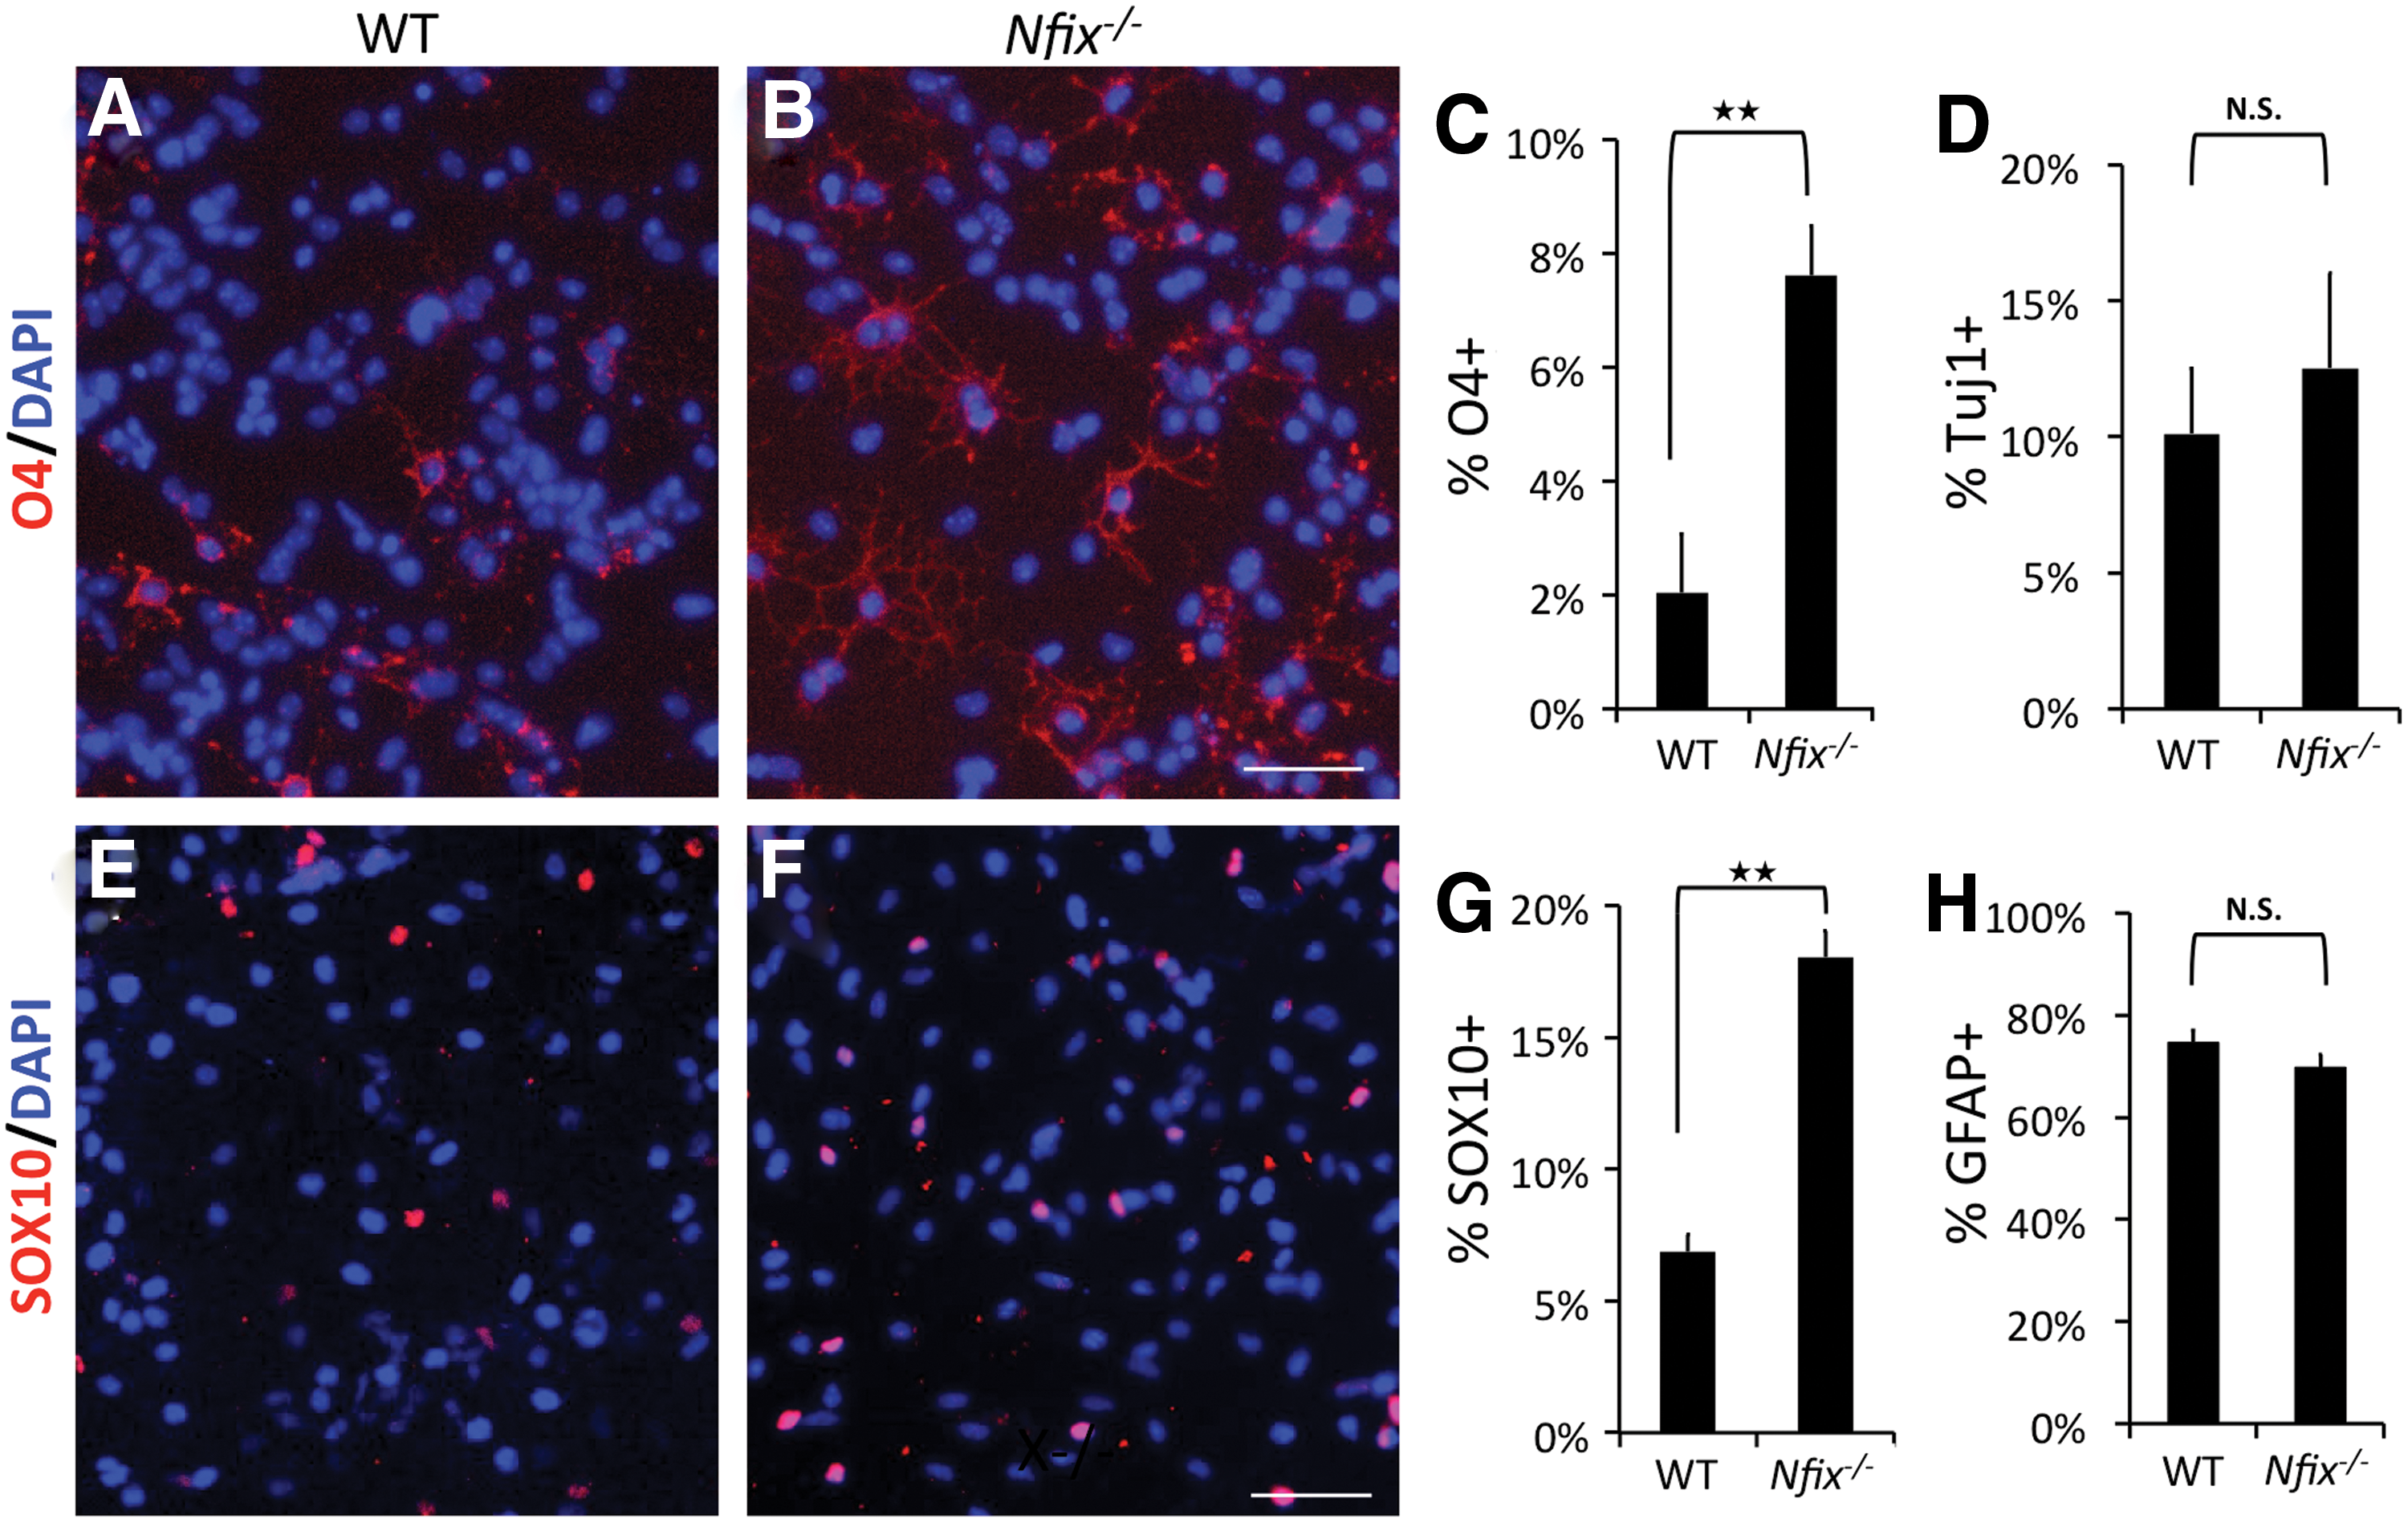
Nfix−
/−
NSCs generate a higher percentage of OL lineage cells than do WT NSCs. Primary WT and Nfix−/−
NSCs were cultured in differentiation conditions for 4 days and stained with anti-O4
To further assess the lineage specification properties of Nfix−/− NSCs, we generated neurospheres from WT and Nfix−/− SVZ and assessed the cell types generated upon growth factor withdrawal. Consistent with the data from monolayer cultures, a significantly higher percentage of Nfix−/− neurospheres contained O4+ cells compared with WT neurospheres (Supplementary Fig. S3F), while the fraction of GFAP+ (not shown) and TUJ1+ neurospheres (Supplementary Fig. S3E) did not differ between Nfix− /− and WT cultures. These data suggest that the absence of Nfix biases NSCs to choose the OL lineage.
Forced expression of NFIX blocks ODG of NSCs in vitro
To further assess the role of NFIX in ODG, we induced expression of NFIX in Nfix−/− primary cultured NSCs. Electroporation of a control internal ribosome entry site (IRES)-GFP vector had no observable effect on differentiation versus nonelectroporated cells (Supplementary Fig. S4A). Electroporation of Nfix−/− NSCs with an NFIX-IRES-GFP expression vector resulted in a significant change in the distribution of cell types generated compared with that seen with the control vector (Fig. 3). The percentage of SOX10+ and O4+ cells was reduced in GFP+ cells of NFIX-IRES-GFP-electroporated cultures versus GFP+ cells from IRES-GFP cultures (Fig. 3C, D). In addition, a reduced percentage of GFP+ cells in NFIX-IRES-GFP-electroporated cultures showed SOX10+ and O4+ staining versus GFP− cells in the same cultures (Supplementary Fig. S4B, C). These data support a cell-autonomous role for NFIX in suppressing ODG from NSCs.
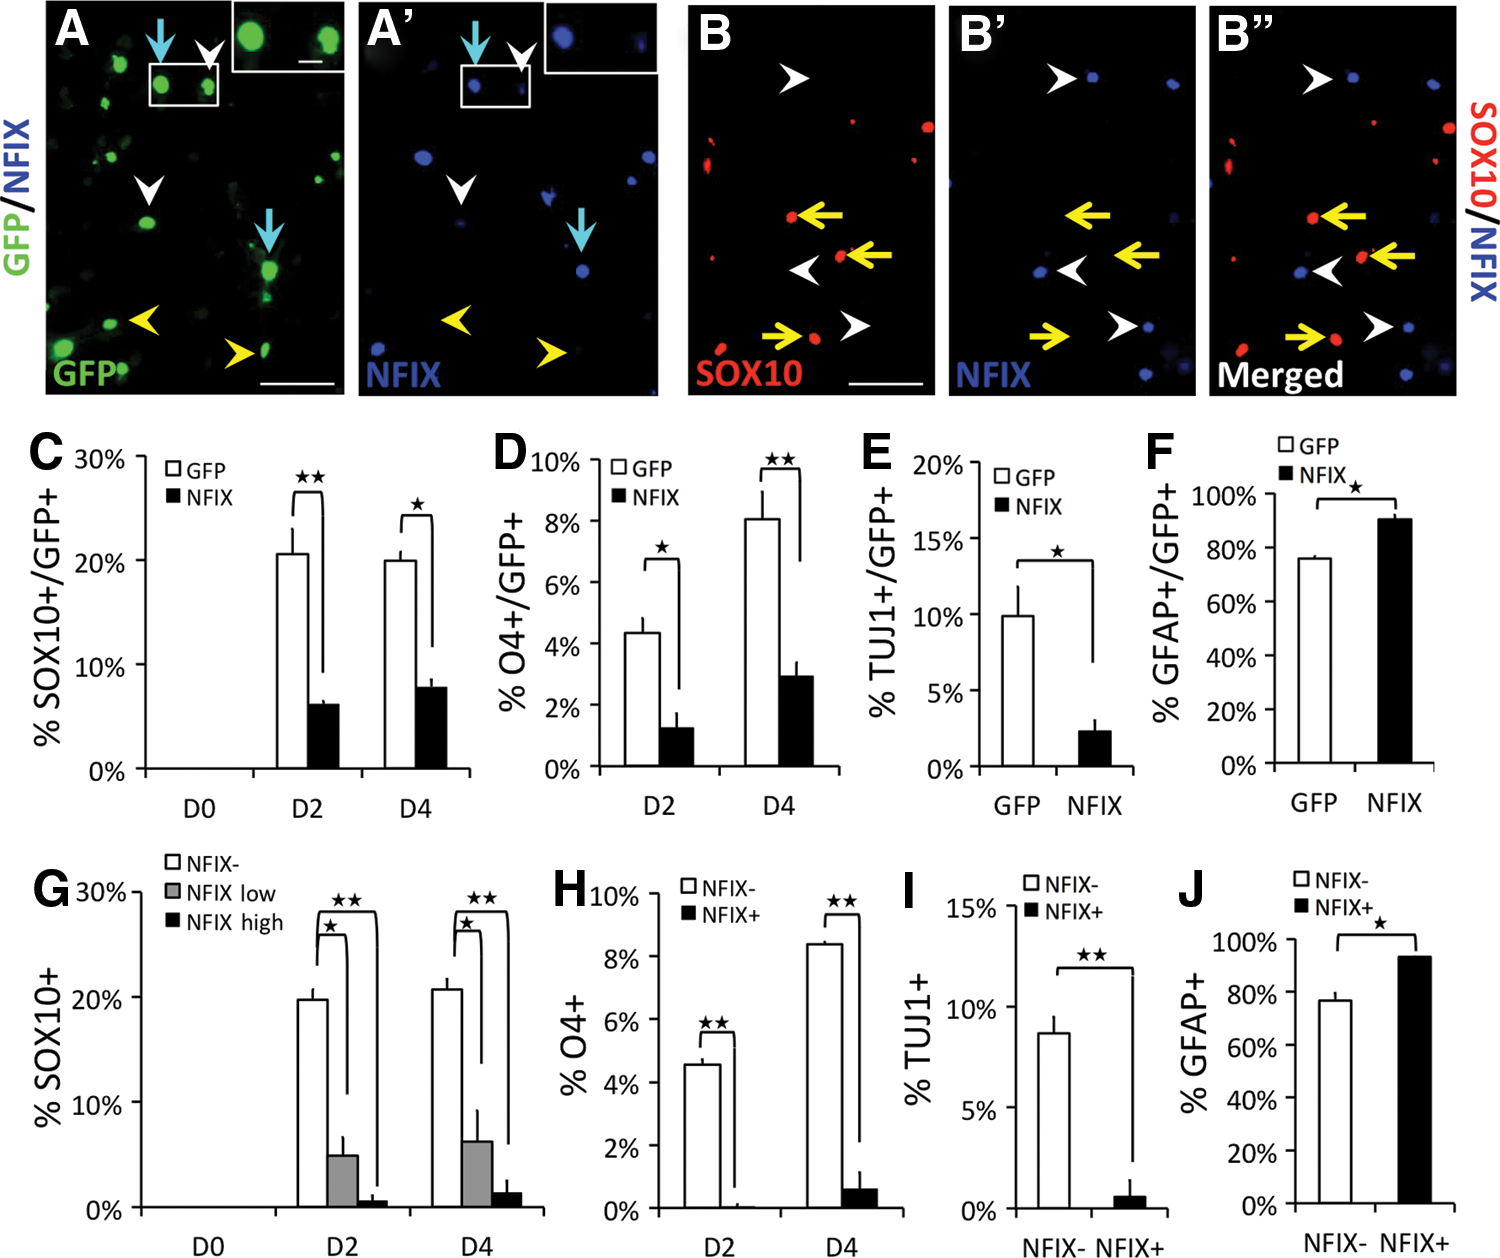
Forced expression of NFIX in Nfix−/−
NSCs represses ODG. Proliferating Nfix−
/−
NSCs were electroporated with either control IRES-GFP (GFP) or NFIX-IRES-GFP (NFIX) vectors, placed in differentiation conditions for 0 days (D0), 2 days (D2), or 4 days (D4), and stained for GFP, NFIX, and the indicated markers.
In this expression system, NFIX is translated from the first ATG 3′ of the transcription start site, while GFP is expressed from a downstream IRES on the same transcript. Surprisingly, we saw that in the NFIX-GFP-electroporated cells, all NFIX+ cells were GFP+, but not all GFP+ cells expressed the same level of NFIX. Some GFP+ cells had very strong NFIX expression, some showed weaker NFIX expression, and some appeared NFIX negative (NFIX−) (Fig. 3A, A′). We therefore quantified the fraction of OLs from cells expressing high or low levels of NFIX (NFIX-high and NFIX-low) in NFIX-electroporated cultures. In both populations, and particularly in NFIX-high cells, there was a decrease in the percentage of SOX10+ cells compared with the NFIX− cells in the same cultures (Fig. 3G, see Fig. 3B for example of mutually exclusive SOX10 and NFIX expression). Dual O4/NFIX staining showed that almost none of the NFIX+ cells differentiated into O4+ cells (Fig. 3H). These data indicate that forced expression of NFIX appears sufficient to suppress ODG from NSCs in vitro.
When we assessed the percentage of GFP+ cells in other cell lineages, we noted a significant decrease in the percentage of TUJ1+ cells from NFIX-IRES-GFP-expressing cells compared with IRES-GFP cells (Fig. 3E). Thus, forced expression of NFIX can also repress neurogenesis. Consistent with the observed decrease in ODG and neurogenesis, the percentage of cells expressing GFAP was increased in NFIX-expressing versus control cells (Fig. 3F). To further test for a cell-autonomous effect of NFIX on differentiation, we compared NFIX+ and NFIX− cells in the NFIX-IRES-GFP-electroporated cultures. Consistent with the above data, cells expressing NFIX showed reduced neuronal and increased astrocyte marker expression versus NFIX− cells in the same cultures (Fig. 3I, J). Forced expression of NFIX also appeared to reduce the proliferation of NSCs as shown by a six- to nine-fold decrease in Ki67 staining (Supplementary Fig. S4D). These data are consistent with our previous data showing that forced expression of NFIX promoted quiescence of the NS5 NSC line [12].
Loss of NFIX increases ODG marker expression in vivo
To determine the role of NFIX in ODG in vivo, we first measured the transcript levels of OL and OPC markers in WT and Nfix−/− littermate brains from P6 to P10. At P6, the transcript levels of Olig2, Sox10, and Mbp were similar in WT and Nfix−/− brains (Fig. 4A–C). However, by P8, both the early ODG markers (Olig2 and Sox10) and the late marker (Mbp) were elevated in Nfix−/− brains versus WT littermate controls (Fig. 4A–C, respectively). At P10, the transcript levels of all three ODG markers were also elevated in the Nfix−/− brains, suggesting precocious ODG in Nfix− /− mice in vivo.

Nfix−/−
brains have increased transcript levels of OPC and OL marker genes. Brains of WT and Nfix−
/−
mice were dissected at postnatal days 6 (P6), 8 (P8), or 10 (P10), the olfactory bulbs and cerebella were removed, and RNA was prepared and subjected to reverse transcription.
We did not measure marker transcript levels at later stages of development as germline Nfix−/− mice develop severe hydrocephalus from P12 and do not survive weaning. Therefore, to test whether NFIX affects ODG from adult NSCs, we generated 4-week-old Nestin-CreERT2/R26R-EYFP/Nfixflox/− (Nfix iKO) mice and lineage traced the Nestin+ NSCs in vivo using EYFP as a marker (Fig. 5A). Brains were harvested at 1, 2, and 3 months after tamoxifen injection (1, 2, and 3 M, red arrows in Fig. 5B). One month after tamoxifen injection, ∼20% of EYFP+ cells in the CC of Nfix iKO mice were costained with OLIG2, while very few EYFP+ cells in the CC of NestinCreERT2/R26-EYFP/Nfix+/+ (Nfix+/+ ) mice were OLIG2+ (Fig. 5D). This difference increased at 2 and 3 months after injection (Fig. 5D, see Fig. 5C for example). At 3 months, 60% of the EYFP+ cells expressed OLIG2 in the CC of Nfix iKO mice, while almost no EYFP/OLIG2+ cells were present in the Nfix+/+ CC. Most of the OLIG2-EYFP+ cells in the Nfix+/+ CC were S100B+ astrocytes (data not shown). These data indicate that Nestin-Cre-mediated loss of NFIX appears to bias adult NSC lineage determination toward the OL lineage in vivo. In addition, since only a fraction of Nestin+ NSCs were subject to loss of NFIX in a WT background, these data indicate that NFIX likely suppresses postnatal ODG of NSCs in a cell-autonomous manner.
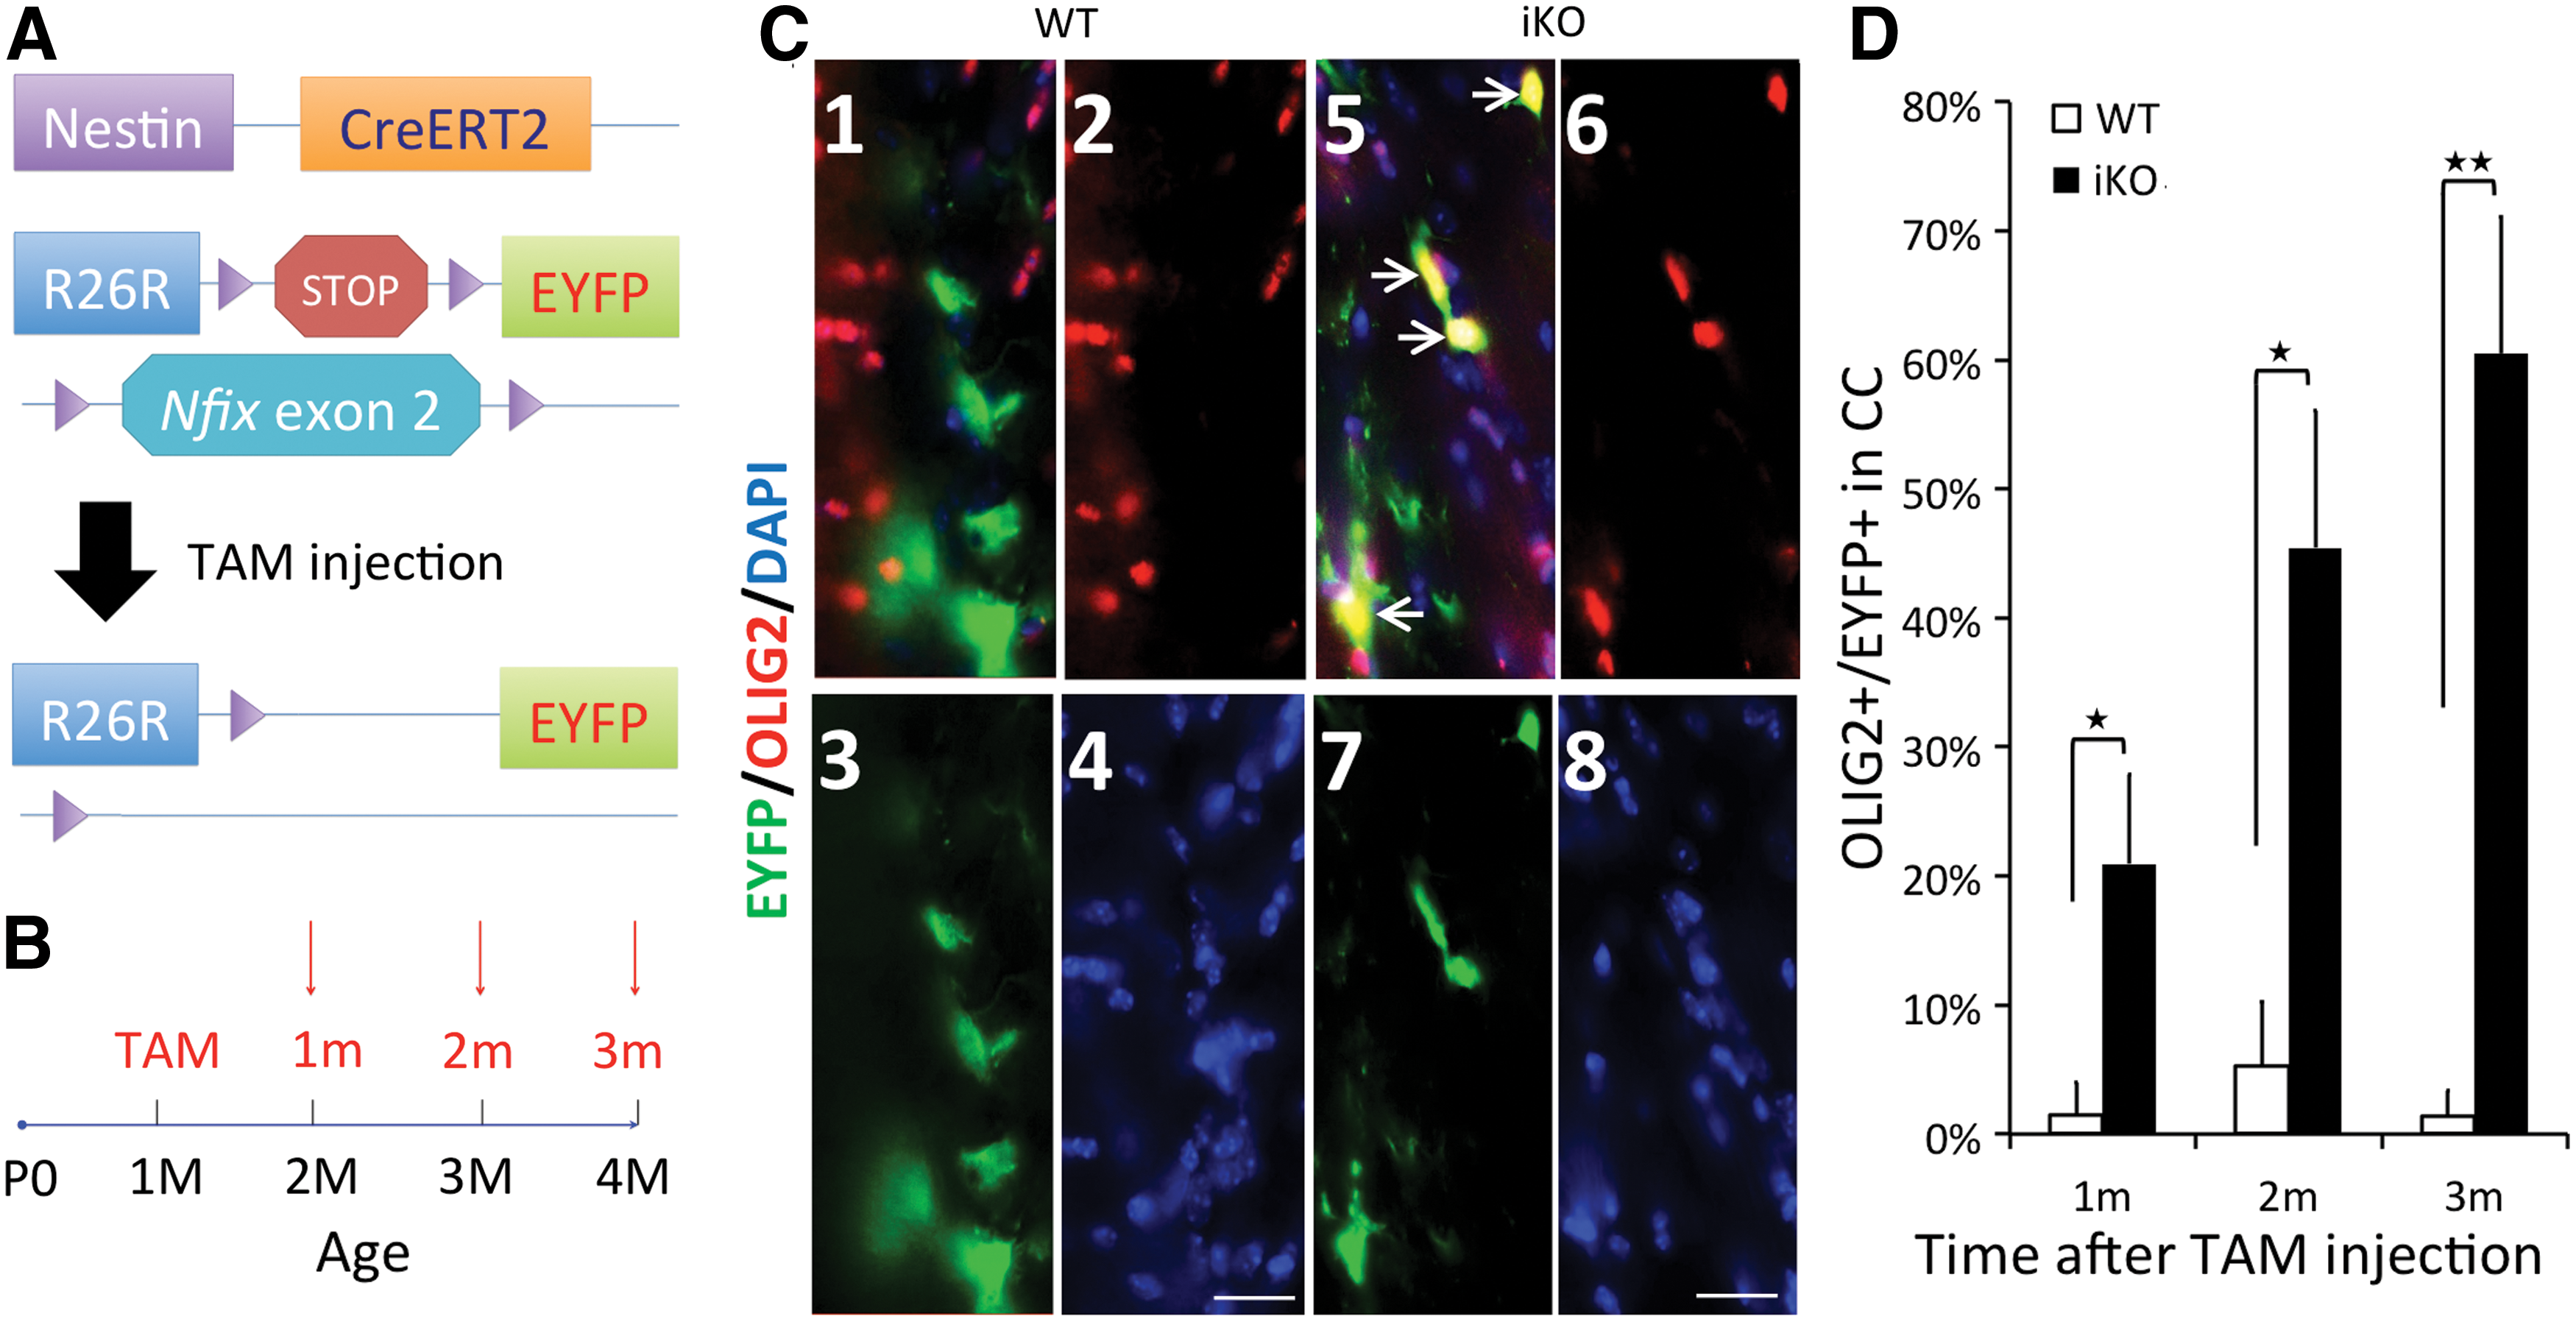
Deletion of Nfix in vivo results in increased commitment of SVZ-derived NSCs into OL lineage cells in the corpus callosum (CC). Mice containing Nestin-CreERT2 and Rosa26 flox-stopped EYFP alleles that were either Nfix
+/+ (WT) or homozygous for a floxed Nfix allele (iKO) were injected with tamoxifen at 1 month of age and sacrificed at 1, 2, and 3 months after injection (1m–3m, respectively). Brains were fixed and stained for OLIG2, EYFP, and DAPI.
Loss of NFIX from NSCs increases expression of OPC-specific genes
Both our in vivo and in vitro data indicate a role for NFIX in suppressing NSC progression into the OL lineage. To assess possible mechanisms of this suppression and examine transcriptome changes in the absence of Nfix, RNA-seq was performed on proliferating WT and Nfix−/− primary culture NSCs (Supplementary Table S3). The quality of these data was tested by qPCR, which confirmed a subset of transcripts whose expression was changed in Nfix−/− NSCs (Supplementary Fig. S5). GO analysis using DAVID showed that the most significantly downregulated gene sets in Nfix− /− NSCs were related to cell attachment and proliferation (Fig. 6C, D), consistent with our previous microarray data on the NS5 cell line expressing a dominant repressor form of NFI [12]. In addition, genes whose expression is increased or decreased in Nfix−/− NSCs are enriched for NFI-binding sites within 50 kb of their TSS, as assessed from previous NFI ChIP-seq data in NS5 cells (Fig. 6A) [12]. These data suggest that NFIX may directly regulate a large fraction of these genes in NSCs.
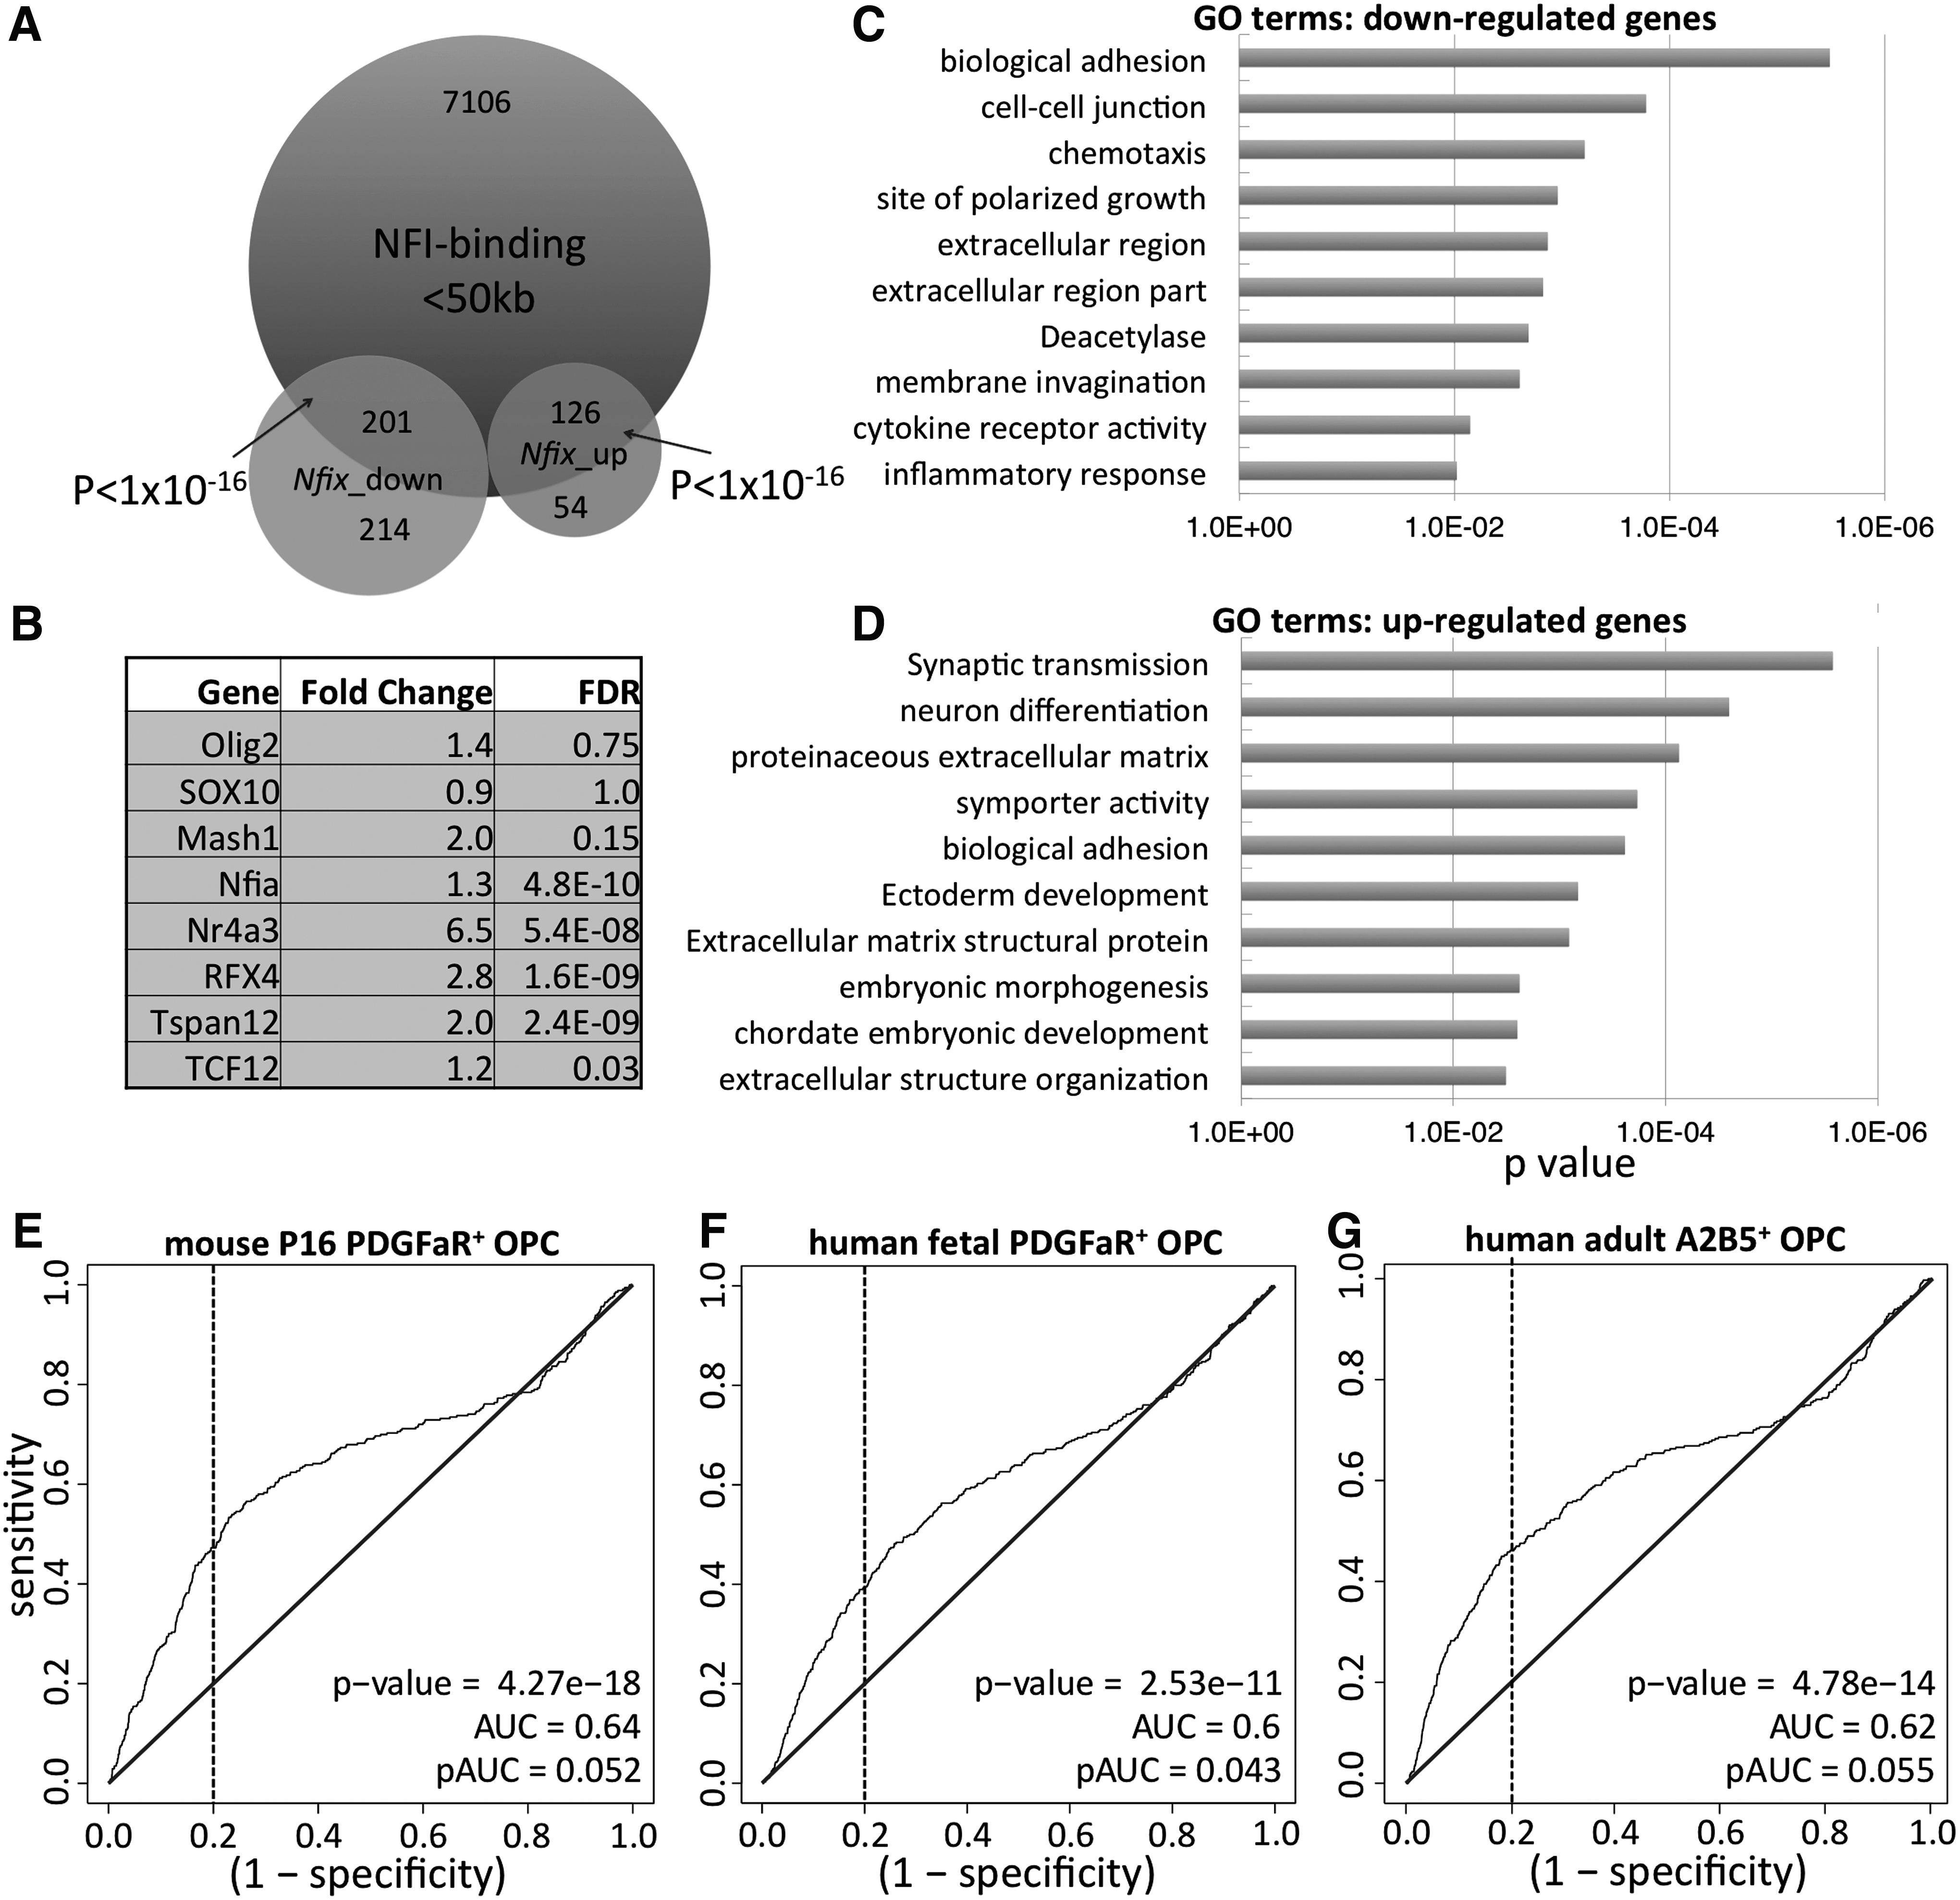
Genes differentially expressed in Nfix−
/−
NSCs show enrichment in specific GO terms, NFI-binding sites, and genes differentially expressed in OPCs. WT and Nfix−
/−
NSCs were cultured for 10 days, then harvested, and RNA was prepared and subjected to RNA-seq analysis.
We next asked whether the expression of genes associated with early stages of ODG was enriched in the Nfix−/− cultured NSC compared with WT controls. When the set of genes differentially expressed in Nfix− /− versus WT NSCs was compared with gene sets differentially expressed in mouse OPCs [32] using ROC analysis [37 –39], a significant enrichment of PDGFαR+ OPC-enriched transcripts was seen in Nfix−/− cultured NSCs (P=4.27e−18) (Fig. 6E). Similarly, human fetal and adult OPC-enriched transcripts were also significantly enriched in Nfix−/− cultured NSCs (Fig. 6F, G) [33,34]. This suggests that NFIX may directly regulate OPC-specific gene expression and subsequently repress ODG from NSCs. In contrast, two mature OL-enriched gene sets did not show an apparent enrichment in Nfix−/− cultured NSCs (Supplementary Fig. S6), suggesting that NFIX may regulate early stage, but not late stage, ODG.
Discussion
In this study, we show that cells within the OL lineage have little or no NFIX expression compared with other NSC-derived cell lineages (Fig. 1 and Supplementary Figs S1–S3). Loss of NFIX from NSCs resulted in increased ODG both in vivo and in vitro (Figs. 2, 4, and 5). In addition, forced expression of NFIX appears sufficient to suppress ODG from cultured Nfix− /− NSCs in vitro (Fig. 3). Gene expression analysis showed increased expression of OPC-specific genes in Nfix−/− versus WT cultured NSCs, suggesting that NFIX expression in NSCs is inversely correlated with the expression of OPC markers (Fig. 6E–G). These data are consistent with the model that NFIX directly suppresses the generation of OPCs from NSCs.
NFIX is expressed in most NSCs in postnatal DG and SVZ
It is of interest that the expression patterns of NFIX differed between NSCs of the SVZ and DG. While almost all SVZ NSCs are NFIX+ [35], only approximately half of DG NSCs are NFIX+. While similar markers are expressed in NSCs of both regions (eg, Nestin, GFAP, GLAST), the functional properties of NSCs in the two regions differ. For example, only SVZ NSCs normally generate postnatal OPCs and OLs in vivo [19,40], although both SVZ and DG NSCs differentiate into OLs in vitro [41,42]. Differences between NSCs in the SVZ and DG are believed due, at least in part, to distinct extracellular signaling within the two niches [14,43]. It is possible that the extracellular environment in the SVZ may better promote NSC proliferation and ODG than does the DG. Once the NSCs differentiate into mature astrocytes or neurons that migrate to new locations in vivo, signals in the new environment may act to reduce NFIX expression. This would be consistent with our finding that NFIX expression was observed in only a fraction of mature neurons in the SVZ and DG ([35] and Supplementary Fig. S1E).
NFIX regulates early stages of ODG
Our data indicate that NFIX biases NSC lineage commitment away from ODG. The lack of NFIX expression in both SOX10+ cells in vivo and in vitro and OLIG2+ cells in vitro indicates that NFIX expression is downregulated at an early step of ODG. In addition, our ROC analysis showed the enrichment of OPC-enriched genes, but not OL-enriched genes in Nfix− /− NSCs, supporting the model that NFIX may repress an early stage of ODG from NSCs. Consistent with this model, our qPCR analysis showed a significant increase in the levels of Olig2, Sox10, and Mbp transcripts in Nfix−/− versus WT brains (Fig. 4). The magnitude of this difference was similar for both early (Olig2) and late (Mbp) markers of ODG, although the timing of the changes differed. These data are consistent with the germline loss of NFIX promoting precocious ODG, presumably from NSCs.
Forced expression of NFIX blocks ODG of NSCs
Both monolayer and neurosphere assays indicated that loss of NFIX increases ODG from NSCs. However, loss of NFIX is not sufficient to induce ODG as only a small fraction of NSCs became OLs upon complete loss of NFIX. Therefore, we asked whether loss of NFIX is necessary for ODG from cultured NSCs. In our electroporation system, while all NFIX+ cells were GFP+, the GFP+ cells showed a range of NFIX expression (NFIX-high, NFIX-low, and NFIX− cells). When we analyzed the NFIX-high and NFIX-low cells separately, we found that almost none of the NFIX-high cells were SOX10+ cells, while ∼5% of NFIX-low cells were SOX10+ (Fig. 3F). These data suggest that there may be a dose dependence of NFIX on suppression of the OL lineage, which likely relates to the observed timing of the drop of NFIX expression during NSC ODG.
It was unexpected to find a decrease in TUJ1+ cells from NFIX-IRES-GFP-electroporated cells compared with controls as enhanced neurogenesis was not seen in differentiated Nfix−/− NSC monolayer or neurosphere cultures. However, these data are consistent with the low fraction of neurons that express high levels of NFIX both in vivo and in vitro. One possibility is that the effect of NFIX on neurogenesis depends on the precise level of NFIX. In our electroporated cells, we estimate that NFIX transcript levels may be as much as five-fold above the endogenous levels seen in NSCs (data not shown). Thus, while forced expression of NFIX reduces neurogenesis from NSCs, it is possible that endogenous levels of NFIX may not affect neurogenesis. Alternatively, different functions have been reported for alternatively spliced products of the same Nfi gene [44]. Thus, it is possible that the Nfix2 isoform we expressed in NSCs represses neurogenesis, while other isoforms of Nfix may not. Further studies are needed to test for specific roles of different Nfix isoforms in neurogenesis, astrogenesis, and ODG.
In vivo lineage tracing indicates cell-autonomous regulation of NSC ODG by NFIX
Our DAVID analysis of genes downregulated in Nfix− /− cultured NSCs suggests that the gene set regulated was related to cell external stimuli. There are a number of growth factors/hormones that are critical for induction of ODG from NSCs and OPC survival, including thyroid hormone, FGF-2, BDNF, IGF-1, and PDGF [45 –52]. However, our RNA-seq data indicated that none of these signaling molecules was affected by loss of NFIX. The level of FGF-5 transcript was decreased in Nfix− /− NSCs; however, addition of FGF-5 (10 ng/mL) to the proliferation and differentiation medium did not affect ODG of NSCs (data not shown). Thus, we have no evidence that apparent suppression of NSC ODG by NFIX is related to secreted signaling molecules.
To test whether NFIX suppresses ODG cell-autonomously in vivo, we generated Nfix iKO mice and performed lineage tracing of Nestin+ cells. OPCs produced from adult NSCs in the SVZ normally migrate primarily to the CC [14,21,23,53]. In this study, we found that Nfix−/− NSCs generated a much higher percentage of OLIG2+/EYFP+ OPCs in the CC than did Nfix+/+ NSCs. These data are consistent with cell-autonomous regulation of ODG by NFIX. However, no OLIG2+/EYFP+ cells were detected in the DG in either Nfix+/+ or Nfix iKO mice (data not shown). These data suggest that NSCs in the SVZ and DG differ in their response to loss of NFIX. Determining whether this difference is cell intrinsic, or due to the environment of the respective stem cell niches, requires further examination.
Nestin is often used as an NSC marker both in vivo and in vitro [26,54]. However, recent studies have shown some heterogeneity of NSCs in vivo, with Nestin marking only a substantial fraction of the NSCs [55,56]. Thus, our in vivo data indicate only that NFIX appears to suppress ODG from the Nestin+ fraction of SVZ NSCs. To address how well the Nestin-CreERT2 deletion of NFIX reflects the entire NSC population, additional lineage-tracing studies using other Cre expression systems, including GLAST-CreERT2 and GFAP-CreERT2, are needed.
Possible mechanisms of NFIX regulation of ODG
There are at least three simple models for how NFIX may affect the lineage determination of NSCs. First, it is possible that NFIX alone directly or indirectly regulates one or a few key TFs essential for NSCs to progress toward ODG. Second, NFIX alone may directly or indirectly regulate a complex network of TFs and signaling molecules that influences commitment to the OL lineage. Third, NFIX may interact specifically with other NFI family members, including NFIA, to regulate either key factors or networks of factors essential for NSC ODG. Each of these models is, at least partially, consistent with our data, but some are better supported than others.
Previous studies have shown that enforced expression of OLIG2 or SOX10 in NSCs can promote ODG [57,58]. However, our RNA-seq data show no major changes in the transcript levels of these key TFs in Nfix− /− NSCs. In contrast, Rfx4 is involved in human ODG and oligodendroglial tumor formation [34,58,59] and its expression was increased ∼2.8-fold in Nfix−/− cultured NSCs. In addition, several other TFs whose transcript levels are weakly altered by loss of NFIX (Fig. 6B) may influence ODG. Knockdown studies on these individual TFs will be necessary to test this model.
The Network Model is most consistent with our RNA-seq data. Our ROC analysis showed that a large number of genes differentially expressed in OPCs were also differentially regulated in Nfix− /− versus WT NSC cultures in vitro. This correlation of gene expression was seen despite the fact that no SOX10+ cells were detected in proliferating Nfix− /− NSCs (data not shown). This coenrichment of gene sets in mouse and human OPCs and Nfix− /− NSCs is the strongest evidence of pre-existing bias in proliferating Nfix− /− NSCs toward the OL lineage. However, it is unclear mechanistically how a change in a set of genes related to ODG can bias cell populations toward differentiation into the OL lineage and yet result in only a small fraction of the cells going down this specific lineage in vitro.
Previous studies showed increased ODG in postnatal Nfia−/− spinal cord and brain [60 –62], suggesting that NFIA can also suppress ODG. In addition, NFIA appears to directly suppress neurogenesis and/or promote astrogenesis [63]. In this study, we show that loss of Nfix increases ODG and that forced NFIX expression suppresses ODG and neurogenesis, but promotes astrogenesis. There are at least three ways that NFIX and NFIA might function together to regulate ODG: (1) NFIX may regulate NFIA expression, (2) NFIX may heterodimerize with NFIA, or (3) NFIX may bind to the same regulatory sites and/or interact with the same ODG mediators as does NFIA. However, our RNA-seq data showed that Nfia transcripts were increased only ∼1.3-fold in Nfix−/− NSCs versus WT controls (Fig. 6B), while no changes were seen in Nfib and Nfic levels.
Since all NFIs bind to similar DNA sequences and have similar DNA-binding and dimerization domains [7,64], NFIX may regulate ODG by modulating the same signaling pathway genes and/or by antagonizing the function(s) of the same TFs (eg, SOX10, OLIG2) as does NFIA [60 –62]. However, while both NFIX and NFIA suppress ODG, their mechanisms of action may be distinct. For example, NFIX appears to regulate an early stage of ODG (from NSC to OPC), while NFIA affects multiple stages of ODG [61,62]. Thus, it will be important in future studies to determine common versus unique targets of NFIX and other NFIs in NSCs and OPCs.
Mutations in the human homolog of Nfix are seen in the Marshall-Smith and Sotos-like syndromes [65 –67], which exhibit delayed brain development, suggesting that NFIX plays important roles in both mice and humans. Moreover, NFIX and other NFIs have been identified as putative oncogenes or tumor suppressor genes in genetic models of meduloblastoma [68] and glioblastoma [69], and OPCs have been implicated as the cell of origin of glioblastomas [70,71]. Thus, a better understanding of the mechanism by which NFIX regulates NSC ODG may lead to improved therapies for brain injury, demyelinating diseases, developmental syndromes, and brain tumors.
Footnotes
Acknowledgments
This work was supported by NYSTEM contracts, C026429 and C026714, to R.M.G and by National Health and Medical Research Council project grants, 1003462, 1057751, and 1022308, to M.P. M.P was supported by an Australian Research Council Future Fellowship, FT120100170. The authors acknowledge the WNYSTEM Stem Cell Sequencing/Epigenomics Analysis Facility for RNA-seq data collection and analysis and thank Dr. Amelia J. Eisch for the Nestin-CreERT2/R26R-EYFP mice.
Author Disclosure Statement
No competing financial interests exist.
References
Supplementary Material
Please find the following supplemental material available below.
For Open Access articles published under a Creative Commons License, all supplemental material carries the same license as the article it is associated with.
For non-Open Access articles published, all supplemental material carries a non-exclusive license, and permission requests for re-use of supplemental material or any part of supplemental material shall be sent directly to the copyright owner as specified in the copyright notice associated with the article.