
Abstract
Polycomb proteins such as the B lymphoma Mo-MLV insertion region 1 homolog (BMI1) are essential chromatin factors for the self-renewal and differentiation of embryonic and adult stem cells. BMI1 also plays a critical role in osteogenesis as Bmi1-deficient mice display a skeletal phenotype caused by the exhaustion of the mesenchymal stem cell pool. In this study, we have studied the role of BMI1 in the osteogenic differentiation of human adipose tissue-derived mesenchymal stem cells (hASCs). BMI1 protein, but not RNA levels, increases during in vitro osteogenic differentiation of hASCs. Overexpression of BMI1 leads to an osteogenic priming of hASCs under nondifferentiating conditions and enhanced osteogenesis upon differentiation, along with increased BMP2 and WNT11 expressions. Conversely, knockdown of BMI1 expression reduces osteogenic differentiation. Furthermore, our studies indicate that during osteogenic differentiation of hASCs, BMI1 is a downstream target of GSK3 signaling. BMI1, therefore, acts as a pro-osteogenic differentiation factor in hASCs and hence it is a promising target for active modulation of hASC-derived osteogenesis.
Introduction
D
Molecularly, osteogenic differentiation of MSCs involves the same mechanisms that are active during skeletal development [4 –7] with a functional role for the core binding factor 1 (CBFA1, RUNX2) as an activator of osteoblast differentiation [8]. CBFA1 acts downstream of bone morphogenetic protein (BMP) and Wingless-type MMTV integration site family (WNT) signaling pathways [9 –12] and controls the expression of osteogenic marker genes such as osteocalcin (OC) [13].
While genetic studies suggest that the WNT pathway controls osteogenesis [14], a suppressive effect of canonical WNT signaling on osteogenic differentiation has also been reported [15]. In the absence of canonical WNT signaling, phosphorylation of β-catenin by glycogen synthase kinase 3β (GSK3B) at serine (S) 33 and 37 and threonine (T) 41 leads to the proteasomal degradation of β-catenin. However, upon binding of WNT to frizzled receptors and to low-density lipoprotein receptor-related protein (LPR) coreceptors, GSK3B-mediated phosphorylation of β-catenin is inhibited, resulting in the accumulation of intracellular β-catenin, which acts as a transcriptional activator [16].
Although GSK3B has been reported to be a negative regulator of osteogenic differentiation of human bone marrow MSCs [17], recent data also indicate that GSK3B is a promoter of osteogenic differentiation in human and mouse ASCs [18,19]. A pro-osteogenic function for GSK3 signaling is further supported by the phosphorylation of the osteogenic marker osterix and increase in ALP levels in mouse C2C12 cells by GSK3α (GSK3A), the second GSK3 isoform [20]. Together, these data suggest a complex regulatory network involving GSK3 and point to a cell context-dependent requirement of GSK3 signaling during osteogenic differentiation.
While the signaling and transcriptional networks controlling osteogenic differentiation have been extensively studied, less is known regarding the role of chromatin factors in the process. Recent reports suggest the involvement of Polycomb group (PcG) proteins [21 –23]. PcG proteins, initially described in Drosophila as factors that mediate the heritable silencing of Hox genes, constitute a large group of evolutionary conserved proteins that maintain cellular identity by establishing heritable repressed chromatin states [24]. Genome-wide chromatin association data implicate PcG proteins in the regulation of a multitude of loci and expression programs [25 –27].
Two prominent Polycomb repressive complexes (PRC1 and PRC2) exist that catalyze specific histone modifications. The PRC2-mediated H3K27me3 mark is recognized by PRC1 through binding of chromodomains-containing proteins [28]. The PRC1 component BMI1 is essential for PRC1-specific histone H2A ubiquitin E3 ligase activity [29]. It is a proto-oncogene and involved in the maintenance of stem cell self-renewal through repression of the INK4A/ARF tumor suppressor locus, which encodes the cell cycle suppressors P16INK4A and P19/P14ARF [30]. p19/P14ARF is an inhibitor of the TP53 pathway that controls the cell cycle repressor P21WAF1/CIP1.
Adult stem cell types that depend on BMI1 include hematopoietic, neural, intestinal, mammary stem cells and MSCs [31 –35]. Deletion of Bmi1 in mice leads to osteopenia caused by an exhaustion of the MSC pool in the bone due to impaired self-renewal, a consequence of deregulated p16Ink4a/p19Arf expression. In addition, the remaining MSCs preferentially differentiate along the adipogenic lineage through a mechanism that potentially involves the SIRT1 histone deacetylase [22], suggesting a function for BMI1 in mesenchymal lineage determination.
In this study, we investigate the role of BMI1 during osteogenic differentiation of hACSs. We find that BMI1 protein levels are upregulated during osteogenic differentiation and that overexpression of BMI1 enhances osteogenic differentiation, whereas conversely, knockdown (KD) of BMI1 expression attenuated osteogenic differentiation. We further identify BMI1 as a downstream target of GSK3 signaling during osteogenesis.
Materials and Methods
Culture of adipose tissue MSCs, BMI1 overexpression, and shRNA silencing
hASCs were obtained by elective tumescence liposuction of the abdomen and hip/thigh region with the written informed consent of the donors. The isolation and use of hASCs was approved by the responsible ethics committee (2009-210N-MA and 2006-192N-MA; Medical Faculty, Mannheim). Lipoaspirates were processed as previously described [3]. hASCs from a minimum of two donors were used for the experiments.
hASCs were cultured in basal MSC culture medium (bM) (Dulbecco's modified Eagle's medium [DMEM], 10% FCS penicillin/streptomycin,
The HuSH shRNA vector (ORIGENE) was used for the shRNA-targeted KD of BMI1. Four different shRNA sequences were pretested in hASCs for BMI1-specific KD, the two most efficient sequences were selected for further analyses.
Retroviral transduction was performed as described (
To ensure uniform expression of the transduced transgene/shRNAs, hASCs were cultured for 1 week in the presence of antibiotics (800 μg/mL Zeocin for pEGZ/pEGZ-Bmi1 or 10 μg/mL puromycin for shRNA-transduced cells). After selection, hASCs were used for subsequent analyses.
GSK3 inhibitor treatment
The optimal Chir99021 inhibitor (Axon Medchem) concentration used in this study was determined in a dose-finding assay by monitoring hASC viability and phosphorylation levels of GSK3A (Y216) and GSK3B (Y279) (p-GSK3) using the mouse phospho-GSK3 (Y279,216)-specific antibody (Merck; Millipore) in western blot analyses. Starting from the maximum concentration (25 μM) for GSK3 inhibition [37] a concentration of 6.7 μM yielded a minimum p-GSK3 level without impacting cell viability.
Osteogenic differentiation
For osteogenic differentiation 4 × 10⁴ hASCs were seeded into 2.5-cm culture dishes supplied with 2 mL of bM. The next day osteogenic differentiation was initiated by replacing bM with osteogenic differentiation medium (odM) (DMEM, 100 nM dexamethasone,
Alizarin Red staining
Alizarin Red staining was performed in 2.5-cm culture dishes. Before staining, the medium was replaced with phosphate-buffered saline (PBS), which was subsequently removed after 5 min and cells were fixed in formalin solution (10% in PBS) for 15 min at room temperature. Fixed cells were washed twice with ddH2O followed by incubation with Alizarin Red S solution (6 mg/mL Alizarin Red S in ddH2O; pH 4.2) for 20 min at room temperature. Subsequently, cells were washed four times for 5 min with ddH2O. After the last washing step, water was removed, and cultures were imaged with a digital camera or a Biozero microscope (Keyence).
Determination of ALP activity
Determination of ALP activity was performed using the Colorimetric Alkaline Phosphatase Assay Kit (BioVision). Briefly, 1 × 10⁵ cells were homogenized in ALP assay buffer, insoluble material was removed by centrifugation at 13,000 g, 3 min. Samples were transferred to a 96-well plate. Stop solution was added to terminate ALP activity, followed by addition of 50 mM pNPP solution, and incubation for 60 min at 25°C in the dark. Sample O.D. was measured at 405 nm on a SPECTRA THERMO Absorbance reader (TECAN). pNPP concentration was determined by extrapolation from the standard curve and normalization to both incubation time and cell number.
Semiquantitative RT-PCR analyses
Total RNA was extracted using the RNeasy Mini Kit (Qiagen) or peqGOLD RNA PURE solution (Peqlab). cDNA was synthesized using the First-Strand cDNA Synthesis Kit (Fermentas). Quantitative reverse transcriptase polymerase chain reaction (qRT-PCR) reactions were performed in a final volume of 20 μL containing 1 μL cDNA, 10 μL ABsolute SYBR Green Mix (Thermo Scientific), 5 μL primer (10 pmol), and 4 μL RNase-free water, using a Roche LightCycler 480 II under the following conditions: initial denaturation for 15 min at 95°C, followed by 45 cycles of 10 s at 95°C, 20 s at 60°C, and 30 s at 72°C. CT values were normalized to two housekeeper genes (TBP and B2M), which were preselected based on their stable expression using geNorm software [38].
Primer sequences were: TBP: forward 5′-cccatgactcccatgacc-3′, reverse 5′-tttacaaccaagattcactgtgg-3′; B2M: forward 5′-ttctggcctggaggctatc-3′, reverse 5′-tcaggaaatttgactttccattc-3′; BMI1: forward 5′-tggagaaggaatggtccacttc-3′, reverse 5′-gtgaggaaactgtggatgagga-3′; P21WAF1/CIP1: forward 5′-ctggagactctcagggtcgaa-3′, reverse 5′-ccaggactgcaggcttcc-3′; BMP2: forward 5′-agaaggaggaggcaaagaaa-3′, reverse 5′-aagcagcaacgctagaagac-3′; BMP4: forward 5′-cgtagccctaagcatcactcaca-3′, reverse 5′-gcgccggcagttcttattct; TNAP: forward 5′-atctttggtctggcccccatg-3′, reverse 5′-atgcaggctgcatacgccat-3′; P16INK4A: forward 5′-tggacctggctgaggagct-3′, reverse 5′-gaccttccgcggcatcta-3′; P14ARF: forward 5′-ggttctcgcagtaccattgaa-3′, reverse 5′-tgttcgcctcagtttccca-3′; CBFA1: forward 5′-agaggtaccagatgggactgtggtt-3′, reverse 5′-ggtagctacttggggaggatttgtg-3′; DKK1: forward 5′-cttggatgggtattccaga-3′, reverse 5′-cctgaggcacagtctgatga-3′; WNT5A: forward 5′-gaaatgcgtgttgggttgaa-3′, reverse 5′-atgccctctccacaaagtgaa-3; WNT5B: forward 5′-ctgcctttccagcgagaatt-3′, reverse 5′-aggtcaaatggcccccttt-3′; WNT11: forward 5′-ggcttgtgctttgccttca-3′, reverse 5′-tttgatgtcctgccctcctt-3′; OPG: forward 5′-ggcaacacagctcacaagaa-3′, reverse 5′-cgctgttttcacagaggtca-3′; AXIN2: forward 5′-tacactccttattgggcgatca-3′, reverse 5′-aagttcggaacaggtaagcac-3′; OC: forward 5′-cactcctcgccctattggc-3′, reverse 5′-gcctgggtctcttcactacct-3′; and HOXC13: forward 5′-aaggtggtcagcaaatcgaaag-3′ reverse 5′-tggtacaaagcggagacataaataga-3′.
Western blot analyses
hASC or osteogenic differentiated cells were lysed in 2 × Laemmli Buffer (0.5 M Tris HCl, pH 6.8, 0.4% SDS, 2% glycerol, 0.5% β-mercaptoethanol, and Bromophenol blue). Lysates were heated to 95°C for 5 min. Proteins were separated by SDS PAGE and blotted onto a nitrocellulose membrane (Schleicher & Schuell). Membranes were blocked for half an hour in TBST or PBST containing 5% milk powder at room temperature followed by an overnight incubation with primary antibodies. Membranes were washed three times with PBST or TBST followed by incubation with either stabilized peroxidase-conjugated goat anti-rabbit (1:1,000) (Thermo Scientific) or stabilized peroxidase-conjugated goat anti-mouse (1:1,250) (Thermo Scientific) antibody for 1 h at RT. After three washes in PBST or TBST membranes were covered with Amersham ECL Select Western Blot Detection Reagent (GE Healthcare). Chemiluminescence was detected on a ChemiDoc XRS low light imager (Bio-Rad).
Intensity of protein bands was determined using ImageJ software and protein levels were calculated as intensities of individual protein bands relative to the intensity of the corresponding GAPDH band. Antibodies: mouse Bmi1 (1:1,000) (Millipore), rabbit phospho-β-catenin S 33,37/T41(1:1,000) (Cell Signaling), rabbit phospho-β-catenin S675 (1:1,000) (Cell Signaling), mouse GAPDH (1:500) (Millipore), mouse β-actin (1:1,000) (Thermo Scientific), GSK3B (1:1,000) (Cell Signaling), GFP (1:1,000) (Abcam), and mouse phospho-GSK3 (Y279,216) (1:1,000) (Merck; Millipore).
Statistical analysis
Data are shown as mean, including standard deviation. Student's t-test (paired, two-tailed) was used to compare data within two groups. P values were calculated by Excel (Microsoft).
Results
BMI1 protein levels increase during osteogenic differentiation of hASCs
To analyze the role of BMI1 during osteogenic differentiation, we cultured hASCs in odM and assessed BMI1 protein and BMI1 RNA levels (Fig. 1A, B). Compared with hASCs cultured in basal medium (bM), which maintains cells in an undifferentiated state, BMI1 levels in odM increased 2-fold at day 7 and 14 of culture. At day 21 BMI1 levels remained elevated in odM, however, BMI1 levels in hASCs were also elevated at this time point (Fig. 1A). The increased BMI1 protein levels were not paralleled by increased BMI1-RNA levels (Fig. 1B).
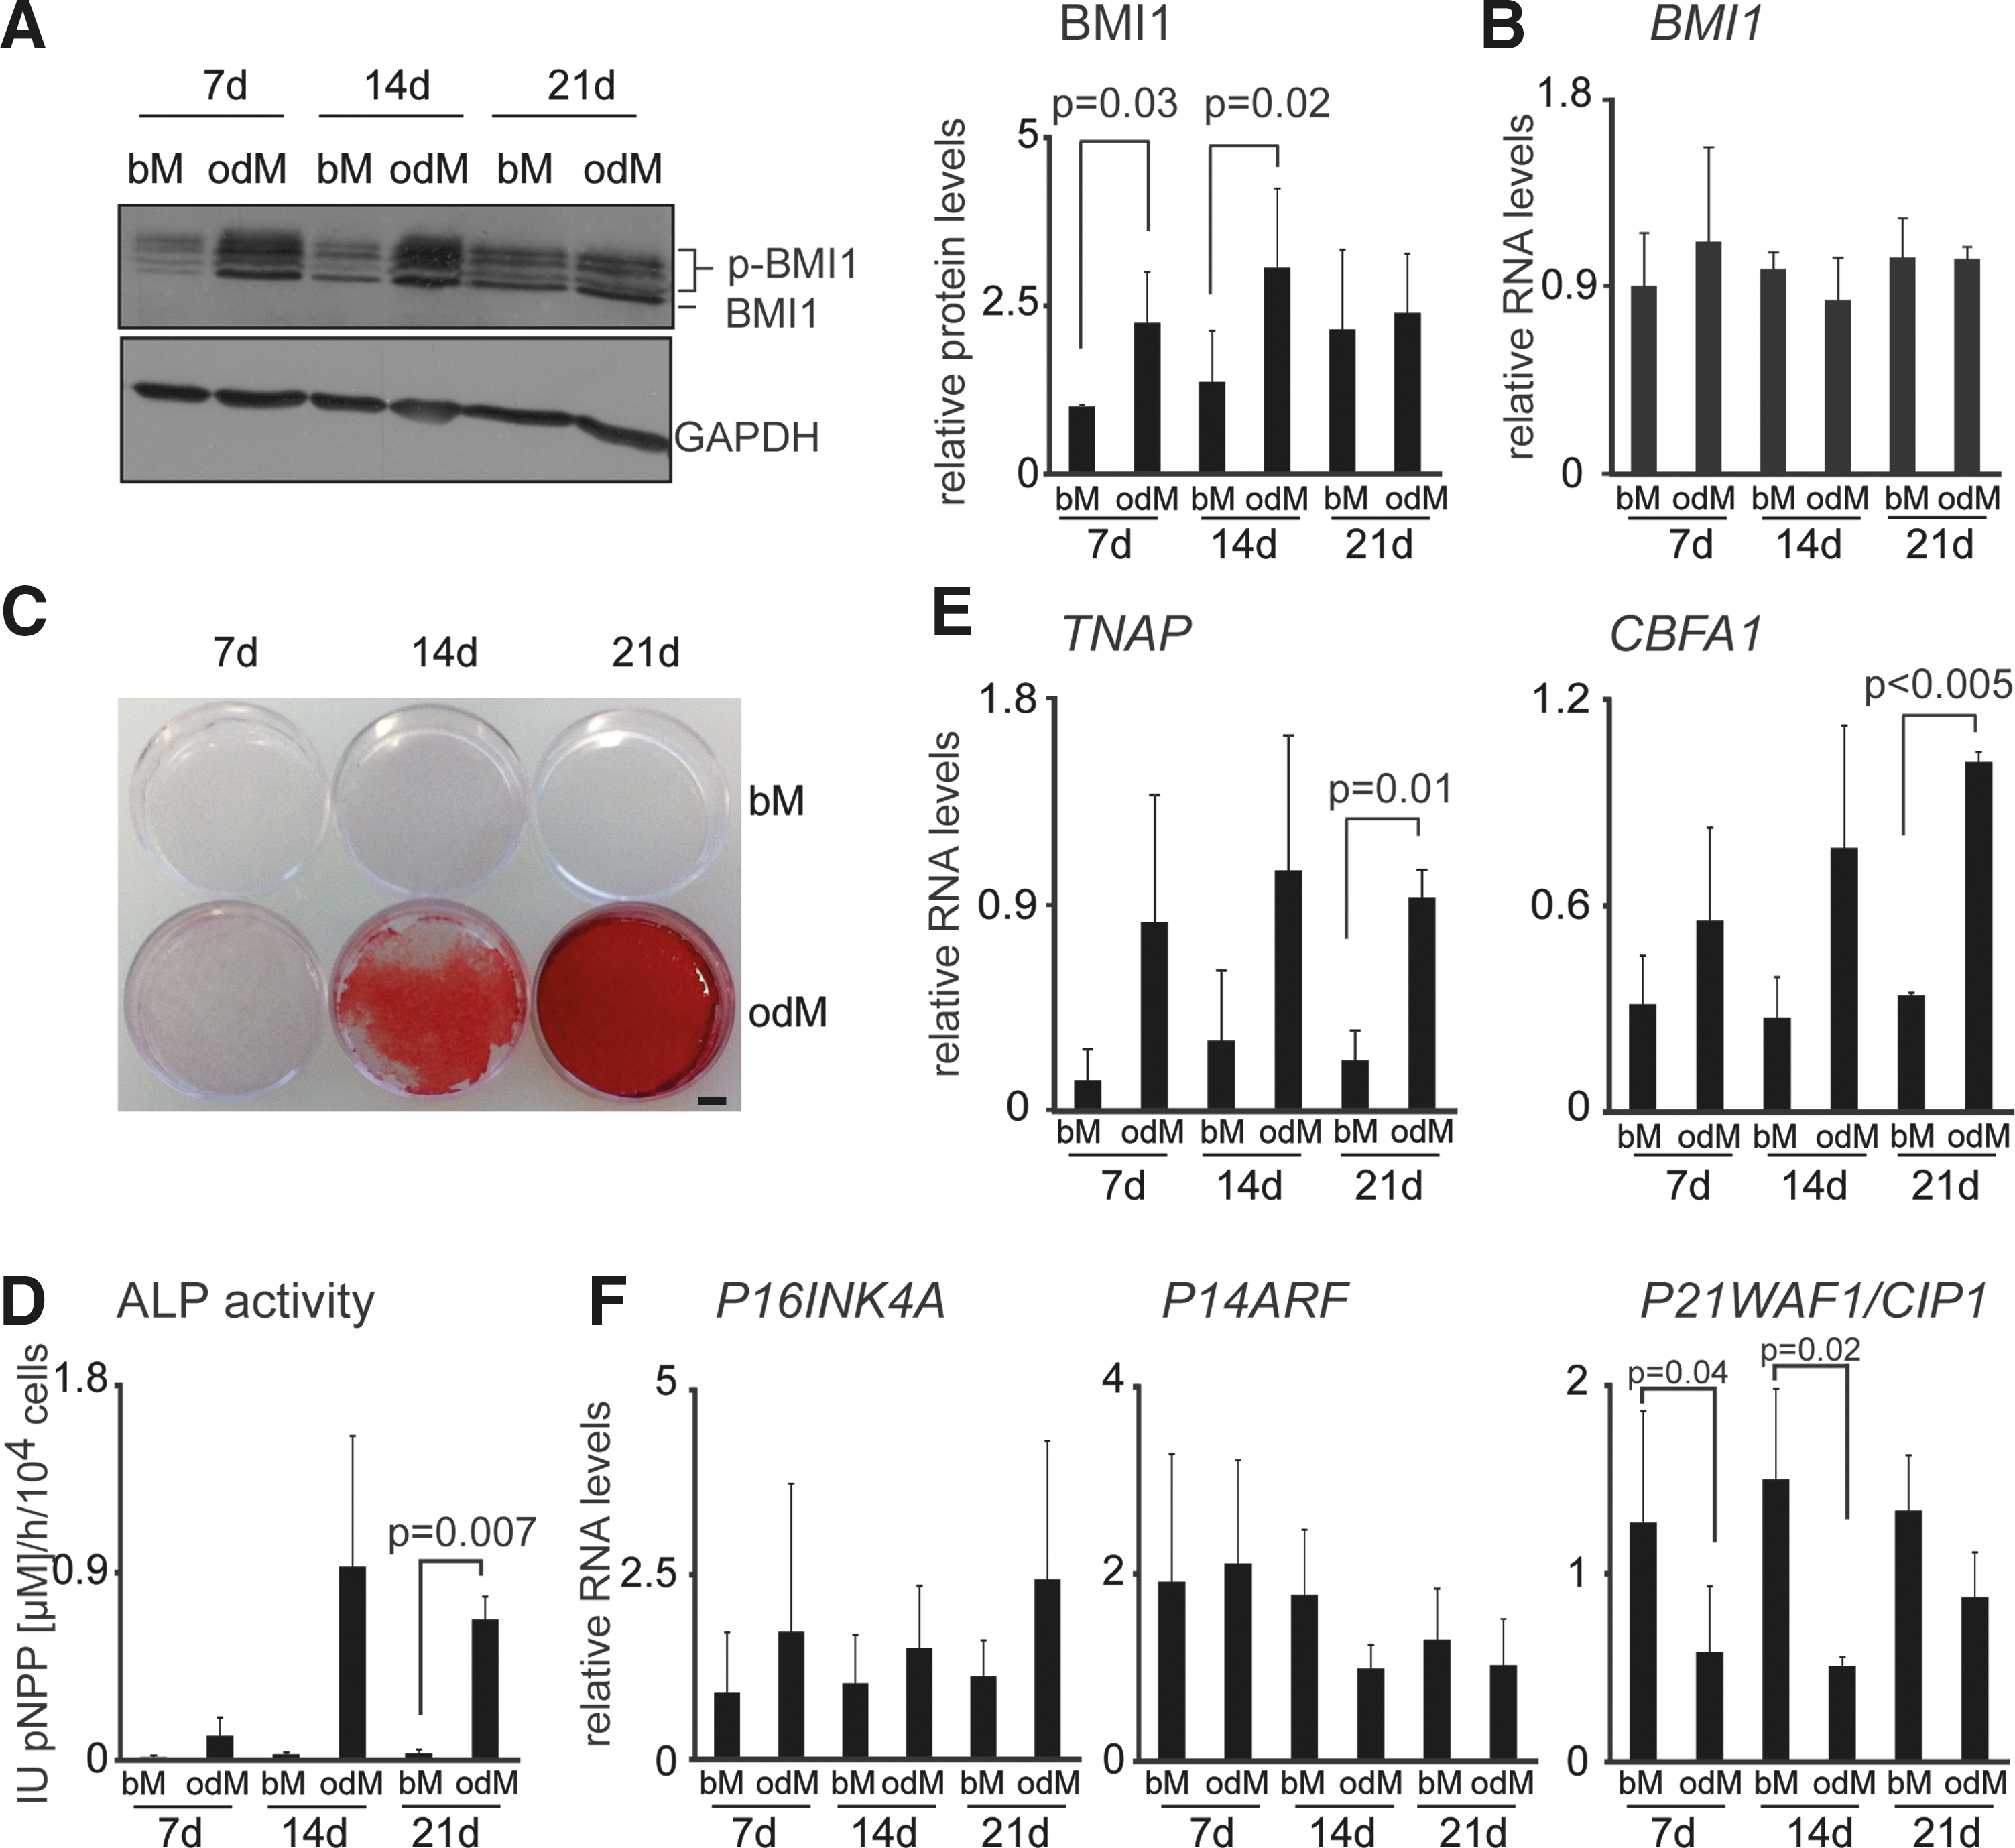
BMI1 protein levels increase during osteogenic differentiation of hASCs.
BMI1 is a phosphorylated protein [39
–41], which migrates as two or more bands, the lower band represents the hypophosphorylated form and the upper bands the hyperphosphorylated form of BMI1. Recently, we reported a link between BMI1 phosphorylation and increased BMI1 protein levels downstream of MAPK signaling in mouse [39]. Therefore, we determined the ratio of phosphorylated versus nonphosphorylated BMI1 levels in bM- versus odM-cultured hASCs. This analysis revealed constant pBMI1/BMI1 ratios independent of culture conditions consistent with a lack of preferential phosphorylation of BMI1 during osteogenic differentiation (Supplementary Fig. S1; Supplementary Data are available online at
Osteogenic differentiation of hASCs is associated with matrix mineralization and expression of osteogenic markers such as tissue nonspecific alkaline phosphatase (TNAP) and CBFA1 [2]. We confirmed that during hASC differentiation in odM cells displayed increased mineralization of the extracellular matrix, ALP activity, and expression of bone-specific markers such as TNAP and CBFA1 (Fig. 1C–E). By contrast, RNA expression levels of the BMI1 target genes P16INK4A and P14ARF remained constant, whereas the P21WAF1/CIP1 expression levels were reduced at days 7 and 14 of differentiation (Fig. 1F).
Together, these data show that BMI1 protein, but not RNA levels, are increased during osteogenic differentiation of hASC.
BMI1 overexpression increases osteogenic differentiation
As BMI1 protein levels were elevated during osteogenic differentiation, we investigated the consequence of BMI1 overexpression on osteogenic differentiation of hASCs. Mouse and human BMI1 are highly structurally conserved and mouse BMI1 can fully replace human BMI1 [42,43]. We, therefore, retrovirally overexpressed murine Bmi1 in hASCs before osteogenic differentiation. Empty vector pEGZ-transduced hASCs were compared with cells transduced with a construct encoding the Bmi1 cDNA (pEGZ-Bmi1). Figure 2A and Supplementary Figure S2A show that pEGZ-Bmi1-transduced cells overexpress transgene-derived murine BMI1 at both the protein and RNA levels, whereas human BMI1 expression levels stayed constant.
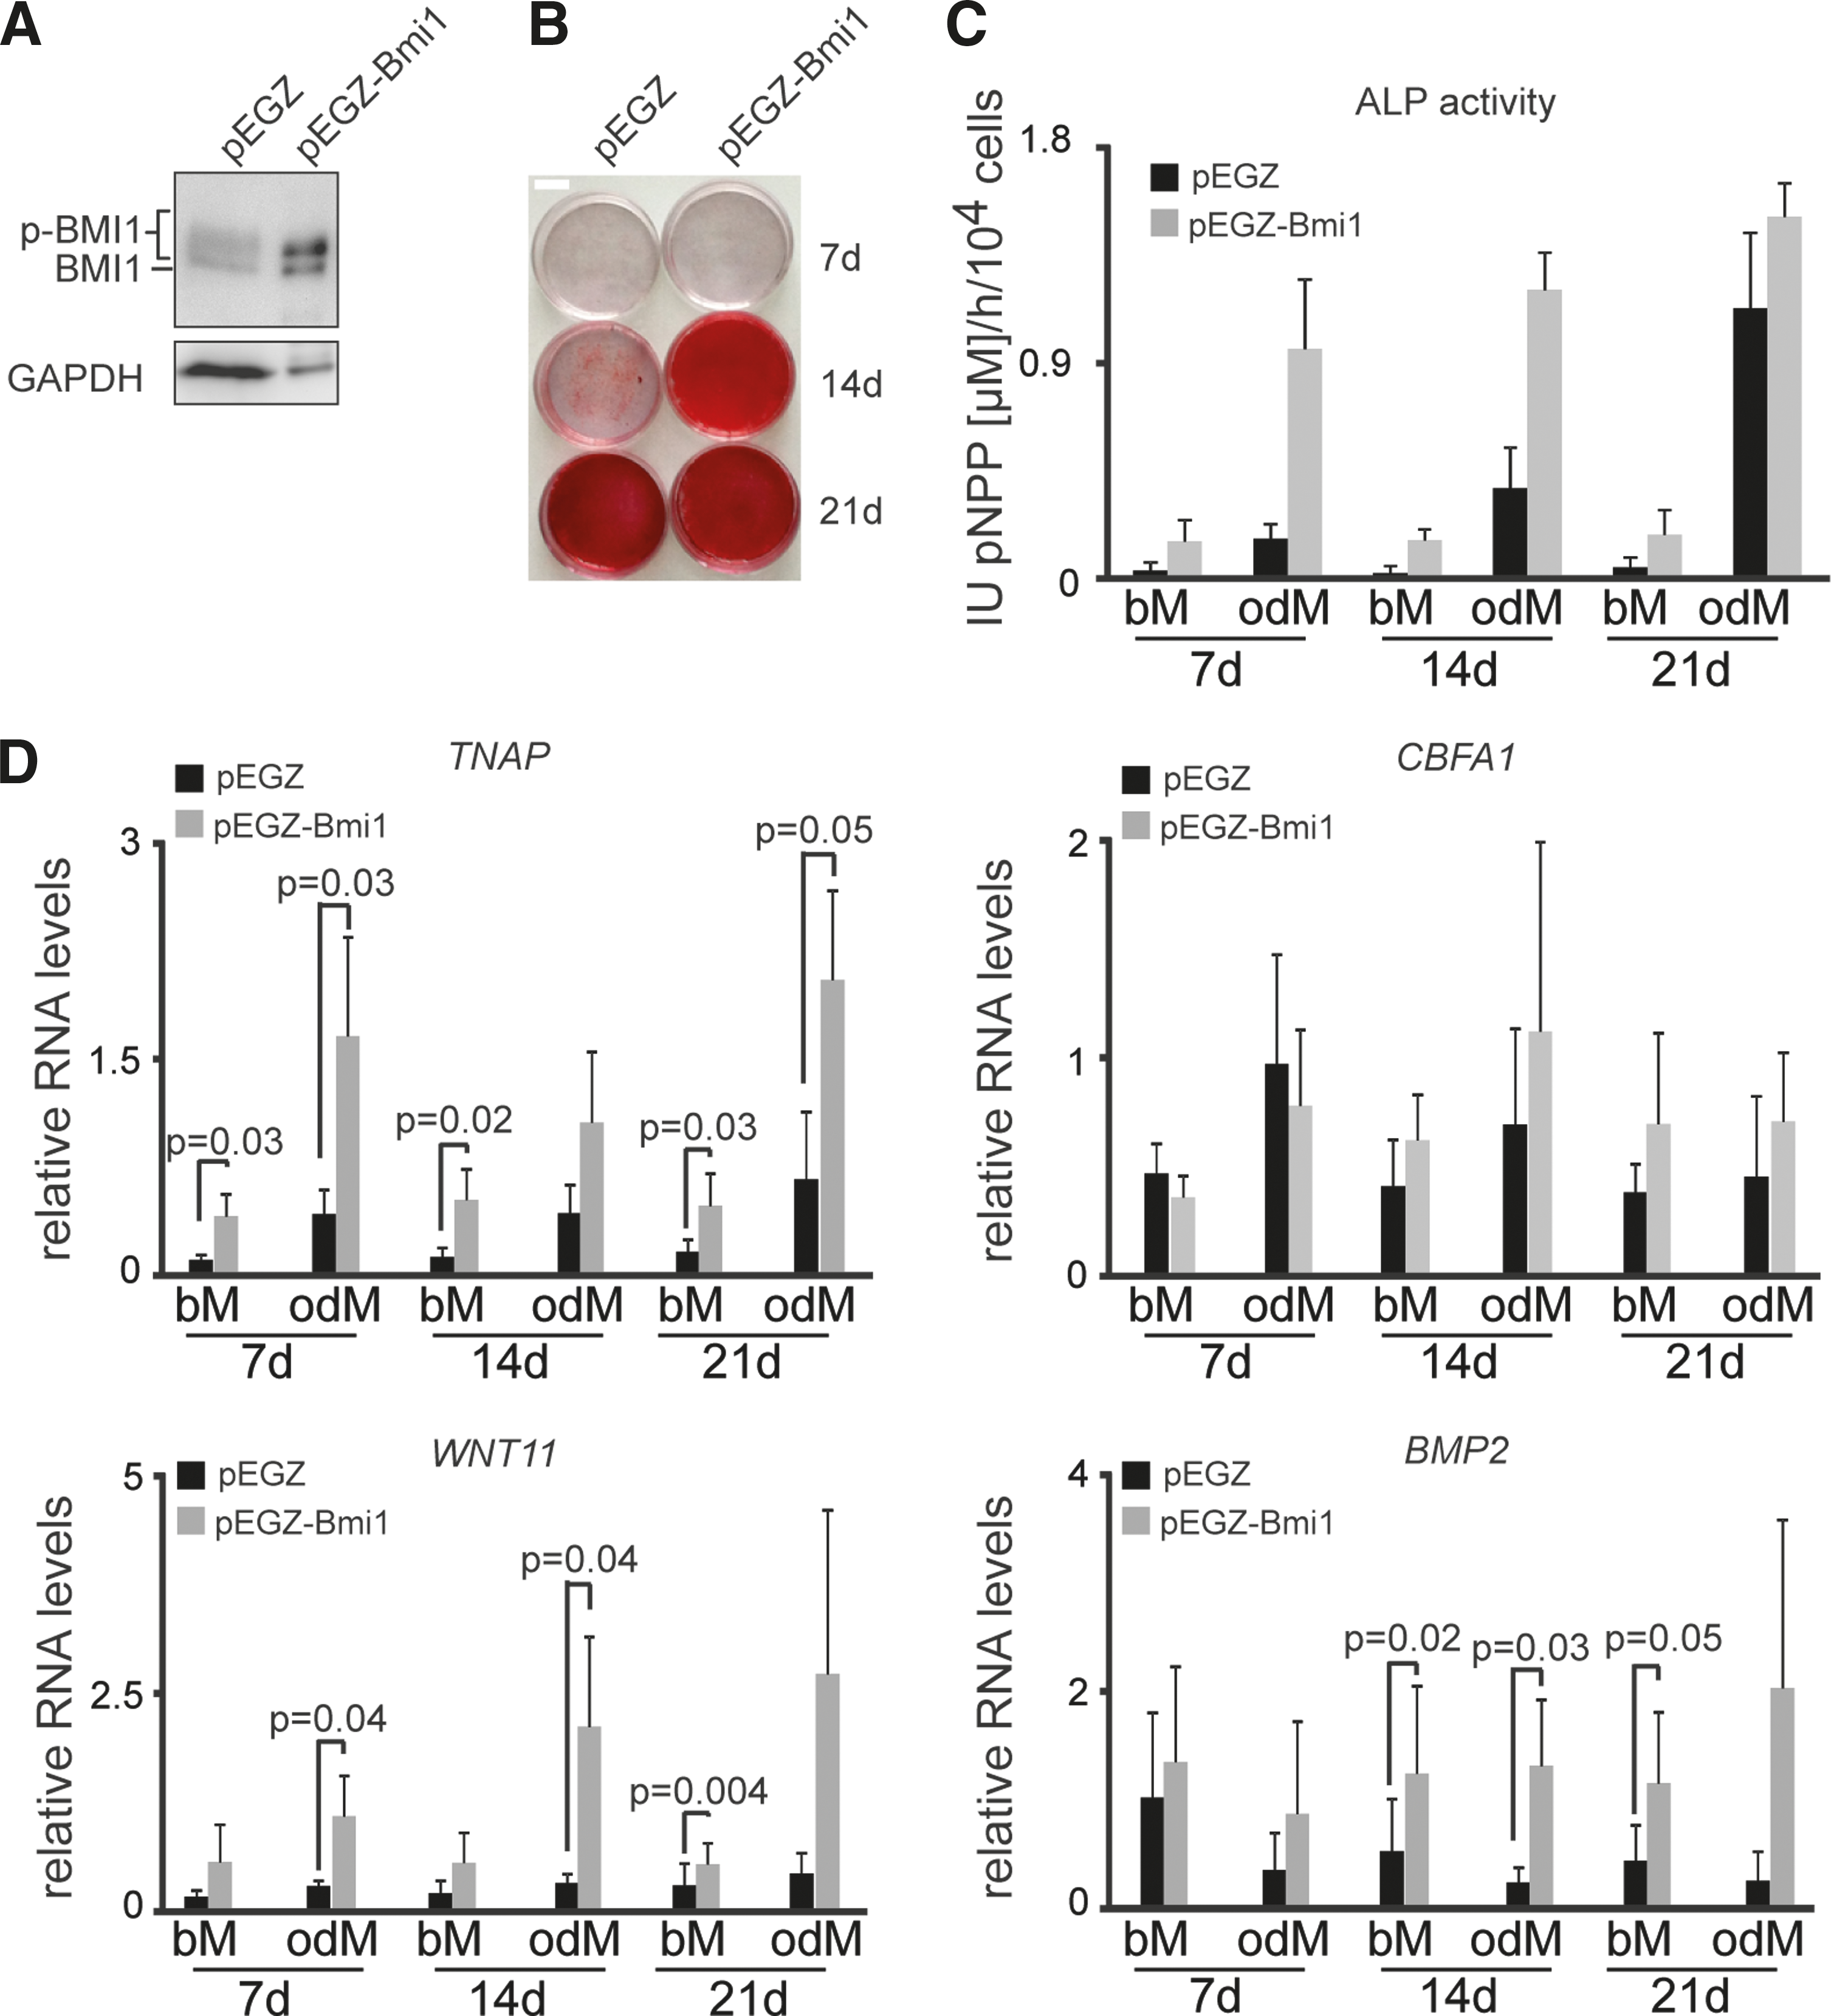
Overexpression of BMI1 enhances osteogenic differentiation.
To test if BMI1 overexpression also affects osteogenic differentiation of bM-cultured cells, we analyzed bM- and odM-cultured cells in parallel. Compared to pEGZ-transduced cells, pEGZ-Bmi1-transduced cells displayed increased Alizarin Red staining at day 14 of odM culture, indicative of enhanced osteogenic matrix formation (Fig. 2B). In agreement with this, ALP activity was elevated in pEGZ-Bmi1-transduced cells (Fig. 2C). ALP activity and TNAP expression were also increased in bM-cultured pEGZ-Bmi1 cells although not to the same extend as in odM-cultured cells (Fig. 2C, D). These results indicate an osteogenic priming of undifferentiated hACS upon BMI1 overexpression.
As CBFA1 expression is elevated under conditions that enhance osteogenic differentiation [44], we analyzed the expression of the pro-osteogenic regulator CBFA1. In contrast to what was expected, we did not observe differential expression of CBFA1 between pEGZ- with pEGZ-Bmi1 cells (Fig. 2D, right top graph).
As BMI1 regulates components of the WNT pathway, in part, through the negative regulation of the dickkopf WNT signaling pathway inhibitor 1 (DKK1) [26,45], we assessed the expression of DKK1 and WNT members WNT5A, B, and WNT11, which are involved in osteogenic differentiation [14]. Compared with control-transduced hASCs, neither DKK1 nor WNT5A or WNT5B were altered upon BMI1 overexpression (Supplementary Fig. S2B). By contrast, WNT11 mRNA levels were elevated in cells overexpressing BMI1 (Fig. 2D). Similar to TNAP, WNT11 expression was increased in both bM- and odM-cultured cells. As BMP2 cooperates with WNT11 to promote osteoblast differentiation [46], we analyzed BMP2 expression and found that similar to TNAP and WNT11, BMP2 levels were also elevated in bM- and odM-cultured pEGZ-Bmi1 cells (Fig. 2D).
Although originally classified as a noncanonical WNT [47], WNT11 has also been shown to activate the canonical WNT pathway [48]. We, therefore, looked to see if canonical WNT pathway target genes were differentially regulated in BMI1 overexpressing hASCs. We analyzed AXIN2, BMP4, and Osteoprotegerin (OPG) expression, which have previously been shown to be upregulated upon WNT pathway activation [49 –51], and OC, which is downregulated upon WNT activation [52]. As shown in Supplementary Fig. S2C, AXIN2 and BMP4 expressions were increased, whereas OPG and OC levels were unchanged.
Finally, as BMI1 is a repressor of the INK4A locus, we analyzed the expression of P16INK4A, P14ARF, and P21WAF1/CIP1, and noted no downregulation of these cell cycle regulators upon BMI1 overexpression (Supplementary Fig. S2D).
In conclusion, the results indicate that BMI1 overexpression primes hASCs for osteogenic differentiation potentially through upregulation of WNT11 and BMP2.
BMI1 knockdown attenuates osteogenic differentiation
In addition to the effects of BMI1 overexpression, the consequences of KD of BMI1 expression were assessed. As shown in Fig. 3A, retroviral shRNA-mediated BMI1 KD was evident at day 21 of osteogenic differentiation. Alizarin Red staining (Fig. 3B) indicated reduced mineralization of BMI1 KD (shBMI_3) hASCs at day 14 of differentiation when compared with cells transduced with a scrambled control (shScr) shRNA vector. In agreement with an attenuation of osteogenic differentiation, ALP activity in odM-cultured BMI1 KD hASC was reduced (Fig. 3C). Expression of a second independent BMI1-specific shRNA sequence (shBMI1_2) also reduced BMI1 expression and caused reduced mineralization and ALP activity in odM-cultured hASCs (Supplementary Fig. S3A–D).

Knockdown of BMI1 expression attenuates osteogenic differentiation.
In agreement with a BMI1-independent expression of DKK1 in BMI1KD cells, the expression of WNT5A or WNT5B was unaffected as were P16INK4A, P14ARF, and P21WAF1/CIP1 levels (Supplementary Fig. S4A, B). Despite the reduced matrix mineralization and ALP activity, expression of TNAP, CBFA1, WNT11, and BMP2 remained unaltered in BMI1 KD cells (Fig. 3D) indicating that BMI1 KD did not affect transcription of these osteogenic markers.
Together, these data reveal that BMI1 KD reduced some features of osteogenic differentiation of hASCs, such as matrix mineralization, whereas the expression of osteogenic marker genes was unaffected.
BMI1 is a downstream target of GSK3 signaling during osteogenic differentiation
The results so far show that during osteogenic differentiation, BMI1 protein levels were upregulated and that modulation of BMI1 levels affected the osteogenic differentiation of hASCs. We, therefore, asked which pathway regulates BMI1. In contrast to a previously reported negative regulatory function of GSK3 signaling in the osteogenic differentiation of human bone marrow MSCs [17], the pathway has been recently reported to stimulate osteogenic differentiation of murine ASCs [18] and pharmacological inhibition of GSK3 reduces osteogenic differentiation of murine and hASCs [18,19]. Furthermore, in glioblastoma cells BMI1 is a potential downstream target of GSK3 [53] and both Bmi1 and Gsk3 are coregulated at the transcriptional level during murine osteogenic cell differentiation [54].
To assess GSK3 activity during differentiation, we performed western blot analyses with phospho-specific antibodies that recognize the active forms of GSK3A (Y279) and GSK3B (Y216) (p-GSK3) and GSK3-mediated phosphorylation of β-catenin (p-β-catenin (S33, S37, T41)). In addition, we monitored the expression of total β-catenin and total GSK3B. A representative example of these analyses is shown in Fig. 4A. Quantification reveals that, in parallel to the elevated BMI1 protein levels in odM-cultured hASCs, phosphorylation of GSK3A and GSK3B and of the GSK3 target sites in β-catenin increased at days 7 and 14 of odM culture (Fig. 4B). Elevated levels of phosphorylated GSK3A and GSK3B persisted to day 21 of odM culture. By contrast, p-β-catenin (S33, 37, T41) levels were reduced at this time point (Fig. 4B). Total GSK3B levels were mildly elevated in odM-treated cells.

GSK3 activity during osteogenic differentiation.
Despite the increased p-β-catenin (S33, 37, T41) levels at days 7 and 14, total β-catenin levels remained constant in bM- and odM-cultured hASCs. Recent literature indicates that phosphorylation of β-catenin at S675 by the mitogen protein kinase kinase kinase 2 (MEKK2) is important for its activity and stability during murine osteogenesis [55]. We, therefore, also analyzed p-β-catenin (S675) levels of hASCs cultured in bM or odM. Figure 4A shows that p-β-catenin (S675) increased at day 7 of odM culture. At day 14 p-β-catenin (S675) was increased in both bM and odM-cultured cells. By contrast, and similar to the p-β-catenin (S33, S37, T41) levels, p-β-catenin (S675) levels were strongly reduced at day 21 of odM culture. Together, these data reveal a complex regulatory network targeting β-catenin during osteogenic differentiation of hASCs and further indicate that BMI1 levels and active GSK3A and GSK3B coincide during osteogenic differentiation.
To assess whether inhibition of GSK3A and GSK3B affects BMI1 levels and osteogenic differentiation, we pharmacologically inhibited GSK3 using the selective GSK3 inhibitor Chir99021 (Chir) [37]. As shown in Fig. 5A, Chir treatment strongly reduced matrix mineralization as assessed by Alizarin Red staining. In agreement with attenuated osteogenic differentiation upon Chir treatment, ALP activity was abrogated (Fig. 5B).
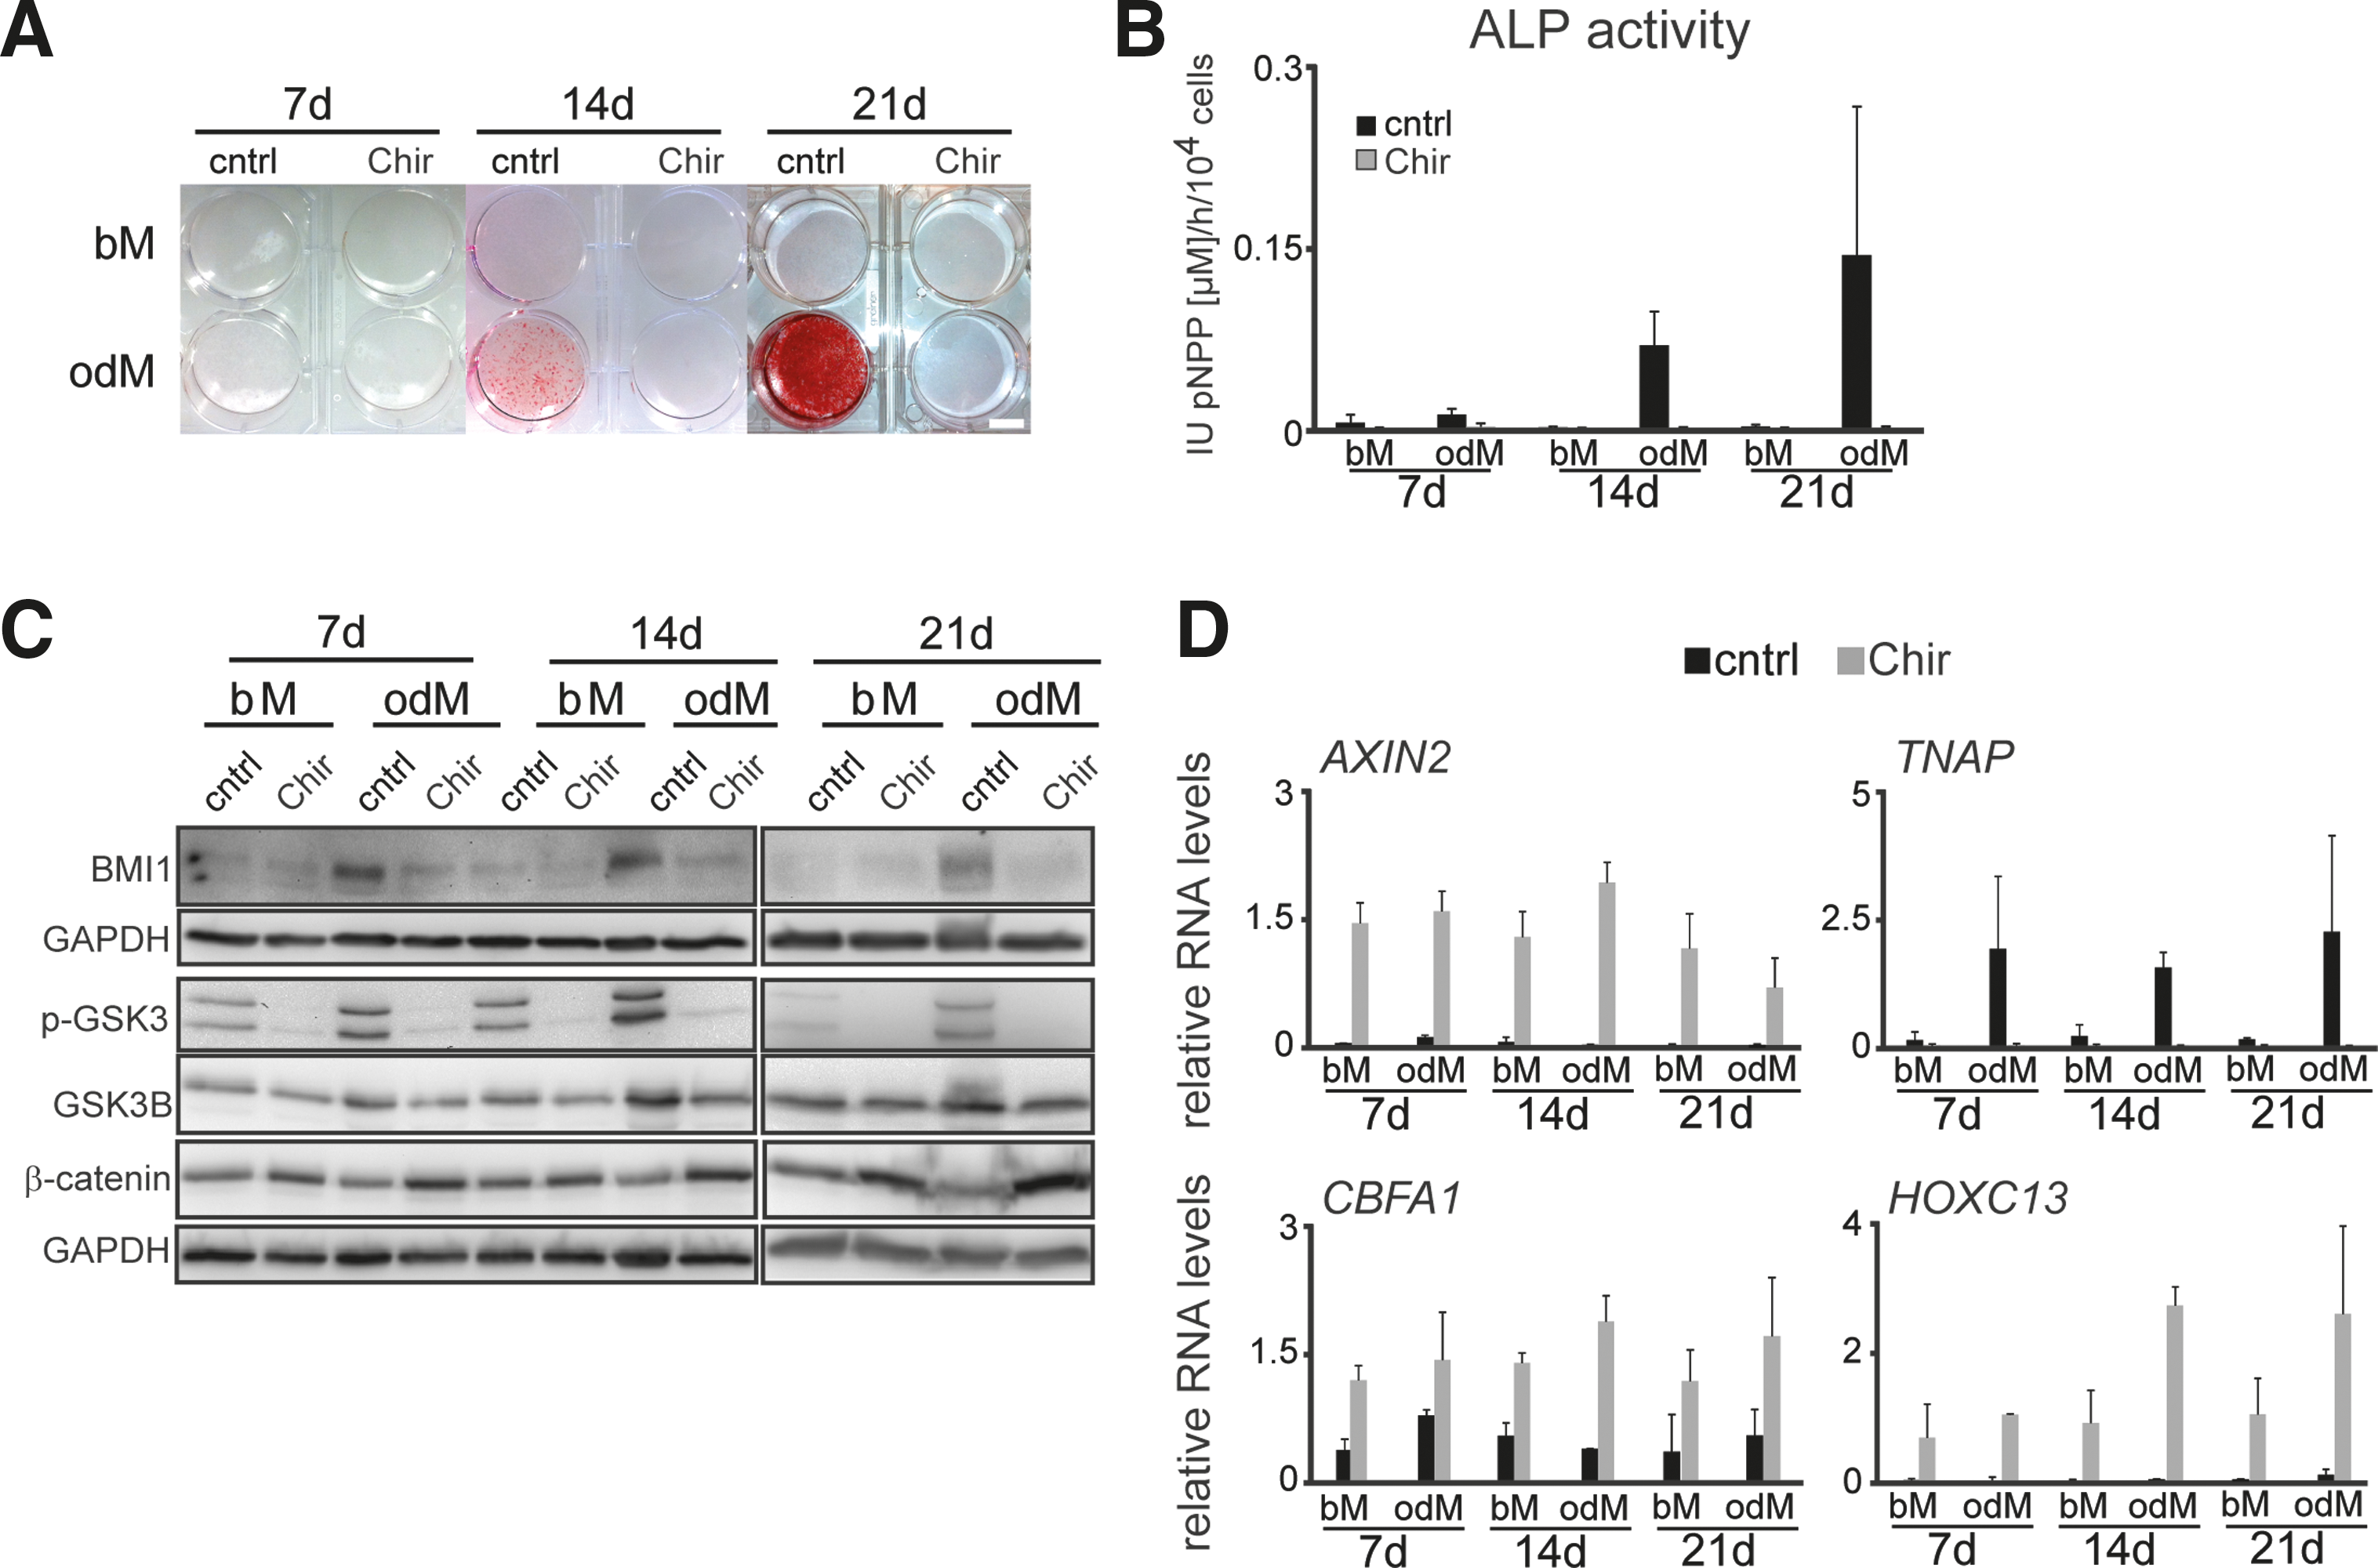
GSK3 inhibition during osteogenic differentiation reduces BMI1 levels and attenuates matrix mineralization, TNAP expression, and ALP activity.
As Chir treatment affected osteogenic differentiation, we asked if Chir treatment decreased BMI1 protein levels. As shown in Fig. 5C and quantified in Supplementary Fig. S5A, Chir treatment of hASCs reduced BMI1 levels at day 7, 14, and 21 of odM culture. To confirm Chir-mediated inhibition of GSK3, we analyzed the GSK3 phosphorylation status and β-catenin expression by western blot analysis. As expected, upon GSK3 inhibition p-GSK3 levels were reduced in bM and odM cultured hASCs (Fig. 5C). Conversely, β-catenin levels increased.
We also assessed if expression of the β-catenin target gene AXIN2 and expression of osteogenic marker genes changed in response to Chir treatment. In agreement with increased β-catenin levels, AXIN2 levels were increased in bM- and odM-treated hASCs (Fig. 5D). Furthermore, we observed reduced TNAP transcript levels, which is consistent with low ALP activity. In contrast to reduced TNAP expression, which is indicative of attenuated osteogenic differentiation, CBFA1 expression was increased upon GSK3 inhibition in odM- and bM-cultured hASCs (Fig. 5D).
HOXC13, a direct BMI1 target gene [56], which is expressed during osteogenic differentiation of hMSCs [57], was also transcriptionally upregulated (Fig. 5D). These results are consistent with a derepression of HOXC13 as a consequence of reduced BMI1 expression during osteogenic differentiation. Also, we noted that while the expression of BMI1, P16INK4A, and P14ARF remained unaffected under Chir treatment, the downregulation of P21WAF/CIP1 in odM culture was not observed upon Chir treatment (Supplementary Fig. S5B). This indicates a selective effect of Chir on P21WAF/CIP1 expression independent of BMI1, P16INK4A, or P14ARF.
Together, these data show that BMI1 is a downstream target of GSK3 signaling. The increased CBFA1, HOXC13 expression along with reduced matrix mineralization, TNAP expression and ALP activity under Chir treatment indicates that osteogenic differentiation is not fully executed upon GSK3 inhibition.
Discussion
In this study, we have analyzed BMI1 expression and function in hASCs. We found that differentiating hASCs upregulate BMI1 at the protein level. BMI1 overexpression in hASCs cultured under expansion conditions resulted in the upregulation of osteogenic markers. Culture of BMI1 overexpressing cells under osteogenic differentiation conditions increased matrix mineralization and osteogenic marker expression. Conversely, knockdown of BMI1 attenuated osteogenic differentiation. Furthermore, by employing specific small-molecule inhibitors, we identified GSK3 signaling as an upstream regulator of BMI1 in hASCs that is necessary for osteogenic differentiation.
Previous work indicates a role for the PRC1 component BMI1 in murine osteogenesis as osteogenic differentiation of MSCs in Bmi1 knockout mice was reduced at the expense of adipogenic differentiation, indicating a pro-osteogenic role for BMI1 in this system [22]. Conversely, the PRC2 core component EZH2 suppresses the osteogenic differentiation of hMSCs downstream of CDK1 signaling [21]. Our data are consistent with a pro-osteogenic function of BMI1 in hASCs. Together, these data suggest opposing functions for PRC1 and PRC2 during osteogenic differentiation.
Opposing roles for PRC1 and PRC2 have also been reported in hematopoietic stem and progenitor cells [58]. The molecular networks downstream of PRC1 and PRC2 differed in hematopoietic stem and progenitor cells. Thus, it will be interesting to elucidate which transcriptional networks are targeted by PRC1 and PRC2 in hASCs and, if the situation is similar to the hematopoietic system, whether these networks differ.
In our study, we have observed that, compared with protein levels in undifferentiated hASCs BMI1, protein levels increased as early as day 7 of osteogenic differentiation. At this time point, ALP activity, matrix mineralization, and expression of the CBFA1 remained low. Therefore, BMI1 may affect early stages of osteogenic differentiation. Furthermore, a role for BMI1 in early lineage determination is consistent with the observation that BMI1 overexpression caused increased expression of TNAP, WNT11, and BMP2 in nondifferentiating culture conditions, indicating that BMI1 overexpression alone primes hASCs for differentiation along the osteogenic lineage. This is reminiscent of analyses showing that BMI1 overexpression promotes hematopoietic cell development from embryonic stem cells [59].
Thus, depending on the cellular context and differentiation stage, BMI1 acts as a mesohematopoietic (ESCs) or an osteogenic inducer (hASCs). WNT11 and BMP2 cooperate in augmenting osteoblastic differentiation of MC3T3 E1 preosteoblasts [46]. A similar mechanism may also lead to increased osteogenic differentiation of hASCs. The activity of WNT11 as a canonical or noncanonical WNT is cell context-dependent [48].
Our analyses show that some canonical WNT targets (AXIN2 and BMP4) were upregulated in response to BMI1 overexpression, however, expression of other targets such as OPG, OC, or CBFA1 remained largely unchanged. WNT11 may, therefore, act on a subset of canonical WNT targets in hASCs. BMP2 functions by activating and targeting the CBFA1 protein to the nucleus [60]. Therefore, a pro-osteogenic effect of BMP2 upon BMI1 overexpression may involve nuclear targeting of CBFA1. Future work will show whether the subcellular localization of CBFA1 is altered in cells overexpressing BMI1.
We conclude that the concomitant upregulation of WNT11 and BMP2 in BMI1 overexpressing hASCs may cooperate to augment osteogenic differentiation by targeting pro-osteogenic factors at transcriptional or posttranscriptional levels.
Although BMI1 is a repressor of the INK4A locus in various stem cell types [61 –63], the increase in BMI1 levels during osteogenic hASC differentiation was not paralleled by altered P14ARF or P16INK4A expression. This observation is surprising and it indicates that the BMI1 level reached during osteogenic differentiation may not affect P16INK4A/P14ARF expression. Alternatively, BMI1 may not target P16INK4A/P14ARF in hASCs under osteogenic conditions. We did, however, observe reduced expression of P21WAF1/CIP1 at days 7 and 14 of osteogenic differentiation. In hMSCs, P21WAF1/CIP1 expression negatively regulates proliferation and osteogenic differentiation [64], and BMI1 directly represses P21WAF1/CIP1 expression in cerebellar granule cell progenitors [65].
Therefore, direct regulation of P21WAF1/CIP1 by BMI1 could potentially explain the reduced P21WAF1/CIP1 expression levels during osteogenic differentiation. Our analyses suggest that P21WAF1/CIP1 expression is independent of BMI1 as BMI1 overexpression or BMI1 KD did not affect P21WAF1/CIP1 expression, arguing for a BMI1-independent regulation of P21WAF1/CIP1 in hASCs. In addition, under BMI1 overexpression or KD, P14ARF or P16INK4A levels remained unaffected. These results are in contrast to Zhang et al. [22], who reported increased p19ARF and p16INK4A in MSCs isolated from Bmi1 knockout mice. However, our results are consistent with previous reports showing a P16INK4A/P14ARF-independent mechanism of BMI1 in human cancer cells [66 –68] and point to a cell context-dependent BMI1 function in the regulation of P16INK4A/P14ARF expression.
Various signaling pathways regulate BMI1 expression [45,69]. One study in human breast cancer cell lines identified BMI1 as a downstream target of WNT signaling. In this analysis, expression of BMI1 was regulated in a positive feedback loop involving BMI1-mediated downregulation of DKK expression [45]. Our work indicates that DKK1 expression does not change during osteogenic hASC differentiation or following modulation of BMI1 expression levels. In contrast, we identified GSK3 as a regulator of BMI1 expression and osteogenic differentiation. These data may point to a cell type-specific regulatory circuitry involving GSK3 signaling in hASCs.
The role of GSK3 signaling in osteogenic differentiation is complex. While a body of work, including mouse genetic studies, exists that points to an inhibitory function for GSK3 during osteogenic differentiation [17,51] other reports show a pro-osteogenic function of GSK3 signaling [18 –20]. Our work shows that upon GSK3 inhibition, β-catenin levels, CBFA1 and HOXC13 levels increased, which is indicative of augmented osteogenesis. In contrast, we also observed reduced matrix mineralization, reduced TNAP expression, and reduced ALP activity, indicative of attenuated osteogenic differentiation in response to GSK3 inhibition.
We conclude that tight control of GSK3 and its downstream target β-catenin is an essential prerequisite for complete osteogenic differentiation of hASCs.
In agreement with a tight regulation of β-catenin levels during osteogenic hASC differentiation, we show that β-catenin is concomitantly phosphorylated at positions that lead to opposing biological readouts. While phosphorylation of β-catenin at positions S31, 37, and T41 by GSK3 targets it for degradation [16] phosphorylation at S675 by MEKK2 stabilizes β-catenin during osteoblast differentiation [55]. This observation argues for a balanced regulation of β-catenin and further supports the notion that GSK3 activity is important during osteogenic hASC differentiation.
Besides β-catenin, our work further implicates BMI1 as a downstream target of GSK3 in the regulation of osteogenic differentiation. In further support of a function for BMI1 in the regulation of key regulators of osteogenic differentiation is a recent report showing that both BMI1 KD and BMI1 overexpression leads to reduced osteogenic differentiation of bone marrow-derived hMSCs [70]. Whether BMI1 acts downstream of GSK3 signaling in bone marrow-derived hMSCs is, however, not known.
Our observation that BMI1 protein levels are upregulated during osteogenic differentiation downstream of GSK3 without a concomitant increase in BMI1 RNA levels are consistent with the regulation of BMI1 expression at the posttranslational level. Previous reports have described that BMI1 is regulated on the posttranscriptional level, for example, by miRNAs [45,71,72].
Besides miRNAs, the F-box-containing β-transducin repeat-containing protein (β-TrCP), has been shown to regulate ubiquitination and proteasome-mediated degradation of BMI1 in human breast cancer cell lines [73]. β-TrCP is also part of the β-catenin destruction complex [74]. GSK-3-mediated phosphorylation of target sites on β-catenin generates the β-TrCP-binding site, which in turn mediates proteasomal degradation of β-catenin [75]. Of relevance, the β-TrCP-binding site in the BMI1 protein is flanked by a cluster of putative GSK3 target sites. As our analyses identified BMI1 as a target of GSK3 signaling, further analyses will have to show if GSK3 and BMI1 directly interact in hASCs and if β-TrCP-mediated BMI1 degradation is downstream of this regulatory circuitry.
In conclusion, we have identified BMI1 as an important factor for hASC osteogenic differentiation. The modulation of BMI1 protein levels through GSK3 signaling may open a new avenue for regulation of hASC osteogenic differentiation.
Footnotes
Acknowledgments
This work was supported by research funds of the German Federal Ministry of Education and Research (01 GN0943-START-MSC 2) and by the Interdisciplinary Center for Clinical Research of the University of Würzburg (IZKF/D256). The authors thank Dr. Stan Gorski for critical reading and editing of the article.
Author Disclosure Statement
No competing financial interests exist.
References
Supplementary Material
Please find the following supplemental material available below.
For Open Access articles published under a Creative Commons License, all supplemental material carries the same license as the article it is associated with.
For non-Open Access articles published, all supplemental material carries a non-exclusive license, and permission requests for re-use of supplemental material or any part of supplemental material shall be sent directly to the copyright owner as specified in the copyright notice associated with the article.