
Abstract
Induced pluripotent stem cells (iPSCs) have enormous potential in regenerative medicine and disease modeling. It is now felt that clinical trials should be performed with iPSCs derived with nonintegrative constructs. Numerous studies, however, including those describing disease models, are still being published using cells derived from iPSCs generated with integrative constructs. Our experimental work presents the first evidence of spontaneous transgene reactivation in vitro in several cellular types. Our results show that the transgenes were predominantly silent in parent iPSCs, but in mesenchymal and endothelial iPSC derivatives, the transgenes experienced random upregulation of Nanog and c-Myc. Additionally, we provide evidence of spontaneous secondary reprogramming and reversion to pluripotency in mesenchymal stem cells derived from iPSCs. These findings strongly suggest that the studies, which use cellular products derived from iPSCs generated with retro- or lentiviruses, should be evaluated with consideration of the possibility of transgene reactivation. The in vitro model described here provides insight into the earliest events of culture transformation and suggests the hypothesis that reversion to pluripotency may be responsible for the development of tumors in cell replacement experiments. The main goal of this work, however, is to communicate the possibility of transgene reactivation in retro- or lenti-iPSC derivatives and the associated loss of cellular fidelity in vitro, which may impact the outcomes of disease modeling and related experimentation.
Introduction
H
Nevertheless, c-Myc transgene expression was detected in tumors of iPSC-derived chimeric mice [8]. The tumor-forming propensity varied between strains of chimeric mice and may have no correlation with tumorigenic risks of iPSC-based cell therapy in humans due to different species-specific mechanisms underlying tumor formation [9]. In contrast, neither c-Myc reactivation nor tumor formation was observed in chimeric pigs produced from iPSCs [10]. With lower efficiency outcomes, it appeared to be possible to avoid c-Myc in a reprogramming cocktail during generation of iPSCs [11]. Still, a recent study demonstrated tumor development after transplantation of neurospheres derived from iPSCs produced without c-Myc. Oct4 transgene reactivation was detected in this case [12]. The observation of transgene reactivation in iPSC-derived tumors is quite surprising since the opposite event, transgene silencing, typically occurs during embryonic stem cell differentiation [13 –15]. The particular pattern of transgene reactivation is unclear, and the earliest events of tumor initiation eluded investigation due to the lack of in vitro models.
We discovered the phenomenon of appearance of pluripotent colonies in one mesenchymal stem cell line (iMSC-DS), which was differentiated from Down syndrome iPSCs (iPSC-DS), and have shown that pluripotent transgene reactivation preceded the reversion to pluripotency. To further study this phenomenon, we analyzed two iPSC lines: iPSC-DS and iPSCs from a healthy adult (iPSC-WT). Both cell lines were established and handled in similar conditions. These iPSC lines were differentiated into iMSCs and endothelial (vascular) cells (iEC). We discovered that the reversion to pluripotency was associated with profound upregulation of Nanog (257-fold) and c-Myc (112-fold) in the MSC derivatives of the iPSC-DS line. The observed reactivation of Nanog (66-fold) in MSC derivatives of the iPSC-WT line, however, did not initiate a reversion to pluripotency.
Our work presents the first evidence of transgene reactivation in vitro in a differentiated cell type, which led to changes in cellular phenotype associated with spontaneous secondary reprogramming (reversion to pluripotency). Although a limited number of cell lines and their derivatives were included in the study, there is a strong possibility that reversion to pluripotency and transgene reactivation have a wider occurrence. Therefore, we believe that transgene reactivation should be assayed in publications communicating the results of studies that used differentiated derivatives.
Materials and Methods
iPSC derivation
The iPSC-WT cell line was derived from MRC-5 fibroblasts (ATCC), and the iPSC-DS clones were derived from AG06872 fibroblasts (Coriell). The fibroblasts were transduced with retroviral vectors (pMXs-cMyc, pMXs-Nanog, pMXs-hOct3-4, and pMXs-Sox2; Addgene) to overexpress Oct4, Sox2, Nanog, and c-Myc transgenes. The retroviral vectors were produced by transient transfection of 293T cells. Following this, the fibroblasts were incubated for 4 h in the viral supernatants containing 5 μg/mL polybrene (Sigma). The transduced cells were then incubated for 3 weeks until development of the pluripotent clones. After isolation, the clones were grown in StemPro medium (Invitrogen) on a Matrigel® substrate (BD Biosciences). The cultures were split mechanically using the StemPro EZ Passage tool (Invitrogen).
Mesenchymal cell derivation (iMSC) by differentiation of iPSCs
Protocol 1
Adapted from Boyd et al. [16], the following protocol was used to derive the iMSC1 line that underwent secondary reprogramming. To differentiate the iPSC-DS cell line into MSCs, hESC culture medium containing knockout DMEM (Invitrogen), 20% knockout serum replacement,
Protocol 2
The following protocol was used to derive the iMSC2 cell lines from iPSC-DS (iMSC2-DS) and iPSC-WT (iMSC2-WT). Initially proposed by Vodyanik et al. [17,18], protocol 2 is based on a novel method of iPSC mesenchymal differentiation that requires isolation of a multipotential progenitor at the mesenchymoangioblast stage. For mesendodermal induction, iPSCs at passage 30 were cocultured with OP9 stromal cells. Primitive streak/mesendoderm precursors, which express apelin receptor (APLNR+) [19], were isolated via MACS sorting on day 2 of OP9 coculture. APLNR-APC antibodies and Anti-APC MicroBeads were used (Miltenyi Biotec).
The isolated APLNR+ progenitors were plated as single cells in semisolid colony-forming serum-free medium (CF-SFM) containing 40% ES-Cult M3120 methylcellulose, 25% serum-free expansion medium (SFEM; Stem Cell Technology), 10% BIT 9500 supplement, and other additives. After 2 weeks, the mesenchymal colony-forming units (MS-CFU) were manually picked, and the iMSC2 cells were transferred to an adherent culture and maintained in EGM-2 medium (Lonza).
Endothelial differentiation of iPSCs (iEC derivation)
Endothelial iEC-DS and iEC-WT lines were established from iPSC-DS at passage 32 and iPSC-WT at passage 23. We optimized a monolayer iPSC induction protocol for iEC derivation. The cells were initially grown on Matrigel-coated culture dishes in mTeSR1 medium. Induction medium containing CHIR 99021 (Stem Cell Technologies) was added to the culture to induce differentiation. CD31+CD144+ vascular progenitor cells were isolated on day 6 of differentiation via positive selection of CD144+ cells on a magnetic column (Miltenyi Biotec). The endothelial potential of iEC was evaluated using the following assays: immunostaining for von Willebrand factor (vWF), a tube formation assay, and via acetylated low-density lipoprotein (Ac-LDL) uptake. vWF expression was confirmed by iEC staining using a primary anti-hvWF A2 antibody (R&D Systems) and the appropriate secondary antibody (Alexa Fluor).
For the tube formation assay, isolated CD144+ iEC were seeded at a density of 4.5 × 10⁴ cells per well onto a 12-well plate coated with Matrigel (BD Biosciences). The cells were incubated in VascuLife medium overnight at 37°C in 5% CO2. On the following day, tube networks were visualized under a light microscope. Using a commercial kit (Biomedical Technologies), Ac-LDL uptake was performed in accordance with the manufacturer's instructions. iEC were seeded at a density of 2.5 × 10⁵ cells per well onto a 0.1% gelatin (Sigma)-coated 6-well plate. Ac-LDL was diluted to 10 μg/mL in complete VascuLife medium (Lifeline Cell Technologies) and added to the cells for 3 h. The cells were then washed with VascuLife medium and analyzed via fluorescent microscopy.
Microscopy
Confocal images were acquired using a Zeiss LSM 510 META laser scanning microscope system (Zeiss, Oberkochen, Germany). By varying the detectors' pinhole width, the observed fluorescence was localized to an area of known tissue thickness, and the field depth of the transmitted DIC images was adjusted. Scale bars were integrated into the image during acquisition. Epifluorescent images were acquired on a Leica DM IRB inverted microscope system (Leica, Germany) equipped with a digital camera Retiga 4000R (Qlmaging, Surrey, Canada), which was controlled with Openlab software version 5.0.2 (Perkin-Elmer, Waltham, MA). Scale bars were calibrated to each objective magnification and added after acquisition. Light microscopy images were acquired with a Nikon D100 (Nikon, Tokyo, Japan) digital SLR camera on a Leica DM IRB inverted microscope.
Immunocytochemistry
The cells were washed with PBS, fixed with 4% paraformaldehyde (PFA) for 5 min, and permeabilized with 0.1% Triton X-100 for the same amount of time. After a 30-min incubation in blocking solution (Protein Block; Dako) at 37°C, the cells were incubated with primary antibodies (1:100) for 1 h at room temperature. The secondary antibody (1:250) incubation time was also 30 min at 37°C. Mounting medium containing DAPI (Life Technologies) was used for counterstaining the nuclei. Via an Alkaline Phosphatase Substrate Kit (Vector Laboratories, Inc.), alkaline phosphatase activity was detected according to the manufacturer's instructions. Control cells incubated with only a secondary antibody served as negative controls to exclude nonspecific binding of secondary antibodies.
Flow cytometry
iMSC phenotype was monitored by measuring the expression of characteristic markers for several passages. The CD105, CD90, CD73, and CD31 antibodies were purchased from Miltenyi Biotec. The cells were lifted with 0.05% trypsin, stained with the appropriate conjugated antibodies, and incubated for 30 min at 4°C. Cells were washed in a 0.5% BSA/PBS solution and analyzed via FACSCalibur (BD Biosciences).
Expression analysis
Total RNA was harvested from cells using the commercial RNeasy kit (Qiagen). RNA concentration and purity were measured using a spectrophotometer. RNA (900 ng–1 μg) was transcribed into cDNA using a High Capacity RNA-to-cDNA Kit (Applied Biosystems). Semiquantitative polymerase chain reaction (qPCR) was performed, using Platinum Taq DNA Polymerase (Invitrogen), on an MBS Satellite Thermocycler (Thermo Electron Co.). The sequences of all primers are available upon request.
Real-time qPCR
Via the RNeasy Mini Kit (Qiagen), total RNA was isolated from cells according to the manufacturer's instructions. RNA concentration and purity were measured using a spectrophotometer. RNA (250 ng–1 μg) was transcribed into cDNA using a High Capacity RNA-to-cDNA Kit (Applied Biosystems) in an MBS Satellite Thermocycler (Thermo Electron Co.). Quantitative real time polymerase chain reaction (RT-qPCR) was performed, using primer sets from IDT (sequences available upon request) and SYBR Advantage qPCR Premix (Clonetech), on a 7500 Real Time PCR System (Life Technologies). The 20 μL reaction volume contained 2 μL cDNA, 0.4 μL forward and reverse gene expression primers, 0.4 μL ROX reference dye LMP, and 10 μL PCR master mix (2 × ). Amplification was achieved via the following thermocycler protocol: 1 cycle at 95°C for 3 s and 40 cycles at 60°C for 30 s. All data were analyzed with the 7500 System Software. The expression of each target gene was normalized to an endogenous control gene, GAPDH.
FISH analysis
The cells were fixed in a cold solution of methanol and acetic acid (3:1) and placed on slides to air-dry. The fidelity of 21, Y, and X chromosome segregation was tested by a three-color PN (21, X, Y) FISH probe (Kreatech). After the probe was applied, the slides were denatured for 7 min at 75°C and hybridized overnight at 37°C. The slides were then washed according to the manufacturer's instructions and imaged via a Leica DM IRB.
Molecular karyotype
Genomic DNA was purified with the DNeasy Blood & Tissue Kit (Qiagen). The aCGH procedure was performed using a modified Agilent 4 × 180K aCGH protocol (Agilent Technologies). Genomic DNA was extracted and fragmented by high-intensity sound waves. Gender-mismatched reference samples were labeled with cyanine 5-dUTP, while corresponding patient samples were labeled with cyanine 3-dUTP. After the labeling procedure, the unincorporated label was removed via column purification (Amicon Ultra; Millipore) and resuspended in Tris–EDTA buffer (10 mM Tris and EDTA 1 mM at pH 8.0). A Cy5 reference was paired with a Cy3 testing sample and combined in a microcentrifuge tube. The combined samples were hybridized to the array for 24 h. Following this, they were washed, scanned, and analyzed. The MS200 (Roche Diagnostics) was used to acquire 2-μm array images. ImaGene 9.0 and Nexus CGH 7.5 (Biodiscovery) were used for data analysis.
STR genotyping
Genotyping was performed with the AmpFlSTR Profiler Plus PCR Amplification Kit (Applied Biosystems, Inc.). This kit coamplified the repeat regions of the following nine short tandem repeat autosomal loci: D3S1358, vWA, FGA, D8S1179, D21S11, D18S51, D5S818, D13S317, and D7S820. Amelogenin, a segment of an X-Y homologous gene, was also amplified. Genomic DNA (2–3 ng) was amplified in a 25 μL reaction containing 10.5 μL AmpFlSTR reaction mix, 5.5 μL Profiler Plus™ primer mix, and 0.5 μL AmpliTaq Gold DNA Polymerase. The PCR consisted of the following: 11 min at 95°C, followed by 28 cycles at 94°C for 1 min, 59°C for 1 min, 72°C for 1 min, and finished by 60°C for 45 min. The PCR product (1.5 μL) was added to 24 μL of deionized formamide with a size ladder standard [per sample, 1 μL GeneScan-500 size standard (ROX; Applied Biosystems, Inc.)] The product was separated via capillary electrophoresis on an ABI3130xl platform. Data collection and analysis were performed using GeneMapper™ ID version 3.1 (Applied Biosystems, Inc.).
Results
Atypical cellular morphology and spontaneous reversion to pluripotency in hiPSC-derived mesenchymal cell culture
Human iPSCs were generated from skin fibroblasts that had a normal karyotype and a trisomy 21 karyotype (Down syndrome). The fibroblasts were transduced with retroviral vectors expressing Oct4, Sox2, Nanog, and c-Myc. These iPSC lines are capable of differentiating into neural cells [20], endodermal precursors [21], and iMSCs [22]. We have also previously shown that the iMSCs derived in our laboratory (including iMSC-DS, which later reverted to pluripotency) could differentiate into osteoblasts, chondrocytes, and adipocytes. These cells expressed CD105 and CD90, and they were negative for CD34 and CD45. When seeded onto a decellularized matrix, the cells secreted glycosaminoglycans and collagen; the cells also expressed α-SMA. The gene expression profile of iMSCs was highly comparable with that of MSCs derived from bone marrow [22].
Additionally, iMSC-DS had a typical spindle-shaped mesenchymal morphology (Fig. 1A) and expressed both CD73 and CD146. During subsequent culture, Down syndrome mesenchymal stem cells (iMSC-DS) began to exhibit irregular morphology (Fig. 2A), which was associated with the reappearance of pluripotency markers and the appearance of self-induced pluripotent colonies (discussed below). We referred to these phenomena as spontaneous transgene reactivation and secondary reprogramming (reversion to pluripotency) of iPSC-derived MSCs. In light of such results, we termed these Down syndrome MSCs a “reverted” culture. Additionally, we detected that the transgene upregulation in iMSC-DS preceded reversion to pluripotency.

Reversion to pluripotency of mesenchymal stem cells.
Reversion to pluripotency of mesenchymal stem cells and rederivation of secondary (rederived) riPSCs.
Validation of riPSC source: reversion to pluripotency in iPSC-derived MSC culture follows the steps described for reprogramming with transcription factors
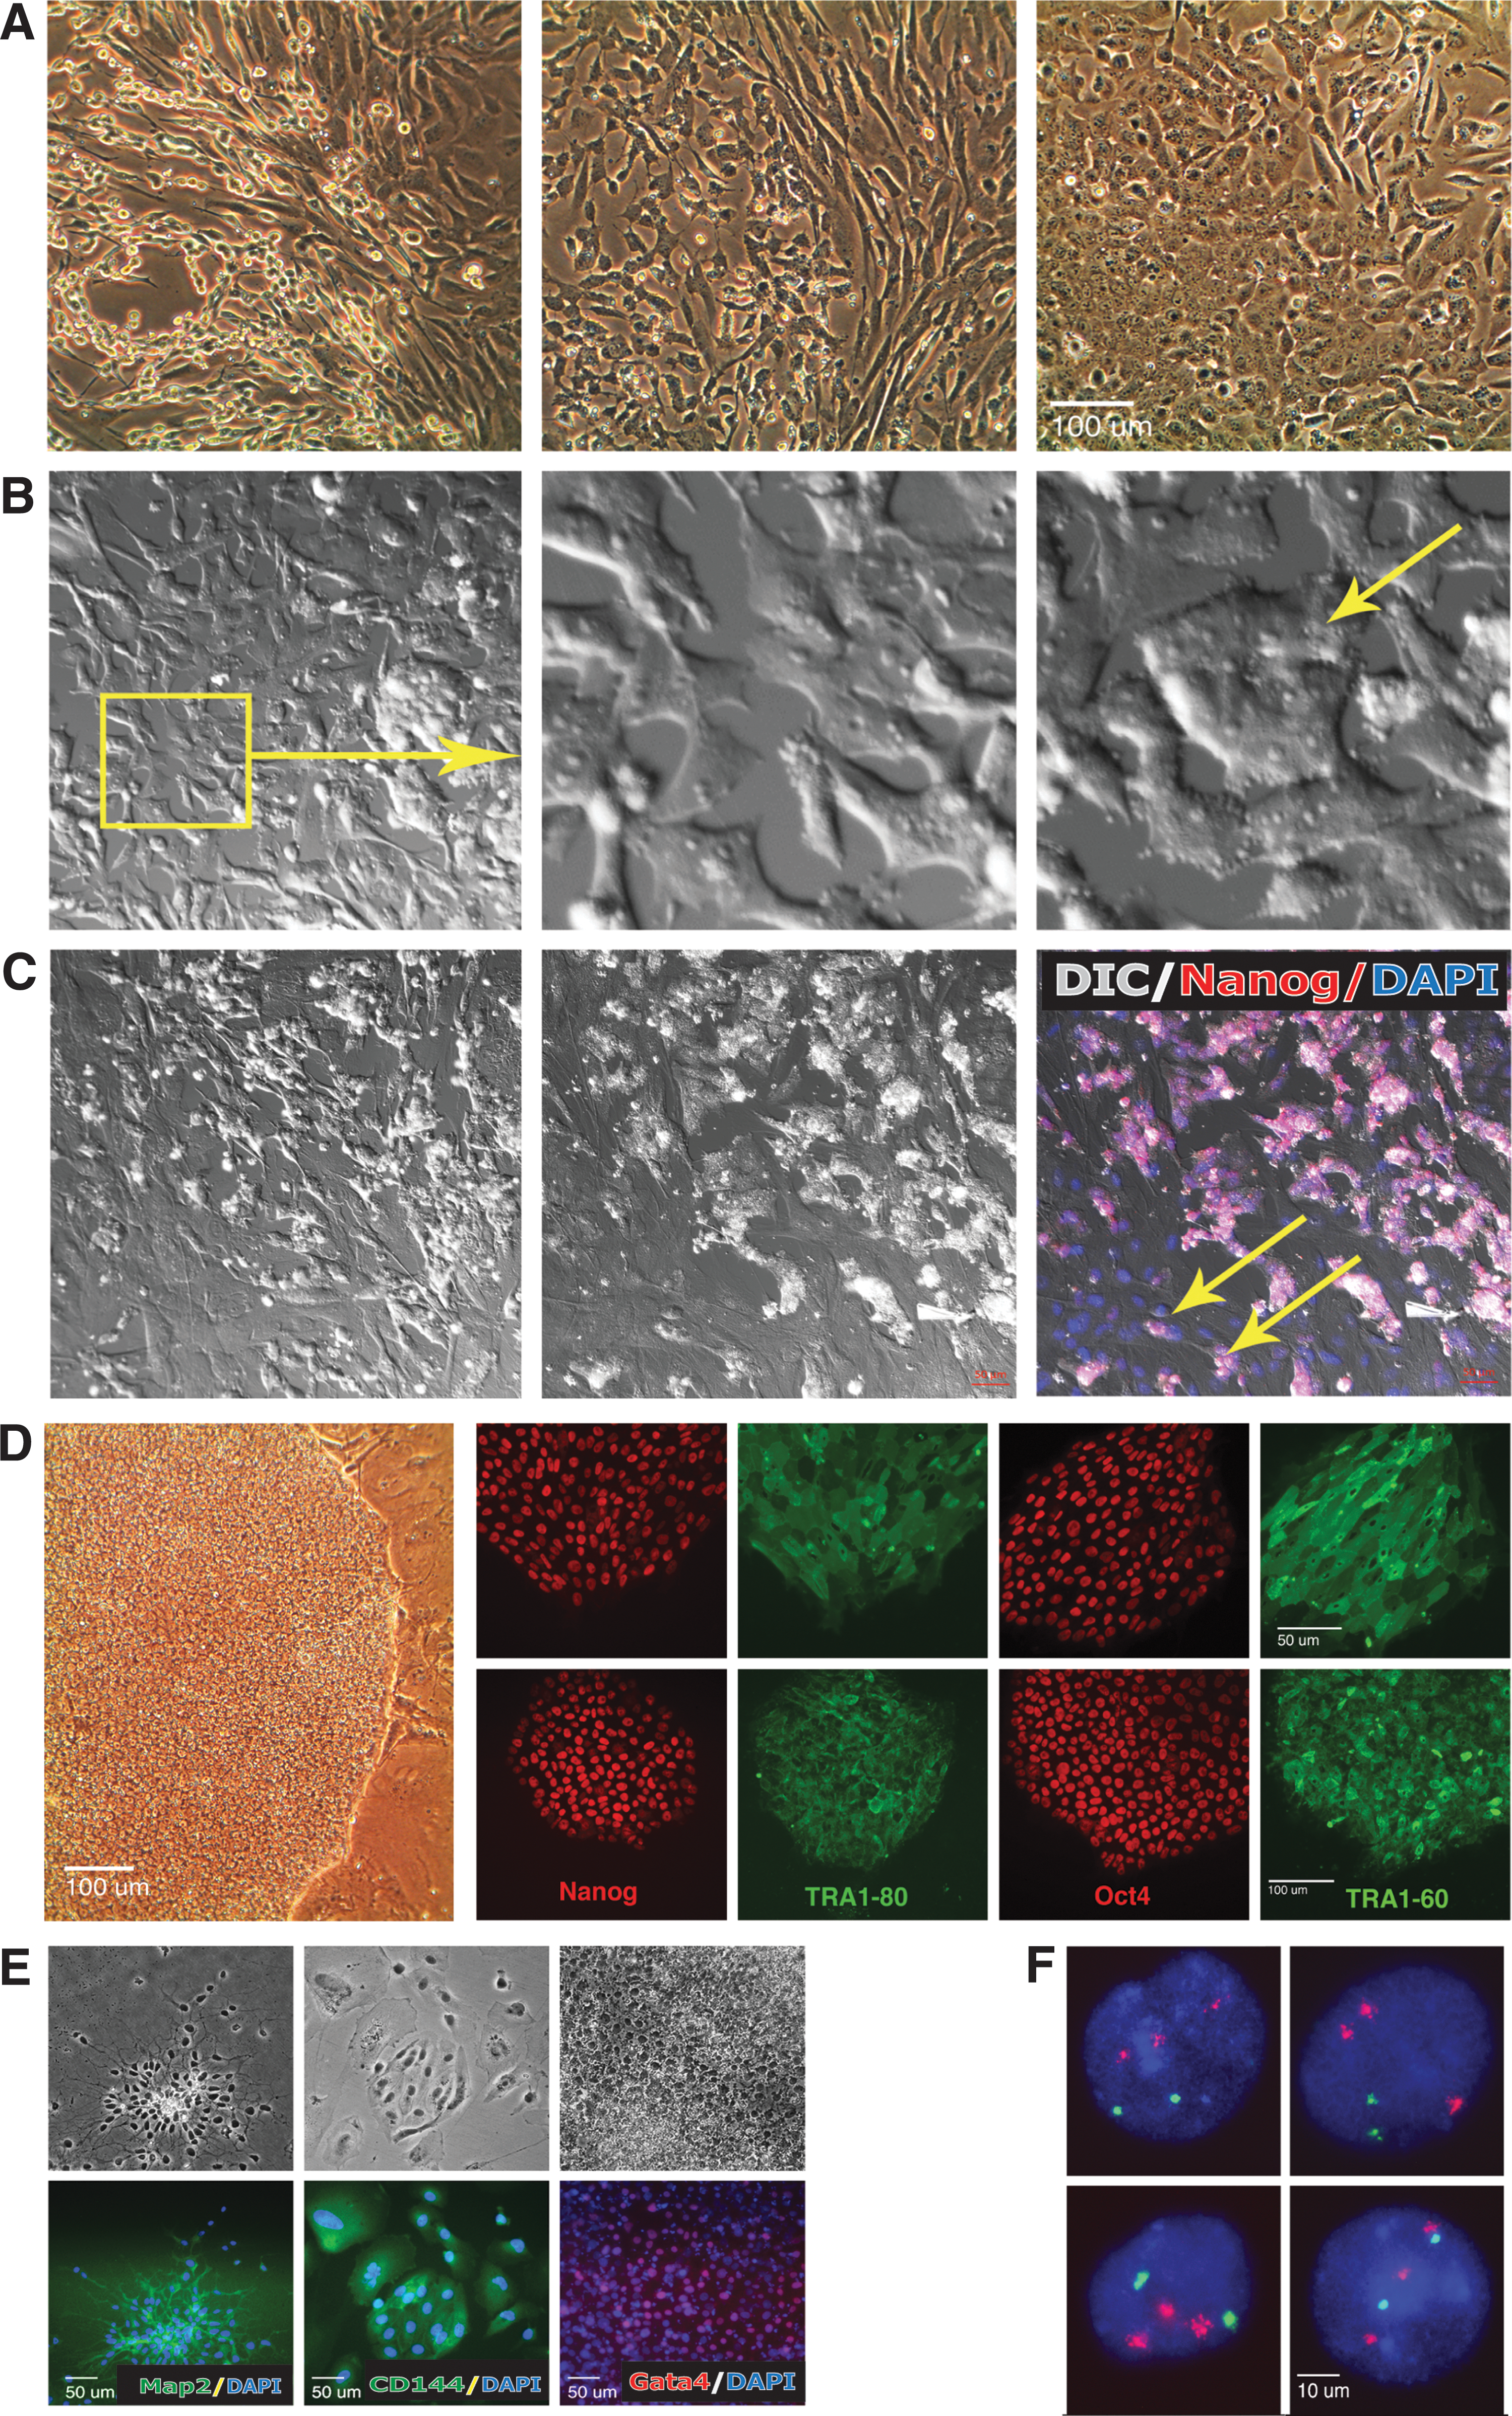
The surprising phenomena of spontaneous transgene reactivation and reversion to pluripotency have not been previously described. We, therefore, carefully examined the initiation of colony formation to exclude the remote possibility that undifferentiated cells may still persist in MSC culture. First, we analyzed a preceding passage of MSCs via FACS analysis. Immediately before reversion to pluripotency, the cells expressed 100% of the CD73 mesenchymal marker and had no expression of the pluripotent marker TRA1-60. We then used a semiquantitative RT-PCR analysis to compare transgene expression between the reverted mesenchymal cell culture and the “parental” iPSCs (piPSC-DS) from which that culture was derived.
The transgenes were predominantly silent in piPSC-DS. However, there was a notable upregulation of Nanog and c-Myc in MSCs derived from piPSC-DS (Fig. 1A). These findings indicated that transgene reactivation, not contamination with undifferentiated piPSC-DS, was responsible for the appearance of colonies. Thus, we eliminated undifferentiated “pluripotent contamination” as the source of colony formation in iPSC-derived MSCs.
Next, we documented a stepwise transformation of the cellular phenotype characteristic of the iPSC generation, which is believed to undergo the mesenchymal-to-epithelial transition (MET) during the reprogramming process [23,24]. Indeed, before colony formation, we detected an abundance of cells with epithelial and transitional morphology. A nascent stage of reprogramming in somatic cells can be distinguished by the gradual appearance of pluripotency markers. Accordingly, we observed that many somatic epithelial cells in the reverted MSC culture showed activation of pluripotency transcription factors, such as nuclear expression of Nanog and Oct4, and the cells were randomly positive for surface pluripotency markers TRA2-39 (AP) and TRA1-81 (Fig. 1B). Notably, there is some controversy regarding pluripotency marker expression in MSCs, including a report of low-level cytoplasmic but not nuclear Oct4 expression [25,26].
Finally, using time-lapse confocal microscopy, we established that formation of pluripotent clusters was occurring by aggregation of “somatic” cells (Fig. 2B, C and Supplementary Videos S1 and S2; Supplementary Data are available online at
Pluripotent clone isolation and characterization
After eliminating the possibility that the source of new pluripotent colonies in reversed culture was due to undifferentiated cells, the self-induced pluripotent clones (n = 8) were collected and expanded for study. They were positive for pluripotency markers and able to differentiate into derivatives of all three embryonic lineages (Fig. 2D, E). In contrast to piPSC clones, which had karyotypes similar to the parental fibroblasts, some riPSC clones retained an extra chromosome 21 (n = 5) (Fig. 2F). Others (n = 3) had a euploid karyotype with the extra chromosome 21 expelled (Fig. 3A, B).
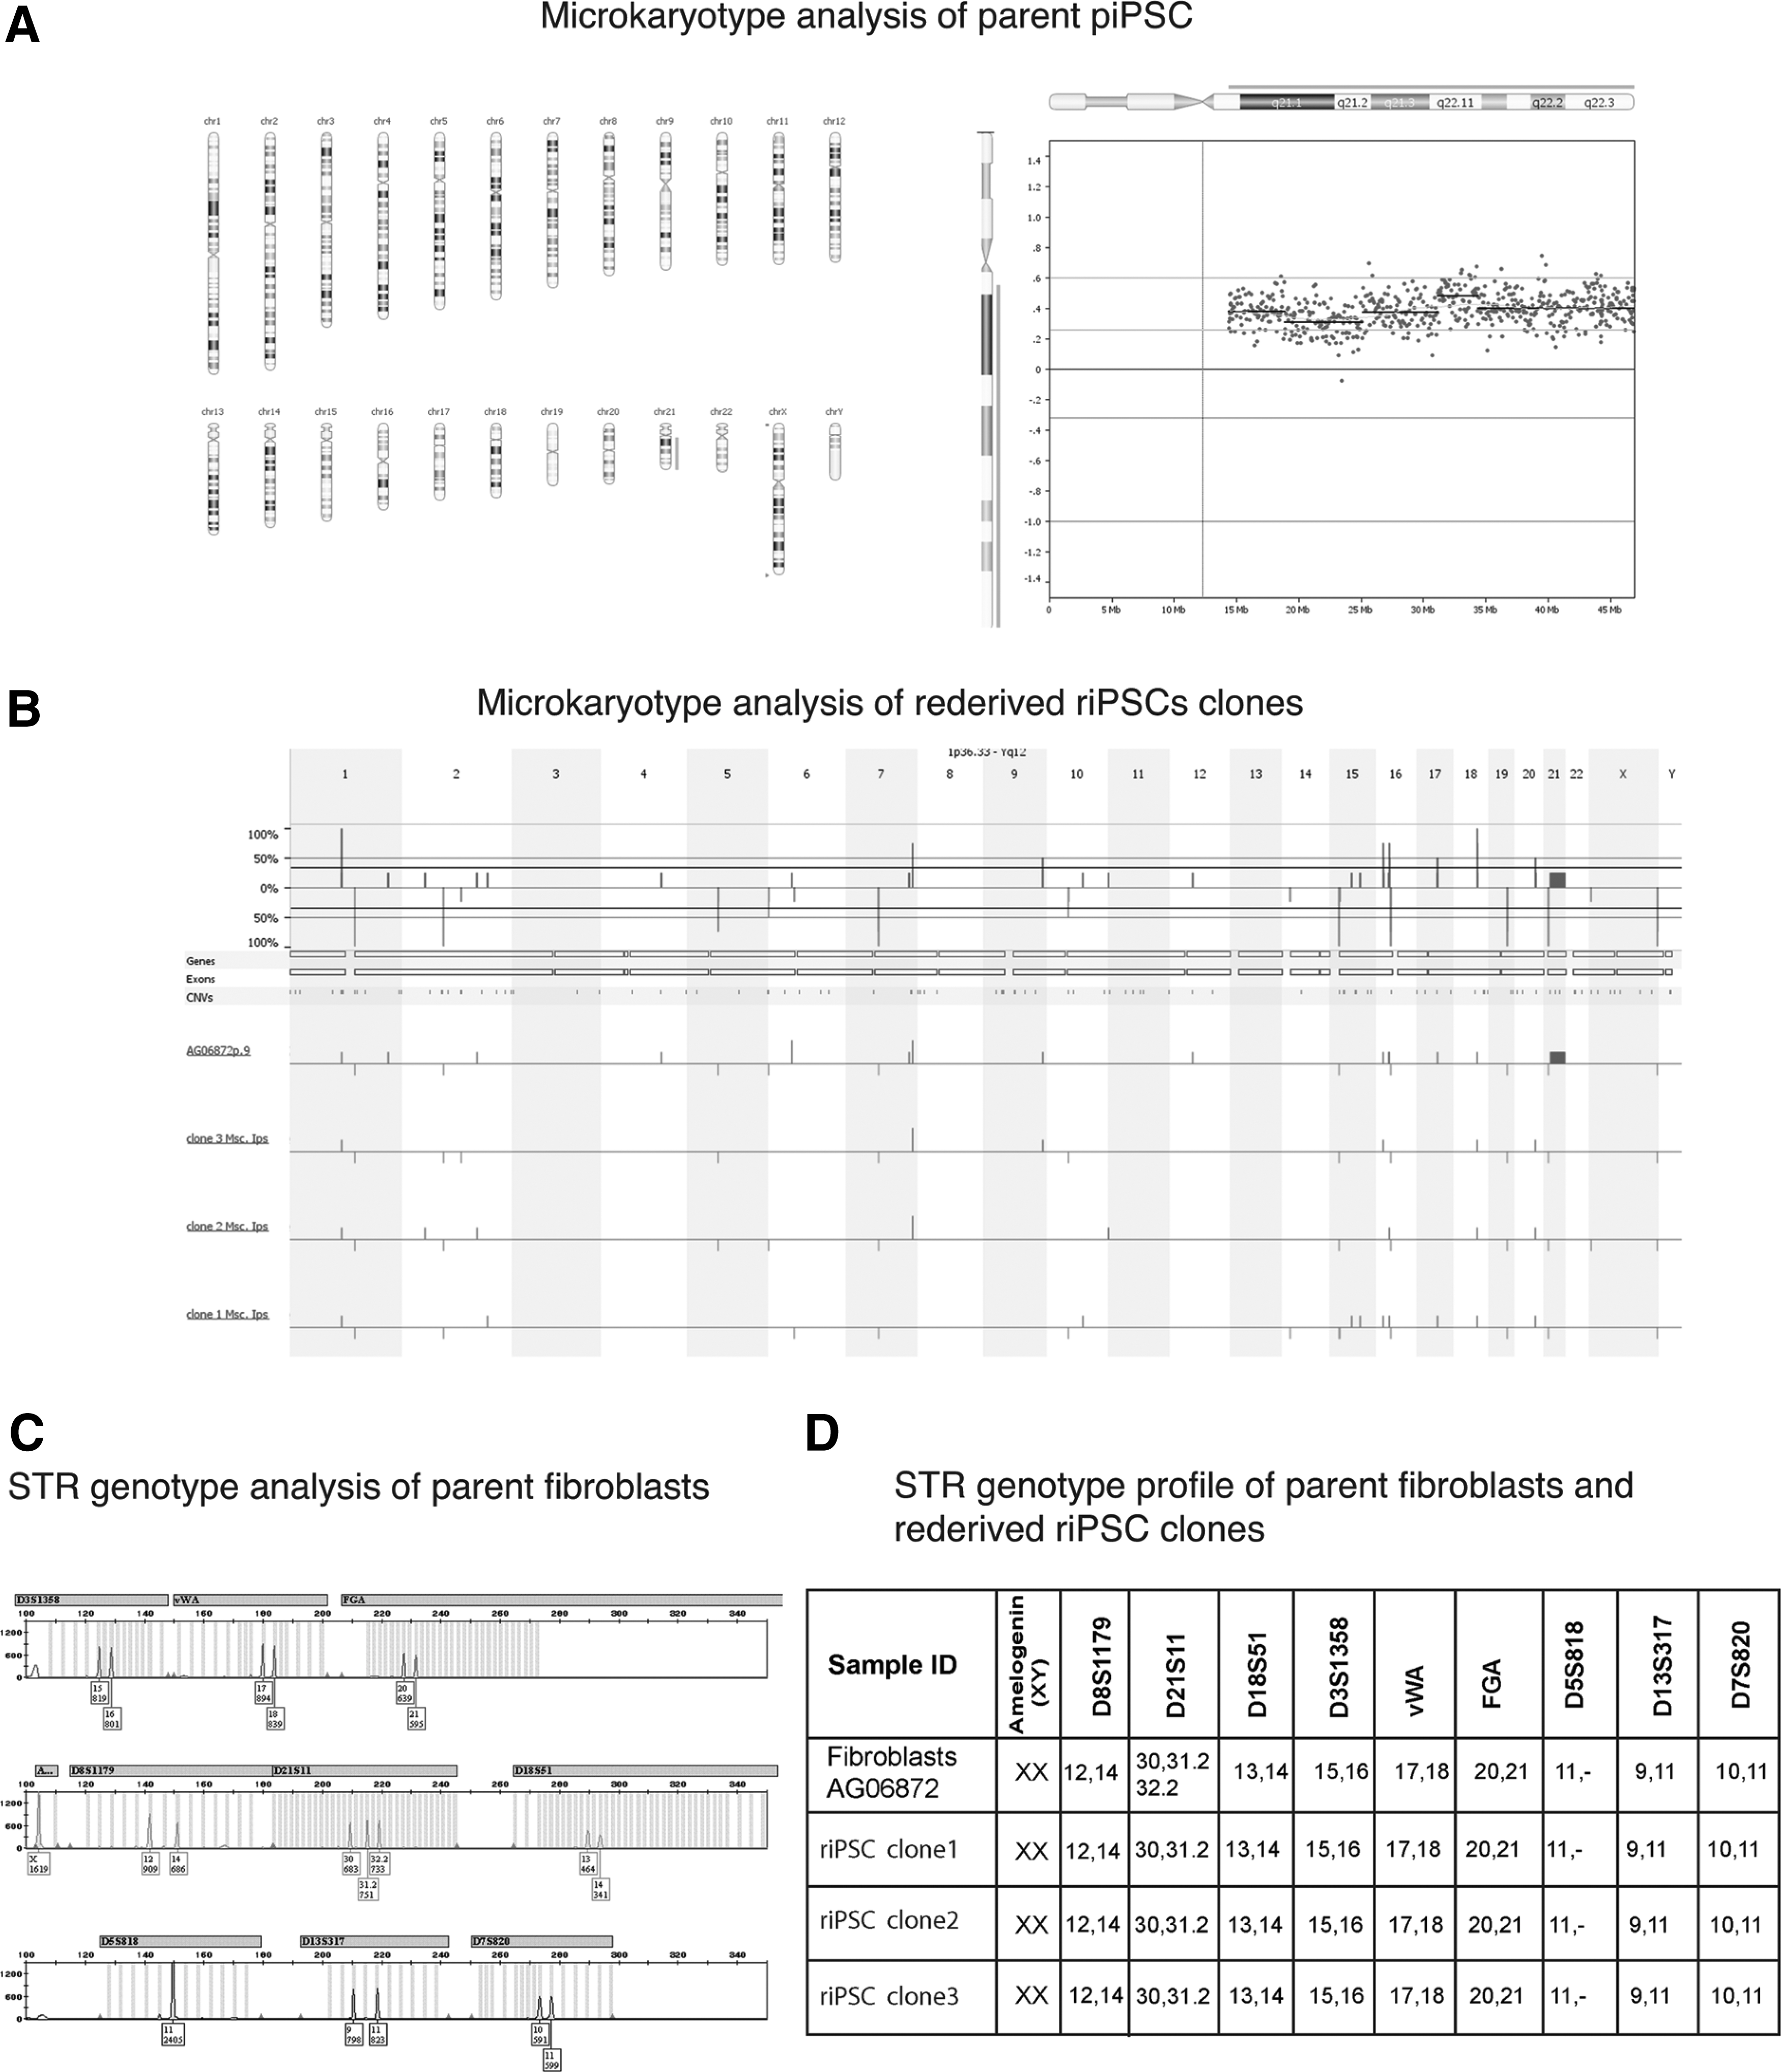
Genetic analysis of parent fibroblast, piPSC-DS, and riPSC-DS lines.
The cultures with a trisomy of chromosome 21 were previously described as relatively stable, and loss of the extra chromosome 21 in riPSC clones may reflect a physiological challenge during transgene reactivation and culture metamorphosis. For instance, Li et al. [27] achieved a correction of Down syndrome with TKNEO transgene integrated into the extra chromosome when grown in conditions that selected against TKNEO. Genetic identity between the patient's fibroblasts, the piPSC-DS, and the riPSC-DS was established by STR analysis (Fig. 3C, D).
Transgene activation in iPSC derivatives
We hypothesized that iMSC-DS reversion to pluripotency was driven by transgene reactivation. Semiquantitative RT-PCR results revealed transgene reactivation in MSCs (Fig. 4A). The transgenes were predominantly silent in piPSC-DS but showed upregulation of Nanog, c-Myc, and Oct4 in MSCs derived from piPSC. The significance of transgene reactivation in differentiated derivatives prompted us to investigate this finding more broadly. We noted that the “secondary” riPSC-DS clone 1, which was collected from MSCs, showed decreased transgene expression compared with piPSC-DS. We then isolated and tested two more riPSC-DS clones to verify the tendency. Apparently, the transgene expression in riPSC-DS clones (1–3) was variable, similar to the clones of the first generation (piPSC-DS 1 and 2). We also observed transgene expression in MSCs of the previous passage, although it was not as high as in the culture that eventually underwent secondary reprogramming (Fig. 4B). We further asked whether MSCs differentiated from iPSC-DS by a different protocol (iMSC2-DS) (Fig. 5A) would show signs of transgene reactivation. For this purpose, we used a novel method of iPSC mesenchymal differentiation based on the isolation of multipotential progenitor at the mesenchymoangioblast stage. We observed some reactivation of the c-Myc transgene in iMSC2-DS, however, to a lesser degree than in iMSC1-DS reverted. To inquire whether transgene expression was cell-type specific, we assayed another type of iPSC-DS derivative—endothelial cells (iEC-DS) (Fig. 5B), and we detected upregulation of c-Myc (Fig. 4B). We then performed a quantitative assessment of transgene upregulation via RT-qPCR. In mesenchymal stem cells (iMSC1-DS) derived from piPSC-DS, we found almost 300-fold upregulation of Nanog and a 77-fold upregulation of c-Myc, and there was no significant upregulation of Oct4 and Sox2. Additionally, we noted a significant (14-fold) upregulation of c-Myc in iMSC2-DS compared with piPSC-DS (Fig. 4C). Finally, to broaden the scope of our findings, we also investigated differentiated iPSC-derived phenotypes from a healthy individual (iPSC-WT). The WT iPSC differentiation steps are similar to the described DS iPSC differentiation. The following differentiated phenotypes were used in the experimental work: MSCs derived by protocol 1 (iMSC1-WT), MSCs derived by protocol 2 (iMSC2-WT), and endothelial cells (iEC-WT).

Reactivation of “pluripotency” transcription factors in iPSC derivatives.
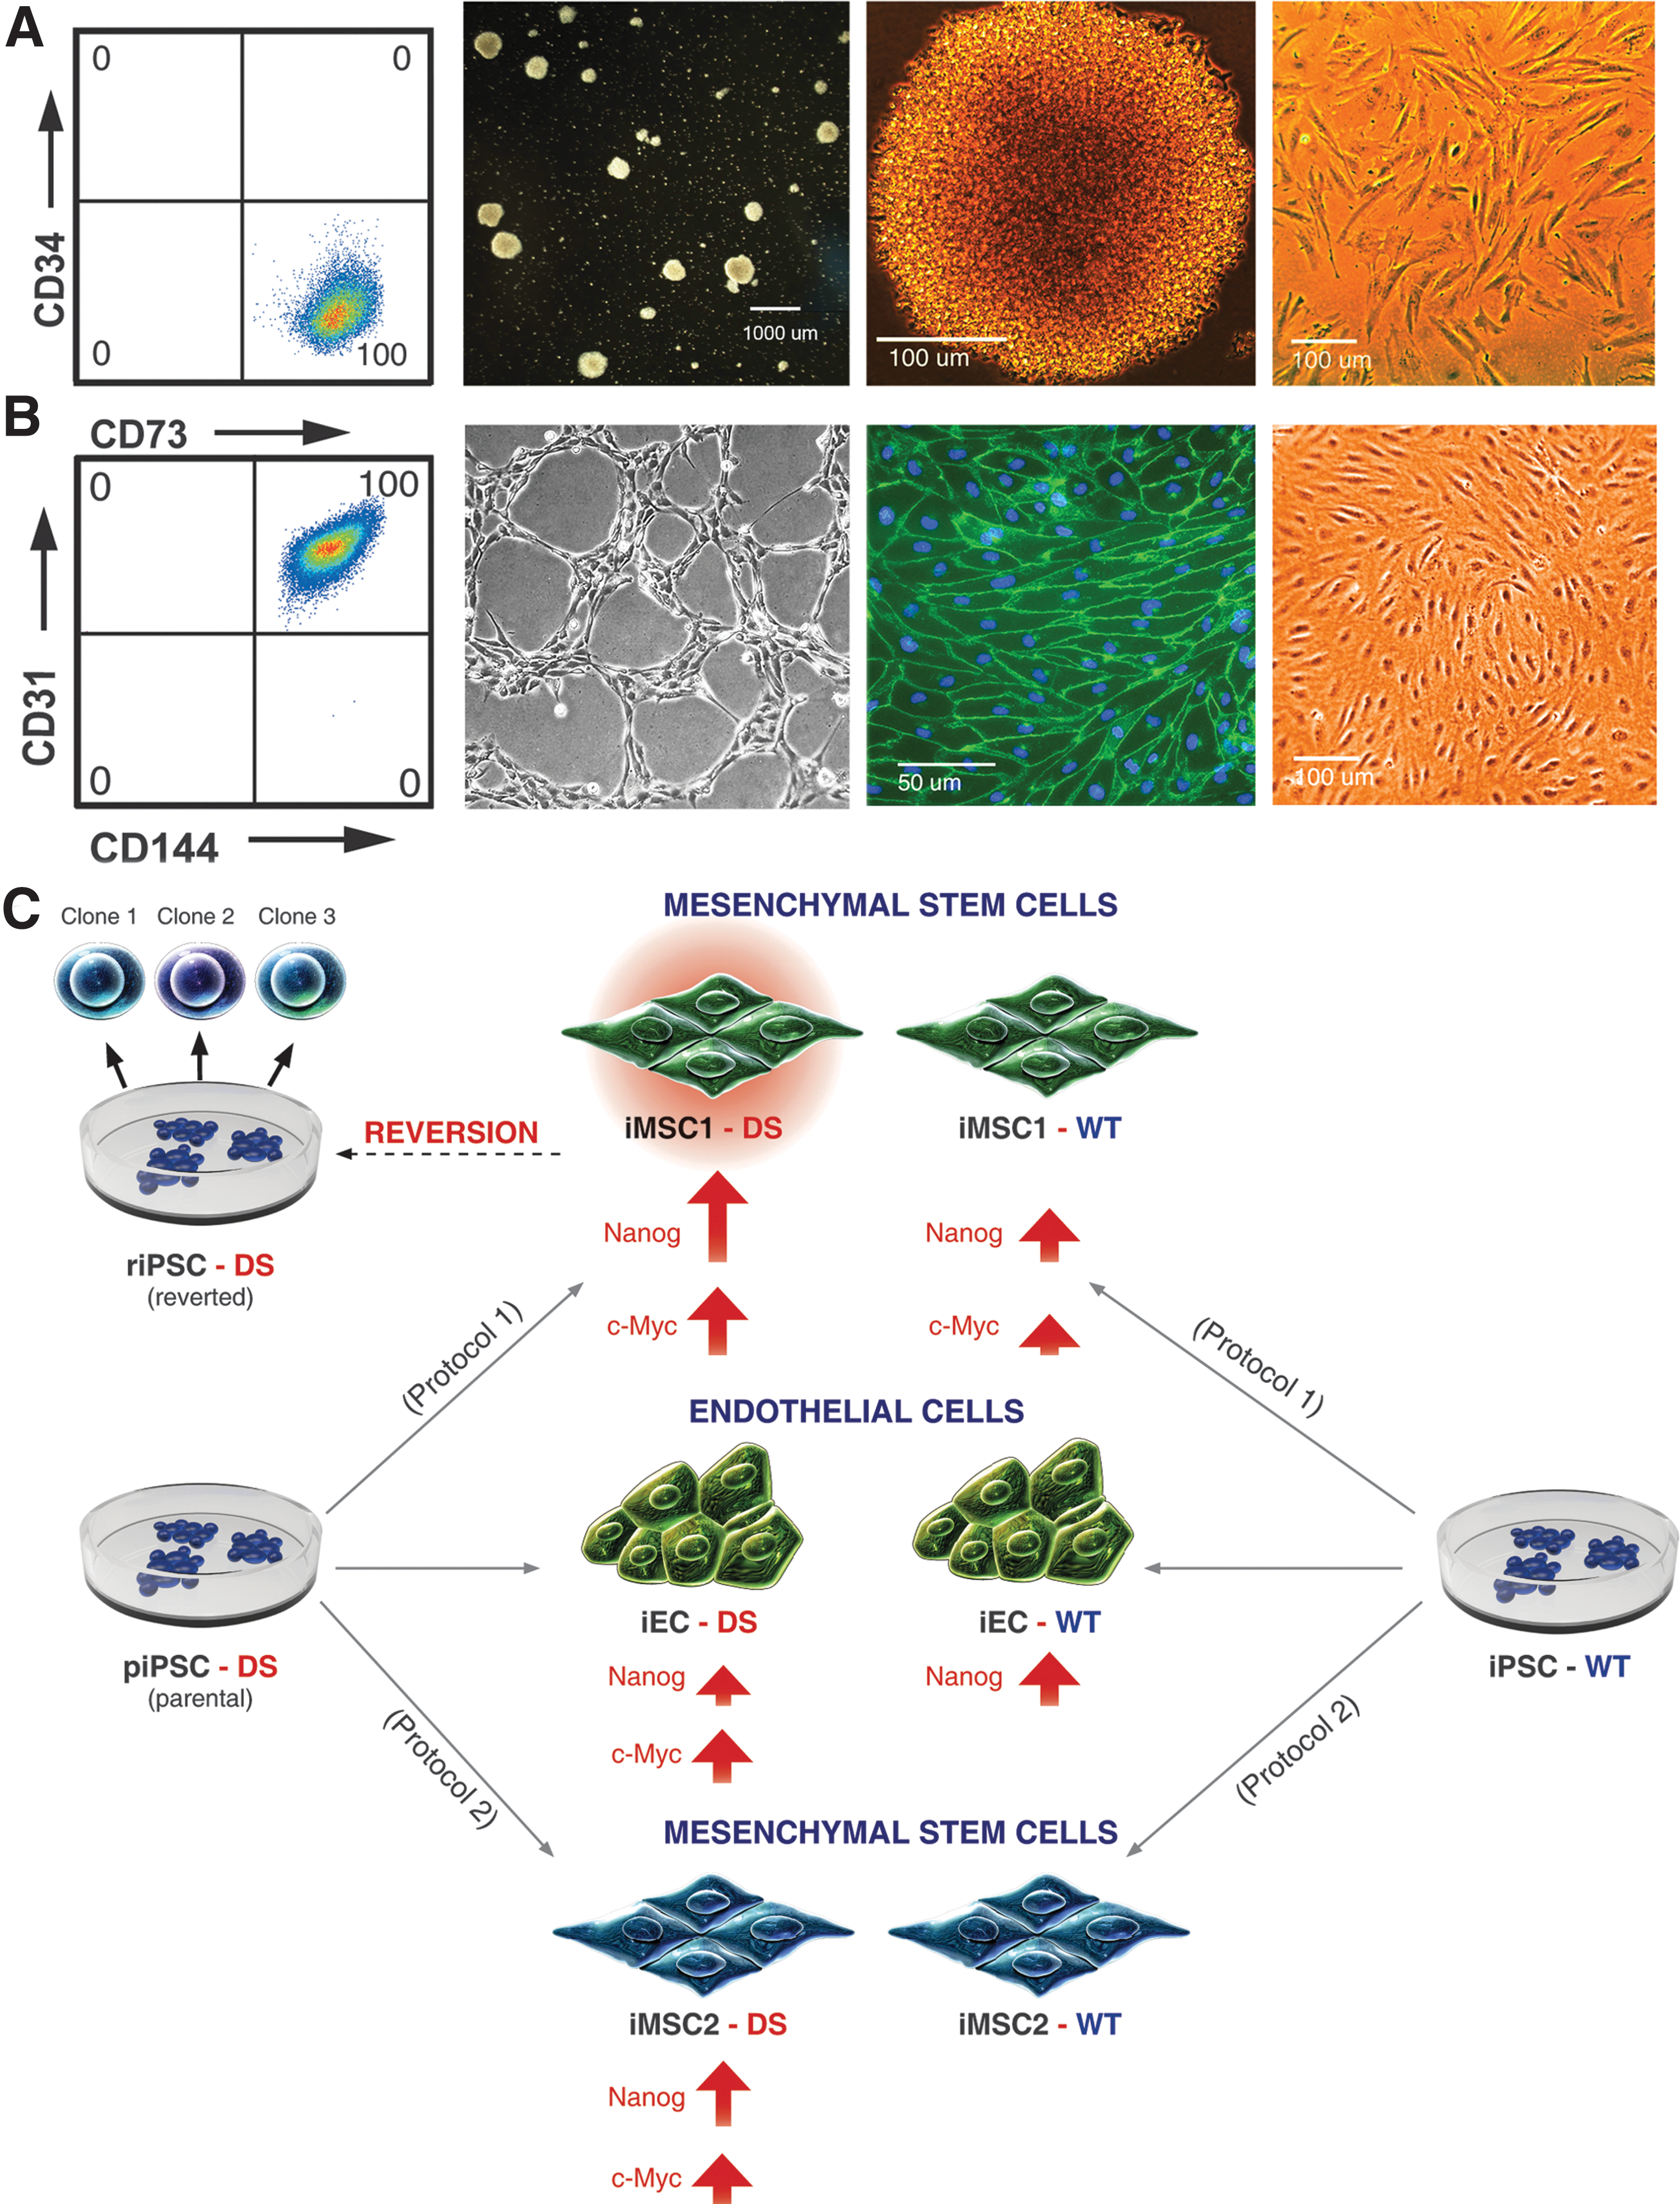
Summary chart of iPSC derivatives.
Surprisingly, we detected transgene reactivation in the iMSC1-WT and iEC-WT phenotypes (Fig. 4D). In comparison to the DS reversed MSCs, this reactivation was of a smaller magnitude. There was a significant 66-fold upregulation of Nanog and a 13-fold upregulation of c-Myc in iMSC1-WT cells. The WT endothelial cells (iEC-WT) had a 12-fold upregulation of Nanog and no significant upregulation of c-Myc. Regarding the iMSC2-WT cells, no significant upregulation of transgenes was detected. The upregulation of Nanog (257-fold) and c-Myc (112-fold) in iMSC1-DS only slightly differed from the previous experiment's results. This small difference may have occurred as a result of the use of a different brand of PCR mix. Nonetheless, all these results indicate that transgene reactivation occurs sporadically during various differentiation processes.
Discussion
In this work, we present the first demonstration of profound upregulation of transgene expression in mature differentiated phenotypes, such as endothelial and MSCs. We thoroughly evaluate the reverted culture with regard to undifferentiated cell contamination and firmly eliminate this possibility. By analyzing transgene levels across various cell types, we demonstrate that transgene upregulation leads to morphological changes, and in some cases, it initiates a reversion to pluripotency. The summary chart (Fig. 5C) shows the cell types and clones used in the study as well as the cell lines they were derived from. The figure also shows, via an arrow representation, which transgene reactivation was detected in the cell lines. The arrow length is proportional to the activation level.
We propose that a reversal to pluripotency occurs when some of the transgenes experience an upregulation greater than 100-fold in magnitude (257-fold for Nanog and 112-fold for c-Myc in this study), and the same mechanism may be responsible for the development of in vivo tumors. Furthermore, we propose to introduce the evaluation of the transgene status in iPSC derivatives since its activation may be associated with loss of cellular fidelity and impact the outcomes of disease modeling and related research.
Residual transgene expression in pluripotent cells
We have shown that the transgenes were predominantly silent in our piPSCs. Similarly, Park et al. described that low-level transgene expression (“largely silenced”) is frequently found for disease-specific iPSC lines ADA-iPS2, PD-iPS1, HD-iPS1, DMD-iPS1, SBDS-iPS3, GD-iPS3, and so forth. This residual expression did not interfere with the formation of teratoma and mature cell formation [5,28]. Notably, several groups reported continued transgene expression in domestic animals, such as porcine iPS cells [29 –31] and bovine [32], which were nevertheless capable of forming teratoma and contribute to chimeras (reviewed [33]). In contrast, transgene expression may have contributed to the fluctuations of pluripotency observed in spontaneously differentiating cultures [34]. The authors described a cell population (P4 subset, which included a fraction of low and negative cells for CD9/GCTM-2) that expressed pluripotent transcription factors at low levels, which then reverted to medium or high expression. They proposed that residual expression of the viral transgene might drive the secondary reprogramming.
Transgene reactivation in differentiated cells
Numerous studies, including those describing disease models, publish data based on cells derived from iPSCs produced with integrative constructs without assessing transgene reactivation [35 –40] because transgene silencing normally takes place during the differentiation of embryonic stem cells. Precisely for the reason of avoiding gene silencing during the differentiation, the human homolog of the ROSA26 locus, used in mouse ESCs, has been identified for constitutive ubiquitous gene expression in human pluripotent cells [13 –15]. Our finding demonstrates that transgene activation instead of expected silencing in iPSC derivatives may occur, thus underlying a necessity of assessing transgene reactivation in the cells differentiated from iPSCs.
Factors that could potentially trigger the transgene reactivation
Specifics of differentiation may play a role since mesenchymal differentiation involves activation of epithelial to mesenchymal transition (EMT) genes important in cancer transformation [12,41]. Endothelial cell specification also involves EMT at the progenitor stage of development. The combination of reprogramming factor may play a role [42]. We used a modified (“enhanced”) combination of factors [6,43] with Klf4 replaced by Nanog. The choice of “strong” TFs leads to faster reprogramming, which may be associated with accumulation of aberrations at genetic and epigenetic levels [44]. Activation of endogenous retroelements during reprogramming may change transcriptional control [45 –47].
Remarkably, although individuals with DS have a reduced risk of solid tumor development, the reversion to pluripotency occurred in the MSC derivative of the iPSC-DS line with trisomy 21. In contrast, the the euploid iPSC-WT-differentiated derivatives, which were developed and handled in similar conditions, did not show signs of reversion to pluripotency. This result is likely associated with the lower levels of transgene expression detected in iEC-WT and iMSC1-WT cell lines. We are not aware of any indications suggesting possible contribution of trisomy 21 toward transgene reactivation or reversal to the pluripotency.
Reversion to pluripotency: confirmation that riPSC-DS clones developed by reversion to pluripotency of MSCs
Our initial assumption was that undifferentiated cells, which may have remained during differentiation, were the source of pluripotent colony growth in MSC cultures. Careful experimentation and analysis ruled out this possibility. Our data show that secondary reprogramming began after profound upregulation of transgene expression in MSCs. This strongly suggests that transgene reactivation initiated the secondary reprogramming. Similar to piPSC-DS, newly isolated riPSC-DS had no visible transgene expression, which further confirms that pluripotent cells did not contribute to transgene upregulation. Additionally, some of the isolated riPSC-DS clones had a normal karyotype that distinguished them from piPSC-DS. Flow analysis showed the absence of pluripotent cells in the MSC culture passage preceding the reversion. In the reverted culture, we documented the transformation of the cellular phenotype, the appearance of epithelial and transitional morphology, the activation of pluripotency transcription factors, and the events characteristic of iPSC generation, which is believed to undergo the MET reviewed in [23,24]. Time-lapse movies showed somatic cell shape transformation and pluripotent colony aggregation. Based on this evidence, we determined that secondary reprogramming and reversion to pluripotency resulted in the formation of pluripotent colonies in MSCs.
Based on the investigation of several types of iPSC derivatives and the fact that reactivation of transgene expression does not necessarily initiate secondary reprogramming, we hypothesized that higher levels of transgene re-expression (eg, 112-fold is shown for c-Myc and 257-fold for Nanog) are needed to trigger culture transformation and colony formation. This is the first demonstration of an event that led to a spontaneous secondary reprogramming and reversion to pluripotency in characterized MSCs derived from iPSCs in an in vitro cell culture.
Future considerations
Although transgene activation may only be possible in integrative systems, evidence indicates that integration free technology of cellular reprogramming also increases the risk of impaired cellular fidelity associated with the consequences of forced reversal of somatic cells to iPSCs. The comparative studies of pluripotent cells, with hESCs serving as the gold standard, provide important insights. Our group reported earlier evidence of differences between hESCs and iPSCs—specifically the discovery of cancer hallmarks in iPSCs, indicated by perturbations of expression of key members of the Nodal embryonic signaling pathway, which is critical to the maintenance of pluripotency. Furthermore, we uncovered a dramatic difference in expression of cancer-related miRNAs in iPSCs [48].
In another multicenter study, aberrant methylation and numerous deletions of tumor suppressor genes that were absent from the somatic cells of origin were found in iPSCs after induction of pluripotency [49]. Other authors also reported that the same epigenetic memory and copy number variations are exhibited by hiPSC lines produced with nonintegrative approaches [50,51]. One study, which involved integrative and nonintegrative vectors [52], revealed a higher gene expression overlap of the hiPSC derivatives with cancer compared with hESC derivatives. It was recently found that the reprogramming per se triggers endogenous L1 and Alu retrotransposition in hiPSCs, which can change the functional landscape of the hiPSC genome and alter cellular phenotype [45 –47]. These preliminary observations indicate that even though errors at the genetic and epigenetic levels have been described in both iPSCs and hESCs [49,53 –55], the differentiated derivatives of iPSCs may remain more inclined to cancer transformation than the derivatives of fellow hESCs. As a result, although the use of nonintegrative vectors for reprogramming is well justified, the derivatives of hiPSCs might still bear some neoplastic properties.
It is widely assumed that the development of in vivo tumors, following the introduction of pluripotent derivatives into the tissue of adult animals, originates from residual undifferentiated pluripotent stem cells. Consequently, a number of recommendations have been developed with the aim of eliminating undifferentiated cells from stem cell transplants, for example [56,57] (reviewed [58]). Given the evidence of in vitro reversal of differentiated iPS cells to pluripotency, we offer the hypothesis that a similar process may be responsible for the development of in vivo tumors. In this model, purification of iPSC derivatives from undifferentiated cells alone does not guarantee sufficient safety of a therapeutic product. It also explains the variety of cellular types found in tumors, which cannot be explained by cancer transformation of iPSC-differentiated derivatives.
In this study, we demonstrate the reactivation of Nanog, in addition to the c-Myc transgene reported earlier for in vivo tumors, which emphasizes that reprogrammed iPSCs in the absence of c-Myc might still bear a risk of tumorigenesis. The lines described in this study provide a valuable model for dissecting microenvironmental components that can promote transgene reactivation. We anticipate these lines to be useful for verification of prognostic markers that would distinguish “safe” cellular lineages from those that underwent reprogramming to pluripotency [34,59]. Furthermore, our cells can aid the development of safety evaluations for differentiated derivatives. Most importantly, this new finding strongly suggests that the results of studies that involve iPSCs generated with retro- or lentiviruses should be carefully interpreted and thoroughly examined with respect to transgene reactivation in iPSC derivatives.
Footnotes
Acknowledgments
These studies were supported by NIH CA 12205 grant to M.J.C.H., Eisenberg Foundation for Charities (P.M.I.), and Stanley Manne Children's Research Institute's grant to V.G. We thank Kathrin Plath (University of California, Los Angeles) for providing the sequences of PCR primers, Irina Elcheva, Alina Gilgur, McCabe Chris, and George David for technical help, and Vladimir Galat for graphic design.
Author Disclosure Statement
No competing financial interests exist.
References
Supplementary Material
Please find the following supplemental material available below.
For Open Access articles published under a Creative Commons License, all supplemental material carries the same license as the article it is associated with.
For non-Open Access articles published, all supplemental material carries a non-exclusive license, and permission requests for re-use of supplemental material or any part of supplemental material shall be sent directly to the copyright owner as specified in the copyright notice associated with the article.