
Abstract
Multipotent stromal cells (MSCs) are known for their distinctive ability to differentiate into different cell lineages, such as adipocytes, chondrocytes, and osteocytes. They can be isolated from numerous tissue sources, including bone marrow, adipose tissue, skeletal muscle, and others. Because of their differentiation potential and secretion of growth factors, MSCs are believed to have an inherent quality of regeneration and immune suppression. Cellular expansion is necessary to obtain sufficient numbers for use; however, MSCs exhibit a reduced capacity for proliferation and differentiation after several rounds of passaging. In this study, gene markers of MSC proliferation were identified and evaluated for their ability to predict proliferative quality. Microarray data of human bone marrow-derived MSCs were correlated with two proliferation assays. A collection of 24 genes were observed to significantly correlate with both proliferation assays (|r| >0.70) for eight MSC lines at multiple passages. These 24 identified genes were then confirmed using an additional set of MSCs from eight new donors using reverse transcription quantitative polymerase chain reaction (RT-qPCR). The proliferative potential of the second set of MSCs was measured for each donor/passage for confluency fraction, fraction of EdU+ cells, and population doubling time. The second set of MSCs exhibited a greater proliferative potential at passage 4 in comparison to passage 8, which was distinguishable by 15 genes; however, only seven of the genes (BIRC5, CCNA2, CDC20, CDK1, PBK, PLK1, and SPC25) demonstrated significant correlation with MSC proliferation regardless of passage. Our analyses revealed that correlation between gene expression and proliferation was consistently reduced with the inclusion of non-MSC cell lines; therefore, this set of seven genes may be more strongly associated with MSC proliferative quality. Our results pave the way to determine the quality of an MSC population for a particular cellular therapy in lieu of an extended in vitro or in vivo assay.
Introduction
H
Efforts have been made to better characterize the identity and therapeutic effect of MSCs in both in vitro and in vivo assays [16 –18]. Furthermore, multidimensional data sets are being produced using microarray and sequencing technologies to evaluate the predictability of identified protein or gene markers to correlate with clinical outcomes [19 –22]. The difficulty in characterizing and identifying potential markers for MSCs is their heterogeneous behavior, which possibly results during tissue isolation and proliferation protocols. The unknown mixture of contaminating cells within a population may negatively impact their therapeutic potential. Similarly, donor variation between MSCs can also impact performance; hence, evidence suggests not all MSCs are equal [20,23 –26].
Our previous work has demonstrated the effect of cellular aging in culture on gene expression and cell proliferation; however, the magnitude of the impact on both parameters is not equal, where MSCs from some donors will have a larger reduction in gene expression or cell proliferation potential with passaging than other MSCs from different donors [27]. Not all MSCs divide at the same rate or an identical number of times every passage, which is a consequence of their heterogeneity. To better characterize MSCs, a more appropriate method would be to correlate MSC markers with an attribute of their quality that is indicative of their therapeutic benefit. MSC markers exhibiting the strongest correlation between these two measurements would be ideal for predicting the therapeutic potential for the specific indication. One such quality attribute is proliferation as cellular expansion is typically needed to generate a sufficient number of cells after tissue isolation for a cell therapy or cell-based product. The objective of this work was to use microarray chips to identify genes from one set of MSCs that exhibit a strong correlation with the outcomes of two different proliferation assays: confluency fraction and fraction of dividing cells. To confirm the predictive power of the top identified genes, another set of MSCs was expanded in different media, evaluated by an alternative method for gene expression reverse transcription quantitative polymerase chain reaction (RT-qPCR) and correlated with an additional measure of cell proliferation. Furthermore, the predictive potential of the identified genes for proliferation was assessed for four different non-MSC populations (osteoblasts, chondrocytes, dermal fibroblasts, and embryonal carcinoma cell line) for comparison.
Methods
Cultivation and expansion of human bone marrow-derived MSCs
Human MSCs were purchased from All Cells (Alameda, CA), Cell Applications (San Diego, CA), and RoosterBio (Frederick, MD) and expanded to passage 8 in marrow stromal cell growth medium (Cell Applications) under a humidified atmosphere of 5% CO2 at 37°C (Table 1). Other cell types, chondrocytes, osteoblasts, dermal fibroblasts, and NTERA-2 embryonal carcinoma cell line (NT2), were purchased from Cell Applications and ATCC (Manassas, VA) and grown to passage 4. MSCs were detached from the flask using 0.25% trypsin-versene EDTA solution (Lonza, Walkersville, MD) after reaching 80% confluency and replated at a density of 550 cells/cm2. The MSCs in the original data set were expanded differently as described in Lo Surdo et al. [28].
Cell types from the same donor.
MSC, multipotent stromal cell.
RT-qPCR
RNA isolation was completed on cell samples at either passage 4 or 8. NT2 cells grow indefinitely; therefore, no passage number was assigned. The Qiagen RNeasy Mini Kit (Valencia, CA) was used to isolate total RNA from each sample per the manufacturer's instructions. The Agilent 2100 bioanalyzer (Santa Clara, CA) was used to assess the RNA quality, where all samples had measured RNA integrity values >9.0. Total RNA concentration was measured using the NanoDrop 1000 spectrophotometer (Wilmington, DE).
RT-qPCR plates containing 30 genes in triplicate with positive/negative controls were purchased from Bio-Rad (Hercules, CA). Reverse transcription was performed per the manufacturer's instruction using the 5× iScript cDNA Synthesis Kit. Quantitative polymerase chain reaction was performed per the manufacturer's instructions using SsoAdvanced Universal SYBR Green Supermix. The reaction protocol was 10 s at 95°C and 30 s at 60°C for 40 cycles. The 96-multiwell plates for three samples, 1F3422 P4, HMSC2483 P4, and HMSC2618 P8, were repeated in triplicate to evaluate the reproducibility of the selected primers.
Cell proliferation assays
Three different cell proliferation assays were performed on all cell types recovered from vials frozen at passages 4 and 8. These cells were considered passages 5 and 9 after thaw and subsequent tissue culture. For the confluency fraction cell proliferation assay, cells were plated at a density of 1,000 cells per well in 24-well plates. Following cell adhesion, multiwell plates were placed into an IncuCyte live-cell imager (Essen BioScience, Ann Arbor, MI). Whole-well images were captured per well every 4 h. Confluency fraction measurements were averaged for each well (n = 4) and each passage of every cell type and plotted as a function of time to assess proliferative capacity.
The Click-iT EdU cell proliferation assay (Life Technologies, Frederick, MD) was used to evaluate cell division per the manufacturer's instructions. Briefly, all cell types at each passage were plated in 24-well plates at a density of 1,000 cells per well and administered the EdU reagent for both 6 and 10 h after adherence. Later, MSCs were fixed and stained with Alexa Fluor 488 for EdU detection and Hoechst 33342 (Life Technologies) to visualize the cell nuclei. Automated fluorescence microscopy using a Nikon Ti-S inverted microscope with a 10× objective was used to capture 40 images per well, and quantitation was performed using CellProfiler as previously described [27].
To determine population doubling time, cells were plated at a density of 1,000 cells per well in four 24-well plates. Plates were fixed and stained with Hoechst 33342 at 24-h intervals (0, 24, 48, and 72 h). Automated fluorescence microscopy captured 40 images per well (n = 4), where cell number was averaged per time point and a population doubling curve was used to estimate the population doubling time.
Data analysis and statistical evaluation
The microarray data sets and subsequent analysis were performed with data files from passages 3, 5, and 7 from 6 different donors as described by Bellayr et al. [27] (Gene Expression Omnibus: GSE74303). Additionally, two-color microarray hybridization was conducted for donors 127756 (at passages 3 and 5) and PCBM1655 (passage 3) in triplicate in a randomized block design as previously described with the other six donors. One technical replicate for sample PCBM1655 (passage 3) was determined an outlier by Mahalanobis and Jackknife distances and subsequently not included in calculating the median expression values for this sample. Donor 127756 did not grow beyond passage 5, and donor PCBM1655 did not grow beyond passage 3. The microarray data were correlated with cell proliferation data for confluency fraction and EdU+ cell fraction after 6 h from our previously published work [27 –29].
For the microarray data, a regression analysis was used to quantify the correlation between two different MSC proliferative potential assays (confluency fraction at 4 days and fraction of EdU+ cells after 6 h) and the 34,555 probes spotted on the microarray corresponding to the MSC donor/passage gene expression. The slope (β1) and correlation coefficient (r) were calculated for each probe on the microarray chip when correlated with each proliferation assay. A cutoff slope (βC) was calculated by dividing the technical variability (standard deviation) per probe by the median coefficient of variation from the corresponding proliferation assay. Probes whose calculated slope (β1) was less than the cutoff slope (βC) were not included in the statistical analysis as the expression for those probes was considered highly variable. Probes on the microarray were also filtered from the data set if the magnitude of expression for 90% of the samples was not greater than a calculated background cutoff. P values were calculated from a t distribution.
Similarly, for the RT-qPCR data (Gene Expression Omnibus: GSE74203), a regression analysis and statistical analysis were applied between the gene expression data (ΔCT) and the three different proliferation assays: confluency fraction (at 5 and 6 days), fraction of EdU+ cells (6 and 10 h), and population doubling. A paired t-test was also applied to calculate statistical significance between passages 4 and 8 gene expression data and MSC proliferation results.
RT-qPCR results were normalized by eight different methods. For five of the normalization methods, the individual genes ACTB, GAPDH, GUSB, NACAD, and ST13 were used to normalize 96-well plates of RT-qPCR data. Normalization was also performed using the geometric mean of common housekeeping genes (common combined: ACTB, GAPDH, and GUSB) and newly identified potential housekeeping genes (new combined: NACAD and ST13) [30]. The final method to assess the normalization of the RT-qPCR genes was using the geometric mean of all five housekeeping genes (all combined).
For all statistical analyses of genes from both the microarray and RT-qPCR data, an adjusted P value was calculated using the Benjamini and Hochberg method, where significance was determined by P < 0.05 [31]. All statistics and high-throughput analyses were performed using JMP Genomics 7 software.
Results
Correlation of MSC microarray and proliferation data sets
The frequency of the percent coefficient of variation was determined for two previously completed cell proliferation assays: confluency fraction at 4 days and fraction of EdU+ cells after 6-h culture with EdU, where the median percent coefficient of variation is 11.91% and 6.71%, respectively (Supplementary Fig. S1A, C; Supplementary Data are available online at
Using the MSC proliferation data for each donor/passage, a change in gene expression per cell proliferation measurement (or slope β1) could be calculated (Supplementary Table S1). These values for both assays were directly compared to the cutoff slope (βC) determined by the technical variability for a specific probe divided by the coefficient of variation for a specific assay. A filtering step was used to remove highly variable probes from the data set that would not be good candidates in predicting MSC proliferation. For instances where the absolute value of the slope was observed to be greater than the cutoff slope, the probe was considered a potential candidate of predicting MSC proliferation based on the particular cell proliferation assay (Supplementary Fig. 1D, E). If the absolute value of the calculated slope was less than the cutoff slope, the probe did not pass this filtering step because it was considered too unpredictable. This filtering method resulted in probes that have the greatest amount of correlation and the largest calculated slope for each of the MSC proliferation assays of confluency fraction at 4 days and fraction of EdU+ cells after 6 h (Supplementary Fig. 1F, G).
Unsupervised principal component analysis (PCA) of the microarray data (all 34,555 probes) revealed no distinct clustering of any MSCs by donor or passage when the two MSC donors that did not grow to passage 7 (127756 and PCBM1655) were included in the analysis (Fig. 1A). Using the probes that passed the aforementioned filtering, a statistical analysis with multiplicity adjustment (adjusted P < 0.05) was applied to each of the correlations. When correlating the microarray data with the confluency fraction at 4 days, a total of 643 probes were observed to be significant, whereas 416 probes were found to be significant when correlating the microarray data with the fraction of EdU+ cells after 6 h (Fig. 1B). Of the 342 total significant probes identified in common between both proliferation assays, 24 genes were selected for further analysis that exhibited the greatest correlation and slope (Supplementary Table S2). A hierarchical clustering heat map was used to visualize the changes in gene expression, where the samples are listed from high to low proliferative potential on the x-axis based on the confluency fraction assay (Fig. 1C). It is clear that for a number of genes, expression increases with increases in proliferative potential (positive correlation), while other genes exhibit decreases in expression with increasing proliferative potential (negative correlation). When supervised PCA is performed with the 24 selected genes on the individual MSC donor/passage samples, clustering is observed by proliferation potential instead of by passage (Fig. 1D). A clear distinction is observed between highly proliferative MSC samples, PCBM1641, PCBM1632, 110877, and 167696 at passage 3, compared with the other MSC samples. Furthermore, donor and passage samples clustered much closer to each other compared to the unsupervised PCA, thus exemplifying the minimal technical variability of these genes.

PCA of unsupervised microarray data for 21 different samples represented by 62 microarrays
In addition to finding correlative genes with MSC proliferation, similar efforts were made to identify genes consistently expressed by MSCs regardless of proliferative capacity, which could possibly serve as housekeeping genes. Three genes, CYP2B6, NACAD, and ST13, were selected for further analysis as potential housekeeping genes based on their low technical and biological variability and then compared with 15 common housekeeping genes (ACTB, β2M, GAPDH, GUSB, HPRT1, HSP90AB1, PPIA, RPL13A, RPLP0, RPLP1, TBP, TFRC, TUBB, UBC, and YWHAZ) and the 24 potential MSC predictive proliferation genes (Supplementary Table S3). The expression of CYP2B6 was not commonly expressed in all samples through RT-qPCR; therefore, it was not used in further analyses. Through supervised PCA of the 74 probes/genes (Supplementary Table S3), a definitive separation is observed between the positively and negatively correlated genes with the potential new housekeeping genes located between the two groups (Fig. 1E). The 15 common housekeeping gene probes are also distributed in the principal component space between the positively and negatively correlated MSC proliferative genes; however, some are intermingled with the positively correlated genes, indicating that these genes/probes (TUBB) may not be suitable housekeeping genes.
Proliferation data of MSC confirmation set
To confirm the 24 genes identified as potential predictive markers of MSC proliferation, a second set of MSCs from eight donors was expanded to passage 9 (Table 1). Three additional non-MSC cell lines were also evaluated at passage 4/5, where two of the samples were a chondrocyte (HC1994) and osteoblast (HOb1994) cell population isolated from the same donor as HMSC1994; the third cell sample was a human dermal fibroblast cell line. An embryonal carcinoma cell line, NT2, was also evaluated. Each of these cell populations' proliferation potential was characterized quantitatively using confluency fraction, fraction of EdU+ cells, and population doubling time. Most cell samples did not reach 100% confluency after nearly 10 days in culture; however, fetal MSCs HMSC2618 and HMSC1994, and HC1994 (at passage 5) reached 100% confluency by 10 days (Fig. 2A). Based on measuring the confluency fraction at two time points (days 5 and 6), MSCs at the earlier passage demonstrated a significantly greater proliferative potential (P < 0.05) than the later passage MSCs (Fig. 2B, C). MSC cell lines HMSC2618 and HMSC1994 had greater confluency fractions at both passages than all other MSC cell lines, with HMSC2618 having the greatest confluency fraction of all samples. The proliferative potential of non-MSCs was comparable to the MSC donor samples at passage 5, where proliferative potential of HC1994 was only surpassed by HMSC2618. Similar trends were observed for the fraction of EdU+ cells after 6 and 10 h, where passage 5 samples exhibited significantly (P < 0.05) greater cell division than passage 9 samples (Fig. 2D, E]. Cell division after 6 and 10 h with the EdU for the non-MSC samples was comparable to the MSCs at passage 5. Some of the older donor MSCs exhibited little to no cell division at the later passage as measured by the EdU+ fraction.
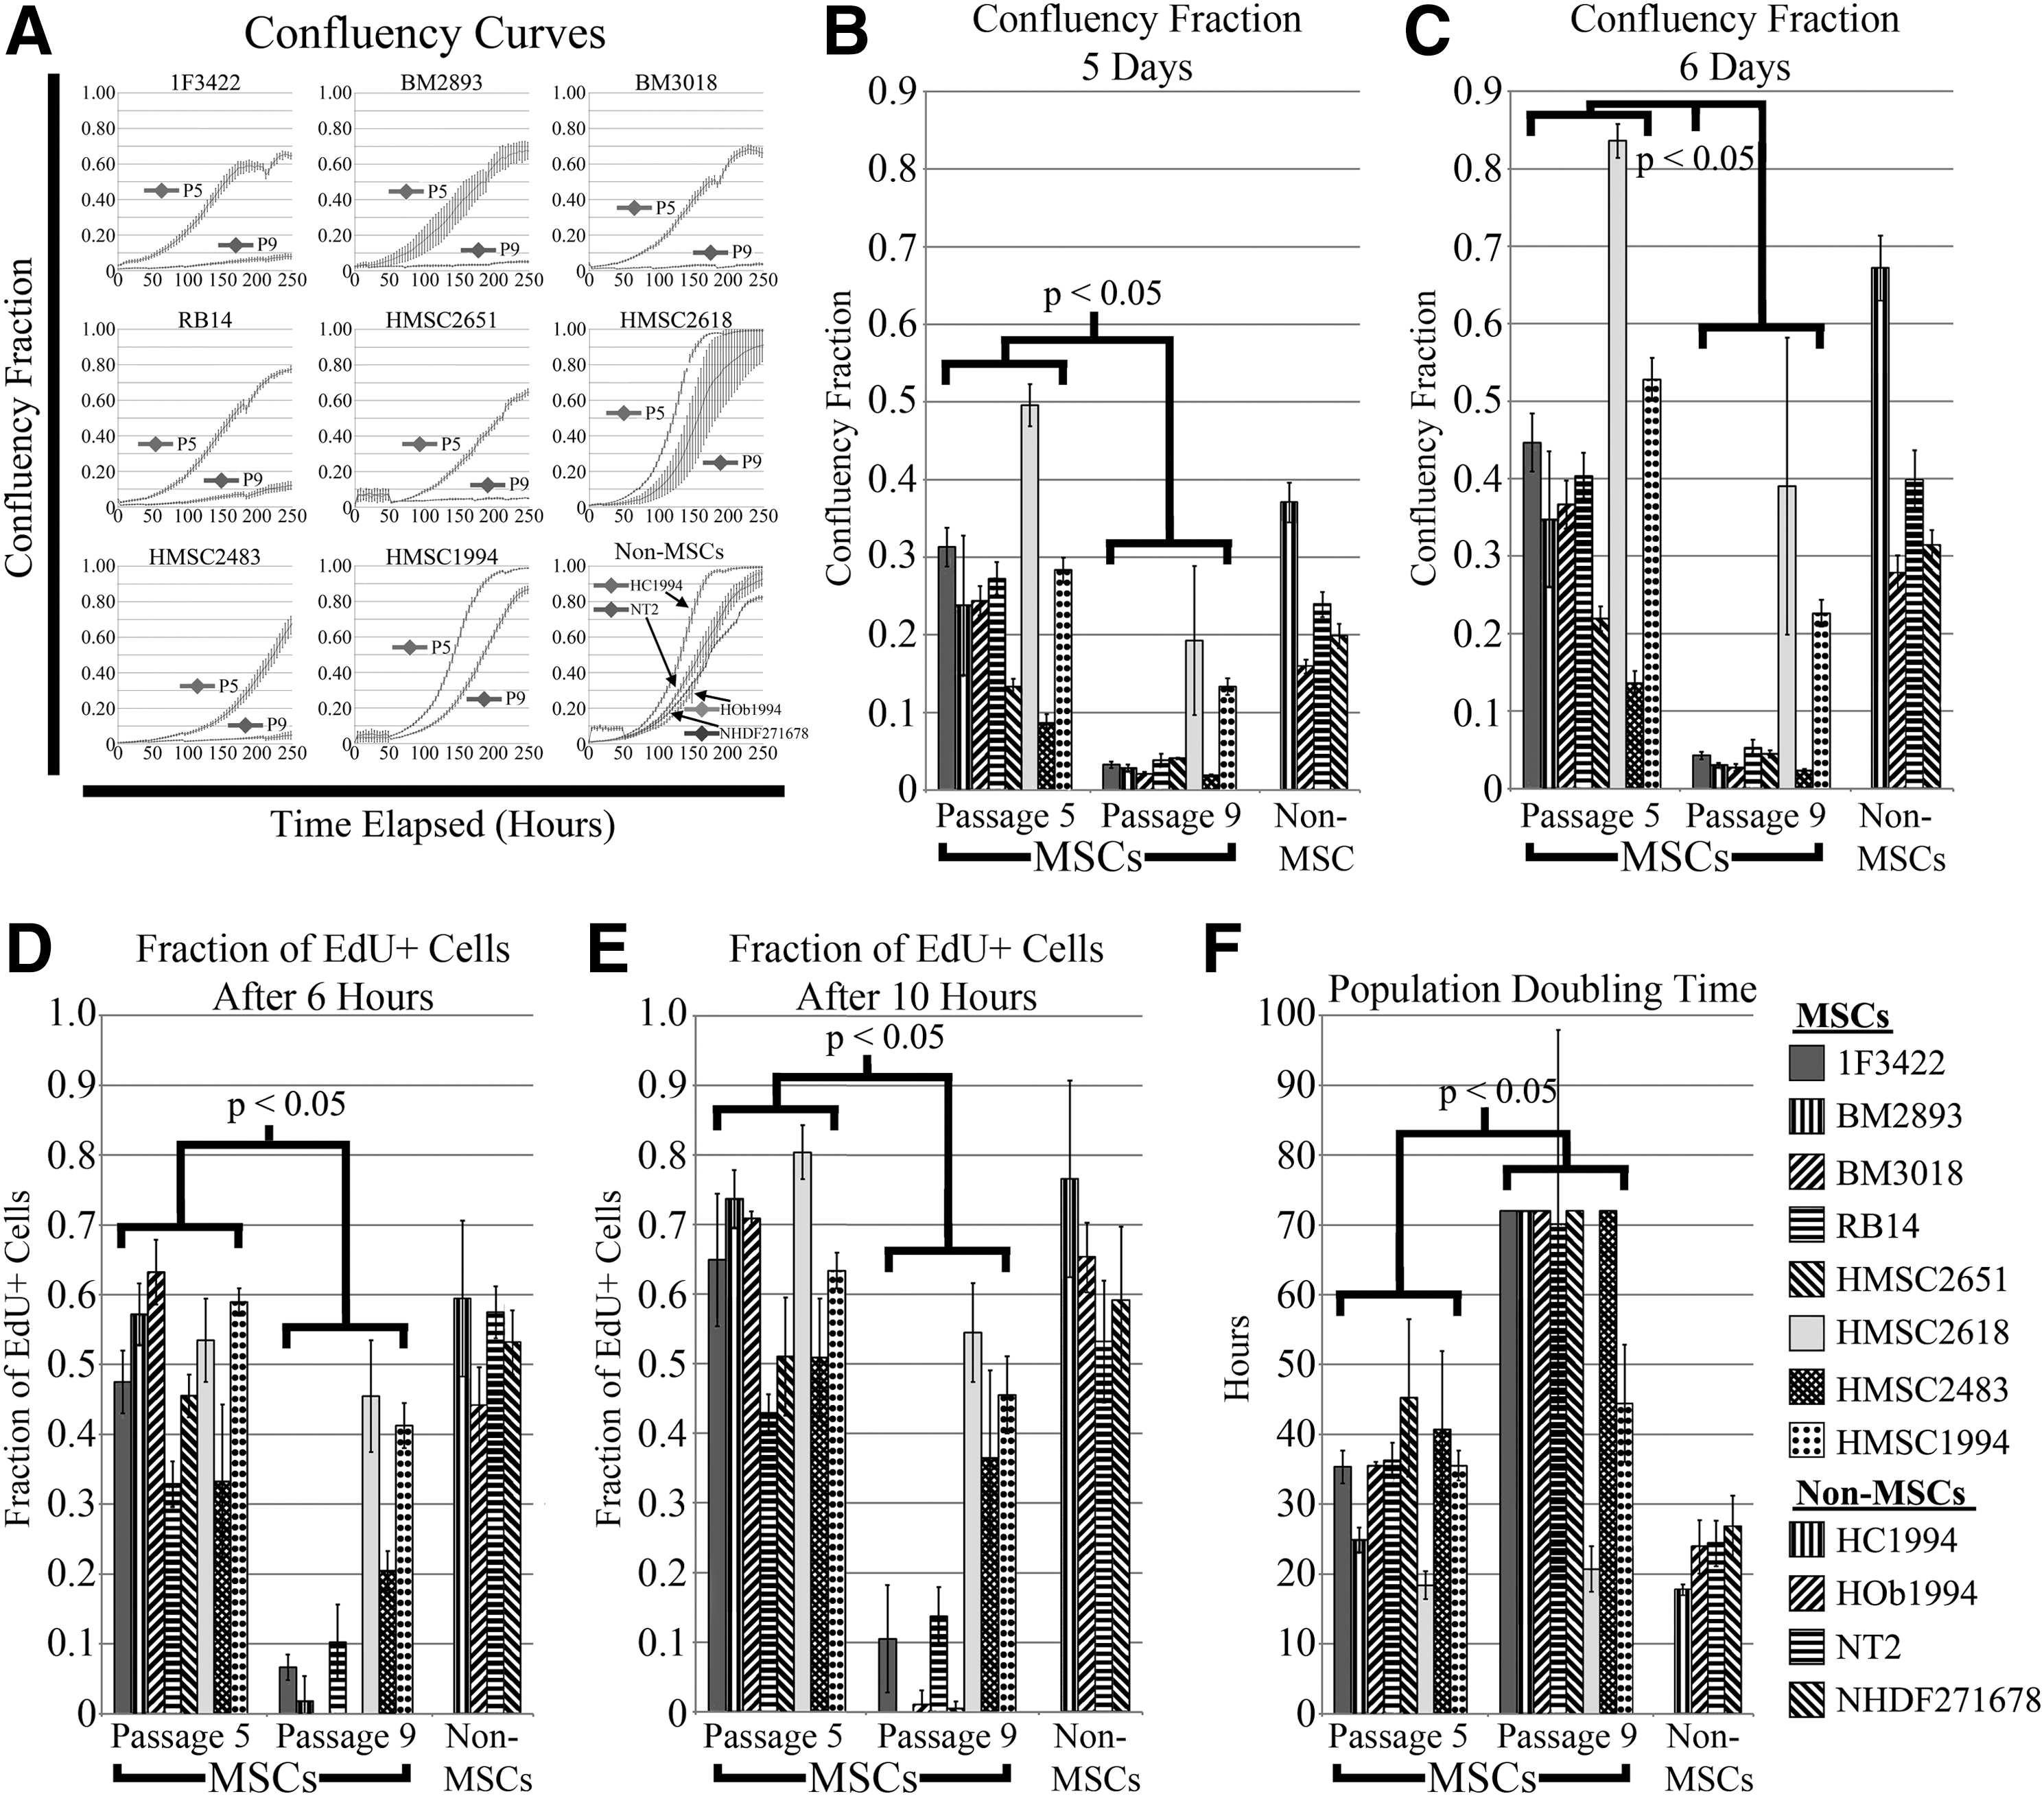
Confluency curves of MSCs at passages 5 and 9, as well as four other non-MSC cell types at passage 5
Inverse relationships were observed for population doubling time, where doubling time was significantly lower (P < 0.05) at the earlier passage MSCs in comparison to the later passage MSCs (Fig. 2F). By the population doubling time assay, only fetal MSCs, HMSC2618 and HMSC1994, showed substantial proliferation at passage 9 compared with other MSC donors. The population doubling time of the non-MSCs on average was lower than that of the MSCs at passage 5.
Overall, for MSC proliferation assays, proliferation potential was significantly different between early and late passages (Table 2). Comparing early passage to late passage for only adult MSC donors (n = 5), all five MSC proliferation measurements yielded statistically significant results. Nonetheless, significant differences between early and late passages for fetal MSCs (n = 3) were only significant for the measured confluency fraction at 5 days and fraction of EdU+ cells at 6 and 10 h. Comparing the measured differences of MSC proliferation between early and late passages for adult versus fetal MSCs, statistical significance (P < 0.05) was found for fraction of EdU+ cells at both hours (Table 2). This indicated that the differences in MSC proliferation between early and late passages for fetal MSCs are less than those in proliferation observed for MSCs derived from adults.
P5, passage 5; P9, passage 9; NS, not significant (P ≥ 0.05).
In addition to analyzing the differences in MSC proliferation between early and late passages, gene expression was also evaluated by multiple normalization techniques using each of the different housekeeping genes. The number of significant genes between passages 4 and 8 per normalization method varied from 16 to 24 significant genes (adjusted P < 0.05) with ranges in fold change from 2 to 32 (Fig. 3A, and Supplementary Table S4). Among all normalization methods, 15 genes were found to be statistically significant in common, where 14 genes were downregulated (P8 < P4) and 1 gene, CDKN1A, was upregulated (P8 > P4) (Fig. 3B). In exploring this gene profile in MSCs, unsupervised PCA of the samples revealed some minor degree of separation between passages 4 and 8 data due to the selection of the 29 genes from the microarray data analysis (Fig. 3C). However, the separation between passages 4 and 8 data is more apparent between the two groups with supervised PCA with the 15 commonly significant genes (Fig. 3E). Similar observations can be made for the unsupervised PCA by genes, where upregulated and downregulated genes are intermixed with the housekeeping genes (Fig. 3D). Once supervised, the 14 downregulated genes are separated from the one remaining upregulated gene by the five housekeeping genes without any intermixing (Fig. 3F).

A volcano plot visualizes the number of statistically significant genes between passages 4 and 8 for each of the normalization methods used
Correlation of RT-qPCR and MSC proliferation data confirmation set
Filtering of the RT-qPCR data to remove highly variable genes from the data set was performed as previously described with the microarray data. Genes with calculated slopes greater than the cutoff slope were then examined for statistical significance. This aided in the elimination of genes with correlation coefficients and calculated slopes close to zero regardless of the normalization method for the RT-qPCR data or proliferation assay measurement used to complete the correlation (Fig. 4A). For example, a different number of genes were found to have significant correlations with the proliferation data, fraction of EdU+ cells at 10 h, for each of the different normalization methods (Fig. 4B).

Using a regression model, a slope and correlation coefficient were calculated per gene for each of the cell proliferation assays for the second set of MSCs. A cutoff slope was determined per gene and per normalization method for all cell proliferation assays using the percent coefficient of variation and the technical variability per gene by RT-qPCR. Genes whose calculated slope from the regression model was greater than the cutoff slope for a given normalization method were considered to have passed this filter and subjected to further statistical analysis. The results presented are from the correlation of RT-qPCR data with the fraction of EdU+ cells after 10 hours
Ultimately, seven genes (BIRC5, CCNA2, CDC20, CDK1, PBK, PLK1, and SPC25) were observed to have common significance among all normalization methods when correlated with fraction of EdU+ cells at 10 h (Supplementary Table S5). These seven genes demonstrated a significant negative correlation between a majority of ΔCT values and other MSC proliferation measurements for all eight normalization methods (Supplementary Table S6). When population doubling time was correlated with gene expression, not all the seven genes were statistically significant for each normalization method (Supplementary Table S5). The median correlation coefficient of all seven genes/normalization methods was highest with the fraction of EdU+ cells after 10 h with a value of −0.789, whereas the confluency fraction at 5 and 6 days had the lowest median correlation value of all the genes/normalization methods, −0.630 and −0.623, respectively.
One gene, IQGAP, was observed to be significantly correlated with confluency fraction after 5 days for all normalizations (median r = −0.648) but not when correlated with other proliferation measurements. Comparing the median of correlation coefficients for the seven genes across different proliferation assays, ACTB and ST13 were the two normalization genes that consistently produced the highest correlation values. The normalization gene NACAD always produced the lowest median correlation coefficient for the seven genes of all the normalization methods.
When supervised PCA was performed by sample for the seven genes, separation was readily apparent between three poorly proliferative (by the EdU assay) MSCs at passage 8, BM2893, BM3018, and HMSC2651, compared with highly proliferative to moderate samples (Fig. 4C). One MSC sample, HMSC2651 at passage 4, is distinctly separated from both clusters in principal component space. Using supervised PCA by gene, the seven negatively correlated genes with proliferation are clearly separated from the housekeeping genes (Fig. 4D). Hierarchical clustering further demonstrates the gene expression correlation as illustrated by ranking the MSCs from the highest proliferative potential (HMSC2618 P4) to the lowest proliferative potential (BM2893 P8) with respect to fraction of EdU+ cells after 10 h (Fig. 4E). The correlation values for the seven genes when correlated with the fraction of EdU+ cells after 10 h are −0.815 (BIRC5), −0.800 (CCNA2), −0.826 (CDC20), −0.787 (CDK1), −0.775 (PBK), −0.826 (PLK1), and −0.779 (SPC25) when ACTB is used for normalization.
To evaluate whether the seven genes can predict the proliferative potential of non-MSCs, four cell lines, HC1994 (chondrocyte), HOb1994 (osteoblast), NHDF271678 (dermal fibroblast), and NT2 (embryonal carcinoma), were evaluated for gene expression and proliferation with the MSC samples. By supervised PCA using the seven identified genes, three of the four non-MSC samples clustered typically with highly proliferative MSC samples at the earlier passage (Fig. 5A). The HOb1994 at passage 4 was distant from the highly proliferative cluster as determined by the fraction of EdU+ cells after 10 h (Fig. 5B). MSC cell lines 1F3422, RB14, and HMSC2483 at passage 8 were slightly separated from the cluster of highly proliferative samples. Even further from the highly proliferative cluster were MSC samples BM2893, BM3018, and HMSC2651 at passage 8, which exhibited the lowest fraction of EdU+ cells after 10 h.

Supervised PCA of 7 genes (BIRC5, CCNA2, CDC20, CDK1, PBK, PLK1, and SPC25) for the MSCs and non-MSCs used to evaluate proliferation potential, where the samples are identified by different colors/shapes
Hierarchical clustering using MSCs and non-MSCs visualizes the gene expression patterning from the highest (HMSC2618 P4) to the lowest (BM2893 P8) ranking proliferative potential by the fraction of dividing cells after 10 h (Fig. 5C). The correlation values for the seven genes when correlated with the fraction of dividing cells after 10 h using all cell types are −0.743 (BIRC5), −0.566 (CCNA2), −0.759 (CDC20), −0.619 (CDK1), −0.792 (PBK), −0.803 (PLK1), and −0.782 (SPC25) when ACTB is used for normalization. Of the seven genes, only two genes, PBK and SPC25, exhibited slightly increased strength in correlation values when non-MSCs were included in the correlation analyses. However, a reduction in the strength of the correlation (based on the absolute value of the correlation coefficient) between gene expression and proliferation assays for the eight different normalization methods was observed for a majority of the values with the inclusion of non-MSCs in the analyses (Supplementary Table S6).
Discussion
The regenerative and therapeutic qualities of bone marrow-derived human MSCs may vary based on the donor, tissue type, isolation, and manufacturing method. Identifying markers that could predict therapeutic qualities of different MSC preparations represents a significant challenge to the field of regenerative medicine. Identifying markers that can predict the proliferation potential of MSCs may help address this challenge. Using gene expression data and proliferation assays, we attempted to identify gene markers that can predict the proliferation potential of MSCs. Our findings indicate that seven genes (BIRC5, CCNA2, CDC20, CDK1, PBK, PLK1, and SPC25) significantly correlate with MSC proliferation potential. These conclusions were drawn based on the experimental design used: (1) two platforms for measuring gene expression, (2) two different sets of MSCs with each set expanded in different media to numerous passages, and (3) multiple assays to measure MSC proliferation potential. Despite differences in normalization methods for the two gene expression platforms, seven genes showed consistent correlations with proliferation. Our data further suggest that the expression of these genes may be used for predicting the proliferation potential of MSC preparations regardless of culture conditions.
In our previous study to examine the differences in gene expression as a result of cellular aging, we found that significant differences observed between passages for both gene expression and cell division were not of consistent magnitude [27]. These observations in combination with respective differences in MSC differentiation, cell size, protein expression, immunosuppression, and epigenetic profiles complicate the process of identifying predictive markers of MSC quality [23,24,27 –29,32 –34]. Instead of evaluating these changes solely by passage, functional changes should be correlated with markers of interest as MSCs may reach senescence at different rates from different donors; thus, all MSC passages are not equal.
In this study, MSC microarray data from eight donors at multiple passages were correlated with two sets of proliferation data: confluency fraction and fraction of dividing cells. Following rigorous filtering and statistical analysis, a collection of 342 markers were identified as candidates that may be predictive of MSC proliferation. Similar efforts have been made by other investigators to evaluate aspects of MSC growth kinetics and senescence [20,35 –41]. In Ren et al., attempts were made to correlate MSC senescence, using β-galactosidase staining, with microarray data to determine the percentage of the maximum life span of clinical bone marrow-derived MSC products [20]. These researchers initially identified 155 age-correlated genes and further narrowed down this set to 24 genes that were used in a prediction model for the age of MSC samples at different passages. In another study by Wagner et al., researchers investigated the effect of long-term culture on replicative senescence of MSCs [40]. In addition to observing increases in cell size and a propensity for osteogenesis with later passages, differences in the expression of 36 genes were found to correlate with the onset of senescence following long-term culture.
In our study, from the 342-gene list identified for MSC proliferative potential using the microarray data, the top 24 genes exhibiting the strongest correlation with MSC proliferation and the greatest magnitude of change were selected for further evaluation. A new set of MSCs consisting of eight different donors expanded from passages 4 to 8 in different media was evaluated for their proliferative potential and gene expression by RT-qPCR. The goal of these experiments was to determine whether the 24 selected genes using the microarray data would maintain similar correlation trends using a different technological platform. One limitation in conducting this analysis was the difference in normalization methods between the microarray and RT-qPCR data. To resolve this issue, three new housekeeping genes that demonstrated consistent expression across all donors and passages in the microarray data were chosen for normalization in comparison to three common housekeeping genes (ACTB, GAPDH, and GUSB). For one of the three new housekeeping genes, no expression was observed and thus was not used in subsequent analyses.
For the majority of applied normalization methods, seven genes were consistently observed to be significantly and positively correlated with each of the MSC proliferation potential assays. These genes, BIRC5, CCNA2, CDC20, CDK1, PBK, PLK1, and SPC25, have previously been found to impact cell cycle and cell division [42 –48]. CCNA2 belongs to the cyclin family and is known to exhibit periodic protein expression throughout the cell cycle, which in turn promotes transitioning between the cell cycle phases, specifically during the late S/G2 phase when bound in a complex to CDK1 [49,50]. Likewise, four additional genes exhibiting high correlation with cell proliferation potential, CDC20, PBK, PLK1, and SPC25, are involved in the mitotic phase of the cell cycle for regulating chromosome alignment and chromosome separation during cell division [51 –54].
The BIRC5 gene, which is a member of the inhibitor of apoptosis gene family associated with binding and inhibiting caspases, also exhibited correlation with MSC proliferation potential [55]. It is typically expressed at low to absent levels in most normal adult tissue; however, a clear expression pattern is present in adult and fetal MSCs based on these results [56,57]. The expression of BIRC5 by MSCs may be due to the culture conditions, which can impact gene expression and MSC behavior. While a number of investigations have identified some of these genes as markers or targets for tumors, our results demonstrate that they may also be beneficial in identifying MSC population with acceptable cell growth [47,52,56,58].
Other genes tested, such as CDKN2A, CENPF, and TPX2, showed promise with their expression correlating with the different proliferation assays for some of the normalization methods, although not as consistently significant as the aforementioned seven genes. Comparing differences in MSC gene expression between passages 4 and 8, 15 genes are observed to be statistically significant (adjusted P < 0.05). Eight of the genes (CDKN1A, CENPF, HAS2, IQGAP3, KIF20B, KIF23, SGOL2, and TPX2) that can distinguish MSCs between early and late passages ultimately are not beneficial in predicting proliferative potential despite their involvement in the cell cycle and cell division.
When the expression of the seven most highly correlated genes is visualized by supervised PCA and hierarchical clustering, a discernable degree of separation is present between highly and lowly proliferative MSCs. Furthermore, individual MSC gene profiles of the seven genes had relatively comparable levels of expression (Fig. 4E). One MSC sample, HMSC2651 P4, exhibited dissimilar levels of expression across the set of seven genes, where lower expression of BIRC5, CDC20, and PLK1 is seen in comparison to the others and was distant from the cluster of highly proliferative MSC samples in the supervised PCA (Fig. 4C). Based on the expression profile of this MSC donor, it appears as an outlier; therefore, it most likely would not be a suitable candidate for further expansion.
Cell-based therapies are not just limited to bone marrow-derived MSCs; instead, researchers have explored the use of stem cells or tissue-specific cells for a given application [59 –65]. To evaluate the ability of the seven identified genes to predict cell proliferation potential, four non-MSC cell types, osteoblast, chondrocyte, dermal fibroblast, and embryonal carcinoma cell line, were included in an additional analysis with the MSC samples. The non-MSCs were characterized at an early passage and exhibited proliferation potentials tantamount or better to early passage MSCs; however, for the majority of correlations between different proliferation assays and normalization methods and genes, the strength of the correlation between gene expression and proliferation potential was reduced (Supplementary Table S6).
Using PCA, non-MSC cell lines typically clustered with MSC samples that exhibited high proliferation potential (Fig. 5A, B); however, one non-MSC cell line, HOb1994, was noticeably separated from the highly proliferative cluster. In contrast to most of the MSC expression profiles of the seven genes, the expression of three genes (SPC25, PLK1, and PBK) was drastically higher than that of the other four genes. Similarly, the expression profile of the NT2 sample, which also had a relatively high proliferative potential, had five genes (CCNA2, CDC20, CDK1, PLK1, and SPC25) expressed much higher than two other genes. Based on these data and limited sample size, we cannot confirm that these seven genes are good candidates for predicting proliferation potential beyond bone marrow-derived MSCs.
The work presented demonstrates that seven genes may be ideal candidates for predicting the proliferative potential of bone marrow-derived MSCs. This is important as many cell-based therapies require cellular expansion to generate sufficient cell numbers. Knowing whether a freshly harvested population of MSC has a high or low proliferative potential can greatly reduce costs associated with their manufacturing processes [66]. This gene expression analysis may be beneficial during the manufacturing process to expand and assess MSC proliferative potential. If the expression of a particular MSC population crosses a cutoff threshold that correlates with minimum lot release proliferation capacity criteria, then its expansion would be terminated. Assays that are used during cell manufacturing processes may be advantageous over ones applied after a freeze–thaw cycle. While the proliferation potential of a population of MSCs is significant, it is not the sole determining factor of its quality. The correlative methods used to identify markers of MSC proliferative potential are applicable to future work needed to identify potential markers that correlate with other important aspects of clinical applications, such as cellular engraftment, survival, motility, differentiation, and immunosuppression. Ultimately, identifying markers as performed using these methods can considerably aid in distinguishing an optimal population of MSCs for a desired therapeutic indication.
Footnotes
Acknowledgments
This project is supported by the Medical Countermeasures Initiative and the FDA Modernizing Science Initiative. We would like to thank Drs. Heba Degheidy and Bharat Joshi for reviewing the article. We would like to acknowledge the members of the FDA Modernizing Science Consortium for their discussion of the presented work.
Author Disclosure Statement
No competing financial interests exist.
References
Supplementary Material
Please find the following supplemental material available below.
For Open Access articles published under a Creative Commons License, all supplemental material carries the same license as the article it is associated with.
For non-Open Access articles published, all supplemental material carries a non-exclusive license, and permission requests for re-use of supplemental material or any part of supplemental material shall be sent directly to the copyright owner as specified in the copyright notice associated with the article.