
Abstract
Apert Syndrome (AS) is one of the most severe forms of craniosynostosis. It is caused by gain-of-function mutations in the receptor fibroblast growth factor receptor 2 (FGFR2), which leads to ligand-receptor promiscuity. Here, we aimed to better understand the behavior of mesenchymal stem cells (MSCs) and of fibroblastoid cells, cellular populations that are part of the suture complex, when stimulated with different fibroblast growth factors (FGFs). We also aimed to verify whether FGFR2 specificity loss due to AS mutations would change their signaling behavior. We tested this hypothesis through cell proliferation and differentiation assays and through gene expression profiling. We found that FGF19 and FGF10 increase proliferation of fibroblastoid cells harboring the FGFR2 p.S252W mutation, but not of mutant MSCs. FGF19 and FGF10 were associated with different expression profiles in p.S252W cells. Further, in accordance to our gene expression microarray data, FGF19 decreases bone differentiation rate of mutant fibroblastoid cells and increases bone differentiation rate of MSCs. This effect in osteogenesis appears to be mediated by BMP signaling. The present data indicate that non-natural FGFR2 ligands, such as FGF10 and FGF19, are important factors in the pathophysiology of AS. Further research is needed to determine the role of modulation of MSC proliferation or use of FGF19 or anti-BMP2 as inhibitors of osteogenesis in AS subjects’ cells, and whether these findings can be used in the clinical management of AS.
Introduction
T
To initiate the FGF-FGFR signaling cascade, a FGF must bind to a FGFR, which dimerizes and undergoes transactivation through tyrosine autophosphorylation. The main downstream signaling pathways activated by FGF-FGFR binding are RAS/MAPK, PI3K, and PLC pathways [6]. Since FGF-FGFR signaling has a ubiquitous role in development and in maintenance of homeostasis, germline gain-of-function mutations affecting this circuitry have disruptive consequences in several organs. Impairment or abnormalities in FGF-FGFR signaling has been linked to several diseases, including cancer, rickets, cleft lip and palate, skeletal dysplasias, and craniosynostosis [7,8]. Apert Syndrome (AS) is one of the most severe forms of syndromic craniosynostosis [9] and is characterized by premature closure of the coronal sutures, agenesis of the metopic and sagittal sutures, severe syndactyly of hands and feet and joint malformations [10]. Craniofacial surgery is required to release increased intracranial pressure and to normalize skull appearance. Nonetheless, resynostosis is a frequent hurdle after surgical intervention in Apert patients.
Among the best characterized FGFR2 recurrent mutations leading to AS are p.S252W (contributing to ∼75% of the cases) and p.P253R (accounting for almost 25% of the cases). Both p.S252W and p.P253R mutations are located in the extracellular portion of FGFR2 and cause loss of ligand binding specificity of the mesenchymal expressed isoform (FGFR2c) and of the epithelial expressed isoform (FGFR2b), leading to promiscuous receptors that can be activated by any of the FGF molecules, as demonstrated by plasmon resonance experiments [11 –13]. Crystal structure analysis of the interaction between FGFs and FGFR2 with p.S252W or p.P253R mutations has shown that FGFs with a hydrophobic amino acid at the residue corresponding to phe21 in FGF2 have increased affinity for p.S252W FGFR2 [14]. Therefore, as a consequence of p.S252W and p.P253R mutations, aberrant signaling caused by promiscuous FGF-FGFR2 bindings is proposed as the molecular cause of AS [15,16].
We have previously established that the p.S252W FGFR2 germline gain-of-function mutation is associated with a specific gene expression signature, comprised of transcripts not only associated with the overstimulation of the FGFR2 canonical downstream pathway, but also of transcripts that contribute to novel pathological signaling [17]. Moreover, we showed that this mutation has a more drastic effect in periosteal fibroblastoid cells than in mesenchymal stem cells (MSCs) and that this cell-type specific effect may contribute to the pathophysiology of AS [18], during both embryogenesis and childhood development. Even though different ligands can bind to FGFR2 and are considered to activate the same downstream networks, each ligand can produce a specific cellular behavior and, although receptor promiscuity is well established as the molecular cause of AS [19], the functional effects of the binding of different FGFs that do not naturally bind to FGFR2 in the cellular phenotype of AS is currently unknown. This knowledge is essential to better understand the pathophysiology of AS and to tackle the problem of resynostosis in AS following surgical intervention with a pharmacological strategy [20].
Here, we hypothesized that stimulation by different FGFs leads to distinct cellular behaviors in periosteum-derived fibroblastoid cells and in MSCs from AS subjects harboring the p.S252W mutation in FGFR2. We aimed to investigate changes dependent on the cellular context at the molecular and at the cellular levels elicited by activation of p.S252W FGFR2 by different ligands.
Materials and Methods
Subjects
Coronal suture periosteal tissue from four unrelated AS subjects (p.S252W mutation in FGFR2) and from three age- and sex-matched control subjects [wild-type (WT)] were obtained as previously described [17,18,21]. The presence of p.S252W FGFR2 mutation was confirmed by direct DNA sequencing and expression of mesenchyme-specific isoform of FGFR2 in the primary fibroblastoid cells was examined by western blot and RT-PCR. Only the expression of FGFR2c isoform in control and AS periosteal cells, with no apparent difference between these two, was observed [17,18,21].
The project was approved by the Research Ethics Committee—Human subjects (Comitê de ÉticaemPesquisa—SeresHumanos) at the Institute of Biosciences/University of Sao Paulo (protocol No. 024/2004) and was performed according to the amended Declaration of Helsinki. All patients and controls were already enrolled for treatment and surgery at the Department of Plastic Surgery, School of Medicine, University of Sao Paulo, when we contacted them. Thus, those who declined to participate or otherwise did not participate were not disadvantaged in any other way by not participating in the study. Appropriate informed consent was obtained for the donation of the periosteum, a tissue that is usually discarded during surgical treatment, so that this procedure would represent no harm for any of the subjects. Because all the participants were under the age of 18, legal guardians gave written consent on behalf of them.
Cell culture
Periosteal overlying the coronal suture harvested from AS patients or control individuals were used for both fibroblast and MSC extraction, as previously described [17,18,21]. Primary fibroblastoid cells (WT: n = 3; p.S252W FGFR2: n = 3) were grown in fibroblast growth medium [Dulbecco's modified Eagle medium (DMEM) High-Glucose, 20% fetal bovine serum (FBS; GIBCO), and 100 U/mL penicillin and 100 μg/mL streptomycin (1% penicillin streptomycin; GIBCO)]. MSCs (WT: n = 3; p.S252W FGFR2: n = 3) were grown in MSC growth medium (DMEM/F12, 10% FBS, 1% nonessential aminoacids, and 1% penicillin/streptomycin).
Cells were passaged at near confluency with trypsin-EDTA. All cells were cultured in a humidified incubator at 37°C and 5% CO2. All tests were performed between the third and the fifth subcultures. To further attest that both the surgical isolation of periosteum and the cell culture expansion procedure were leading to a homogeneous cell sample, we compared gene expression of MSC-specific and fibroblast-specific markers [22] in our cultures. Regardless of the presence of the FGFR2 gene mutations, fibroblastoid cell lines showed 1.48-fold higher expression of MMP1 and 1.74-higher expression of MMP3 compared to MSCs, while MSC lines had 1.77-fold increased expression of VCAM1 and 1.15-fold increased expression of ITGA11 compared to fibroblastoid lines.
We performed experiments in technical triplicates in each of the 12 cell lines. For all the experiments, we used all 12 cell lines for each condition, the exceptions are indicated by an “n” value. Thus, we tried to ensure that the results we obtained were representative of the biological variance seen in human patients.
Exogenous FGF treatment
Periosteal fibroblastoid cells were grown until they reached 80% of confluency. Cells were washed with 1 × phosphate-buffered saline (PBS) and then were serum-starved for 24 h in DMEM High-Glucose not supplemented with FBS. After this period, control condition cultures were grown in DMEM High-Glucose, 0.5% FBS while experimental condition cultures, in DMEM High-Glucose, 0.5% FBS (GIBCO) supplemented with recombinant human FGF2, FGF10, or FGF19 (PeproTech—diluted in 1 × PBS to a final concentration of 2,000 pM). Similar phosphorylation level of both WT and p.S252W FGFR2c was observed when treated with 2,000 pM of FGF [23].
Cell proliferation analysis
A density of 10,000 cells/cm2 was plated to each well of a 12-well flat bottom plate in fibroblast growth medium. After 24 h, when total cell adhesion was verified, the fibroblastoid cells were serum-starved for 24 h and MSCs for 48 h. At the initial time point (0 h), we changed the starvation medium (fibroblast growth medium or MSC growth medium without FBS) for the respective cell growth medium or starvation medium supplemented with FGFs. At the indicated time points, the cells were trypsinized and counted using Guava EasyCyte Flow Cytometer (Guava Technologies).
RNA extraction
Cells at a confluency of 80% in 25 cm2 cell culture flasks were used for FGFs 10, and 19 treatment followed by microarray and quantitative real-time polymerase chain reaction (qRT-PCR) assays. Following 24 h of exogenous FGF treatment, total RNA was isolated using Nucleospin RNA kit (Macherey-Nagel).
Microarray assays
For each RNA sample, complementary DNA (cDNA) was generated with the Affymetrix GeneChip WT cDNA Synthesis and Amplification Kit (Affymetrix) following the manufacturer's instructions. cDNA was fragmented and end labeled with the Affymetrix GeneChip WT Terminal Labeling Kit (Affymetrix). Approximately 5.5 μg of labeled DNA target was hybridized to the Affymetrix GeneChip Human Gene 1.0 ST array (Affymetrix) (which interrogates 28,869 well-annotated genes) at 45°C for 16 h per manufacturer's recommendation. Hybridized arrays were washed and stained on an Affymetrix GeneChip Fluidics Station 450 (Affymetrix) and scanned on an Affymetrix GCS 3000 (Affymetrix).
Intensity data were subjected to Robust Multichip Average (RMA) and afterward, to identify differentially expressed genes (DEGs), we used the Limma [24] and Rank-Prod [25] methods, available in the R/Bioconductor package, both with P value ≤0.05 adjusted by False Discovery Rate (FDR) correction factor. To minimize biological variations and focus on the effect of the ligand, we compared expression data of all three treated fibroblast populations, whether harboring the p.S252W mutation in FGFR2 or WT, with corresponding expression data of the same three untreated fibroblast populations. We extracted the genes that were commonly selected by the two different methods (RankProd and Limma) as significantly DEGs to minimize false positive occurrence.
The Limma method performs statistical analysis based on a moderate t-statistics to test the average difference in log expression levels between the treated and control groups for each gene [26]. The RankProd is a rank-based nonparametric method that uses geometric mean rank for each gene and its distribution is estimated by randomly permuting the observed ranks. The permutation principle partly alleviates the small sample sizes issue, enhancing the robustness against outliers [27].
To analyze the result, we used QIAGEN's Ingenuity Pathway Analysis (IPA®; QIAGEN Redwood City,
Hierarchical clustering was performed by average linkage of genes and arrays utilizing GEne Cluster 3.0 and visualized with Treeview [28].
Reverse transcription reactions and quantitative real-time polymerase chain reaction
cDNA was produced from 1 μg of total RNA using Superscript II reverse transcription kit (Invitrogen). qRT-PCR, assay was performed using ∼20 ng of cDNA and SYBR Green PCR master mix in an ABI Prism 7500 system (Applied Biosystems). Primers were designed with Primer Express software V.2.0 (Applied Biosystems) and the amplification efficiency (E) of each primer was calculated according to the equation: E = 10(−1/slope). The expression data of the studied transcripts was determined by relative quantification in comparison to endogenous controls (GAPDH, HMBS, HPRT1, and SDHA). Primers’ amplification efficiencies (E) were determined by serial cDNA dilutions expressed in log10 in which E = 10−1/slope. Expression of target genes was assessed relative to a calibrator cDNA pool (ΔCt).
We verified the gene expression stability of endogenous controls through geNorm VBA applet designed for Microsoft Excel [29]. Samples from all cells analyzed previously in Microarray assay were run in technical triplicates, and the threshold suggested by the instrument software was used to calculate Ct. Primers used in this study are summarized in Supplementary Table S1 (Supplementary Data are available online at
To assess the statistical significance of the correlation between microarray assay data and the qRT-PCR results we used the nonparametric two-tailed Spearman correlation test, with P values of <0.05 considered to be statistically significant.
In vitro osteogenic differentiation
To induce osteogenic differentiation, periosteal fibroblastoid cells and MSCs from three AS patients and from three controls were plated in 24-well plates (5 × 10³ cells/cm2) and cultured for 3 weeks in osteogenic medium [DMEM Low-Glucose, 0.5% FBS (GIBCO), 0.1 mM dexamethasone (Sigma-Aldrich Corp.), 50 mM ascorbate-2-phosphate (Sigma-Aldrich Corp.), 10 mM β-glycerophosphate (Sigma-Aldrich Corp.), and 1% penicillin streptomycin (GIBCO)]. For the coculture assay, the cells were plated at the same concentration onto 12-mm transwell inserts of 12-well plates, 0.4 μm pore size (Corning Costar). Media changes occurred every 3–4 days.
Alkaline phosphatase activity was assessed on the 9th day of differentiation through a biochemical assay. The cells were provided with phosphatase substrate (Sigma-Aldrich Corp.) and the resulting p-nitrophenol was measured colorimetrically by the use of a Multiskan EX ELISA plate reader (Thermo Scientific) at 405 nm.
After 14 and 21 days, calcified matrix production was analyzed by Alizarin red staining and quantification was done as previously described [30].
In vivo osteogenic differentiation
A 4.5 mm in diameter ceramic scaffold (60% hydroxyapatite and 40% of β-tricalcium phosphate; CellceramScaffdex™) was moistened with osteogenic medium and mixed with 106 human fibroblastoid cells or MSCs. The cells attached to the scaffold were predifferentiated in osteogenic medium and incubated at 37°C in 5% CO2 for 5 days.
For the in vivo differentiation we used eight nonimmunosuppressed (NIS) Wistar rats (all males, aged 2 months, weighing a maximum of 200 g as previously described by our group and approved by the Ethical Committee of our Institute [18,31]). We used a trephine bur of 4.5 mm diameter to obtain two cranial critical defects, which were made in the parietal region, lateral to the sagittal suture, where two scaffolds were implanted per animal, one side being filled by biomaterial alone (left defect) and the other by the biomaterial associated with cells (right defect).
The animals were kept in ventilated racks with standard conditions of temperature and lighting (22°C, 12 h light cycling per day) with free access to food and water. Four weeks after surgery, the rats were sacrificed in a CO2 chamber, as previously described by our group and approved by the Ethical Committee of our Institute [18,31]. The calvaria was removed and fixed in 10% formalin for 24 h and then decalcified in 5% formic acid for 48 h and embedded in paraffin. Slices of 5 μm were obtained and stained with hematoxylin and eosin.
We analyzed three transversal 4 μm slices of the calvaria with 10 μm of distance of each animal. Ossification area of each defect was calculated through Axio Vision Carl Zeiss based on 10 × amplified images obtained from Axio Observer.A1 Carl Zeiss microscope. The percentage of the defect area that ossified at the right side was normalized by the percentage of the defect area that ossified at the left side, so that for each animal we obtained three ratio values.
Statistical analysis
Continuous variables were expressed by mean and standard deviation, and the groups were compared by Student's t-test. A P value <0.05 was considered statistically significant. The tests were performed using the GraphPadInStat software (GraphPad).
Results
Exogenous FGF10 and FGF19 increases proliferation in fibroblastoid cells harboring p.S252W FGFR2 mutation
To verify whether different FGFs lead to similar functional changes in p.S252W FGFR2 cells [2], we selected FGFs that comprehensively represent all the six FGF subfamilies known, and based on the knowledge that FGFs overall have increased affinity for p.S252W FGFR2 [11]. We first screened the effect of seven FGFs (FGF2, FGF7, FGF8, FGF9, FGF10, FGF18, and FGF19) in the proliferation of p.S252W FGFR2 fibroblastoid cells (n = 1) compared with WT fibroblastoid cells (n = 1), in technical triplicates. As expected, only FGF2-treated control fibroblastoid cells showed a significant increase in proliferation (25%, P < 0.05) compared with untreated WT cells. Conversely, the proliferation of p.S252W FGFR2 fibroblastoid cells was significantly increased when treated with FGF2 (100%,P < 0.05), FGF10 (75%,P < 0.05), or FGF19 (125%,P < 0.01) (Fig. 1A, B). Noteworthy, both FGF10 and FGF19 are not natural ligands of the WT mesenchymal isoform of FGFR2, expressed in fibroblastoid cells [11]. Moreover, different than most FGFs, which works in a paracrine fashion, FGF19 is one of the three FGFs (ie, FGF19, FGF21, and FGF23) that have a systemic effect.

Cell proliferation rate of
We further confirmed this result in an additional set of p.S252W FGFR2 fibroblastoid cells (n = 2) and WT fibroblastoid cells (n = 2), all in technical triplicates and in passages 4–5 (Fig. 1C, D). All mutant cells showed a significant increase in proliferation in the presence of FGF2, FGF10, or FGF19 (Fig. 1D) while, confirming our previous results, the only significant increase observed in WT fibroblastoid cells was in the presence of FGF2 (Fig. 1C).
FGF10 and FGF19 have distinct effects on gene expression profile of p.S252W FGFR2 fibroblastoid cells
We have previously shown that activation of p.S252W FGFR2 by FGF2 not only exacerbates FGFR2 the canonical downstream signaling pathway but also induces abnormal novel molecular pathways [18]. Based on these previous observations and the more significant effects of FGF10 and FGF19 in the proliferation rate of p.S252W FGFR2 cells, two questions arise: (1) what are the downstream signaling circuitries activated by non-natural ligands binding to p.S252W FGFR2; and (2) whether this molecular signature is similar for FGF19 and FGF10. To address these questions, we performed whole transcriptome analysis in FGF10 and FGF19 treated p.S252W FGFR2 and WT fibroblastoid cells.
As expected, no significant functional enrichment of DEGs was observed in WT fibroblastoid cells when cells were treated with FGF10, since FGF10 does not bind to any of the FGFRs expressed in tissues of mesenchymal origin [11,32]. Contrariwise, treatment with FGF10 resulted in 59 DEGs in p.S252W FGFR2 fibroblastoid cells (Supplementary Table S2), of which, 10 are genes associated with inflammatory diseases (HLA-DMA, OR12D3, MOG, RING1, TCF19, C6ORF15, CLIC2, LY6G5C, and POP e XCL1), and immune response was the most enriched biological process (IPA: P < 0.001; GT: P < 0.001).
The most enriched gene interaction network, containing 8 out of the 59 genes, is associated with cellular development and cell cycle (Fig. 2A), and central nodes of this network are transcription regulators EZH2, E2F1, and TP53 (Fig. 2B), which are all key players in cell growth and development [33 –35]. Between the DEGs in WT cells treated with FGF10 and p. S252W cells treated with FGF10, there were five transcripts in common (Fig. 2D), four of which had opposite pattern of regulation: IGHV3-11-001 [Immunoglobulin Heavy Variable 3–11; Fold-change (FC) in WT: −4.15, FC in p.S252W: 3.17], LOC100132785 (gene of unknown function; FC in WT: −1.45, FC in p.S252W: 3.01), GOLGA6L1 (Golgin A6 family-like 1; FC in WT: 3.85, FC in p.S252W: −2.33), noncoding RNA: Mitochondrial tRNA pseudogene (FC in WT: 0.997, FC in p.S252W: −1.56). A noncoding RNA: small nucleolar RNA pseudogene transcript was the only one downregulated with FGF10 treatment in both WT and p.S252W fibroblastoid cells.

Most relevant gene interaction networks based on DEGs after treatment of fibroblastoid cells with exogenous FGFs.
Treatment of WT fibroblastoid cells with FGF19 is associated with the differential expression of 45 genes (Supplementary Table S3) and the most enriched biological function among these DEGs was also immune response (IPA: P < 0.001; GT: P < 0.05). Accordingly, six DEGs formed an interaction network enriched for antigen presentation and immune response (Fig. 2B). SMARCA4 and STAT3 are the two central nodes of this network (Fig. 2B). One of the signaling pathways associated with FGFR activation is the JAK-STAT pathway [36], which leads to nuclear translocation of STAT transcription factors, including STAT3.
Likewise, SMARCA4 is a transcriptional activator. Both proteins are essential from early development and knockout of either gene is embryonically lethal [37,38]. Addition of FGF19 to p.S252W FGFR2 fibroblastoid cell culture led to differential expression of 46 genes (Supplementary Table S4). The most enriched cellular functions were immune response (IPA: P < 0.05; GT: P < 0.05), cell proliferation (IPA: P < 0.05; GT <0.05), and ossification (IPA: P < 0.005; GT <0.01) (Fig. 2C). Central nodes of this network are STAT genes (STAT1 and STAT3), likely activated by the same mechanism as in WT cells treated with FGF19, and IRF genes (IRF3, IRF5, and IRF8) (Fig. 2C). IRF genes encode interferon regulatory factors, transcription factors used in the JAK-STAT signaling pathway [39]. There were two transcripts in common listed in WT cells treated with FGF19 and p. S252W cells treated with FGF19: noncoding RNA (ENST00000364918; FC in WT: −0.96, FC in p.S252W: 0.64) and noncoding RNA Mitochondrial tRNA pseudogene (ENST00000386778; FC in WT: 6.3, FC in p.S252W: 0.65). We selected 12 of the DEGs identified in the microarray experiments and performed qRT-PCR to corroborate the statistical analysis done in the microarray dataset.
We selected genes based on two different criteria: (1) genes that were found differentially expressed in more than one microarray comparison; (2) genes with the highest FC within each comparison. The genes chosen by criteria 1 were ARL17, BAT3, FAM60A, TCF19, and HLA-DMA. The genes chosen by criteria 2 were CFHR1, CLIC2, MGP, CKS2, DDX58, OAS3, and SAMHD1. The ΔΔCt from qRT-PCR and FC from the microarray experiment showed significant correlation (Supplementary Fig. S1), thus validating the microarray gene expression analysis.
To further address the question of whether non-natural FGF ligands lead to different downstream effects of mutant FGFR activation, we compared the results of p.S252W fibroblastoid cells treated with FGF10 and FGF19 and compared to the FGF2 activated cells (previously published in Yeh et al. [21]). Comparison of gene regulation between canonical (FGF2 treated) and noncanonical (FGF10 treated or FGF19 treated) FGFR2 activation showed that each FGF led to distinct DEG: only one transcript was found in common between the three conditions, RNA5SP502 (RNA, 5S ribosomal pseudogene 502) (Fig. 2D). Hierarchical clustering of the DEGs of each of the three conditions further attests that the molecular signature for FGF10 and FGF19 are different from the canonical FGFR2c activation gene expression profile, but they are distinct of each other (Fig. 2E).
FGF19 has opposite effects in the osteogenesis of p.S252W FGFR2 MSCs and fibroblastoid cells
Work by our group and others have previously shown that p.S252W and p.P253R mutations in FGFR2 respond differently to environmental factors depending on their cellular context, both in vitro and in vivo. Thus, we also analyzed cellular phenotypes in MSCs harboring the p.S252W in FGFR2, in response to FGFs10 and 19 and compared these results with those observed in fibroblastoid cells.
First, we verified whether treatment with FGFs 2, 10, and 19 had different effects in p.S252W FGFR2 MSCs when compared with WT MSCs. Proliferation of both p.S252W MSCs and WT MSCs was only significantly increased when adding FGF2 to the medium, but not when adding FGF10 or FGF19 (Fig. 1E, F).
Our microarray gene expression analysis has shown that FGF19, but not FGF10, alters the transcription of genes associated with ossification, one of the main physiological functions altered in AS. Moreover, a direct connection between FGF19 and AS has not yet been suggested. Therefore, we next aimed to dissect the impact of FGF19 in in vitro osteogenesis using different cellular context and in in vivo bone formation; FGF10 has been considered as additional control of the experiments. WT and p.S252W FGFR2 periosteal fibroblastoid cells and MSCs were treated with osteogenic induction medium supplemented with FGFs 10 or 19. As anticipated by the microarray results, no significant difference in osteogenic differentiation induced by FGF10 was observed in either cell types (data not shown). In osteogenic medium supplemented with FGF19, no difference was observed at early and late time points of osteogenesis in both cell types, as attested by analysis of alkaline phosphatase enzyme activity at day 9 and Alizarin red S staining at day 21 of in vitro osteogenesis (Fig. 3). However, by mid-osteogenesis (day 14), FGF19 significantly inhibited ossification in p.S252W FGFR2 fibroblastoid cells (P < 0.001, Fig. 3B), while in p.S252W FGF2 MSCs, FGF19 did not interfere in the osteogenic effect (Fig. 3E), as shown by Alizarin red S staining.
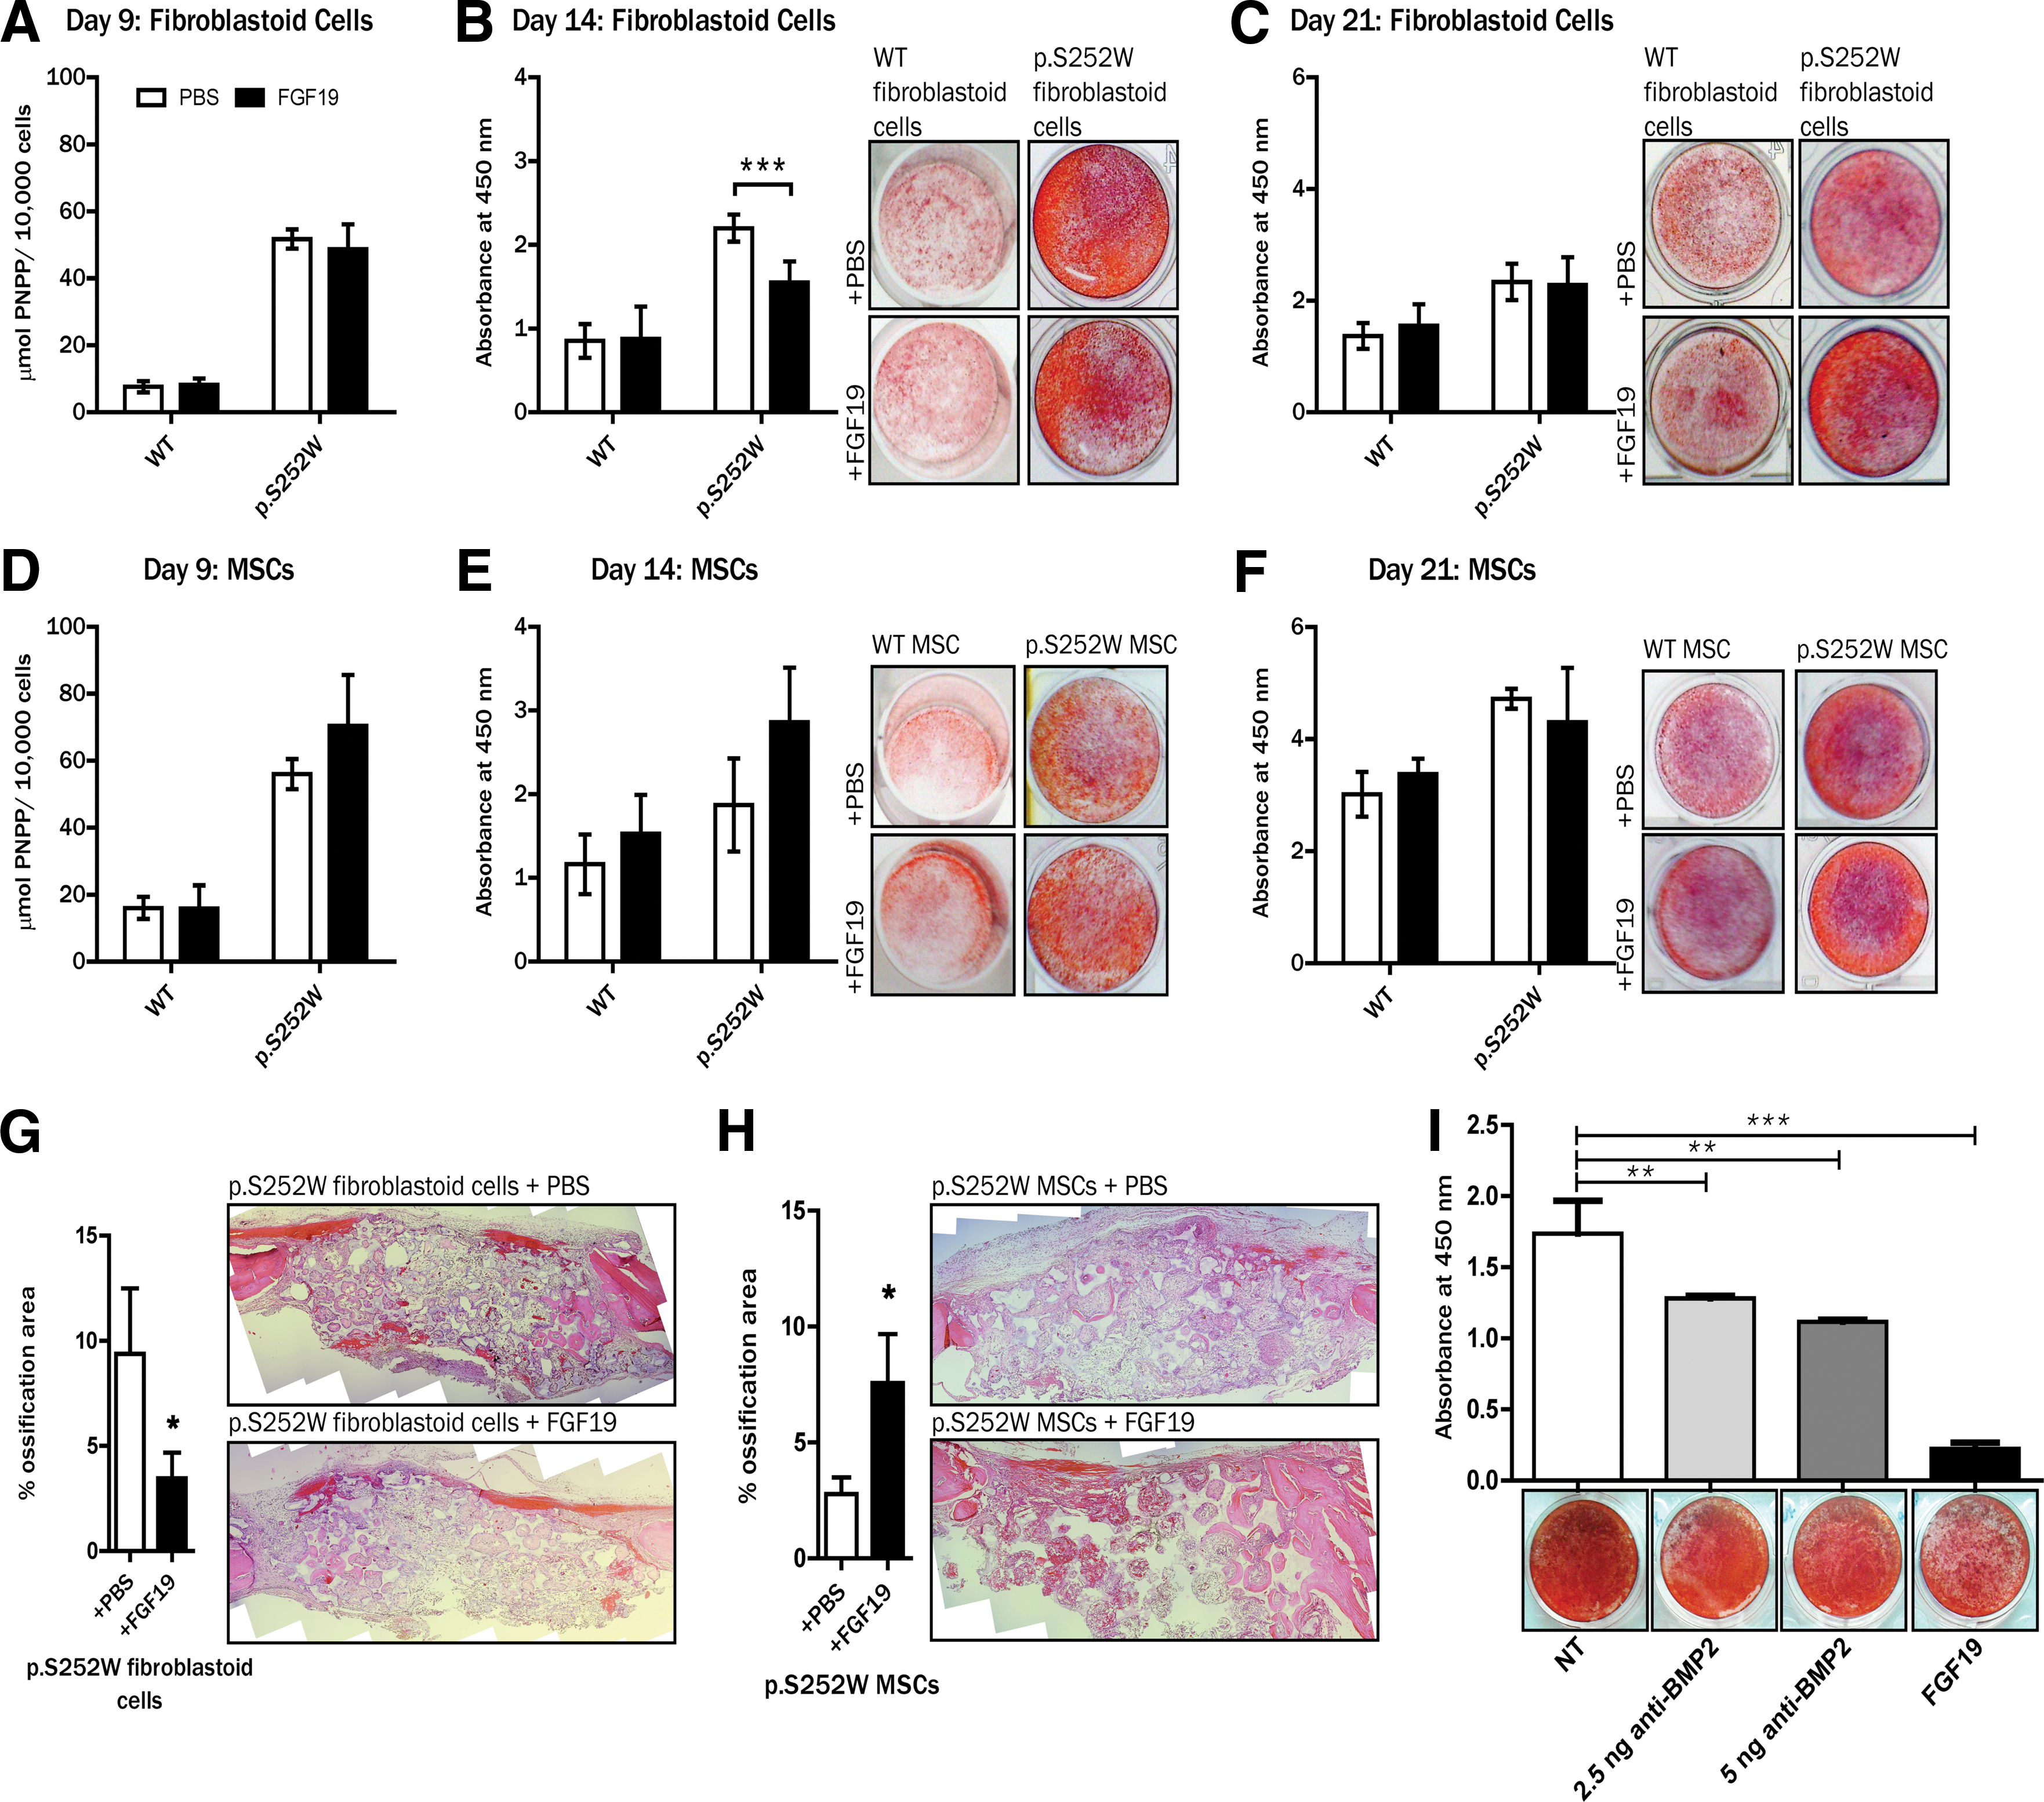
Comparison of in vitro osteogenic differentiation of fibroblastoid cells.
We next aimed to validate the differential effect of FGF19 in the osteogenic potential of p.S252W FGFR2 MSCs and fibroblastoid cells in an in vivo model. We adopted a bilateral cranial critical-size defect model using Wistar NIS rats as previously described by our group [18,31]. Fibroblastoid cells harboring the p.S252W FGFR2 were predifferentiated for 5 days with osteogenic medium. Defects where we introduced biomaterial associated with p.S252W FGFR2 fibroblastoid cells with FGF19-containing heparin beads displayed less ossification when compared with defects where we inserted the biomaterial associated with p.S252W FGFR2 fibroblastoid cells and without FGF19 (saline vs. +FGF19: P < 0.05; Fig. 3G). On the other hand, in defects where we introduced the biomaterial associated with p.S252W FGFR2 predifferentiated MSCs and FGF19-containing heparin beads, the bone neo-formation was increased compared with the defects where we inserted the biomaterial associated with p.S252W FGFR2 MSCs without FGF19 (saline vs. +FGF19: P < 0.05; Fig. 3H). In all groups, abundant loose connective tissue was observed filling the scaffolds’ pores in a heterogeneous distribution, showing the adhesion and cellular maintenance ability of this biomaterial. Bone tissue was distributed radially in the pores of all groups but a consistent and broad distribution of bony islands, including in the central areas of the implants, was observed when p.S252W FGFR2 MSCs were associated with FGF19 or when p.S252W FGFR2 fibroblastoid cells were transplanted free of recombinant FGF19.
FGF19 affects osteogenesis of p.S252W FGFR2 fibroblastoid cells through BMP signaling
One of the DEGs with the highest FC (FC = −2.4) induced by the presence of FGF19 in p.S252W FGFR2 fibroblastoid cells was NOG, which encodes the BMP signaling inhibitor NOGGIN. NOGGIN is well established in the literature as a suppressor of bone formation in vitro and in vivo [40 –42]. The transcription factor RUNX2 is a master regulator of osteoblast differentiation [43 –45] and BMP signaling is required for RUNX2-dependent osteogenesis [46]. Hence, to better determine the molecular mechanism underlying the differential effect of FGF19 in p.S252W FGFR2 fibroblastoid cells compared with p.S252W MSCs, we analyzed gene expression of these two pivotal osteogenesis markers, NOG and RUNX2, up to mid-osteodifferentiation (Fig. 4).
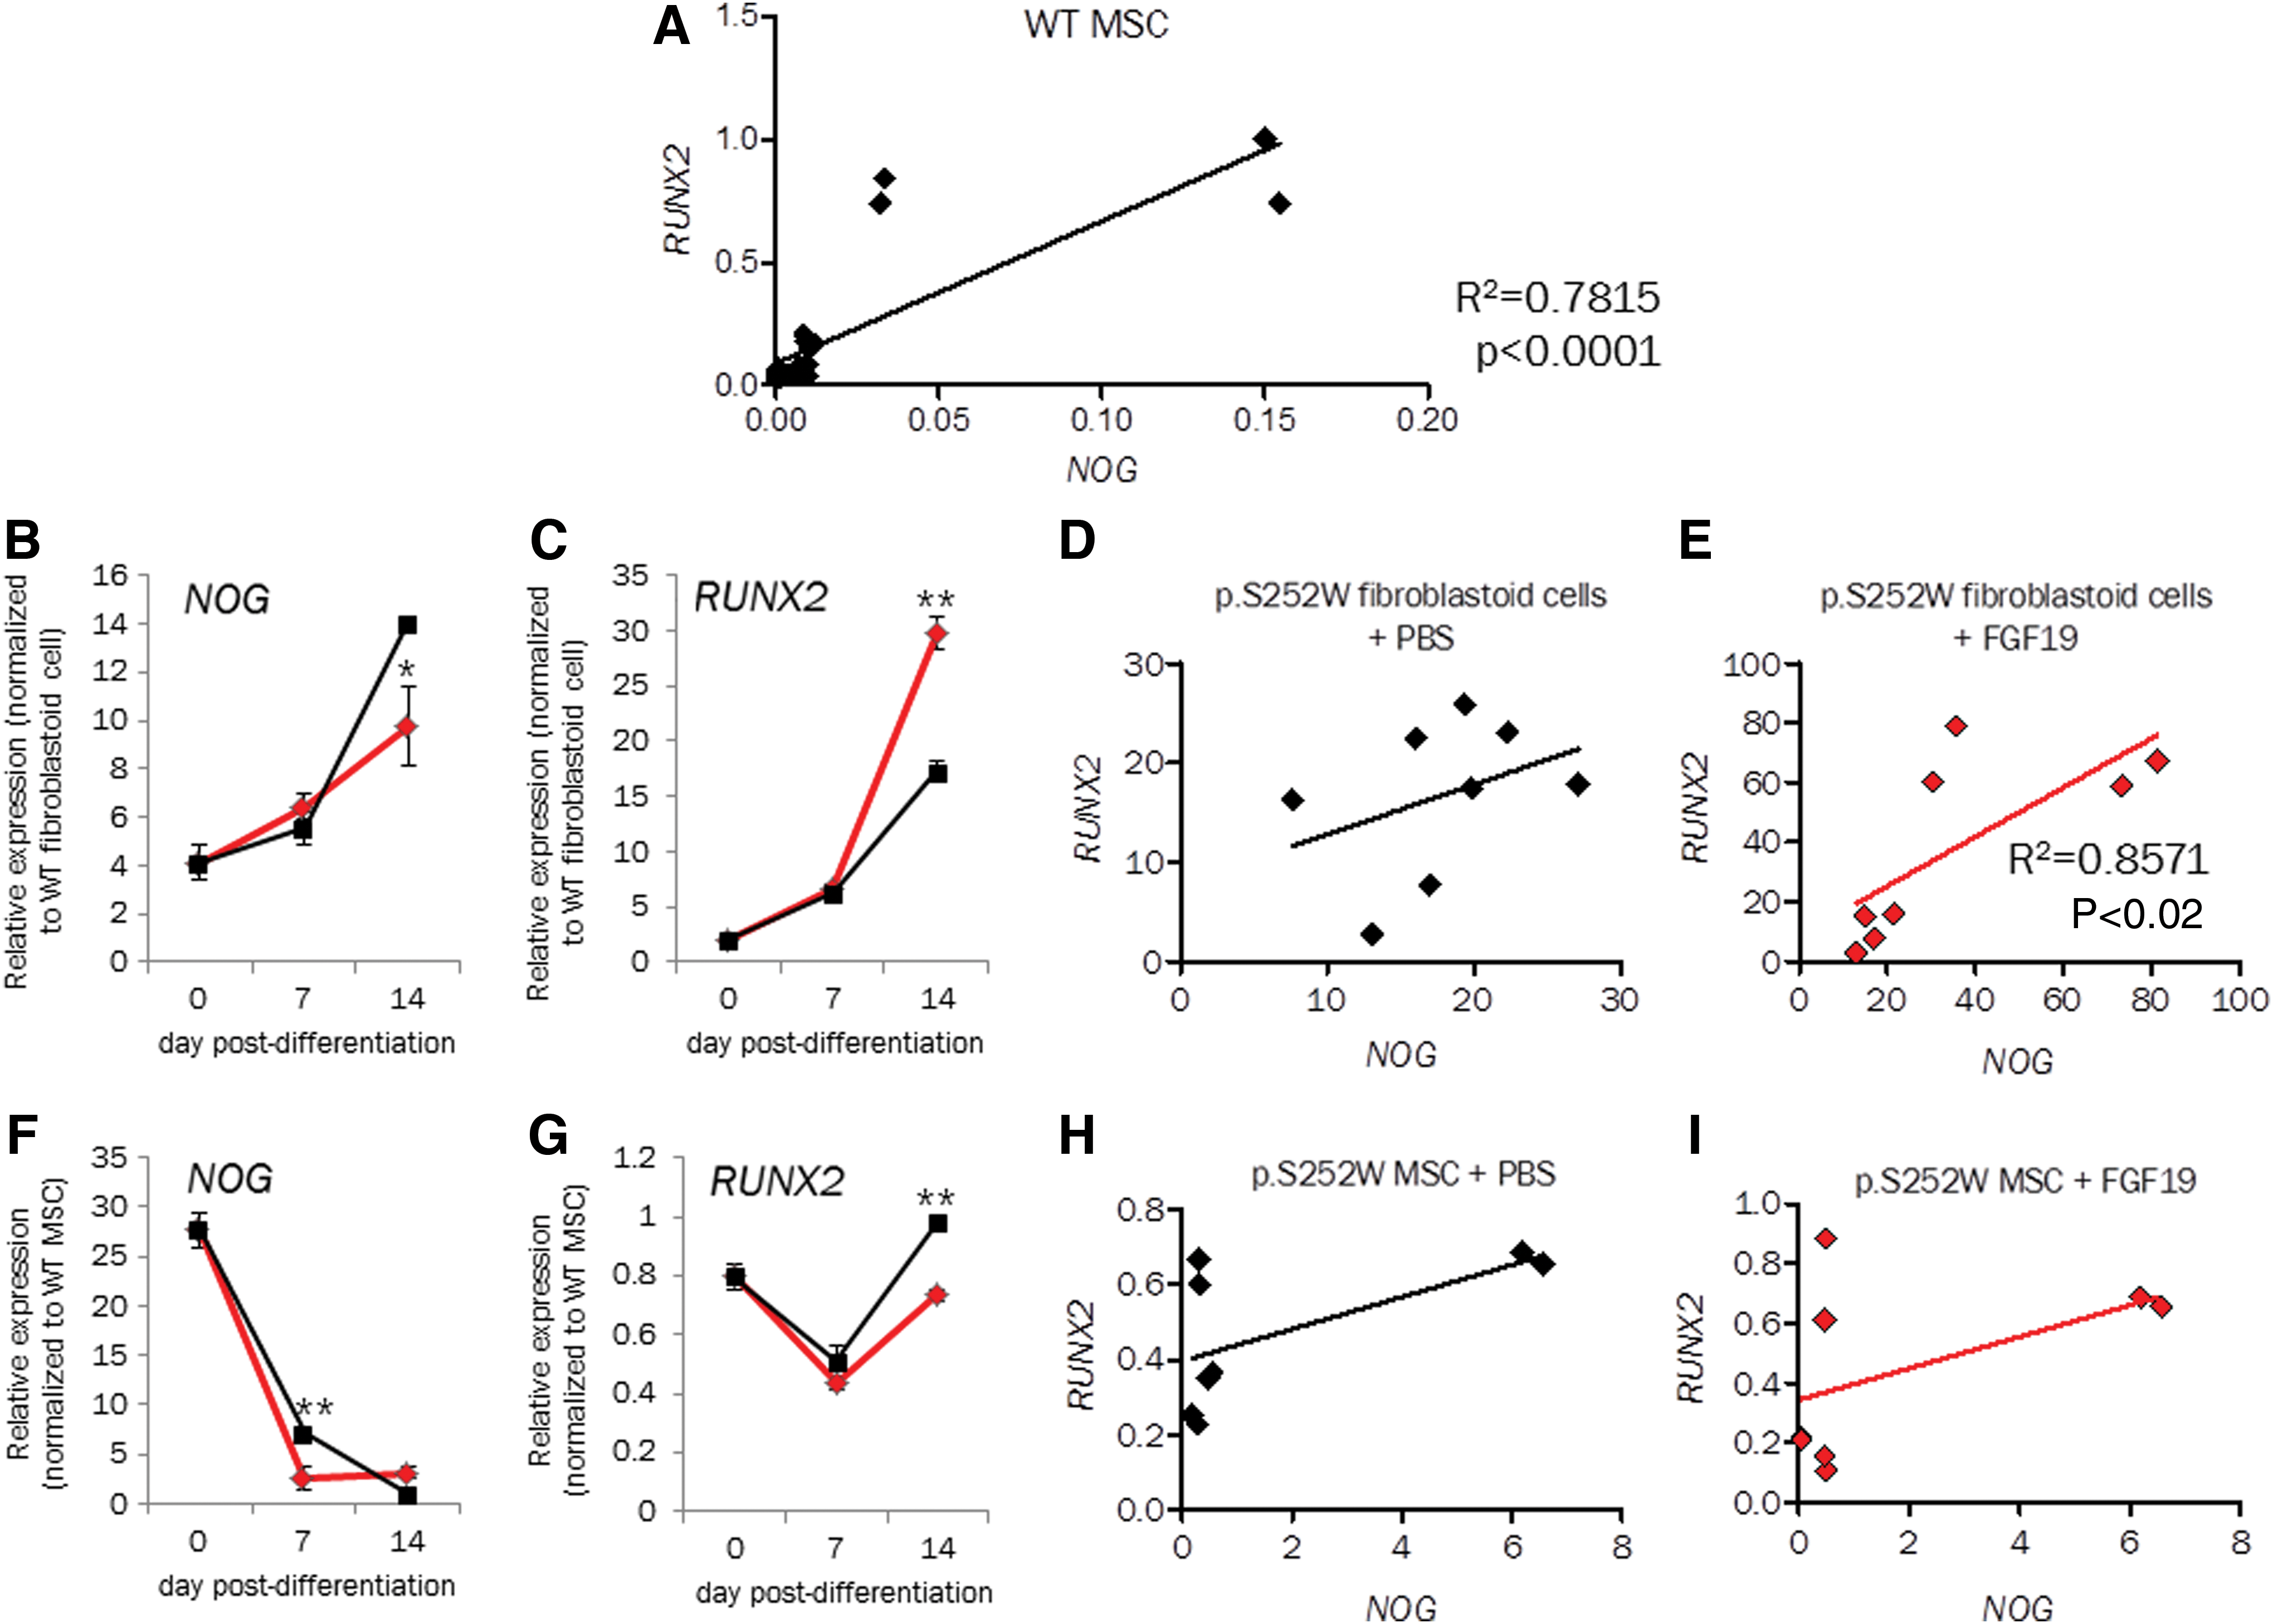
Analysis of NOG and RUNX2 expression in WT MSCs throughout osteodifferentiation shows that expression of both genes is highly correlated (Fig. 4A, R2 = 0.78; P < 0.0001).
At 14 days of in vitro osteodifferentiation, RUNX2 gene expression was downregulated by FGF19 (Fig. 4C), while NOG was upregulated by FGF19 (Fig. 4B) in p.S252W FGFR2 fibroblast. This is in agreement with the decrease in osteogenesis induced by FGF19 in p.S252W FGFR2 fibroblastoid cells cell cultures (Fig. 3B). Moreover, only in the presence of FGF19 the expression levels of RUNX2 and NOG are significantly associated (Spearman correlation: R2 = 8,571, P value <0.02, Fig. 4E), suggesting NOG and RUNX2 expression are independent in p.S252W FGFR2 fibroblastoid cells undergoing osteodifferentiation, but are both influenced by FGF19.
Meanwhile, in p.S252W FGFR2 MSCs, RUNX2 gene expression is slightly upregulated by FGF19 (Fig. 4G), while NOG is downregulated by FGF19 (Fig. 4F). Expression levels of these two genes are not correlated in p.S252W MSC cells even when treated with FGF19 (Fig. 4G, I). These data suggest that decreased osteogenesis induced by FGF19 activation of the mutant FGFR2 is likely associated with inhibition of BMP signaling by NOGGIN. They also suggest that NOGGIN and BMP signaling are potentially key regulators of p.S252W FGFR2 fibroblastoid cells’ osteogenesis.
Previously, we have shown that the premature suture fusion and resynostosis in AS subjects are likely the result of perturbations in FGF-FGFR2 signaling and in interactions between fibroblasts and MSCs at the cranial suture complex [17,18]. To test whether the effect of BMP2 inhibition or addition of FGF19 affects the interaction between the two cell populations with the p.S252W mutation, we used a coculture system to simulate the in vivo anatomic niche between the fibroblastoid cells and MSCs in the periosteum, allowing the paracrine signaling without physical cell interaction. As expected, we observed decreased formation of mineralized nodules as we increased the concentration of BMP2 antibody (Fig. 3I). Similarly, FGF19 decreased osteogenesis in the cocultures when compared with inhibition of BMP2 (Fig. 3I).
Discussion
The current model for cranial suture closure in AS is that imbalance of osteogenic proliferation/differentiation causes deregulation of cell cycle at the suture site and that osteogenic differentiation mediated by FGFR2 signaling leads to premature suture closure [47,48]. It is well established that FGFR2 gain-of-function mutations disturb ligand-receptor specificity and ligand-receptor binding stoichiometry, but their effects on cellular behavior in response to different FGFs are poorly defined. Here, we aimed to characterize these effects in AS subjects’ cells harboring the p.S252W mutation in FGFR2.
First, we used cell proliferation assays as a screening method to select which FGFs affect p.S252W FGFR2 mutant cell proliferation most significantly. As expected, proliferation of WT fibroblastoid cells increased when exposed to FGF2, a natural ligand of FGFR2c, the receptor isoform expressed in mesenchymal tissues. Even though FGFs 7 and 18 are also natural ligands of FGFR2c, they did not alter cell proliferation in WT fibroblastoid cells. Conversely, p.S252W FGFR2 fibroblastoid cells proliferated more when exposed to FGF2, FGF10, and FGF19. Since increased cell proliferation has been reported in cells harboring the p.S252W FGFR2 mutation [17,49 –52], we suggest that signaling by FGF10 and FGF19 is also an important factor leading to the altered proliferation seen in p.S252W FGFR2 fibroblastoid cells. While there is no previous information about the functional effect of FGF19 in p.S252W cells, there are several evidences reported in the literature that corroborate that illegitimate binding of FGFR2 to FGF10 is strongly implicated in the coronal suture pathology in AS: interaction of FGF10 with FGFR2 harboring the p.S252W has been shown by different approaches in both human and murine cells [12,23] further, the high local concentrations of FGF10, which is expressed in tissues of mesenchymal origin, allows an abnormal autocrine signaling loop through the pathological activation of mutant p.S252W FGFR2 [48].
Through transcriptome analysis in p.S252W FGFR2 fibroblastoid cells, we show that the most relevant signaling pathways induced by FGF10 and FGF19 do not coincide with those regulated by FGF2 [21]. In addition, our microarray analysis suggests that FGF10 led to an increase in the signaling pathways involved in immune response. Even though this correlation is still poorly explored in the literature, this finding goes along with the emerging evidence of a link between craniosynostosis and immunity, as suggested by the role of IL11RA-STAT3 pathway in craniosynostosis [48,53].
FGF19 is an atypical FGF that acts as a hormone, and is found in the bloodstream and the receptor with the highest affinity for the endocrine FGF19 is FGFR4, which is also expressed in these cells (data not shown).It was validated in different cell lines (Hela, HEK293, and DU145) that stimulation of FGFR4 by FGF19 leads to inhibition of the NFKβ, a factor involved in inflammatory response [54]. Interestingly, through microarray analysis in fibroblastoid cells, we found that FGF19 also leads to an enrichment of genes associated with inflammatory/immune response in both WT and p.S252W FGFR2 fibroblastoid cells. Even though these data need to be further validated, we speculate that this could be due to the activation of FGFR4 by FGF19. We also observed enrichment in transcripts associated with osteogenesis in p.S252W FGFR2 fibroblastoid cells, which in turn, might be triggered by the non-natural FGF19-p.S252W FGFR2 binding.
Literature concerning p.S252W and p.P253R mutations in FGFR2 have yielded different and even contradictory results regarding their effects in cellular phenotypes [51,52,55 –58]. We have previously shown that p.S252W mutation in FGFR2 confers a less drastic abnormal cell phenotype in MSCs when compared with fibroblastoid cells [18], suggesting that to understand the pathophysiology of FGFR2 mutations we need to take the cellular context into consideration. Therefore, we assayed proliferation and osteodifferentiation in cell types found in the coronal suture periosteal tissue (MSCs and fibroblastoid cells). Differently from what we observed in the screening for FGF-mediated alterations in cell proliferation in p.S252W FGFR2 fibroblastoid cells, only FGF2 increased proliferation in both WT and p.S252W FGFR2 MSCs. No effect was observed associated with FGF10 or FGF19 treatment.
The microarray finding that FGF19 caused differential expression of osteogenesis-related genes in p.S252W FGFR2 fibroblastoid cells prompted us to investigate the effects of FGF19 treatment during osteodifferentiation in both fibroblastoid cells and MSCs. In the mutant fibroblastoid cells, FGF19 decreased bone formation both in vitro and in vivo, corroborating the gene expression findings. In p.S252W MSCs, FGF19 did not affect osteogenic differentiation in vitro, while it increased differentiation in our in vivo model. This result is not actually discordant if taken into account that in vitro osteogenic differentiation lasts 21 days, while in the in vivo experiment the cells are predifferentiated for 5 days before transplanted to the critical defect in the rat and the animal is sacrificed 4 weeks later: the in vivo model rather shows the long-term effect of FGF19 in p.S252W MSCs osteodifferentiation. Nevertheless, these results highlight the opposing phenotypic effect of FGF19 in AS-derived cells with the same mutation.
The analysis of the expression profile of NOG and RUNX2 during in vitro osteogenesis showed that both genes correlate only in the p.S252W fibroblastoid cells when treated with FGF19, but not without FGF19 stimulation. This was not observed in p.S252W MSCs. FGF and BMP signaling are known to crosstalk and interact during bone development [59,60], but this is the first time an endocrine FGF has been shown to affect BMP signaling in p.S252W FGFR2 cells.
In summary, data presented in this article suggest that FGF10 and FGF19 are important factors contributing to the pathophysiology of AS by overstimulating proliferation or osteogenesis depending on the cellular context. Based on these findings, the relative balance of MSC and fibroblastoid cells should be a variable to be considered in the regulation of the rate of suture fusion in Apert patients. Future studies to investigate the inhibition of MSC proliferation or use of FGF19 or anti-BMP2 as inhibitors of osteogenesis in AS subjects’ cells are important to shed light on the clinical management of AS.
Footnotes
Acknowledgments
We are thankful to the medical surgery teams led by Nivaldo Alonso (Hospital das Clínicas-USP), and Sérgio Cavalheiro (UNIFESP) for providing the periosteal tissue used in this study. We would also like to thank Camila C. Ornelas, Kátia Rocha, Meire Aguena, and the Human Genome Center (HGC–USP) service team for tissue collection, cell bank maintenance, and patients’ mutation sequencing. We thank Constancia Gotto for secretarial assistance. This work was funded by grants from CEPID/São Paulo Research Foundation (FAPESP; 2013/08028-1) and the National Council for Scientific and Technological Development (CNPq).
Author Disclosure Statement
No competing financial interests exist.
References
Supplementary Material
Please find the following supplemental material available below.
For Open Access articles published under a Creative Commons License, all supplemental material carries the same license as the article it is associated with.
For non-Open Access articles published, all supplemental material carries a non-exclusive license, and permission requests for re-use of supplemental material or any part of supplemental material shall be sent directly to the copyright owner as specified in the copyright notice associated with the article.