
Abstract
Neural crest stem cells (NCSCs) are a population of multipotent stem cells that are distributed broadly in many tissues and organs and are capable of differentiating into a variety of cell types that are dispersed throughout three germ layers. We are interested in studying the effects of simulated microgravity on the survival and self-renewal of NCSCs. NCSCs extracted from the hair follicle bulge region of the rat whisker pad were cultured in vitro, respectively, in a 2D adherent environment and a 3D suspension environment using the rotatory cell culture system (RCCS) to simulate microgravity. We found that rat NCSCs (rNCSCs) cultured in the RCCS for 24 h showed disrupted organization of filamentous actin, increased globular actin level, formation of plasma membrane blebbing and neurite-like artifact, as well as decreased levels of cortactin and vimentin. Interestingly, ∼70% of RCCS-cultured rNCSCs co-expressed cleaved (active) caspase-3 and neuronal markers microtubule-associated protein 2 (MAP2) and Tuj1 instead of NCSC markers, suggesting stress-induced formation of neurite-like artifact in rNCSCs. In addition, rNCSCs showed increased C-X-C chemokine receptor 4 (CXCR4) expression, RhoA GTPase activation, Rho-associated kinase 1 (ROCK1) and p38 mitogen-activated protein kinase (MAPK) phosphorylation, and p53 expression in the nucleus. Incubation of rNCSCs with the Gα protein inhibitor pertussis toxin or CXCR4 siRNA during RCCS-culturing prevented cytoskeleton disorganization and plasma membrane blebbing, and it suppressed apoptosis of rNCSCs. Taken together, we demonstrate for the first time that simulated microgravity disrupts cytoskeleton organization and increases apoptosis of rNCSCs via upregulating CXCR4 expression and the RhoA-ROCK1-p38 MAPK-p53 signaling pathway.
Introduction
I
From the 1960s to 1990s, a variety of research has concluded that weightlessness caused animal dysmorphology, loss of directional growth, impaired reproduction and embryogenesis, disruption of cell morphology, divisions or cell–cell adhesion, decreased cell survival, etc., which may be associated with chromosomal rearrangements, instability of cellular structures and organelles, distortion of the mitotic mechanism, or perturbed concentration of intracellular calcium ions [3 –7]. Previous studies also indicated that the genes most susceptible to microgravity included those encoding cytoskeletal components, adhesion proteins, intracellular signaling molecules, transcription factors, as well as regulatory proteins of cell survival and differentiation [4,8].
In the 2000s, a lot of studies have shown the impacts of microgravity on regulation of cell cycle progression, proliferation, differentiation, and apoptosis of various types of cells cultured in vitro, including immortalized carcinoma cells and primary stem or progenitor cells. Interestingly, the effects of microgravity on cell behaviors may be opposite between different cell types, irrespective of immortalized, differentiated, or stem/progenitor cells.
For example, with regard to cell proliferation, microgravity exerts suppressive effects on proliferation of chicken osteoblasts, mouse and rat bone marrow mesenchymal stem cells (MSCs), human leukemia K562 and U937 cells, human hematopoietic bone marrow cells, human malignant glioma cells, monkey kidney cell line JTC-12, etc.[9 –14], but it exerts enhancive effects on proliferation of rabbit corneal keratocytes, human cord blood and adipose-derived MSCs, human epidermal and periodontal ligament stem cells, human and mouse oligodendrocyte progenitor cells, etc.[15 –20].
On the other hand, with regard to cell apoptosis, microgravity increases apoptosis of most types of cells or tissues [21 –34], except for human neuroblastoma cell line, peripheral blood mononuclear lymphocytes and colorectal carcinoma cells, rat bone marrow stromal cells, C57BL/6J mouse osteoblasts, and Sandos inbred mouse fetal skin fibroblasts, in which microgravity decreases apoptosis [35 –40].
Multiple lines of evidence have shown the cytoskeleton to be a major sensor of gravitational changes on cells [4,41 –43]. It has been demonstrated that both real and simulated microgravity disrupts cytoskeleton organization and/or actin polymerization in a variety of cells, including breast cancer cells, endothelial cells, epithelial cells, fibroblasts, glial tumor cells, lymphocytes, MSCs, osteoblasts, utricular hair cells, etc. [4,27,42,44 –48].
In response to gravitational changes, the cytoskeleton acts as both an effector and an activator of intracellular signal transduction pathways, and it, in turn, regulates cell morphology, adhesion, motility, apoptosis, cell cycle progression, etc. [4,41 –43]. Previous studies have revealed that microgravity increases the concentration of intracellular calcium ions, induces the intracellular translocation and activation of protein kinase C (PKC), and, in turn, regulates the morphology and remodeling of microfilaments [49 –52]. On stimulation by PKC, microfilaments and microtubules interact with the αs subunit of the Gs protein, activate adenylyl cyclase [53,54], and, thus, increase the generation of cyclic adenosine monophosphates (cAMP) [55,56], which further destabilizes the actin fibers and promotes disassembly of microfilaments [57 –59].
Simulated microgravity was also reported to destabilize microfilaments and disrupt stress fibers in endothelial cells, osteoblasts, and MSCs via suppressing the activity of the small GTPase RhoA, dephosphorylating and activating the actin-severing proteins cofilin and myosin phosphatase, and, therefore, inducing depolymerization of filamentous actin (F-actin) into globular actin (G-actin) [44,48,60]. Depolymerization of microfilaments was shown to be associated with increased activity of nitric oxide synthase (NOS) and production of nitric oxide (NO) [47,61,62], which would further inactivate RhoA as a negative feedback and induce adipogenesis of MSCs [63 –66].
Neural crest stem cells (NCSCs) are multipotent stem cells that are capable of differentiating into ectodermal (eg, neural and glial), mesodermal (mesenchymal), and endodermal (parafollicular) cell types during embryonic development [67 –72]. In adults, NCSCs mainly reside in the enteric nervous system, dorsal root ganglia, bone marrow, cornea, heart, carotid body, skin hair follicle, dental pulp, periodontal ligament, etc. [69,73 –79]. Because previous studies demonstrated that the proliferation, apoptosis, differentiation, and cytoskeleton organization of various multipotent stem cells are perturbed by microgravity [9,11,16 –18,20,44,80 –86], we were interested in studying the effects of microgravity on the behaviors of NCSCs.
In addition, previous studies reported that simulated microgravity inhibited differentiation of another type of adult multipotent stem cells, the MSCs from mouse [85]; whereas it enhanced differentiation of rat MSCs into neurons [81], and the conditioned medium of rat NCSCs (rNCSCs) has been shown to induce neuronal differentiation of PC12 cells [87]. Therefore, we were interested in analyzing whether simulated microgravity could exert a positive effect on neuronal differentiation of rNCSCs. We extracted NCSCs from the hair follicle bulges of rat whisker pads and cultured rNCSCs in a 3D suspension environment generated by the NASA-designed Synthecon™ rotary cell culture system (RCCS), which has proved to be capable of simulating microgravity [88,89].
We then analyzed the expression levels and patterns of NCSC markers along with markers of proliferation, apoptosis, differentiation, cytoskeleton components, intracellular signal transduction, and cell cycle regulation. Our findings indicate that RCCS culturing does not affect proliferation but disrupts cytoskeleton organization, induces formation of neurite-like artifact, and increases apoptosis in rNCSCs via up-regulating C-X-C chemokine receptor 4 (CXCR4) expression and RhoA GTPase activity as well as phosphorylating the Rho-associated kinase 1 (ROCK1) and p38 mitogen-activated protein kinase (MAPK).
Materials and Methods
Isolation and culture of rNCSCs
Animals used in this study were purchased from the National Laboratory Animal Center of National Applied Research Laboratories (Taipei, Taiwan), and approval was received from the Institutional Animal Care and Utilization Committee in the Laboratory Animal Center of National Defense Medical Center. The procedures of isolating, culturing, and expanding rNCSCs in vitro were similar to those previously described for mouse NCSCs [90,91]. Briefly, totally three male and three female Sprague–Dawley rats at 6–8 weeks old were sacrificed by carbon dioxide euthanasia, followed by whole-body immersion in a 1:1 mixture of betadine and hydrogen peroxide for about 3 min for disinfection. After squirting the facial region with 75% ethanol, the rats were placed on a dissection microscope in a laminar flow hood, and the whisker pads were dissected and pooled in Hank's balanced salt solution (HBSS; Thermo Scientific HyClone). The whisker follicles were then cut with straight scissors without injuring hair bulbs, and loose adipose and dermal tissues were flushed out with HBSS buffer.
The clean hair follicles were pinned onto a Sylgard-coated glass petri dish and cut longitudinally with a microblade till the appearance of blood, which was then flushed out with HBSS. After making a transverse cut above the level of the cavernous sinus and another cut at the level within the ring sinus, the hair bulges were readily rolled out of the collagen capsule with a bent tungsten needle and, subsequently, washed in a new culture plate in HBSS.
After washing, the isolated hair follicles were individually cultured in the RPMI 1640 medium that was supplemented with L-glutamine (GIBCO®, Thermo Fisher Scientific Co.), 15% fetal bovine serum (Thermo Scientific HyClone), and 4% AmnioMAX™-II complete medium (GIBCO, Thermo Fisher Scientific) in new 10-cm petri dishes at 37°C with 5% CO2. The dermal papilla explants of hair follicles outgrew and adhered to the petri dishes. Fifty percent of the old culture medium was replaced with new freshly made medium every day. After 4–5 days, it was detected under the microscope that highly migratory cells emigrated out of the dermal papilla explants and showed stellate morphology and absence of cell–cell contacts. These cells were rNCSCs.
The emigrated rNCSCs were then digested with 0.1% trypsin-EDTA (Invitrogen, Thermo Fisher Scientific) for 2 min at 37°C, centrifuged for 5 min at 300 g, and, finally, passaged to be seeded in new petri dishes at a density of 1 × 10⁶/mL. Subsequently, rNCSCs were passaged every 3–4 days to avoid a high cell density stimulating NCSC differentiation. The rNCSCs of 10–15 passages were used for the following experiments. We found that the cell growth rate, viability, and expression levels and patterns of all protein markers analyzed in this study were indistinguishable among rNCSCs isolated from the six different Sprague–Dawley rats.
Cell counting
Total numbers of rNCSCs were counted by both the hemocytometer and the ADAM-MC automatic cell counter by NanoEnTek, Inc. Both methods obtained identical results. For counting by the hemocytometer, we diluted the culture medium containing rNCSCs for 10-fold and extracted 10 μL of it to mix with an equal volume (10 μL) of trypan blue. As apoptotic and necrotic cells had damaged plasma membranes that were permeable to trypan blue staining and, hence, were deep-blue colored, only the semitransparent and round cells were live and counted.
Cell viability analyses
The cell viability was analyzed by the Vybrant® MTT [3-(4,5-dimethylthiazol-2-yl)-2,5-diphenyltetrazolium bromide] cell viability assay kit (Thermo Fisher Scientific). Briefly, 10 μL of 12 mM MTT stock solution was added per 100 μL of freshly replaced medium containing rNCSCs, followed by incubation at 37°C for 2 h, and the reaction was terminated by adding 100 μL of the sodium dodecyl sulfate (SDS)-HCl solution and incubating at 37°C for 4 h. The relative concentration of the solubilized formazan was then determined by reading the optical absorbance at 570 nm. The viability of rNCSCs right after dissociation and centrifugation but before subculturing (into different groups) was set up as the control value (ie, 100% viability).
Encapsulation and decapsulation of rNCSCs
Alginic acid is a type of natural polysaccharides that forms a moisturizing, extracellular matrix and an eggshell-like structure on combination with calcium ions [92]. The hydrogel beads formed by alginic acid provide a three-dimensional growth environment for a high density of the encapsulated cells, and they maintain cell–cell adhesions and cell–matrix interactions mimicking the physiological condition [92 –94]. The procedures of encapsulation and decapsulation of cells both into and out of alginate hydrogel beads have been previously described [93,94]. To encapsulate rNCSCs in hydrogel beads, we mixed 1 mL of 1 × 10⁶/mL of rNCSCs homogeneously with 1 mL of a mixture of 2.2% (w/v) low-viscosity alginic acid (Sigma-Aldrich) and 0.2% (v/v) gelatin (Sigma-Aldrich) in 1× phosphate-buffered saline (PBS) solution at pH 7.4 (Thermo Fisher Scientific).
The mixed cell–gel solution was then pipetted into a 3-mL syringe (Becton, Dickinson and Company) with a 25-G needle (Becton, Dickinson and Company) and injected drop by drop by gently stirring 1 × PBS solution (pH 7.4) containing 100 mM calcium chloride (CaCl2; Sigma-Aldrich) and 10 mM N-(2-hydroxyethyl) piperazine-N-(2-ethane sulfonic acid) (HEPES) (Sigma-Aldrich). On contact with the CaCl2 solution, spherical hydrogel beads formed and gradually swelled to ∼2.3–2.5 mm in diameter in 6–8 min of stirring at room temperature. The beads were then washed three times in 1 × PBS and cultured in rNCSC maintenance medium (as described earlier) in the rotary cell culture system (RCCS) or the 2D culturing petri dish.
After 24–48 h of culturing, the hydrogel beads-carrying culture medium was removed from the RCCS or the 2D culturing petri dish, collected into 15-mL conical centrifuge tubes (Becton Dickinson Biosciences), and centrifuged at 300 g for 5 min. For decapsulation, the pellets of rNCSC-harboring hydrogel beads were resuspended in 1 × PBS containing 50 mM trisodium citrate dihydrate (Sigma-Aldrich), 77 mM sodium chloride (Sigma-Aldrich), and 10 mM HEPES (Sigma-Aldrich), and they were gently shaken several times for 5 min at 37°C to depolymerize the hydrogel beads. Decapsulated rNCSCs were collected by centrifugation at 300 g for 5 min and washed in 1 × PBS. rNCSC pellets were centrifuged again at 200 g for 5 min and 2D-cultured in new medium till they adhered to the new petri dish (∼in 12–24 h).
Culture of rNCSCs in the RCCS
The RCCS (Synthecon, Inc.) used in this study includes four small rotating wall vessels (RWVs) that were 0.025 m in radius and 10 mL in size. Through one hole of an RWV, 5 mL of rNCSC maintenance medium without cells was infused before injection of another 5 mL of culture medium containing rNCSC-harboring hydrogel beads, which carried totally 1 × 10⁶ cells. Meanwhile, through the other hole of the same RWV, an empty 5-mL syringe was inserted to exhaust excess air and to avoid the appearance of air bubbles in the medium. The filled 10-mL vessel was then installed onto the RCCS and set up to rotate clockwise at an angular velocity of 12 rpm, that is, 12 revolutions per minute, which equals to the angular displacement in 12 × 2π radians per 60 s, that is, ∼1.2566 rads/s.
According to previous reports [47,95], the formula for simulated microgravity (g′) is: g′ = ω 2 R/g 0, where g 0 = 9.81 m/sec2 being the Earth's gravitational acceleration, R = radius from the center of rotation, and ω = angular displacement in radians/time taken (θ/τ). Therefore, the simulated microgravity in our study is calculated as g′ = (1.2566 rads/s)2 × 0.025 m/(9.81 m/s2) = 4.024 × 10⁻³.
Real-time quantitative RT-PCR of CXCR4
Total RNA was extracted from decapsulated rNCSCs immediately after culturing (in either the 2D environment or the RCCS) using the RNAqueous®-Micro total RNA isolation kit (Ambion, Thermo Fisher Scientific) followed by reverse transcription with SuperScript® III First-Strand Synthesis System (Invitrogen, Thermo Fisher Scientific). The synthesized cDNA was mixed with the CXCR4 primer sets (forward: 5′-CGTCGTGCACAA GTGGATCT-3′, reverse: 5′-GTTCAGGCAACAGTGGAAGA-3′) and the Platinum® SYBR® Green qPCR SuperMix-UDG (Invitrogen, Thermo Fisher Scientific), followed by real-time quantitative PCRs using the Applied Biosystems® 7500 Fast Real-time PCR System (Applied Biosystems Group, Thermo Fisher Scientific) located in the Instrument Center of National Defense Medical Center.
The cDNA of 18S rRNA was amplified by the QuantumRNA™ Classic 18S Internal Standard kit (Ambion, Thermo Fisher Scientific) and used as a normalization control for CXCR4 expression. The cycling program was set up as a 2 min hold at 50°C for UDG incubation followed by 2 min at 95°C and 40 cycles of 95°C for 3 s and of 60°C for 30 s. The expected sizes of the RT-PCR products for CXCR4 and 18S rRNA are 60 and 99 base pairs, respectively.
The results of real-time PCR were analyzed by the DDCt method based on the cycle threshold (Ct) values. The mean Ct values for CXCR4 were normalized against the mean Ct values for 18S rRNA from the same samples, and the quantitative CXCR4 expression was calculated using 2−ΔΔCt, where ΔΔCt = ΔCtCXCR4 − ΔCt18S rRNA. The relative levels of CXCR4 expression in different samples were calculated in comparison with the expression level in 2D-cultured rNCSCs, which was presumptively set up as 1.0.
CXCR4 siRNA transfection
The oligonucleotides of CXCR4 siRNA, negative control siRNA, and positive control (GAPDH) siRNA were all obtained from Thermo Fisher Scientific. The sequence of the 21-mer antisense CXCR4 siRNA was 5′-UCGUAAUACGGUAGCCAGCAGdTdT-3′, corresponding to nucleotides 808 − 828 of the NCBI reference sequence NM_022205. We used the Silencer ® GAPDH siRNA (Thermo Fisher Scientific) for rat as a positive control and the Silencer Negative Control siRNA (Thermo Fisher Scientific) as a negative control. Next, 3 × 10⁵ cells/mL of rNCSCs seeded in six-well culture plates (Nunc, Thermo Scientific) were grown to be 70%−90% confluent, washed, and transferred to serum-free medium, followed by transfection with 2.5 μg of siRNA per well using the Lipofectamine® 2000 Reagent kit (Invitrogen, Thermo Fisher Scientific) in accordance with the manufacturer's instructions.
After 24 h, the siRNA-transfected rNCSCs were washed and transferred to complete maintenance medium, and they were then cultured separately under 2D and 3D (RCCS) conditions at a density of 1 × 10⁶ cells/mL.
Pertussis toxin treatment
Pertussis toxin (PTX) has been shown to inhibit the activity of the α subunit of the heterotrimeric G protein (Gα) via catalyzing ADP-ribosylation and inducing structural changes of Gα [96,97]. We incubated rNCSCs in the maintenance medium at 37°C for 4 h in the presence of 100, 250, 500, or 1,000 ng/mL of PTX (Calbiochem, Merck Millipore), respectively, before culturing in the RCCS. We found that 500 ng/mL of PTX was sufficient to inhibit more than 99% of RhoA GTPase activation and neural differentiation of rNCSCs under simulated microgravity, whereas 1,000 ng/mL of PTX exhibited cell toxicity and greatly decreased the number of rNCSCs. Therefore, we chose to use the concentration of 500 ng/mL of PTX throughout this study.
Immunofluorescence staining
For immunostaining, 1.5 × 10⁵ cells/mL of decapsulated and petri dish-adhered rNCSCs were seeded in 12-well culture plates (Nunc, Thermo Scientific) and cultured for 12 h (till all cells have adhered to the bottom of the plates) in the maintenance medium described earlier. The medium was then aspirated carefully without touching the rNCSCs, which were adhered to the bottom of the plate. The cells were then washed three times in 1 × PBS at pH 7.4, for 5 min each time, followed by fixation in 1 mL of 4% paraformaldehyde (PFA) (Sigma-Aldrich) in PBS for 20 min.
After washing again with 1 × PBS three times, the fixed cells were permeabilized with 0.5% Triton X-100 for 10 min, then blocked with 10% bovine serum albumin (BSA; Sigma-Aldrich) in 1 × PBS for 1 h, to prevent high background signals of immunostaining from non-specific binding of primary and secondary antibodies.
The rNCSCs were then incubated with the following primary antibodies or conjugates that were diluted in 1 × PBS for overnight at 4°C: anti-cleaved caspase-3 (goat polyclonal, 1:100 dilution; Santa Cruz Biotechnology), anti-cortactin (rabbit polyclonal, 1:250 dilution; Abcam), anti-CXCR4 (rabbit polyclonal, 1:100 dilution; Abcam), anti-FoxD3 (rabbit polyclonal, 1:100 dilution; Santa Cruz Biotechnology), anti-microtubule-associated protein 2 (MAP2; mouse monoclonal with the clone number HM-2; 1:500 dilution; Abcam), anti-p21WAF1/Cip1 (mouse monoclonal with the clone number CP74, 1:100 dilution; Sigma-Aldrich), anti-p38-α MAP Kinase (mouse monoclonal with the clone number p38-3F11, 1:500 dilution; Invitrogen, Thermo Fisher Scientific), anti-phospho-p38 MAPK (pT180/pY182) (rabbit polyclonal, 1:1,000 dilution; Invitrogen, Thermo Fisher Scientific), anti-p53 (mouse monoclonal with the clone number PAb 122, 1:1,000 dilution; Invitrogen, Thermo Fisher Scientific), anti-p75 (rabbit polyclonal, 1:400 dilution; Abcam), anti-active RhoA GTPase (mouse monoclonal with the clone number 26904, 1:100 dilution; NewEast Biosciences), anti-ROCK1 (mouse monoclonal with the clone number B-1, 1:100 dilution; Santa Cruz Biotechnology), anti-phospho-ROCK1 (pS1333) (rabbit polyclonal, 1:100 dilution; GeneTex), anti-Snai1 (mouse monoclonal with the clone number G-7, 1:100 dilution; Santa Cruz Biotechnology), anti-Sox10 (rabbit polyclonal, 1:1,000 dilution; Abcam), anti-Tuj1 (mouse monoclonal with the clone number TU-20, 1:1,000 dilution; Abcam), anti-vimentin (mouse monoclonal with the clone number RV202, 1:500 dilution; Abcam), bovine pancreatic deoxyribonuclease I conjugated to Alexa Fluor® 594 (1:100 dilution; Molecular Probes, Thermo Fisher Scientific), and phalloidin conjugated to Alexa Fluor® 488 (1:40 dilution; Molecular Probes, Thermo Fisher Scientific).
For isotype negative controls, mouse monoclonal IgG1 (with the clone number NCG01), rabbit polyclonal IgG, and goat polyclonal IgG from Abcam were applied at the same concentration as the respective primary antibodies. On the second day, the cells were washed three times in 1 × PBS and blocked for 20 min with 10% BSA in 1 × PBS, followed by incubation at room temperature for 1 h with the following secondary antibodies conjugated with fluorophores: donkey anti-mouse Alexa Fluor 488, donkey anti-mouse Alexa Fluor® 555, donkey anti-rabbit Alexa Fluor 488, donkey anti-rabbit Alexa Fluor 555, donkey anti-goat Alexa Fluor 555, and donkey anti-goat Alexa Fluor® 350 (Molecular Probes, Thermo Fisher Scientific).
After 1 h, the cells were washed in 1 × PBS again, followed by counter-staining with 10 μg/mL of DAPI (1:1,000 dilution; Molecular Probes, Thermo Fisher Scientific) in 1 × PBS for 10 min. Subsequently, the cells were washed and stored in 1 × PBS, followed by photographing under the AXIO observer inverted fluorescence microscope (Zeiss). In line with the fluorescence intensities of different fluorochromes, the exposure time of the AxioCam HRc color CCD camera was set as 300 ms for DAPI, 360 ms for Alexa Fluor 488, and 400 ms for Alexa Fluor 555. Both isotype negative controls and no primary antibody controls showed no specific staining with only very few background signals (Supplementary Fig. S1 and data not shown; Supplementary Data are available online at
For analysis of cell proliferation, the Click-iT™ EdU Alexa Fluor 555 Imaging Kit (Invitrogen and Molecular Probes, Thermo Fisher Scientific) was used. Briefly, 1.5 × 10⁵ cells/mL of decapsulated and petri dish-adhered rNCSCs were cultured in the 1:1 mixture of the maintenance medium and 20 μM solution of EdU for 12 h in 12-well culture plates (Nunc, Thermo Scientific), followed by fixation in 4% PFA and permeabilization with 0.5% Triton X-100, same as described earlier in the immunostaining procedure. After washing with 1 × PBS containing 3% BSA, 0.5 mL of Click-iT reaction cocktail was added to each well and incubated for 30 min with protection from light. After EdU labeling, the rNCSCs were washed three times in 1 × PBS and blocked for 20 min with 10% BSA in 1 × PBS, followed by immunostaining with primary antibodies.
For analysis of cell apoptosis, the Click-iT® TUNEL Alexa Fluor 488 Imaging Kit (Invitrogen and Molecular Probes, Thermo Fisher Scientific) was used. Briefly, the decapsulated and petri dish-adhered rNCSCs were fixed and permeabilized as described earlier in the immunostaining procedure, followed by washing twice with deionized and distilled water and incubation with TdT reaction buffer for 10 min at room temperature.
After removing the TdT reaction buffer, the TdT reaction cocktail was added to each well and incubated for 1 h at 37°C, followed by washing twice with 1 × PBS containing 3% BSA. The rNCSCs were then incubated with the Click-iT reaction cocktail for 30 min at room temperature with protection from light, followed by washing in 1 × PBS three times, blocking with 10% BSA in 1 × PBS for 20 min, and finally immunostaining with primary antibodies.
Quantitative and statistical analyses
The image files obtained from the Zeiss fluorescence microscope were input into the Count Nuclei/Cell Sorting Application Module for MetaMorph (MetaMorph Offline vers. 7.0; Universal Imaging Corporation™) for quantitative analyses and comparison among the following groups of rNCSCs: 2D-cultured, RCCS-cultured, RCCS-cultured with PTX treatment, and RCCS-cultured with CXCR4 siRNA transfection. Briefly, for cell counting, the numbers of rNCSCs or nuclei stained with different colors of fluorescence (red or green) and the total numbers of DAPI-stained nuclei were, respectively, counted on the image files of each experimental group.
The statistical histogram in Supplementary Fig. S2 listed the total cell numbers in each group of rNCSCs counted for immunostaining signals of each protein marker in each well of the 12-well culture plates [n = 12, P > 0.05, one-way analysis of variance (ANOVA)]. The average percentages of positive rNCSCs or nuclei in each experimental group were calculated as follows: (the summary of numbers of cells or nuclei stained with red or green fluorescence on all images)/(the summary of total numbers of DAPI+ nuclei on all images) × 100%.
For comparison of fluorescent intensities, a specified unit of area (eg, a defined range of the cytoplasm or nucleus) in the 2D-cultured rNCSCs was set up to quantify the fluorescent intensity within the area, which was recorded as a standard value, and the same unit of area was picked up from rNCSCs in the other experimental groups (ie, the RCCS-cultured, PTX-treated, or CXCR4 siRNA-transfected groups), followed by quantification of fluorescent intensity within the area and comparison with the standard value. The relative intensity of a specific marker within an experimental group was calculated by the summation of relative values obtained from all units of areas on all image files within that group, and it was quantified as a fold change of the standard value.
For statistical analyses, we performed one-way ANOVA with post hoc tests of Duncan's multiple-range test and Scheffé's method, which analyzed both the within-group variation and the between-group variation and calculated the relative ratios by use of the SPSS 20.2 software (International Business Machines Corporation). The data of total cell numbers after 24-h culture, relative CXCR4 mRNA expression levels, and positive cell percentages for different markers were all analyzed and compared both within and between groups by one-way ANOVA.
The groups of rNCSCs compared on total cell numbers after 24-h culture include: 2D-cultured without hydrogel beads, 2D-cultured without hydrogel beads and with PTX treatment, 2D-cultured without hydrogel beads and with CXCR4 siRNA transfection, 2D-cultured in hydrogel beads, 2D-cultured in hydrogel beads with PTX treatment, 2D-cultured in hydrogel beads with CXCR4 siRNA transfection, RCCS-cultured (in hydrogel beads), RCCS-cultured (in hydrogel beads) with PTX treatment, and RCCS-cultured (in hydrogel beads) with CXCR4 siRNA transfection (n = 24 in each group). The groups compared on relative CXCR4 mRNA expression levels include: blank control, 2D-cultured, RCCS-cultured, PTX-treated RCCS-cultured, CXCR4 siRNA-transfected RCCS-cultured, and negative siRNA-transfected rNCSCs (n = 12 in each group).
The groups of rNCSCs compared on positive cell percentages for different markers include: 2D-cultured, RCCS-cultured, RCCS-cultured with PTX treatment, and RCCS-cultured with CXCR4 siRNA transfection (n = 12 in each group).
Western blot analyses of cytoplasmic and nuclear protein extracts
The cytoplasmic and nuclear protein fractions were sequentially extracted from decapsulated rNCSCs immediately after culturing (in either the 2D environment or the RCCS) with the NE-PER™ Nuclear and Cytoplasmic Extraction Reagents (Thermo Fisher Scientific), according to the manufacturer's instructions. Briefly, 1 × 10⁶ rNCSCs were trypsinized and centrifuged in a 1.5-mL microcentrifuge tube, lysed with the ice-cold CER I and CER II reagents sequentially, followed by the second centrifugation to obtain supernatants containing the cytoplasmic extracts. The pellet deposition after the second centrifugation was further lysed by the ice-cold NER reagent and centrifuged again to obtain supernatants containing the nuclear extracts.
Equal amounts of cytoplasmic or nuclear protein extracts from each group of rNCSCs were separated using SDS–10% polyacrylamide gel electrophoresis and transblotted onto polyvinylidene difluoride (PVDF) membranes (Millipore). Protein concentration was quantified using the Pierce™ BCA Protein Assay Kit (Thermo Fisher Scientific).
Immunoblotting was performed with the same primary antibodies applied for immunofluorescence staining (described earlier). In addition, the anti-β-actin antibody (rabbit polyclonal, 1:100 dilution; Santa Cruz Biotechnology) was applied to detect levels of total actin (including both F-actin and G-actin) in rNCSCs. GAPDH and TATA-box binding protein (TBP), respectively, served as the loading controls of cytoplasmic and nuclear extracts, and they were blotted with the anti-GAPDH (rabbit polyclonal, 1:2,500 dilution; Abcam) and anti-TBP (mouse monoclonal with the clone number mAbcam 51841, 1:1,000 dilution; Abcam) antibodies. For negative controls, the PVDF membranes carrying the cytoplasmic or nuclear protein extracts from different groups of rNCSCs were, respectively, immunoblotted with mouse monoclonal IgG1, rabbit polyclonal IgG, and goat polyclonal IgG from Abcam.
The signals of immunoblots were visualized with the Amersham ECL Western Blotting Detection Kit (GE Healthcare Life Sciences) followed by exposure to X-ray films. The intensities of the immunoblots signals on the X-ray films were then quantified using the ImageQuant® software with the Molecular Dynamics 375/475 Personal Densitometer SI (GE Healthcare Life Sciences).
Results
Altered morphology of rNCSCs and decreased adherence and survival of rNCSCs with the increase of culturing period under simulated microgravity
We separated hydrogel bead-encapsulated rNCSCs (Supplementary Fig. S3A) into two groups, both of which contained the same cell number at initiation (ie, 1 × 10⁶ cells/mL) and were cultured in the same incubator, with one group cultured under normal gravity in the 2D environment and the other group cultured in the RCCS (Supplementary Fig. S3B) for 12, 24, and 48 h, respectively. The total numbers of rNCSCs cultured in the 2D environment with and without hydrogel encapsulation and rNCSCs cultured in the RCCS were counted after 12, 24, and 48 h (Supplementary Fig. S4A). The doubling time of rNCSCs was estimated to be 21.30 ± 4.58 h.
Interestingly, the rNCSCs cultured without hydrogel encapsulation displayed significantly increased total cell numbers per milliliter at all time points compared with the rNCSCs encapsulated in hydrogel beads (Supplementary Fig. S4A). After decapsulation from the hydrogel beads and subculturing in the new maintenance medium for 2–3 h, all of the 2D-cultured rNCSCs adhered to the new petri dish and appeared in a long spindle shape (Supplementary Fig. S3C); whereas the RCCS-cultured rNCSCs were still suspended and appeared in a round shape (Supplementary Fig. S3D).
After culturing in the RCCS for 12 h and decapsulation, it took at least 12 h for the subcultured rNCSCs to adhere to the new petri dish. After culturing in the RCCS for 24 h and decapsulation, 90% of the rNCSCs adhered to the new petri dish after 24 h of subculturing. On the other hand, after culturing in the RCCS for 48 h and decapsulation, only 47.3% ± 8.6% of the rNCSCs adhered to the new petri dish after 24 h of subculturing. Trypan blue staining of the suspension after 24 h of subculturing indicated that 91.5% ± 7.6% of the suspended rNCSCs were dead.
Cell viability analyses conducted by the MTT assay indicated that the rNCSCs cultured in the 2D environment without hydrogel encapsulation showed a significantly higher viability (93.88%–87.76%) than the rNCSCs encapsulated in hydrogel beads after 12, 24, and 48 h of culturing (n = 24, P < 0.05 after 12 h, P < 0.01 after 24 and 48 h, one-way ANOVA), regardless of normal gravity or simulated microgravity (Supplementary Fig. S4B). On the other hand, the rNCSCs cultured in the RCCS for 48 h without any pretreatment displayed a significantly lower viability (35.75%) than the rNCSCs in the other groups (n = 24, P < 0.01, one-way ANOVA) (Supplementary Fig. S4B). Therefore, culturing in the RCCS for 48 h was harmful to rNCSCs and was, thus, excluded from subsequent analyses.
Decreased expression of neural crest markers and increased expression of neurite markers and active caspase-3 in rNCSCs cultured under simulated microgravity for 24 h
By immunofluorescence staining against four well-characterized neural crest markers, that is, p75 neurotrophin receptor and neural crest-specific transcription factors FoxD3, Snail(Snai1), and Sox10 [98 –103], we confirmed that all rNCSCs cultured under normal gravity (ie, 2D-cultured) expressed all of these neural crest markers (Fig. 1A–D). On the other hand, only 30.9% ± 10.4% of the rNCSCs cultured under simulated microgravity (ie, RCCS-cultured) expressed these neural crest markers (Fig. 1E–H). Interestingly, under the microscope, we found extension of neurite-like structures surrounding the RCCS-cultured rNCSCs that did not express neural crest markers (indicated by arrowheads in Fig. 1E–H).
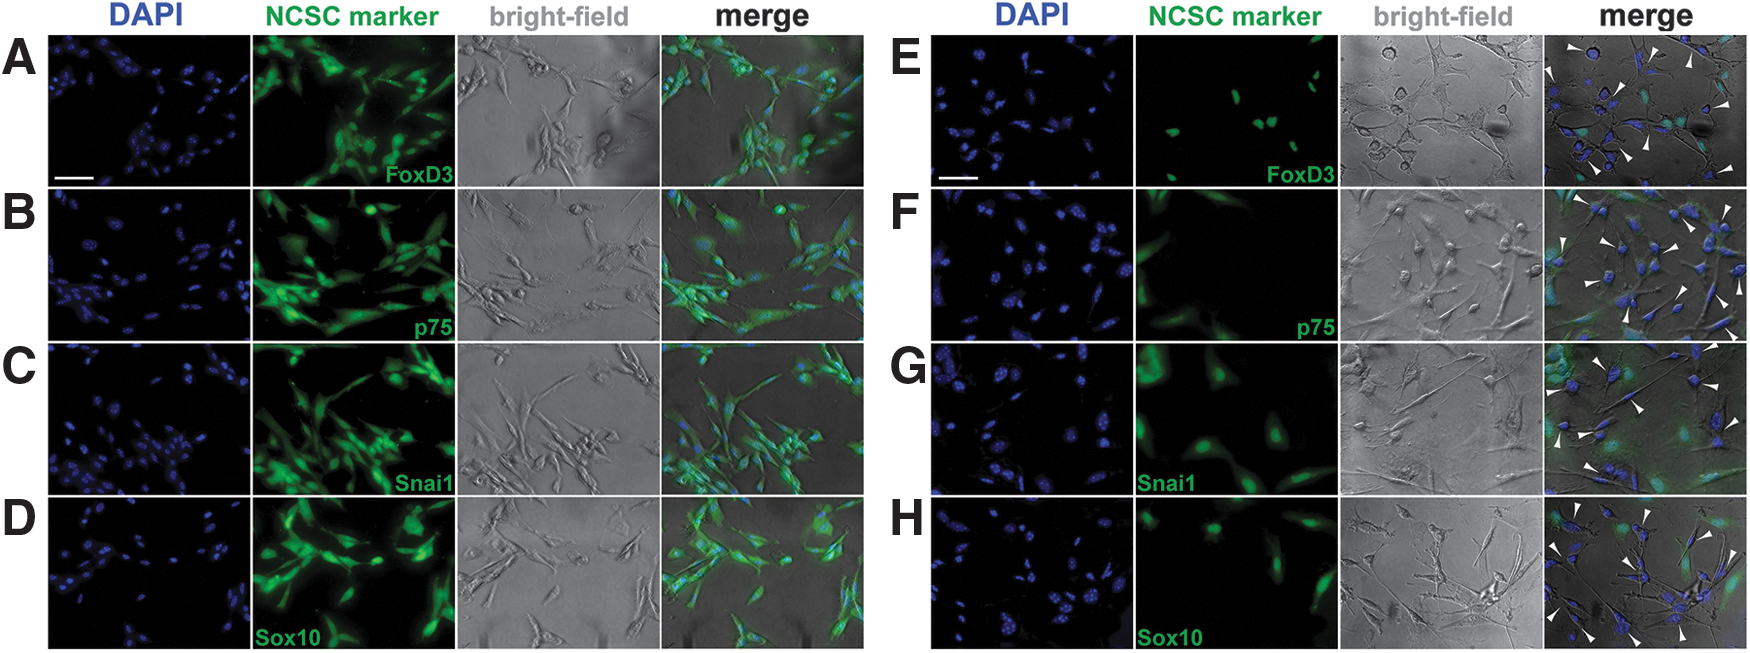
Decreased expression of neural crest markers in the nuclei and appearance of neurite-like structures in the RCCS-cultured rNCSCs. Immunostaining against neural crest markers FoxD3, p75, Snai1, and Sox10 (green) revealed that all 2D-cultured rNCSCs expressed all four neural crest markers analyzed (
Because it was demonstrated that culturing in alternative conditions might cause stress-induced formation of neurite-like structures on adult MSCs [104], we performed triple immunostaining for the following markers: the neurite marker neuron-specific class III β-tubulin (Tuj1) or MAP2 [105 –107], and the neural crest marker p75 or Sox10, as well as cleaved caspase-3 subunits, including the immature p20 peptide and the mature p17 subunit [108,109]. In the 2D-cultured rNCSCs, none expressed Tuj1 or MAP2, and 35.2% ± 10.7% expressed cleaved caspase-3 (Figs. 2A, E and Fig. 3).
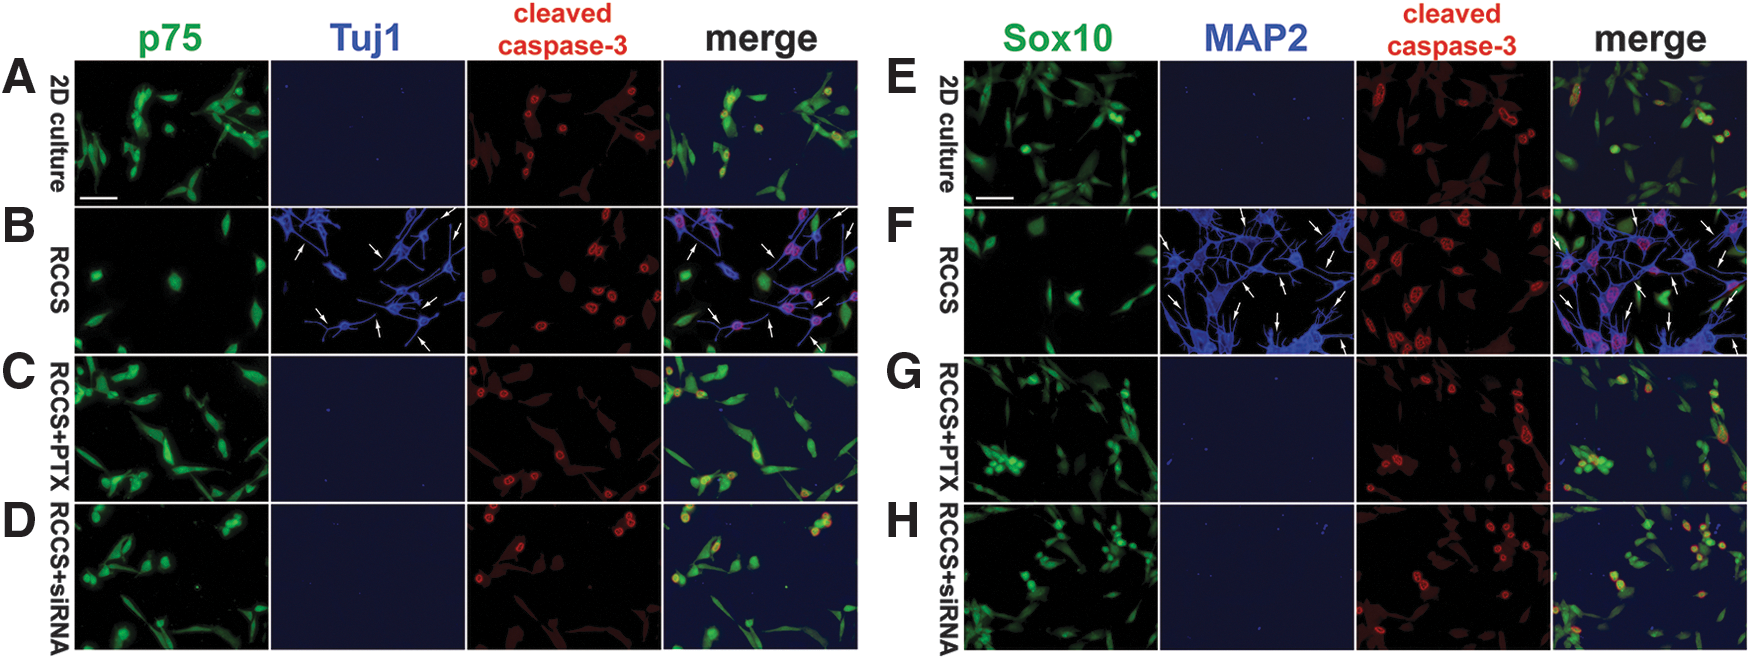
Decreased expression of neural crest markers and increased expression of neurite markers and cleaved caspase-3 in the RCCS-cultured rNCSCs. Triple immunostaining against a neural crest marker (p75 or Sox10; green), a neurite marker (Tuj1 or MAP2; blue), and cleaved caspase-3 (red) revealed significantly decreased numbers of p75+ and Sox10+ cells whereas dramatically increased numbers of Tuj1+, MAP2+, and cleaved caspase-3+ cells in the untreated RCCS-cultured rNCSCs
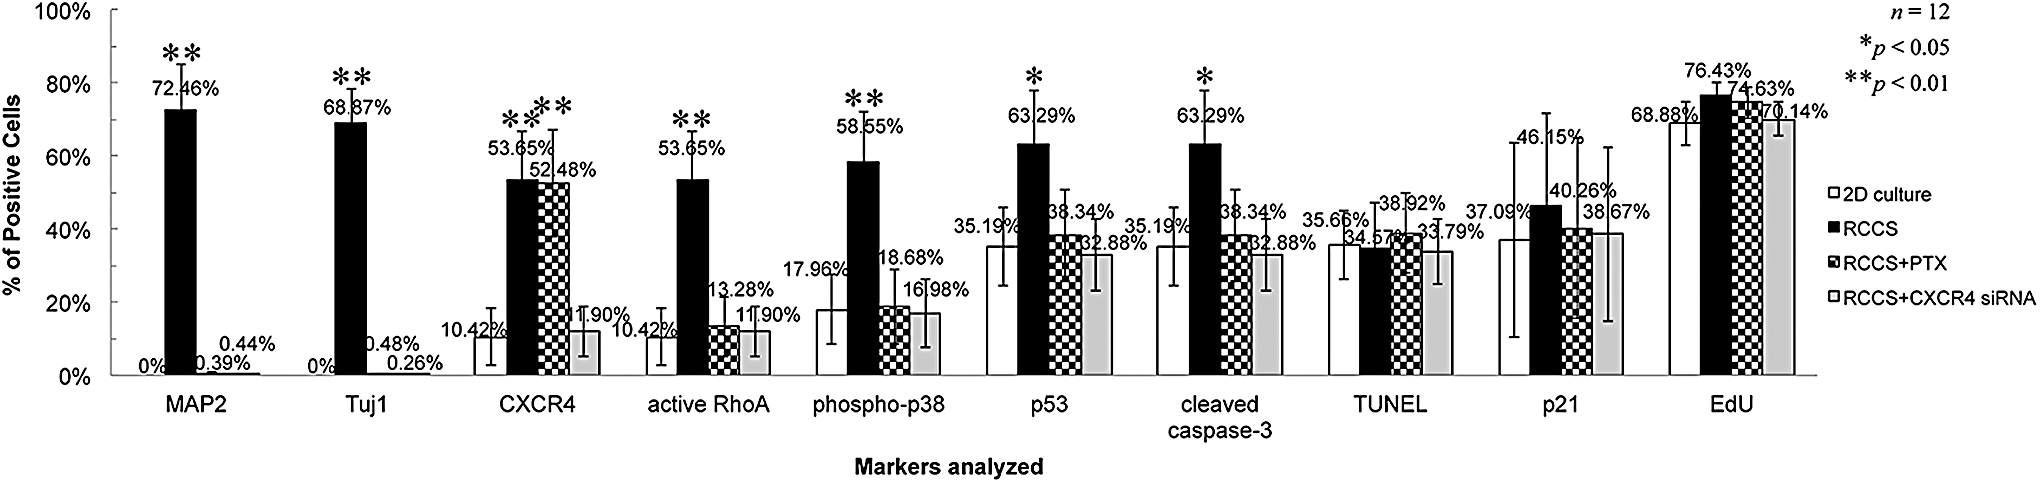
Statistical histogram of average percentages of positive cells for different protein markers. The numbers of total DAPI-stained nuclei and the positive cells immunostained for different protein markers or labeled with EdU or TUNEL in rNCSCs cultured under different conditions were individually counted by the Count Nuclei/Cell Sorting Application Module for MetaMorph Offline vers. 7.0. The average percentages of positive cells for each marker were calculated as “(the summary of numbers of cells or nuclei stained with red or green fluorescence on all images)/(the summary of total numbers of DAPI+ nuclei on all images) × 100%” for each group of rNCSCs. One-way ANOVA with n = 12 was applied for each marker analyzed. *P < 0.05 for p53+ and cleaved caspase-3+ cells; **P < 0.01 for MAP2+, Tuj1+, CXCR4+, active RhoA+, and phospho-p38+ cells. ANOVA, analysis of variance.
Interestingly, 68.9% ± 9.5% of the RCCS-cultured rNCSCs co-expressed Tuj1 and cleaved caspase-3, and 72.5% ± 12.7% of the RCCS-cultured rNCSCs co-expressed MAP2 and cleaved caspase-3, indicating that the cells with neurite-like structures were undergoing apoptosis (Figs. 2B, F and 3). The percentage of active caspase-3-positive nuclei in the RCCS-cultured rNCSCs was significantly higher than that in the 2D-cultured rNCSCs (Fig. 3; n = 12, P < 0.01, one-way ANOVA). Western blot analyses further confirmed the marked increase of MAP2 and Tuj1 expression and the dramatic decrease of FoxD3, p75, Snai1, and Sox10 expression in the RCCS-cultured rNCSCs compared with the 2D-cultured rNCSCs (Supplementary Figs. S5 and S6).
Plasma membrane blebbing and cytoskeleton disorganization in the RCCS-cultured rNCSCs
As microgravity environment has been reported to affect cytoskeleton organization and/or actin polymerization in a variety of cells, including breast cancer cells, endothelial cells, epithelial cells, fibroblasts, glial tumor cells, lymphocytes, MSCs, osteoblasts, utricular hair cells, etc. [4,27,42,44 –48], it was of interest to analyze cytoskeleton organization in the RCCS-cultured rNCSCs. Phalloidin staining demonstrated an organized and a nearly parallel arrangement of F-actin in the 2D-cultured rNCSCs under normal gravity (Fig. 4A); whereas in the RCCS-cultured rNCSCs under simulated microgravity for 24 h, the actin filaments were generally shorter and disorganized with membrane ruffling (indicated by arrows in Fig. 4B), though the overall immunostaining intensities of F-actin were comparable between the 2D-cultured and RCCS-cultured rNCSCs (Fig. 4A, B).
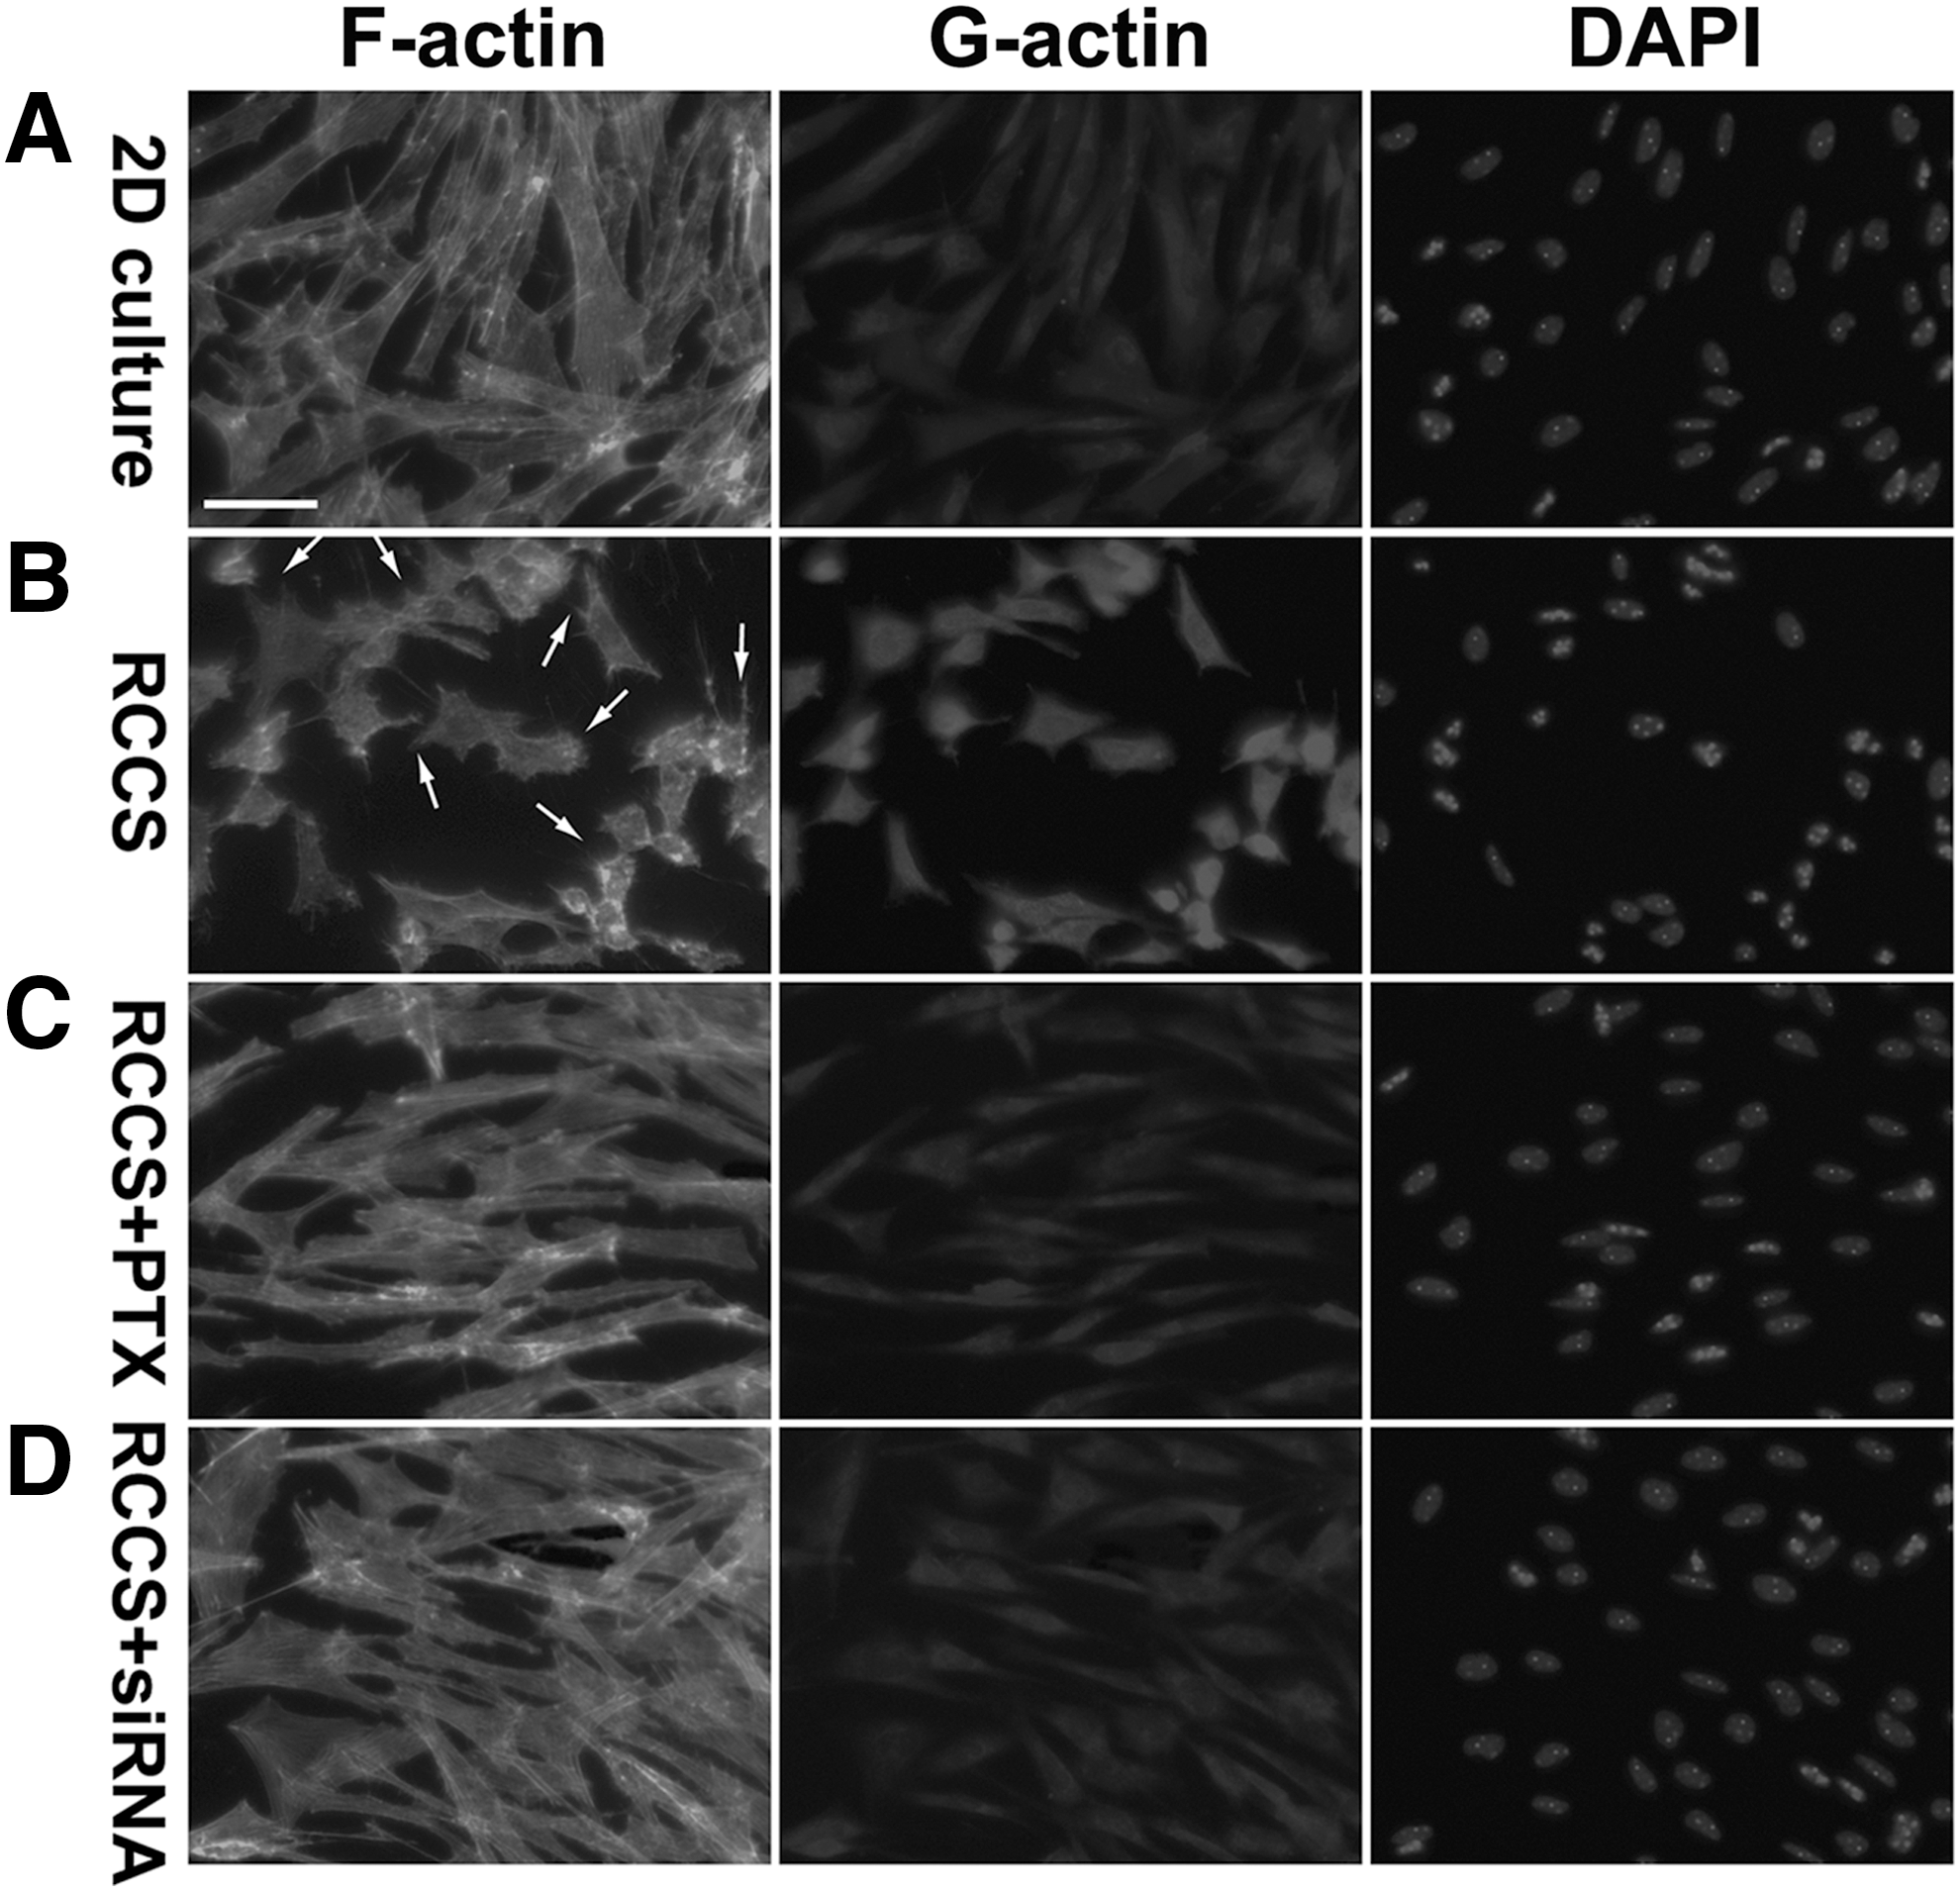
Disorganized F-actin, membrane blebbing, and an increased level of G-actin in the RCCS-cultured rNCSCs. Phalloidin staining revealed that F-actin was organized in an extended and a nearly parallel pattern under normal gravity in the 2D-cultured rNCSCs
On the other hand, deoxyribonuclease staining revealed a greatly increased level of G-actin in the RCCS-cultured rNCSCs compared with that in the 2D-cultured rNCSCs (compare Fig. 4A, B), which was consistent with the previously reported increase of the G-actin level in microgravity-stimulated human MSCs [44,48]. Interestingly, western blot analyses revealed that the cytoplasmic level of total β-actin in the RCCS-cultured rNCSCs was approximately twofold of that in the 2D-cultured rNCSCs (Supplementary Fig. S5), indicating that the total actin level was greatly increased after culturing under simulated microgravity.
Among a variety of actin-binding proteins in the cytoskeleton, cortactin has been characterized to be an important molecular scaffold and a mediator for actin polymerization and organization [110,111], and vimentin, which is an intermediate filament protein required for neuritogenesis [112 –114], was shown to be down-regulated in adult rat MSCs during stress-induced formation of neurite-like structures [104,115]. Therefore, we also analyzed the expression of cortactin and vimentin in the 2D-cultured and RCCS-cultured rNCSCs.
Interestingly, both cortactin and vimentin showed decreased expression and perturbed organization in the RCCS-cultured rNCSCs (Fig. 5B), in contrast to the strong expression and well-organized pattern observed in the 2D-cultured rNCSCs (Fig. 5A). Our results of western blotting also indicated dramatically reduced protein levels of cortactin and vimentin in the RCCS-cultured rNCSCs (Supplementary Fig. S5).

Decreased expression of cortactin and vimentin in the RCCS-cultured rNCSCs. Double immunostaining revealed that the expression levels of both cortactin and vimentin were significantly decreased in the untreated RCCS-cultured rNCSCs
Increased levels of CXCR4, active RhoA GTPase, and phosphorylated ROCK1 and p38 MAPK in the RCCS-cultured rNCSCs
Previous studies have demonstrated that the intracellular trafficking and signal transduction of the CXCR4, which regulates migration of neural crest cells [116 –118], are mediated by RhoA GTPase [119 –121], which regulates actin polymerization and is down-regulated by modeled microgravity in human MSCs [44,48,86,122,123]. Therefore, we analyzed protein levels and distributions of CXCR4 and active RhoA GTPase in the 2D-cultured and RCCS-cultured rNCSCs by immunostaining.
In the 2D-cultured rNCSCs, CXCR4 was mainly distributed in the perinuclear region in the cytoplasm, whereas active RhoA was detected merely at a background level (Fig. 6A). In the RCCS-cultured rNCSCs, the immunostaining signals of both CXCR4 and active RhoA were dramatically increased and colocalized both in the cytoplasm and on the plasma membranes (indicated by arrows in Fig. 6B). Western blot analyses indicated that the relative protein levels of CXCR4 and active RhoA in the RCCS-cultured rNCSCs were, respectively, 3.7- and 7.7-fold of the levels in the 2D-cultured rNCSCs.
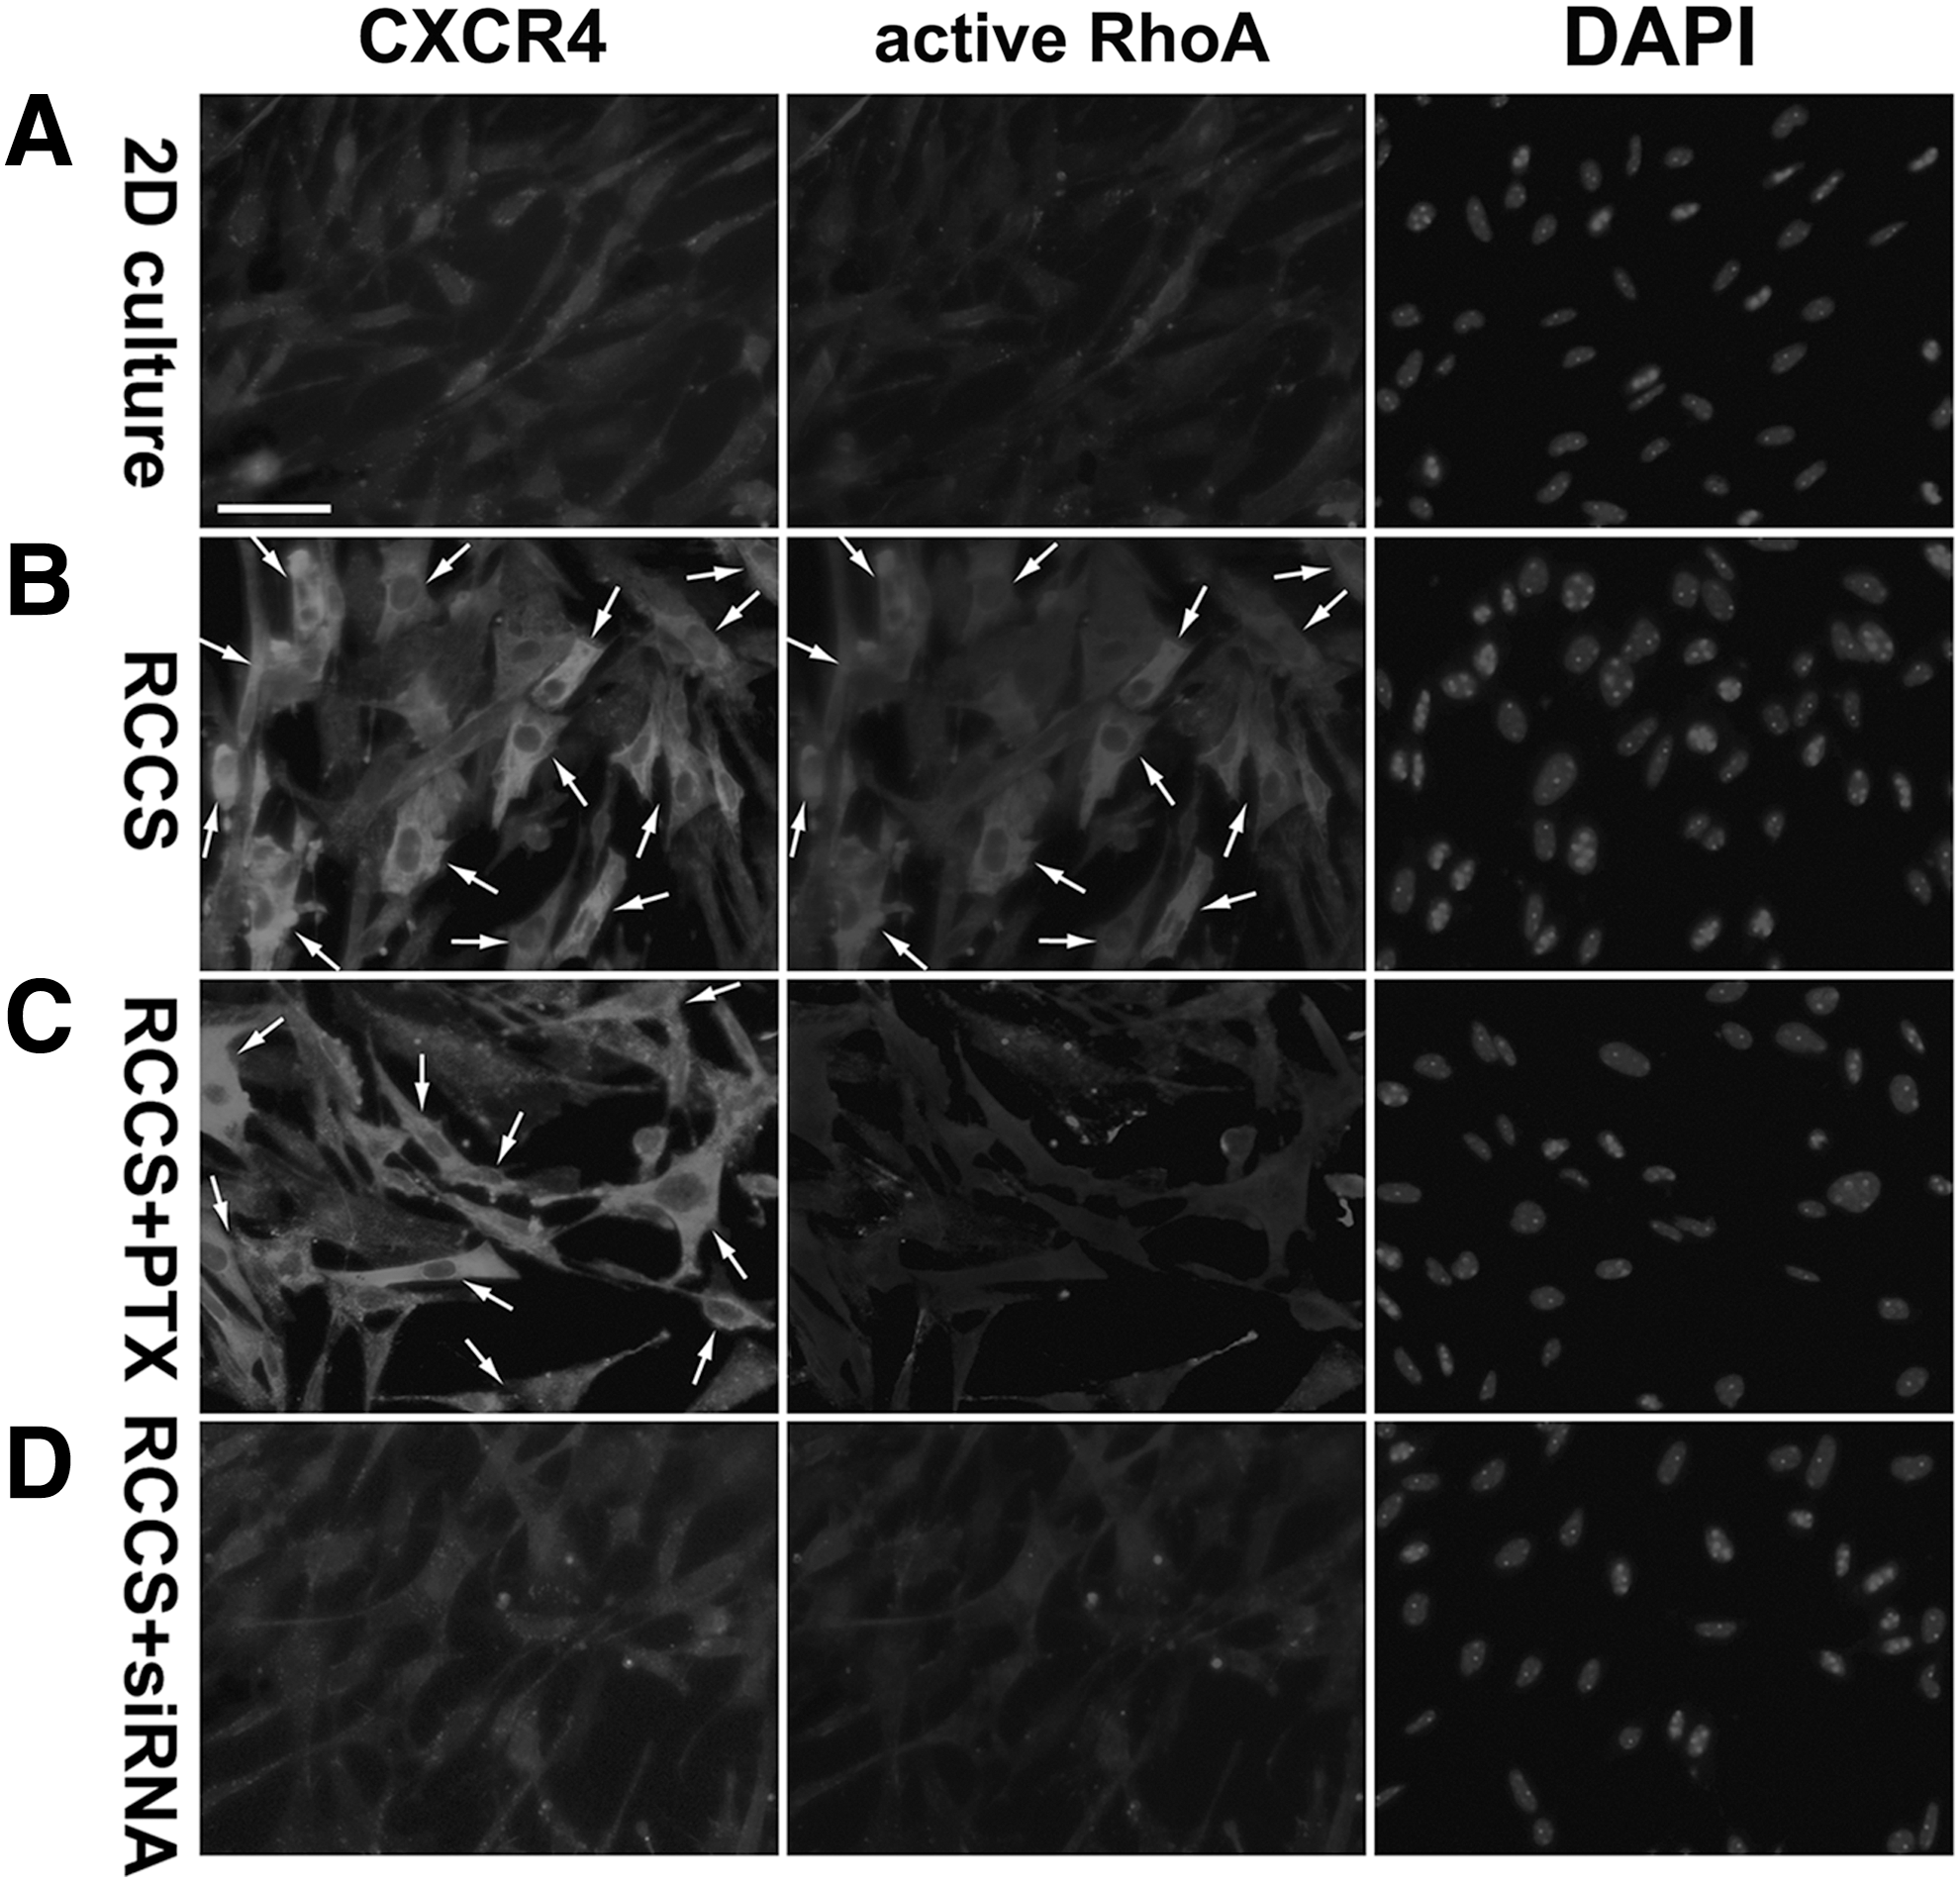
Increased levels of CXCR4 and active RhoA GTPase in the RCCS-cultured rNCSCs. Double immunostaining revealed only background levels of CXCR4 and active RhoA GTPase in the 2D-cultured rNCSCs
We then analyzed mRNA levels of CXCR4 in 2D-cultured and RCCS-cultured rNCSCs by real-time quantitative RT-PCR, with the vehicle blank control, siRNA negative control, and internal standard control of 18S rRNA extracted from each group of rNCSCs (Fig. 7A). When the average CXCR4 mRNA level in the 2D-cultured rNCSCs was presumptively set up as 1.0, the relative CXCR4 mRNA level in the rNCSCs cultured in the RCCS for 24 h was 3.46 ± 0.87, which was significantly increased (n = 18, P < 0.01, one-way ANOVA) (Fig. 7B). Although the relative CXCR4 mRNA level in the rNCSCs cultured in the RCCS for 12 h was 1.57 ± 0.64-fold of that in the 2D-cultured rNCSCs, the difference was not statistically significant (n = 18, P > 0.05, one-way ANOVA) (Fig. 7B).

Increased expression of CXCR4 mRNA in the RCCS-cultured rNCSCs.
These results indicated that CXCR4 was not significantly upregulated at the transcriptional level in the rNCSCs until culturing under simulated microgravity for 24 h.
Because active RhoA GTPase binds to and activates the Rho-associated protein kinases ROCK1 and ROCK2 [124 –126], and ROCK1 rather than ROCK2 has been shown to play an essential role in stress-induced actin destabilization [127,128], we then examined the levels of activated ROCK1 in the 2D-cultured and RCCS-cultured rNCSCs. We analyzed the total and activated (Ser1333-phosphorylated) ROCK1 proteins by immunostaining [129]. In the 2D-cultured rNCSCs under normal gravity, the total ROCK1 was distributed nearly homogenously in the cytoplasm, whereas the Ser1333-phosphorylated ROCK1 was detected predominantly in the perinuclear region (Fig. 8A).
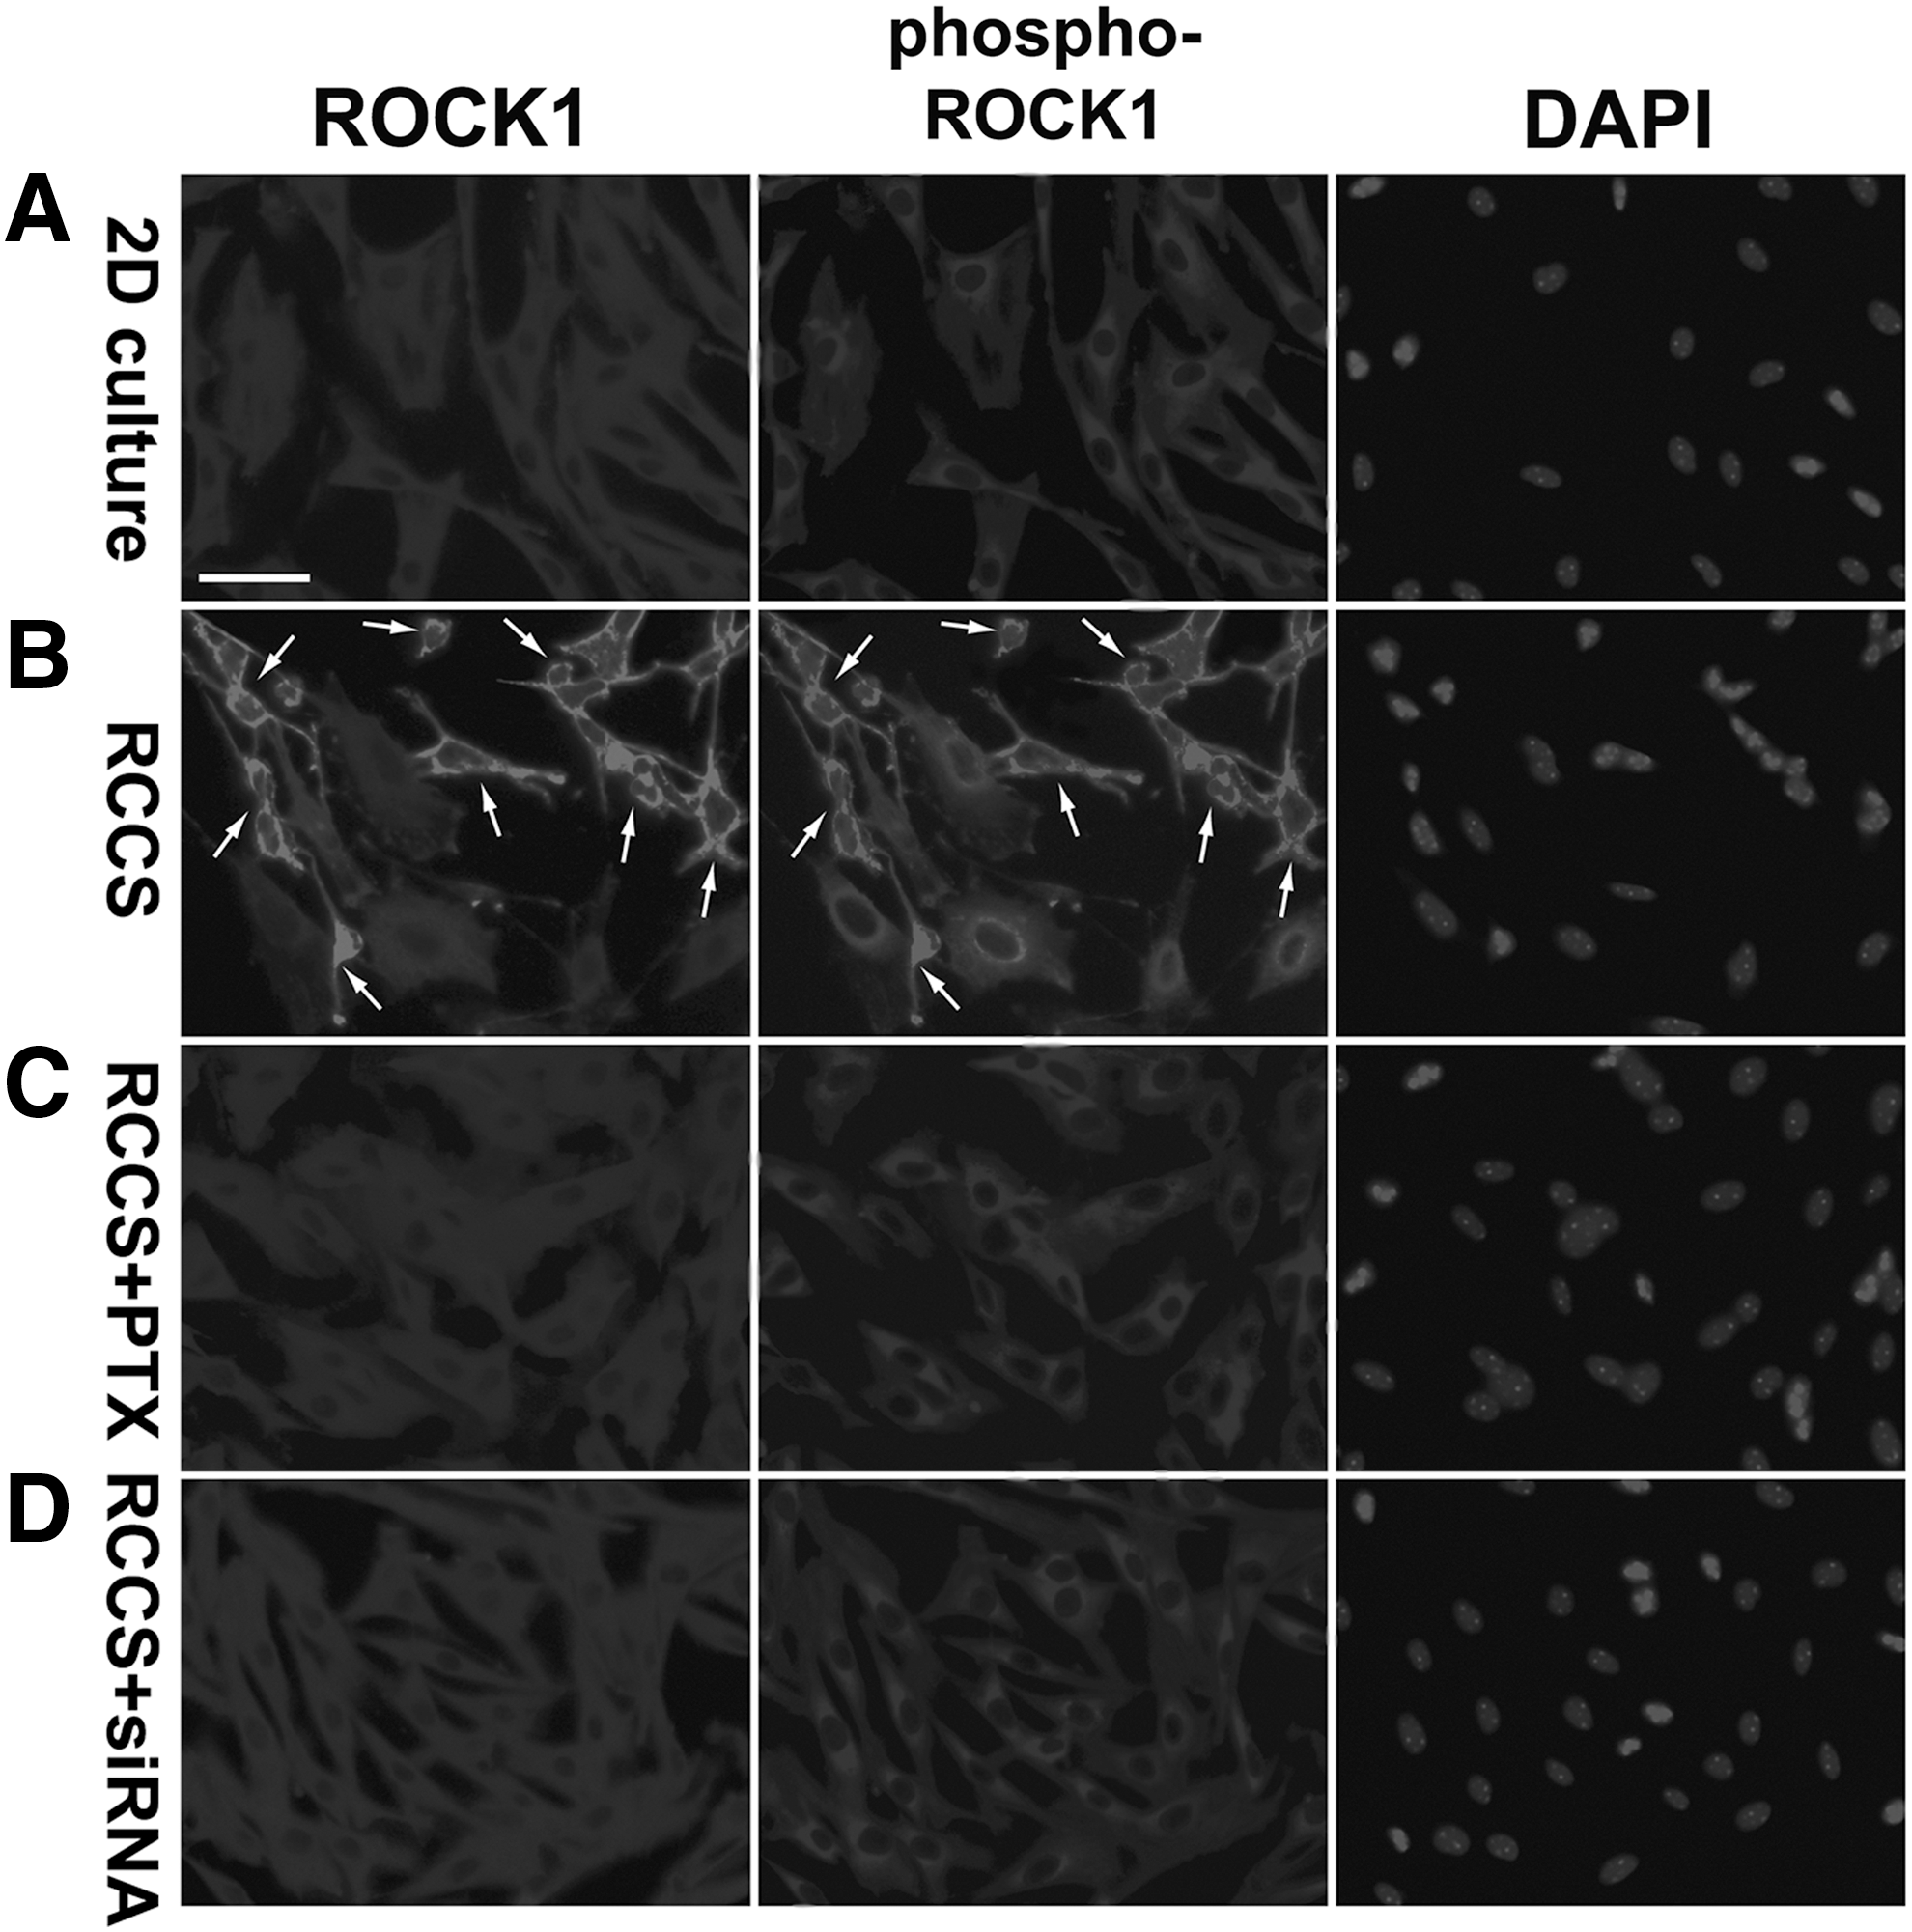
Increased phosphorylation of ROCK1 in the RCCS-cultured rNCSCs. Double immunostaining revealed that, in the 2D-cultured rNCSCs
On the other hand, in more than 50% of the RCCS-cultured rNCSCs, the levels of both the total and phosphorylated ROCK1 were significantly increased and distributed predominantly on the plasma membranes (indicated by arrows in Fig. 8B). Translocation of ROCK1 to the plasma membranes and increased ROCK1 phosphorylation in RCCS-cultured rNCSCs may be concomitant with increased RhoA activity (Fig. 6B), as previous studies have demonstrated that plasma membrane translocation is a prerequisite of ROCK1 activation by RhoA GTPase [130,131]. Western blot analyses indicated that the relative protein levels of total ROCK1 and phosphorylated ROCK1 in the RCCS-cultured rNCSCs were, respectively, 1.9- and 5.2-fold of the levels in the 2D-cultured rNCSCs.
Because both RhoA and ROCK1 were activated in the rNCSCs cultured under simulated microgravity, we were interested in analyzing the total and phosphorylation levels of p38 MAPK, which was a major downstream effector of ROCK1 [132,133], in the 2D-cultured and RCCS-cultured rNCSCs. The total p38 MAPK was detected in either the cytoplasm or nuclei of rNCSCs, whereas the Thr180/Tyr182-phosphorylated and activated p38 was restricted to the nuclei (Fig. 9), as demonstrated by previous studies [134,135]. The summations of immunostaining intensities of the total p38 MAPK were comparable between the 2D-cultured and RCCS-cultured rNCSCs (compare Fig. 9A, B).
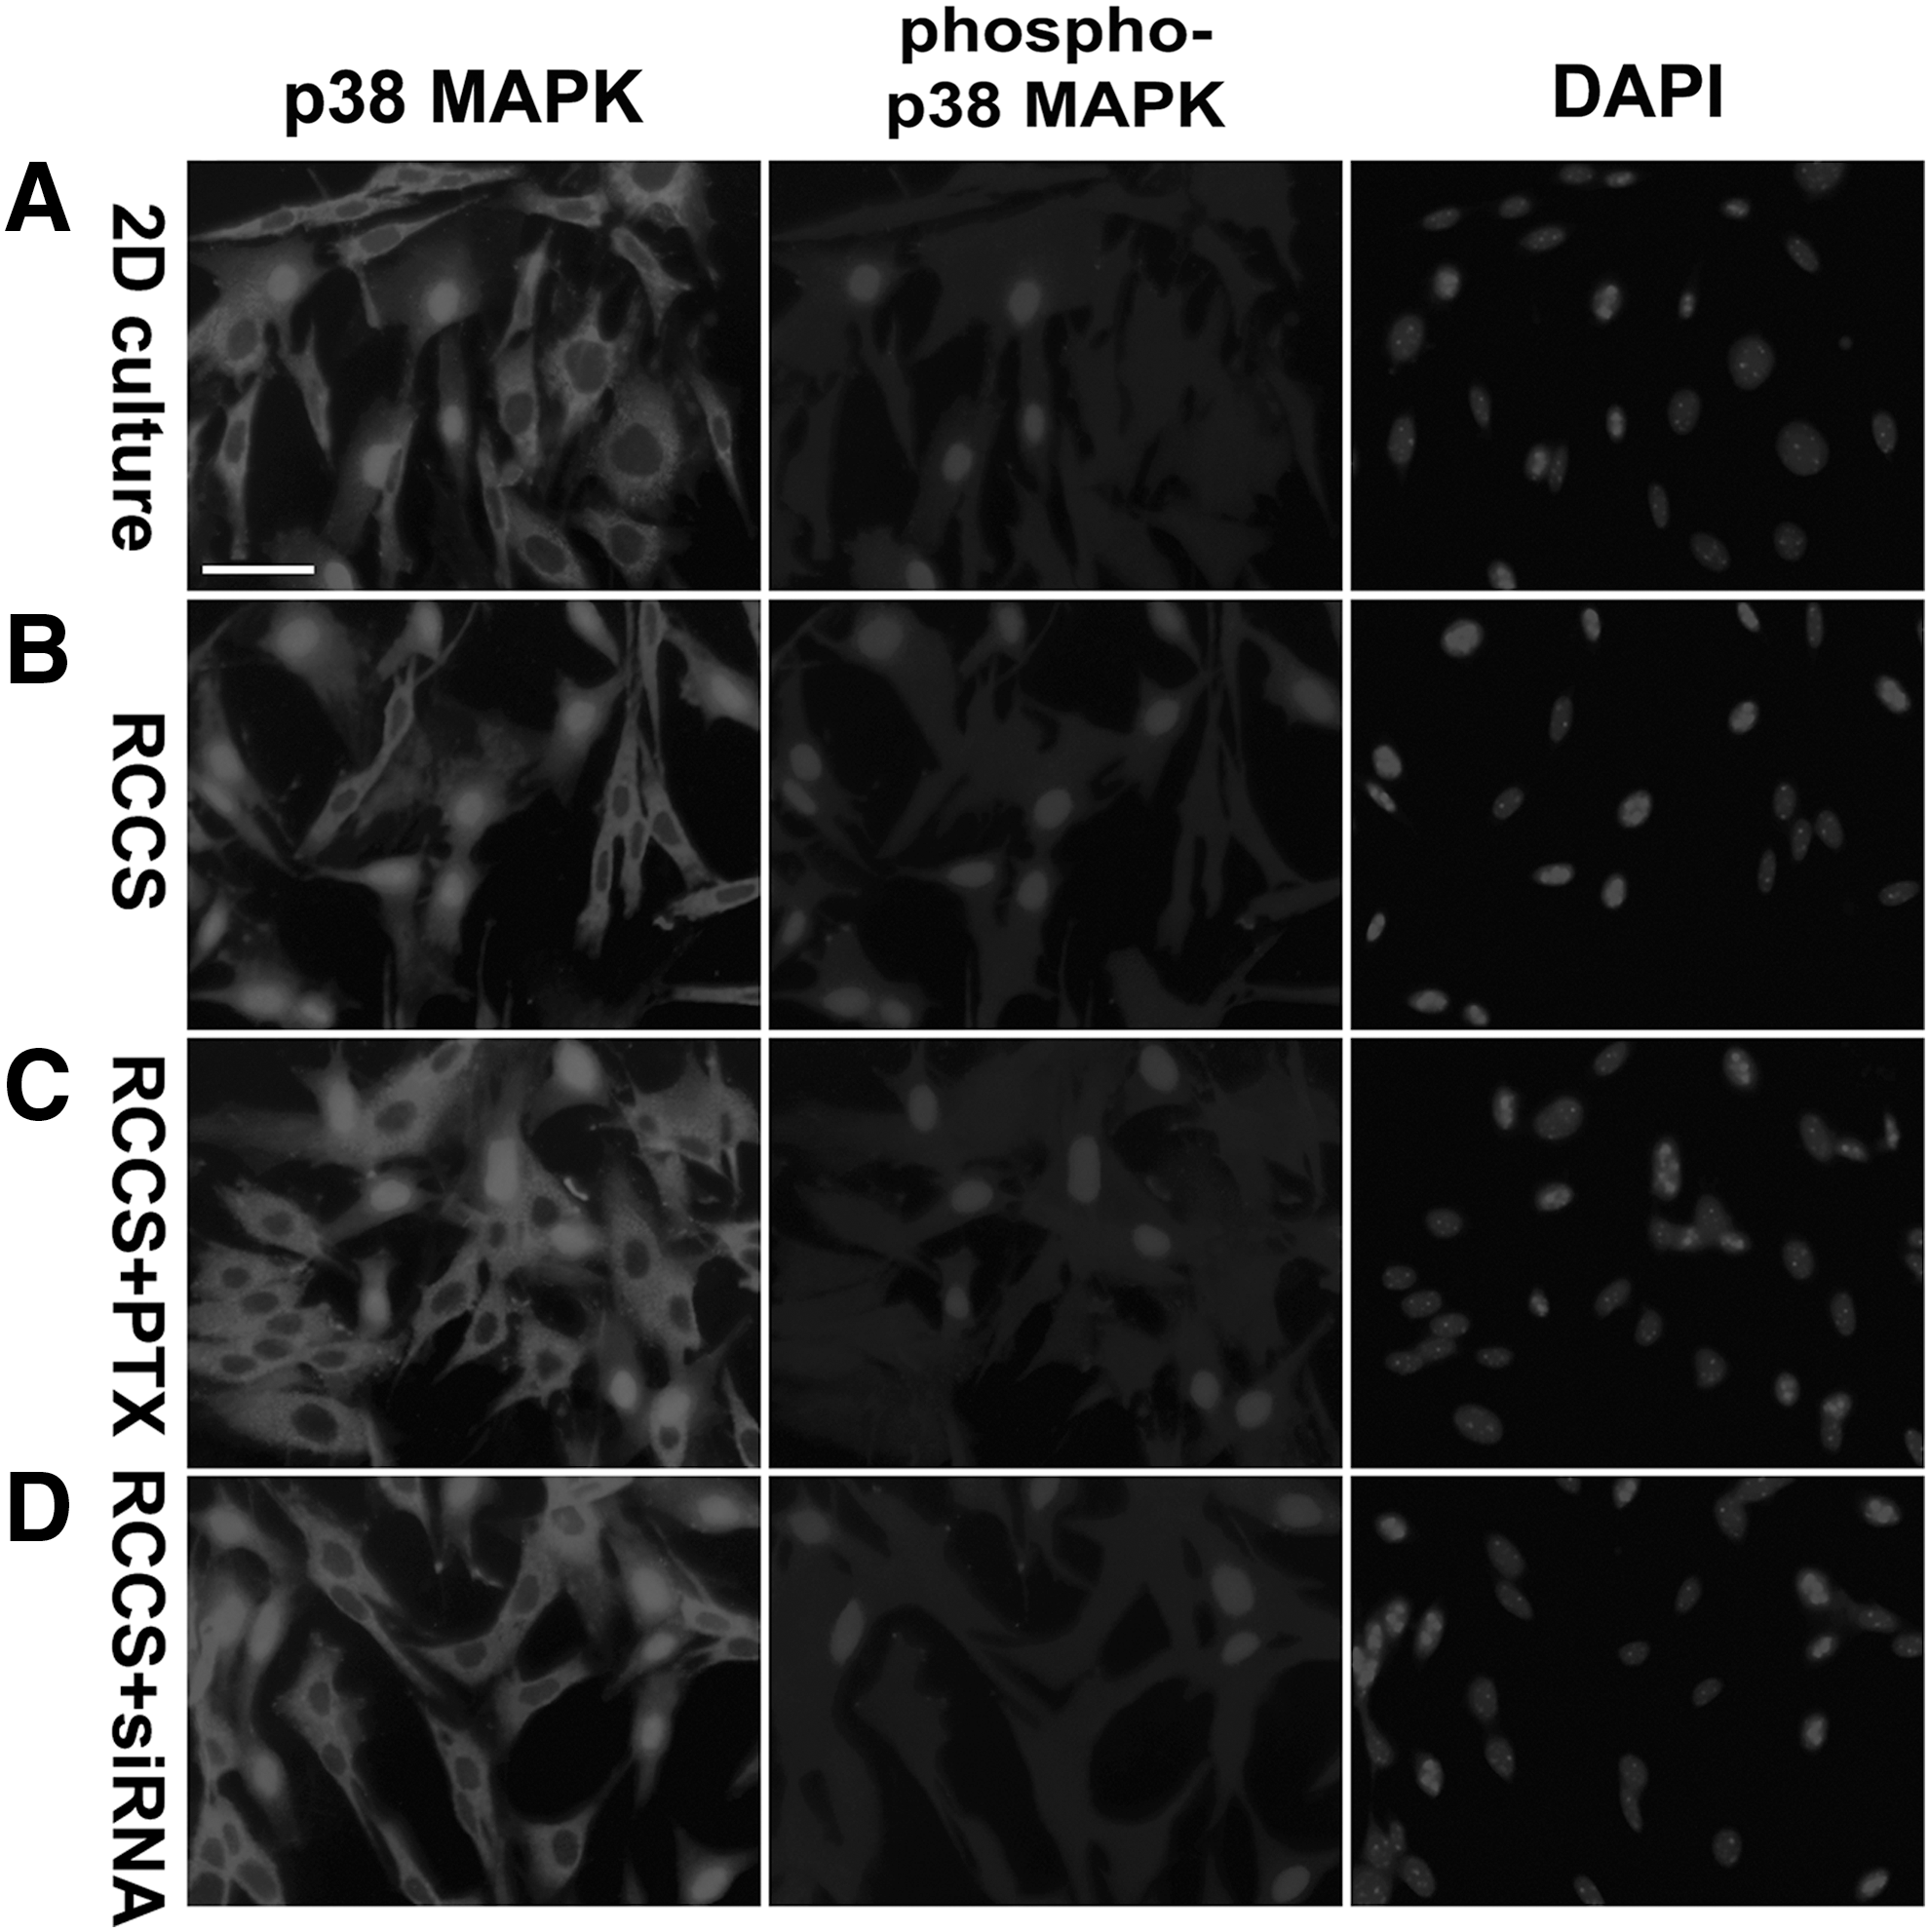
Increased phosphorylation and nuclear localization of p38 MAPK in the RCCS-cultured rNCSCs. Double immunostaining against total and phosphorylated p38 MAPK revealed that phosphorylated p38 MAPK was located only in the nucleus, with p38+ nuclei coinciding with phospho-p38+ nuclei; whereas cytoplasmic p38 MAPK was unphosphorylated. The percentages of both p38+ and phospho-p38+ nuclei were significantly increased in the RCCS-cultured rNCSCs
On the other hand, both the intensity and the percentage of nuclei positive for Thr180/Tyr182-phosphorylated p38 were significantly higher in the RCCS-cultured rNCSCs than in the 2D-cultured rNCSCs (Figs. 3 and 9; n = 12, P < 0.01, one-way ANOVA). Western blot analyses indicated that the relative protein levels of total cytoplasmic p38 MAPK and phosphorylated nuclear p38 MAPK in the RCCS-cultured rNCSCs were, respectively, 0.5- and 4.9-fold of the levels in the 2D-cultured rNCSCs. These results indicated increased p38 MAPK activation in rNCSCs cultured under simulated microgravity for 24 h.
PTX treatment or CXCR4 siRNA transfection restored cell viability, cell morphology, cytoskeleton organization, and RhoA-ROCK1-p38 signaling in the RCCS-cultured rNCSCs
Given that both the RhoA activity and CXCR4 expression were significantly increased in the RCCS-cultured rNCSCs (Figs. 6B and 7), we were interested in analyzing the effects of inhibiting RhoA activation or CXCR4 expression on cytoskeleton disorganization and signaling perturbation in the RCCS-cultured rNCSCs.
For RhoA inhibition, before culturing in the RCCS, we incubated rNCSCs in the maintenance medium containing, respectively, 100, 250, 500, or 1,000 ng/mL of PTX, which is an ADP-ribosylating factor and inhibitor of the Rho family of GTPases [136,137]. We found that 500 ng/mL of PTX was sufficient to inhibit more than 99% of neurite marker expression (Figs. 2C, G and 3) and RhoA GTPase activation (Figs. 3 and 6C) in the RCCS-cultured rNCSCs, whereas 1,000 ng/mL of PTX exhibited cell toxicity and greatly decreased the total number of rNCSCs (data not shown). Therefore, PTX at the concentration of 500 ng/mL was applied for all analyses in this study. We found that PTX pretreatment significantly increased the total numbers and cell viability of rNCSCs after culturing in the RCCS for 24 and 48 h to comparable levels as in the 2D-cultured rNCSCs (Supplementary Fig. S4).
PTX pretreatment also increased the percentages of p75+ and Sox10+ rNCSCs but decreased the percentages of Tuj1+, MAP2+, and active caspase-3+ rNCSCs after RCCS culturing to comparable levels as in the 2D-cultured rNCSCs (Figs. 2C, G and 3). Western blotting results also showed that, in the cytoplasm of the PTX-pretreated and RCCS-cultured rNCSCs, FoxD3, p75, Snai1, and Sox10 expression was increased; whereas MAP2 and Tuj1 expression was decreased to comparable levels as in the cytoplasm of the 2D-cultured rNCSCs (Supplementary Figs. S5 and S6).
In addition, PTX pretreatment suppressed the G-actin and total β-actin levels as well as plasma membrane blebbing (Fig. 4C and Supplementary Fig. S5), increased the cortactin and vimentin levels (Fig. 5C and Supplementary Fig. S5), decreased RhoA GTPase activation (Figs. 3, 6C, and Supplementary Fig. S5), and decreased ROCK1 and p38 MAPK phosphorylation (Figs. 8C, 9C, Supplementary Figs. S5 and S6) in the RCCS-cultured rNCSCs. Nonetheless, PTX pretreatment did not affect the increased CXCR4 expression after RCCS culturing (indicated by arrows in Fig. 6C). The inhibitory effect of PTX on the simulated microgravity-induced cytoskeleton disorganization and apoptosis-activating signaling persisted for at least 48 h during culturing in the RCCS (Supplementary Fig. S4 and data not shown).
Similar to the effects of PTX pretreatment, transfection of CXCR4 siRNA into rNCSCs before culturing in the RCCS significantly increased total numbers and cell viability of rNCSCS; increased expression of neural crest markers FoxD3, p75, Snai1, and Sox10 (Figs. 2D, H, 3, and Supplementary Fig. S6), and expression of cytoskeleton components cortactin and vimentin (Fig. 5D and Supplementary Fig. S5); as well as decreased activation of RhoA GTPase (Figs. 3, 6D, and Supplementary Fig. S5), ROCK1 (Fig. 8D and Supplementary Fig. S5), and p38 MAPK (Figs. 3, 9D, and Supplementary Fig. S6).
On the other hand, CXCR4 siRNA pretransfection decreased expression of G-actin and total β-actin (Fig. 4D and Supplementary Fig. S5), as well as plasma membrane blebbing (Fig. 4D), and dramatically decreased the levels of both CXCR4 protein and mRNA in the RCCS-cultured rNCSCs (Figs. 6D, 7, and Supplementary Fig. S5). The mRNA level in the RCCS-cultured rNCSCs was reduced by CXCR4 siRNA transfection from 3.46 ± 0.87-fold to 0.92 ± 0.38-fold of that in the 2D-cultured rNCSCs (Fig. 7B; n = 24, P < 0.01, one-way ANOVA). The inhibitory effect of CXCR4 siRNA on the simulated microgravity-induced cytoskeleton disorganization and apoptosis-activating signaling persisted for at least 48 h during culturing in the RCCS (Supplementary Fig. S4 and data not shown).
Increased levels of nuclear p53 and apoptosis, but unchanged rates of cell death and proliferation in the RCCS-cultured rNCSCs
Given that the RCCS-cultured rNCSCs showed an increased level of active caspase-3 (Figs. 2B, F and 3) as well as increased phosphorylation and nuclear translocation of p38 MAPK (Figs. 3 and 9B), we were interested in analyzing the expression of p53, which has been reported to be phosphorylated and activated by p38 MAPK [138 –140], in the 2D-cultured and RCCS-cultured rNCSCs. As p53 is well known for its critical role in inducing cell apoptosis [141,142], we performed double immunostaining for p53 and TUNEL or p53 and active caspase-3 to assess the correlation between p53 expression and the death of rNCSCs. Our immunostaining results revealed that the percentage of p53+ nuclei in the RCCS-cultured rNCSCs was significantly increased to ∼1.8-fold of that in the 2D-cultured rNCSCs (Fig. 3; compare Figs. 10A, B and 11A, B).

Increased percentage of p53+ nuclei in spite of unchanged rate of cell death in the RCCS-cultured rNCSCs. Double staining for p53 (red) and TUNEL (green) revealed a significantly increased number and percentage of p53+ nuclei in the untreated RCCS-cultured rNCSCs
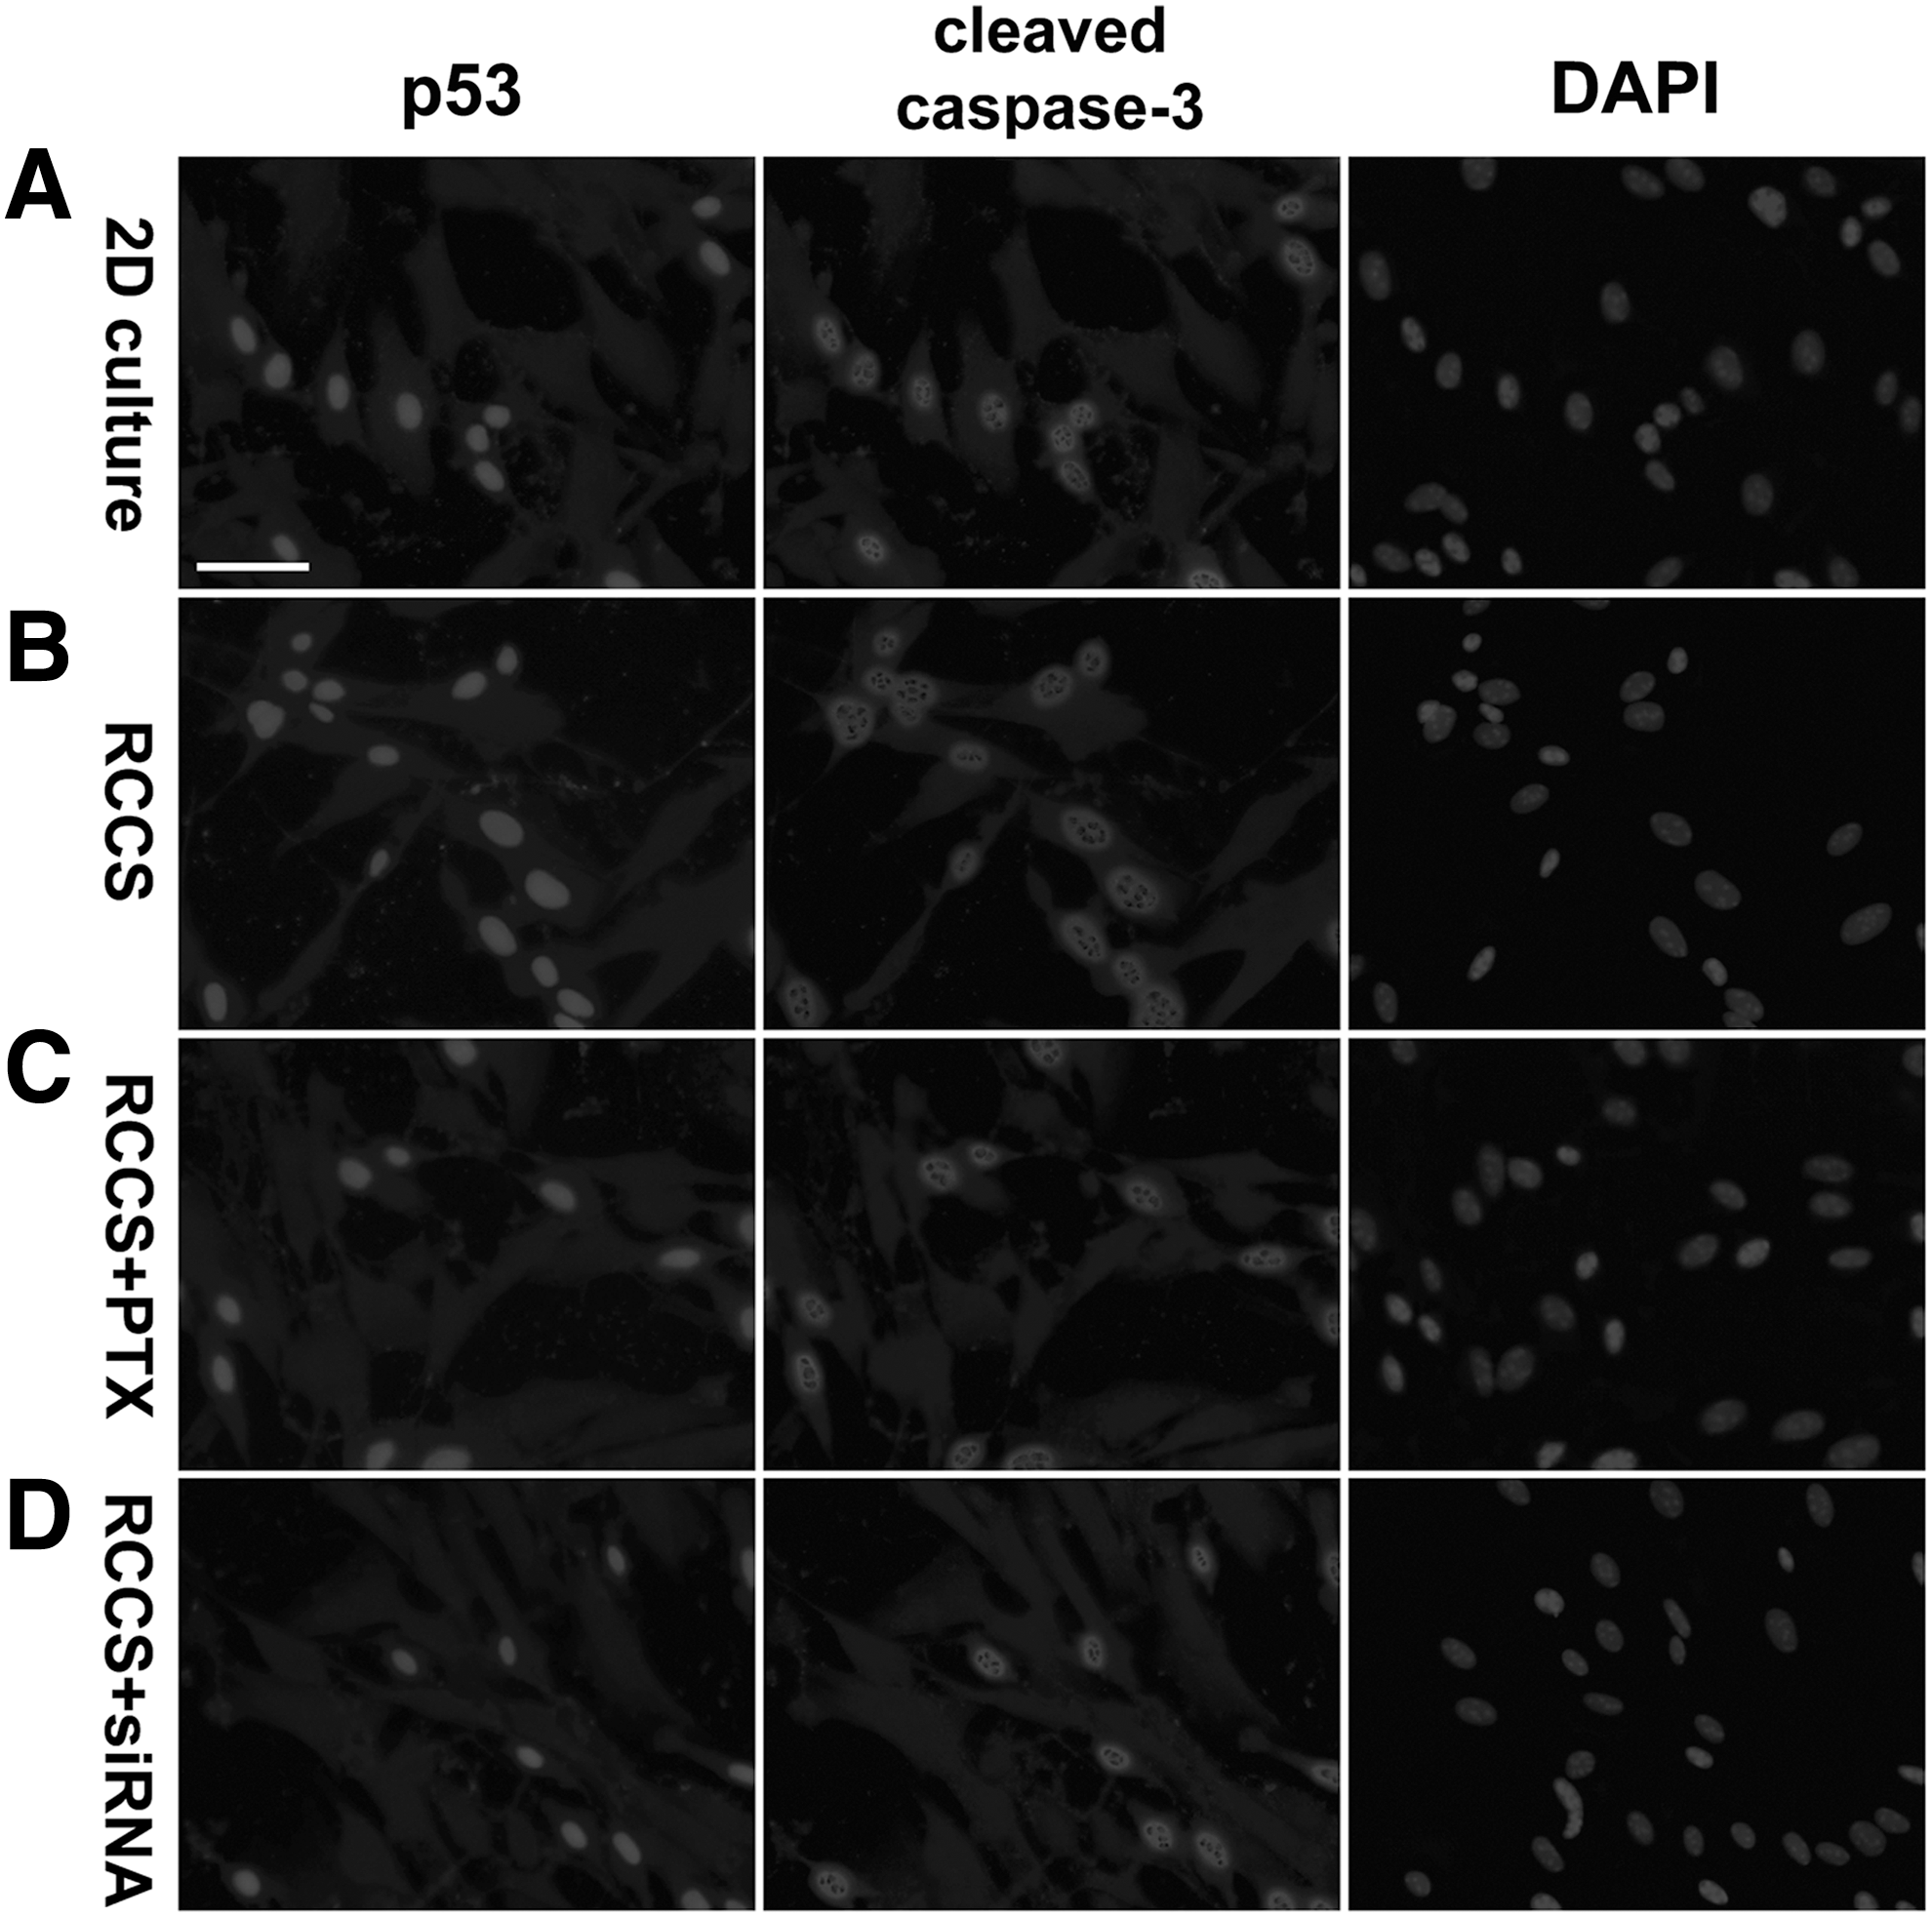
Colocolization of p53 and cleaved (active) caspase-3 and increased rate of apoptosis in the RCCS-cultured rNCSCs. Double immunostaining revealed that p53 was colocalized with cleaved (active) caspase-3 in the nuclei of rNCSCs under both normal gravity and simulated microgravity, indicating that nuclear p53 expression was associated with apoptosis of rNCSCs. The percentages of p53+ and cleaved caspase-3+ nuclei in the untreated RCCS-cultured rNCSCs
In addition, western blot analyses indicated that the nuclear protein level of p53 in the RCCS-cultured rNCSCs was significantly increased to averagely 4.2-fold of that in the 2D-cultured rNCSCs (Supplementary Fig. S6). Both PTX treatment and CXCR4 siRNA transfection before RCCS culturing led to a decrease of the percentage of p53+ nuclei and nuclear expression of p53 in rNCSCs to comparable levels as in the 2D-cultured rNCSCs (Figs. 3, 10C, D, 11C, D, and Supplementary Fig. S6). The significantly increased percentage of active caspase-3+ nuclei in the RCCS-cultured rNCSCs was also decreased by PTX pretreatment (Figs. 3 and 11C; n = 12, P < 0.01, one-way ANOVA) and CXCR4 siRNA pretransfection (Figs. 3 and 11D; n = 12, P < 0.01, one-way ANOVA).
Western blot analyses also revealed that the nuclear level of cleaved caspase-3 in the untreated RCCS-cultured rNCSCs was averagely 2.6-fold of the levels in the 2D-cultured, PTX-pretreated RCCS-cultured, and CXCR4 siRNA pretransfected RCCS-cultured rNCSCs. On the other hand, the percentages of TUNEL+ nuclei in the 2D-cultured and PTX-pretreated or CXCR4 siRNA-pretransfected RCCS-cultured rNCSCs (Figs. 3, 10C, D) were comparable with those in the untreated RCCS-cultured rNCSCs (Figs. 3 and 10B).
To evaluate the correlation between TUNEL+ and active caspase-3+ signals in rNCSCs cultured under normal or simulated microgravity, we performed double immunostaining for TUNEL and active caspase-3 in different groups of rNCSCs (Supplementary Fig. S7A–D). We found that the percentages of TUNEL+/active caspase-3+ double-positive nuclei (indicated by arrows in Supplementary Fig. S7A−D) in total active caspase-3+ nuclei were comparable among the 2D-cultured, untreated RCCS-cultured, PTX-pretreated RCCS-cultured, and CXCR4 siRNA-pretransfected RCCS-cultured rNCSCs (Supplementary Fig. S7E), indicating that the proportions of cells at the late phase of apoptosis in total apoptotic cells were comparable among these four groups of rNCSCs.
On the other hand, in the untreated RCCS-cultured rNCSCs, the percentage of TUNEL+/active caspase-3+ double-positive nuclei in total TUNEL+ nuclei was significantly increased to averagely 1.5-fold of the percentages in the 2D-cultured, PTX-pretreated RCCS-cultured, and CXCR4 siRNA-pretransfected RCCS-cultured rNCSCs (Supplementary Fig. S7E), indicating that the proportion of apoptotic cells in total dying cells in the untreated RCCS-cultured group was significantly higher than the proportions in the other three experimental groups (Supplementary Fig. S7E; n = 12, P < 0.01, one-way ANOVA).
We next analyzed cell proliferation and expression of the cyclin-dependent kinase inhibitor p21Waf1/Cip1, a major downstream effector of p53 [143 –145], in 2D-cultured and RCCS-cultured rNCSCs. Interestingly, both the proliferation rates, which were calculated as the percentages of EdU+ cells, and the percentages of p21+ nuclei were comparable among the 2D-cultured, RCCS-cultured, PTX-pretreated, and CXCR4 siRNA-pretransfected rNCSCs (Fig. 3 and Supplementary Fig. S8). It is noteworthy that p21+ nuclei were stained with a low level of EdU (indicated by arrows in Supplementary Fig. S8) or no EdU at all, consistent with the role of p21 in suppressing cell proliferation [146 –148]. Our western blotting results also indicated that the nuclear protein levels of p21 were comparable among the 2D-cultured, untreated RCCS-cultured, PTX-pretreated RCCS-cultured, and CXCR4 siRNA pretransfected RCCS-cultured rNCSCs (Supplementary Fig. S6).
Discussion
Recent studies have demonstrated that microgravity induces apoptosis of most types of cells and tissues [21 –34], except for human neuroblastoma cell line, peripheral blood mononuclear lymphocytes and colorectal carcinoma cells, rat bone marrow stromal cells, C57BL/6J mouse osteoblasts, and Sandos inbred mouse fetal skin fibroblasts, in which microgravity decreases apoptosis [35 –40]. It has been reported that microgravity-induced apoptosis is correlated with increased NF-κB expression in mouse testis and human microvascular endothelial cells [25,31], with the down-regulated PI3K/Akt signaling pathway in human microvascular endothelial cells [25], and with elevated phosphorylation of the stress-activated protein kinase SAPK/JNK in mouse preimplantation embryos [32].
In addition, multiple lines of evidence have shown, under simulated microgravity, the association between disrupted cytoskeleton and increased apoptosis in human endothelial cells, breast cancer and thyroid cancer cells, and rat aortic smooth muscle cells [25,27,149 –153]. Other than cell apoptosis, disruption of cytoskeleton organization by simulated microgravity has also been shown to be associated with perturbed cell migration and differentiation [44,48,61,86,154 –156].
It has been demonstrated that microgravity-induced actin depolymerization and stress fiber disruption, correlating with reduced osteoblastogenesis and enhanced adipogenesis, result from decreased activity of RhoA GTPase, which is required for activation of focal adhesion kinase (FAK), extracellular signal-regulated kinase (ERK), and PI3K, an upstream activator of NOS [48]. Increased NO production was also shown to be associated with actin remodeling and increased migration of human endothelial cells [47].
In our study, we found that simulated microgravity induced apoptosis and disrupted cytoskeleton organization in rNCSCs via activating the MAPK p38 (Fig. 9B) and RhoA GTPase (Fig. 6B), instead of inhibiting RhoA. In fact, we found that increased RhoA activity was upstream of p38 activation, as RhoA inhibition by PTX pretreatment significantly decreased the level of p38 phosphorylation and nuclear localization in the rNCSCs cultured under simulated microgravity (Figs. 3 and 9C). In rNCSCs, we also found that activated RhoA was colocalized with CXCR4 (Fig. 6B), whose transcriptional level was increased under simulated microgravity (Fig. 7), and that RhoA activity was inhibited by CXCR4 siRNA transfection (Fig. 6D), indicating that RhoA GTPase was downstream of CXCR4 in response to the gravitational change.
In fact, previous studies have reported the regulation of actin polymerization and plasma membrane blebbing by CXCR4-RhoA signaling [157,158]. In addition, CXCR4 signaling was shown to induce caspase-dependent cell apoptosis [159,160]. Interestingly, rat and mouse bone marrow stromal cells cultured under simulated microgravity have been shown to express CXCR4 on their cell membranes [39,85]. However, simulated microgravity-induced CXCR4 expression in rat and mouse bone marrow stromal cells was associated with maintaining an undifferentiated state and improving cell survival on transplantation [39,85]. It is likely that CXCR4 plays distinct roles in regulating cell survival and apoptosis in different types of adult stem/progenitor cells.
In spite of the well-known implication of RhoA GTPase in microgravity-induced cytoskeleton reorganization [44,48,86], there have been only two previous reports demonstrating altered expression or activity of ROCK kinase under microgravity in vitro or in vivo [161,162]. ROCK2 expression was found to be suppressed in cultured human lymphoblastoid cell lines during space flight [162], whereas ROCK activity was reported to be enhanced in rat femoral arteries after 14 days of tail suspension [161]. Unlike ROCK2, which stabilizes actin filaments and inhibits their depolymerization [163,164], ROCK1 was shown to destabilize actin cytoskeleton and stress fibers as well as to promote cell detachment [128,165,166]. ROCK1 signaling was also reported to promote cell membrane blebbing, including the apoptosis-associated membrane blebbing [127,167 –169].
Interestingly, ROCK1 has been shown to be activated on cleavage by active caspase-3 [168,169], whose expression was increased in the RCCS-cultured rNCSCs (Fig. 11B and Supplementary Fig. S7B). In this study, we observed increased ROCK1 activity and plasma membrane blebbing in the rNCSCs cultured under simulated microgravity (Figs. 4B and 8B). In addition, the appearance of neurite-like structures in the RCCS-cultured rNCSCs (Figs. 1E–H and 2B, F) may be correlated with increased RhoA-ROCK1 signaling, since previous studies have demonstrated that RhoA-ROCK1 signaling regulates dynamics of membrane protrusions and formation of neurite branching [170 –173].
Interestingly, in the RCCS-cultured rNCSCs, in spite of the appearance of neurite-like structures, we observed dramatically reduced expression of cortactin and vimentin (Fig. 5B), two cytoskeleton proteins required for formation and morphological regulation of neurites in neurons [113,114,174,175], indicating that the neurite-like structures formed under simulated microgravity were artifact and not real neurites. Formation of the neurite-like artifact has been previously reported in adult rat MSCs on serum withdrawal and DMSO or cytochalasin-B treatment [104]. Therefore, formation of the neurite-like artifact may be a common response of specific types of adult stem cells under stress.
Previous studies have shown that vimentin and cortactin are, respectively, subject to phosphorylation by ROCK1/2 and Rac1, which is also a member of the Rho family of GTPases [176,177]. It remains to be studied whether the expression of vimentin and cortactin is directly or indirectly regulated by ROCK1 or other signaling proteins in rNCSCs. Interestingly, cortactin deficiency was shown to increase ROCK1 expression to almost threefold [178], suggesting that, in addition to being a downstream effector of ROCK1, cortactin may also act upstream of ROCK1. Further studies will be required to elucidate the reciprocal regulatory roles between cortactin/vimentin and ROCK1 in rNCSCs, especially under simulated microgravity.
Multiple lines of evidence have shown that two downstream effectors of ROCK1/2 kinases, p38 MAPK and p53, display increased activity and/or expression in cells or organisms (rats or mice) grown under microgravity [162,179 –184]. Our results indicated significantly increased phosphorylation of p38 MAPK and nuclear localization of both p38 and p53, demonstrating increased activities of p38 and p53, in the rNCSCs cultured under simulated microgravity (Figs. 9B, 10B and 11B). The p38 MAPK, a critical mediator of cell apoptosis as well as downstream of ROCK1 and upstream of p53 [133,138 –140,185,186], displayed a significantly higher phosphorylation level in the nuclei of rNCSCs cultured under simulated microgravity (Figs. 3 and 9B).
PTX pretreatment or CXCR4 siRNA pretransfection significantly reduced the nuclear levels of p38, p53, and active caspase-3 (Figs. 3, 9C, D, 10C, D, as well as 11C, D), indicating that both p38 and p53 are downstream of RhoA and CXCR4 and are correlated with apoptosis induction.
Our results revealed that p53 colocalized with active caspase-3 in nuclei of rNCSCs cultured under both normal gravity and simulated microgravity (Fig. 11). Interestingly, in the 2D-cultured, PTX-pretreated, and CXCR4 siRNA pretransfected rNCSCs, p53+ and caspase-3+ nuclei accounted for only ∼50% of TUNEL+ nuclei; whereas in the untreated RCCS-cultured rNCSCs, p53+ and caspase-3+ nuclei accounted for averagely 67% of TUNEL+ nuclei (Fig. 10 and Supplementary Fig. S7). In fact, previous studies have shown that caspase-3 activation preceded the appearance of TUNEL signals during cell apoptosis [187,189], and, thus, active caspase-3+/TUNEL− and active caspase-3+/TUNEL+ nuclei exist, respectively, in the early and late phases of apoptosis. In addition, it has been reported that TUNEL assay cannot discriminate among apoptotic, necrotic, and autolytic cell death [190,191].
Therefore, by double immunostaining against TUNEL and active caspase-3, we demonstrated that, in the 2D-cultured, PTX-pretreated, and CXCR4 siRNA pretransfected groups, the proportions of apoptotic versus non-apoptotic cells in total dying rNCSCs were comparable; whereas in the RCCS-cultured group, the proportion of apoptotic cells in total dying rNCSCs was significantly higher than that of non-apoptotic cells (Supplementary Fig. S7E). Interestingly, it is noteworthy that the percentages of dying cells (ie, TUNEL+ cells) in total rNCSCs were comparable between normal gravity and simulated microgravity, indicating that microgravity promoted cell apoptosis but not total cell death (Fig. 3). In other words, culturing under simulated microgravity significantly decreased the proportion of necrotic and autolytic cells in total rNCSCs (data not shown).
Our results indicated that the increase of rNCSC apoptosis under simulated microgravity was mainly attributable to the increase of nuclear p53 expression (Figs. 3, 10 and 11).
In spite of the dramatically increased expression of nuclear p53 in the RCCS-cultured rNCSCs, simulated microgravity did not significantly alter the levels of p21Waf1/Cip1 expression and proliferation in rNCSCs (Supplementary Fig. S8). In fact, p53-independent regulation of cell proliferation has been reported in mouse neural progenitor cells and various types of human cancer cell lines [192,193]. In addition, p53-independent regulation of p21 expression has also been shown in mouse erythroleukemia cells, embryonic fibroblasts, and various types of human cancer cell lines [145,194,195]. It was demonstrated that p53-dependent induction of p21 expression mainly occurred after DNA damage, whereas the increase of p21 expression during cell differentiation and tissue development or after serum stimulation might be independent of p53 [145].
It is likely that p21 is mainly regulated by transcription factors other than p53 in rNCSCs, and the transcription factors are not subject to regulation by gravitational changes. Alternatively, p21 may be regulated simultaneously by p53 and other transcription factors in rNCSCs, and the effect of the increased p53 level on p21 expression under simulated microgravity may be balanced out by decreased levels of other transcription factors. Further studies will be required to discriminate which of the aforementioned situations applies to the regulation of p21 expression in rNCSCs under simulated microgravity.
Conclusions
Taken together, we show for the first time the intact molecular mechanism cross-linking cytoskeleton disorganization with increased apoptosis of rNCSCs under simulated microgravity. The whole molecular mechanism is illustrated in Fig. 12. The common signaling pathway upstream of cytoskeleton disorganization and cell apoptosis is composed of upregulated expression of CXCR4, increased activation of RhoA GTPase, and phosphorylation of ROCK1 (Fig. 12). ROCK1 may destabilize actin cytoskeleton and stress fibers directly, leading to cell membrane blebbing (Fig. 12).
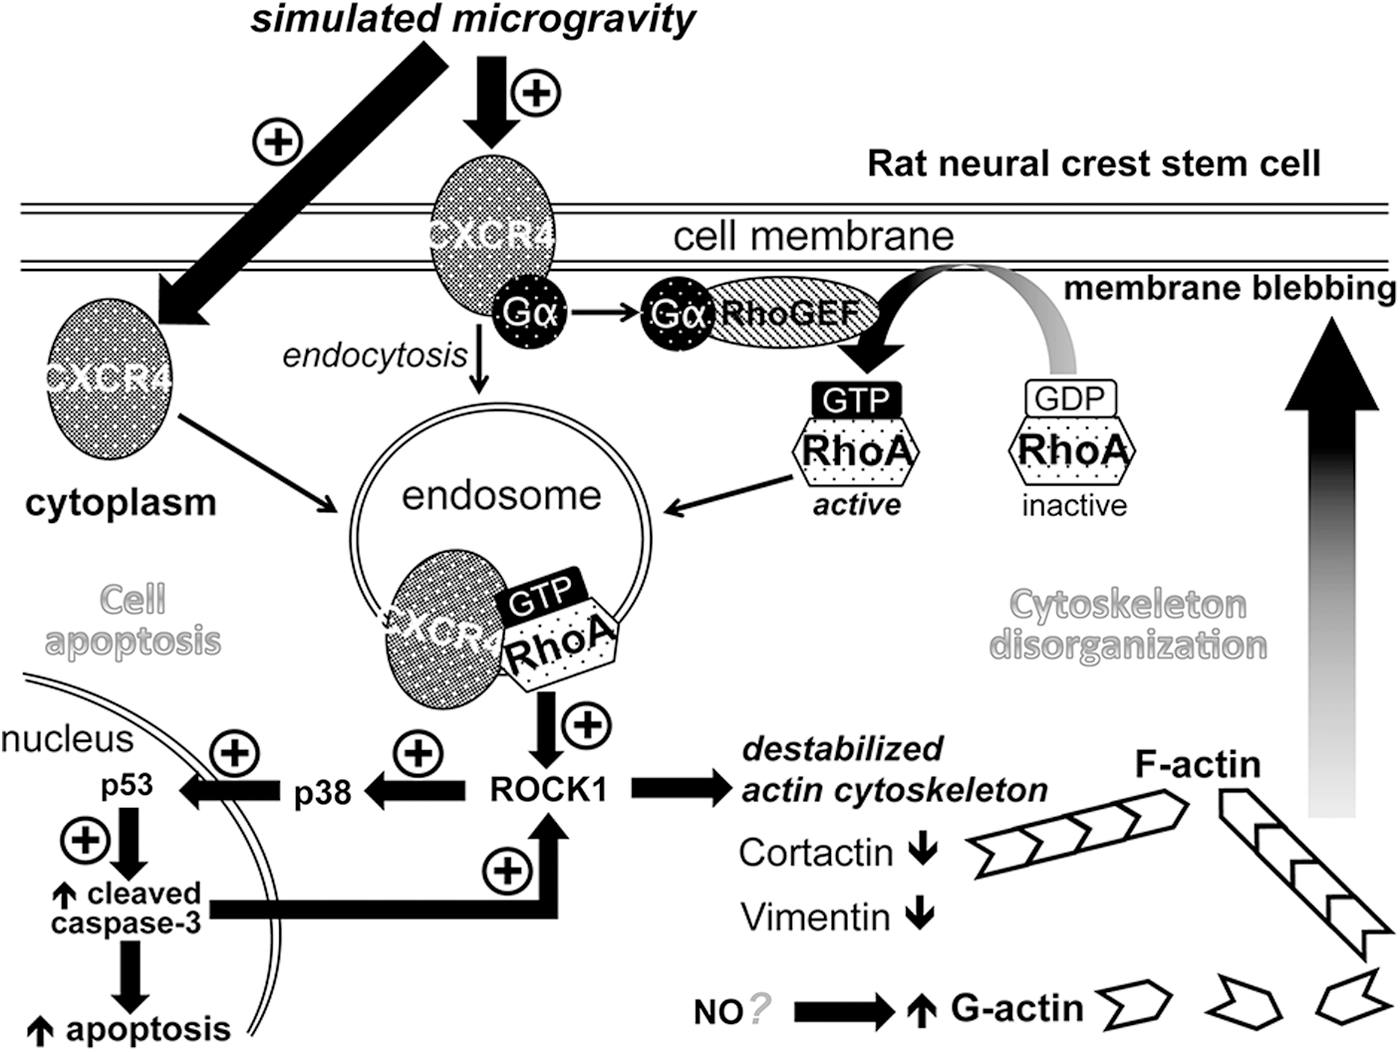
Schematic representation of the effects of simulated microgravity on rNCSCs. Our findings demonstrate that simulated microgravity increases expression of the CXCR4 receptor, which binds to and activates the α subunit of the heterotrimeric GTP-binding G protein, which, on activation, is recruited to interact with and activate RhoGEF, the guanine nucleotide exchange factor for Rho proteins [120 –122]. The activated RhoGEF, in turn, exchanges the GDP bound to RhoA for GTP, thus activating RhoA GTPase [120 –122]. The active RhoA GTPase mediates endosomal trafficking of CXCR4 and binds to the autoinhibitory domain of ROCK1 [125], leading to phosphorylation and activation of ROCK1, which may then phosphorylate and activate p38 MAPK [134,135], leading to nuclear translocation of p38 [136,137]. ROCK1 has also been shown to destabilize actin cytoskeleton and to promote plasma membrane blebbing [128,129]. On the other hand, the increased level of G-actin in rNCSCs may be associated with increased nitric oxide production, as demonstrated in a previous study [47]. In the nucleus, the activated p38 MAPK may be associated with an elevated level of p53 [140 –142] and lead to increased activation of caspase-3 and induction of cell apoptosis. The increased level of active caspase-3 may further amplify the activation of ROCK1 and enhance the apoptosis-associated plasma membrane blebbing [169,170]. Taken together, the RhoA-ROCK1-p38MAPK-p53 signaling pathway is essential for mediating microgravity-induced cytoskeleton disorganization, plasma membrane blebbing, and apoptosis of rNCSCs. ROCK1, Rho-associated kinase 1.
It remains to be studied whether deficiency of cortactin and vimentin in rNCSCs under simulated microgravity is downstream or upstream of ROCK1 activation. It is likely that the increased level of G-actin in the RCCS-cultured rNCSCs is correlated with the increased level of NO under simulated microgravity, as demonstrated in an immortalized human endothelial cell line in a previous study [47], and further studies will be required to verify the same phenomenon in rNCSCs. The signaling pathway inducing apoptosis of rNCSCs under simulated microgravity requires phosphorylation of p38 MAPK after ROCK1 activation, and results in an elevated level of p53 in the nucleus, leading to increased activation of caspase-3 and induction of cell apoptosis (Fig. 12).
Our results provide further evidence that the gravitational change or mechanical unloading exerts detrimental effects on the survival and cytoskeleton organization of adult multipotent stem cells, and the negative effects may result in decreased regenerative capability and therapeutic potential of adult stem cells both in vivo and in vitro in space or under mechanical stress.
Footnotes
Acknowledgments
The authors would like to acknowledge technical services provided by the Instrument Center of National Defense Medical Center. They would also like to thank Dr. Chang-Min Liang for critical comments and suggestions on this study. This work was supported by grant MAB102-48 from the National Defense Medical Affairs Bureau to Yi-Hui Chen.
Presented at the 10th Annual Meeting of Taiwan Society for Stem Cell Research in October, 2014 and the 41st Annual Meeting of National Defense Medical Research in November, 2014.
Author Disclosure Statement
No competing financial interests exist.
References
Supplementary Material
Please find the following supplemental material available below.
For Open Access articles published under a Creative Commons License, all supplemental material carries the same license as the article it is associated with.
For non-Open Access articles published, all supplemental material carries a non-exclusive license, and permission requests for re-use of supplemental material or any part of supplemental material shall be sent directly to the copyright owner as specified in the copyright notice associated with the article.