
Abstract
Mesenchymal stem cells (MSC) offer a novel approach to treatment of inflammatory disorders in humans and companion animals. Cats spontaneously develop a wide variety of inflammatory disorders and may potentially benefit from MSC-based therapies. Multiple genes are involved in immunomodulation by MSC and interspecies differences between expressions of these genes exist. The goals of the study were to characterize the expression of genes known to be involved in MSC-based immunomodulation and determine the effect of MSC on proliferation of T cells in coculture experiments with peripheral blood mononuclear cells (PBMC). Unstimulated MSC expressed all immunomodulatory genes studied except for IL-10. Levels of iNOS and FASL were low or undetectable at the RNA level. INFγ stimulation resulted in significant dose-dependent upregulation of IDO1, PD-L1, IL-6, COX2, and HGF. Levels of kynurenine were increased after 3-day incubation with INFγ. TNFα stimulation increased expression of IL-6 at both RNA and protein level as well as upregulated COX2 gene expression and PTGES1.Stimulation with both INFγ and TNFα resulted in significant increase in PGE2 levels in cell culture medium. MSC significantly decreased proliferation of ConA-stimulated PBMC in coculture experiments at 1:5 ratio. Our results suggest that feline MSC have similar immunomodulatory gene expression and react to inflammatory cytokines in a manner similar to human MSC. Thus, MSC may play an important role in treatment of feline disease as well as serve as an important translational species to evaluate MSC-based therapies of diseases common to both humans and cats.
Introduction
M
Many questions still remain unanswered such as the optimal route of injection, the dose to be used, and diseases that can be targeted. Use of large animal models such as cats may assist in the preclinical phase of investigations for humans. Cats spontaneously develop a variety of inflammatory disorders such as asthma [14], chronic idiopathic (interstitial) cystitis [16], chronic pancreatitis [17], chronic kidney disease [18], or inflammatory bowel disease [19], which can serve as potential translational models for cell-based therapies.
Many inflammatory mediators have been implicated in immunomodulatory properties of MSC. These factors include indoleamine 2,3-dioxygenase (IDO), inducible nitric oxide synthase (iNOS), prostaglandin E2 (PGE2), interleukin 10 (IL10), hepatocyte growth factor (HGF), transforming growth factor beta (TGFβ), interleukin 6 (IL6), programmed death ligand 1 (PD-L1), Fas ligand (FASL), and heme oxygenase-1 (HMOX1) [3,4,8,13,15,20 –23]. Interspecies differences exist in immunomodulation between human MSC and murine MSC [20,21,24]. In mice, the immunomodulation is considered to be iNOS dependent [25], while in humans it is IDO1 dependent and iNOS is expressed at very low levels [20,24].
Information on expression of immunomodulatory genes in cats is lacking. Therefore, the current study was undertaken to characterize the immunomodulatory properties of feline MSC.
Materials and Methods
Isolation of feline MSC
MSC were isolated from adipose tissue of adult cats [20.7 (±5.7) months] as previously described by our group MSC [26,27]. Tissues were collected from clinically healthy research colony-based animals under approved procedures of the Institutional Animal Care and Use Committee at Michigan State University (AUF#: 09/12-171-00). In brief, adipose tissue (2–4 g) was sterilely excised from subcutaneous tissues, minced, and incubated in Collagenase I (Sigma-Aldrich, St.Louis, MO) at a concentration of 1 mg/mL in HBSS (Sigma-Aldrich) for 2 h at 37°C with 5% CO2. The digested tissue was then passed through 70 μm cell strainer to create single-cell suspension and washed in sterile PBS (Sigma-Aldrich).
The cell pellet was then suspended in KNAC medium [Keratinocyte SFM medium (Gibco, Life Technologies, Thermo Fisher Scientific, Inc., Grand Island, NY) supplemented with 2 mM of N-acetyl-L-cysteine (Sigma-Aldrich) and 0.2 mM of L-ascorbic acid 2-phosphate (Sigma-Aldrich)] with 5% of MSC-grade FBS (Gibco, Life Technologies, Thermo Fisher Scientific, Inc.) and plated in a T25 flask. Cells were trypsinized with 0.05% trypsin after reaching 80% confluency and subsequently passaged using KNAC medium. At each passage, half of the cells were cryopreserved utilizing in Basal Medium (Gibco, Life Technologies, Thermo Fisher Scientific, Inc.) supplemented with 20% of FBS (Gibco, Life Technologies, Thermo Fisher Scientific, Inc.) and 10% DMSO (Sigma-Aldrich).
Cells utilized in the experiments described in the article were from passages 3–8. A total of 9 cell lines established from different cats were used interchangeably between the experiments.
Phenotypic characterization
All MSC cell lines were characterized for trilineage differentiation as well as expression of CD90, CD44, MHCII, and CD105 on cell surface of the cells.
Trilineage differentiation was accomplished through utilization of StemPro (Gibco, Life Technologies, Thermo Fisher Scientific, Inc.) differentiation medium specific for each lineage. Experiments were carried out according to manufacturer's recommendations in 24-well plates (USA Scientific, Ocala, FL) for adipogenesis and osteogenesis. For chondrogenesis, instead of using a plate, a 15 mL spinning tube was utilized to form micromass of 106 number of cells/tube. Cells were incubated in differentiation media for at least 2 weeks before staining for adipogenesis, utilizing Oil-O-red stain. Two-week incubation period was also used for characterization of chondrogenesis and subsequent alcian blue staining. Cells in the osteogenesis group were incubated for 3 weeks and stained with alizarin red stain.
Expression of cell surface markers CD90, CD44, CD105, and MHCII was analyzed with flow cytometry using previously described [28,29] antibodies: CD90 (clone 5E10; BD Biosciences, San Jose, CA), CD44 (clone IM7.8.1; Invitrogen, Life Technologies, Thermo Fisher Scientific, Inc., Grand Island, NY), CD105 (clone SN6; Invitrogen, Life Technologies, Thermo Fisher Scientific, Inc.), and MHCII (clone Tu39; BD Biosciences, San Jose, CA). All samples were characterized using LSRII flow cytometer (BD Biosciences). Data were then analyzed using commercially available software (FlowJo; LLC, Ashland, OR).
Peripheral blood mononuclear cells isolation
Peripheral blood was collected into EDTA tubes. Peripheral blood mononuclear cells (PBMC) were isolated using gradient centrifugation with Histopaque-1077 (Sigma-Aldrich) in Accuspin tubes (Sigma-Aldrich) according to manufacturer's recommendations. Isolation of feline PBMCs using Histopaque-1077 has been previously described [30]. The cellular interface was collected, washed twice with PBS (Sigma-Aldrich), and cryopreserved in Basal Medium (Gibco, Life Technologies, Thermo Fisher Scientific, Inc.) supplemented with 20% of FBS (Gibco, Life Technologies, Thermo Fisher Scientific, Inc.) and 10% DMSO (Sigma-Aldrich).
Interferon gamma and tumor necrosis factor alpha stimulation
To evaluate the effects of inflammatory cytokines interferon gamma (INFγ) and tumor necrosis factor alpha (TNFα) on gene expression of feline MSC, 2 × 10⁵ cells were plated in a six-well plate in KNAC medium, allowed to attach overnight, and stimulated with increasing concentrations of feline recombinant INFγ (R&D Systems, Minneapolis, MN), ranging from 0.25 to 50 ng/mL, or of feline recombinant TNFα (R&D Systems), ranging from 0.25 to 10 ng/mL. Cells were incubated for 24 h for gene expression studies. Both cells and supernatant were collected and frozen for subsequent analysis at −80°C. For protein/metabolite assays cells were stimulated for both 24 and 72 h. In each experiment MSC isolated from five different donors were utilized.
Quantitative real-time PCR
For gene expression analysis, RNA was isolated using mirVana Isolation kit (Life Technologies, Thermo Fisher Scientific, Inc.). RNA was quantified on Qubit 2.0 Fluorometer using Qubit RNA HS assay kit (Life Technologies, Thermo Fisher Scientific, Inc.). Quality of RNA was evaluated using Bioanalyzer (Agilent, Santa Clara, CA) or Caliper LabChip GX (PerkinElmer, Waltham, MA). Only RNA with RNA integrity number higher than eight was used for subsequent analyses.
Reverse transcription was accomplished using Superscript III reverse transcription kit (Invitrogen, Thermo Fisher Scientific, Inc.) and random primer hexamers (Promega, Fitchburg, WI).
QPCR was performed using custom-designed TaqMan primers (Life Technologies, Thermo Fisher Scientific, Inc.; Supplementary Table S1; Supplementary Data are available online at
Data analysis was performed using relative quantification method (ΔΔCT method) [31]. Relative quantification data were log2 transformed (Log2RQ) for normalization and displayed as such in all figures [32].
Protein quantification
IL10 and HGF concentrations were assessed using feline-specific ELISA kits (R&D Systems and MyBioSource, Inc., San Diego, CA respectively). Feline IL6 and multispecies TGFβ1 were used to quantify the respective proteins using Milliplex magnetic bead-based assays (Millipore, Billerica, MA) according to the manufacturer's recommendations. ELISA plates were analyzed in triplicate using a plate reader (PerkinElmer), while bead-based assays were analyzed in duplicate using Luminex 100 machine (Luminex Corporation, Austin, TX).
PGE2 quantification
A 50-μL aliquot of each cell culture medium was transferred to a polypropylene microcentrifuge tube. Then, 200 μL of methanol with 0.01% BHT (Tokyo Kasei Kogyo Co., Tokyo, Japan) and PGE2-d 9 (Cayman Chemical, Ann Arbor, MI) as the internal standard were added. After vortexing for 1 min, the mixture was centrifuged at 10,000 g for 10 min at 4°C.
One hundred microliters supernatant was transferred to an amber autosampler vial with 250-μL glass insert in preparation for LC-MS/MS analysis. Liquid chromatography separations were performed using an Ascentis Express C18 column (10 cm × 2.1 mm; 2.7 μm particles; Sigma-Aldrich) maintained at 50°C on a Waters ACQUITY UPLC system (Waters, Milford, MA). The autosampler was cooled to 10°C, and injection volume was set to 5 μL. Mobile phase A was 0.1% formic acid in water and mobile phase B was acetonitrile. The flow rate of the LC gradient was 0.3 mL/min. The mobile phase gradient began at 1% B, followed by a linear increase to 40% B at 2 min; then to 80% B at 8 min, and 99% B at 9 min, at which the composition was held until 13 min; then returned to 1% B until 15 min. PGE2 eluted at 4.32 min.
The LC column was connected to a Waters Xevo TQ-S triple quadrupole mass spectrometer. PGE2 and PGE2-d 9 were analyzed with electrospray ionization (ESI) multiple reaction monitoring (MRM) in negative-ion mode at transitions of m/z 351.2 → 271 for PGE2 and 360.2 → 280 for PGE2-d 9. Each transition was monitored with a 0.163 s dwell time. The optimized cone voltages of 55 V and 21 V and collision energy of 16 V were selected for both PGE2 and PGE2-d 9. Other MS parameters were as follows: capillary voltage, 2.5 kV; source temperature, 150°C; desolvation temperature, 500°C; desolvation gas flow rate, 600 L/h; and cone gas flow rate, 150 L/h.
Calibration solutions were prepared by serial dilution of PGE2 (Cayman Chemical) stock solution by methanol to concentrations of 20, 4, 0.8, 0.2, 0.05, 0.02, and 0.01 ng/mL. Internal standard PGE2-d 9 was added to each calibration solution with the same amount as added in cell culture medium. For quantification, the ratio of PGE2 peak area to its internal standard peak area was plotted against the concentration, fitted by a weighted (1/x) linear regression using the TargetLynx component of MassLynx 4.1 software (Waters).
IDO activity measurement
5 × 10⁵ MSC were plated in a T25 flask in KNAC medium with 5%FBS and allowed to attach overnight. Cell culture medium was then changed to KNAC medium with 5% FBS supplemented with 100 μM Tryptophan (Sigma-Aldrich). After a 3-day incubation, the cell culture supernatant was collected and analyzed. To measure the IDO-mediated tryptophan catabolism, a spectrophotometric method was utilized to detect kynurenine, a stable catabolite of IDO, as previously described [33] with slight modifications. Cell culture medium was mixed with 30% trichloroacetic acid at a 2:1 ratio, mixed and spun down at 10,000 rpm. Supernatant was then mixed in equal volume with Ehrlich reagent in a 96-well microplate (R&D Systems). Optical density was then read at 492 nm utilizing a plate reader (PerkinElmer).
Coculture experiments
MSC were plated at a density of 104 cells per well in KNAC medium with 5% FBS and irradiated with 30 Gy using X-RAD320 irradiator (Precision X-ray; North Branford, CT) to stop proliferation. Previous reports have indicated that prestimulation with inflammatory cytokines potentiate the immunomodulatory properties of MSC [20,25], therefore, we wanted to investigate if that is the case in feline MSC. To assess the effect of prestimulation, cells were prestimulated with the cytokines INFγ (50 ng/mL), TNFα (10 ng/mL), or both INFγ and TNFα (50 and 10 ng/mL, respectively) for 2 h before addition of PBMCs.
Isolated allogenic PBMCs were thawed and washed in PBS. Subsequently cells were quantified and assessed for viability utilizing Countess cell counter (Life Technologies, Thermo Fisher Scientific, Inc.). All PBMCs were cryopreserved only short-term for 48–72 h. PBMCs were then suspended in RPMI1640 (Life Technologies, Thermo Fisher Scientific, Inc.) with 10% FBS (Life Technologies, Thermo Fisher Scientific, Inc.) and added at a ratio of 1:5 of MSC to PBMC. Proliferation of lymphocytes was induced by 5 ng/mL of ConA (Sigma-Aldrich). Cells were pulsed with EdU (Life Technologies, Thermo Fisher Scientific, Inc.) 24 h before the end of the 3-day incubation period. Fluorescence intensity was then measured using fluorescent plate reader (PerkinElmer).
Background fluorescence assessed from wells containing only MSC was subtracted from the total fluorescent values in coculture wells. Experiments shown represent a single allogenic PBMC donor cocultured with MSC derived from four different donors.
Statistical analysis
Each data set was analyzed for normality using Shapiro–Wilk normality test. Gene expression data were analyzed using ANOVA with post hoc Dunnett's test for normally distributed data, while Friedman test with post hoc Dunn's test was used for nonparametric data. Protein, metabolite, and cellular response data were analyzed using t-test or nonparametric Wilcoxon-signed rank test. All analyses were performed using GraphPad Prism 6 (GraphPad Software, Inc., La Jolla, CA).
Results
Isolation and characterization of MSC
All MSC isolated strongly expressed the cell surface markers CD90, CD105, and CD44 and did not express MHCII (Fig. 1). They also underwent trilineage differentiation into chondrocytes, adipocytes, and osteocytes as previously described by our group [27] (Fig. 2).

Flow cytometric characteristics of feline MSC used in this study. Note that all the cell lines are strongly expressing MSC markers CD90, CD44, and CD105, while lack expression of MHCII. MSC, mesenchymal stem cell.

Representative pictures presenting differentiation potential of isolated MSC into adipocytes
Quantitative real-time PCR
All cell lines constitutively expressed IDO1, COX2, PTGES1, PTGES2, PTGES3, HGF, TGFβ1, IL6, PD-L1, and HMOX1. IL10 was undetectable at RNA level, while levels of iNOS and FASL were low or undetectable.
Stimulation with varying concentrations of INFγ resulted in increased expression of IDO1 (8.5–12.3 Log2-fold increase, P < 0.001), which reached plateau at concentrations at 5 ng/mL (Fig. 3A).

Expression of IL-6 was upregulated after exposure to INFγ as well (Fig. 3A, 0.3–2.1 Log2-fold increase, P < 0.001), with increased expression being statistically significant at levels as low as 1 ng/mL of cytokine.
Concentrations of INFγ as low as 0.1 ng/mL significantly upregulated expression of PD-L1 (Fig. 3A, 1.5–3.7 Log2-fold increase, P < 0.001), while expression of HGF rose gradually with cytokine concentration increment (Fig. 3A, 0.29–1.8 Log2-fold increase, at 0.25–50 ng/mL of INFγ, P < 0.001), with statistically significant result at as low 1 ng/mL of INFγ.
Stimulation with as low as 5 ng/mL of INFγ resulted in significant increase in COX2 expression compared with unstimulated cells (0.98–1.62 Log2-fold increase, P < 0.05 to P < 0.01, Fig. 3A). Interestingly, levels of PTGES1 decreased significantly after stimulation with 50 ng of INFγ (−0.45 Log2-fold difference, P < 0.05, Fig. 3A).
Stimulation of MSC with as low as 0.25 ng/mL of TNFα resulted in significantly increased expression of IL6 (Fig. 3B, 2.7–5.2 Log2-fold difference, P < 0.001). Expression of COX2 and PTGES1 significantly increased at doses 2.5 and 10 ng/mL of TNFα (COX2: 2.08 Log2-fold increase, P < 0.01 and 2.014 Log2-fold increase, P < 0.05, respectively; PTGES1: 0.758 Log2-fold increase, P < 0.05 and 0.8 Log2-fold increase, P < 0.01, respectively; Fig. 3B).
To determine if uPA levels were responsible for decrease of levels of HGF in our protein assay, we investigated uPA levels after stimulation with a single dose of INFγ. This stimulation resulted in significant upregulation of uPA at gene expression level (2.47 Log2-fold increase, P < 0.05, Fig. 3A).
All other genes tested remained unaltered by stimulation with inflammatory cytokines.
In summary, we have identified that 24-h stimulation of INFγ results in significant dose-dependent upregulation of IDO1, IL6, PD-L1, COX2, and uPA, while decreased PTGES1. TNFα stimulation resulted in upregulation of COX2 and PTGES1.
Protein and metabolite quantification
Levels of IL6 increased after stimulation with each cytokine over 72 h (TNFα, P < 0.01; INFγ, P < 0.05; both, P < 0.001; Fig. 4A). Levels of IL6 were also affected by inflammatory environment after 24-h cytokine stimulation (Supplementary Fig. S1).

After 72 h of stimulation with TNFα, amount of TGFβ1 significantly increased (P < 0.05; Fig. 4B), while stimulation with both INFγ and TNFα decreased the concentration of secreted TGFβ1 compared with unstimulated cells (P < 0.01; Fig. 4B).
Interestingly, there were no differences in the concentration of HGF between different conditions at 72 h, but levels of HGF decreased significantly after 3 days of incubation compared with day 1 (Supplementary Fig. S3), and were on the lower end of detection of the assay.
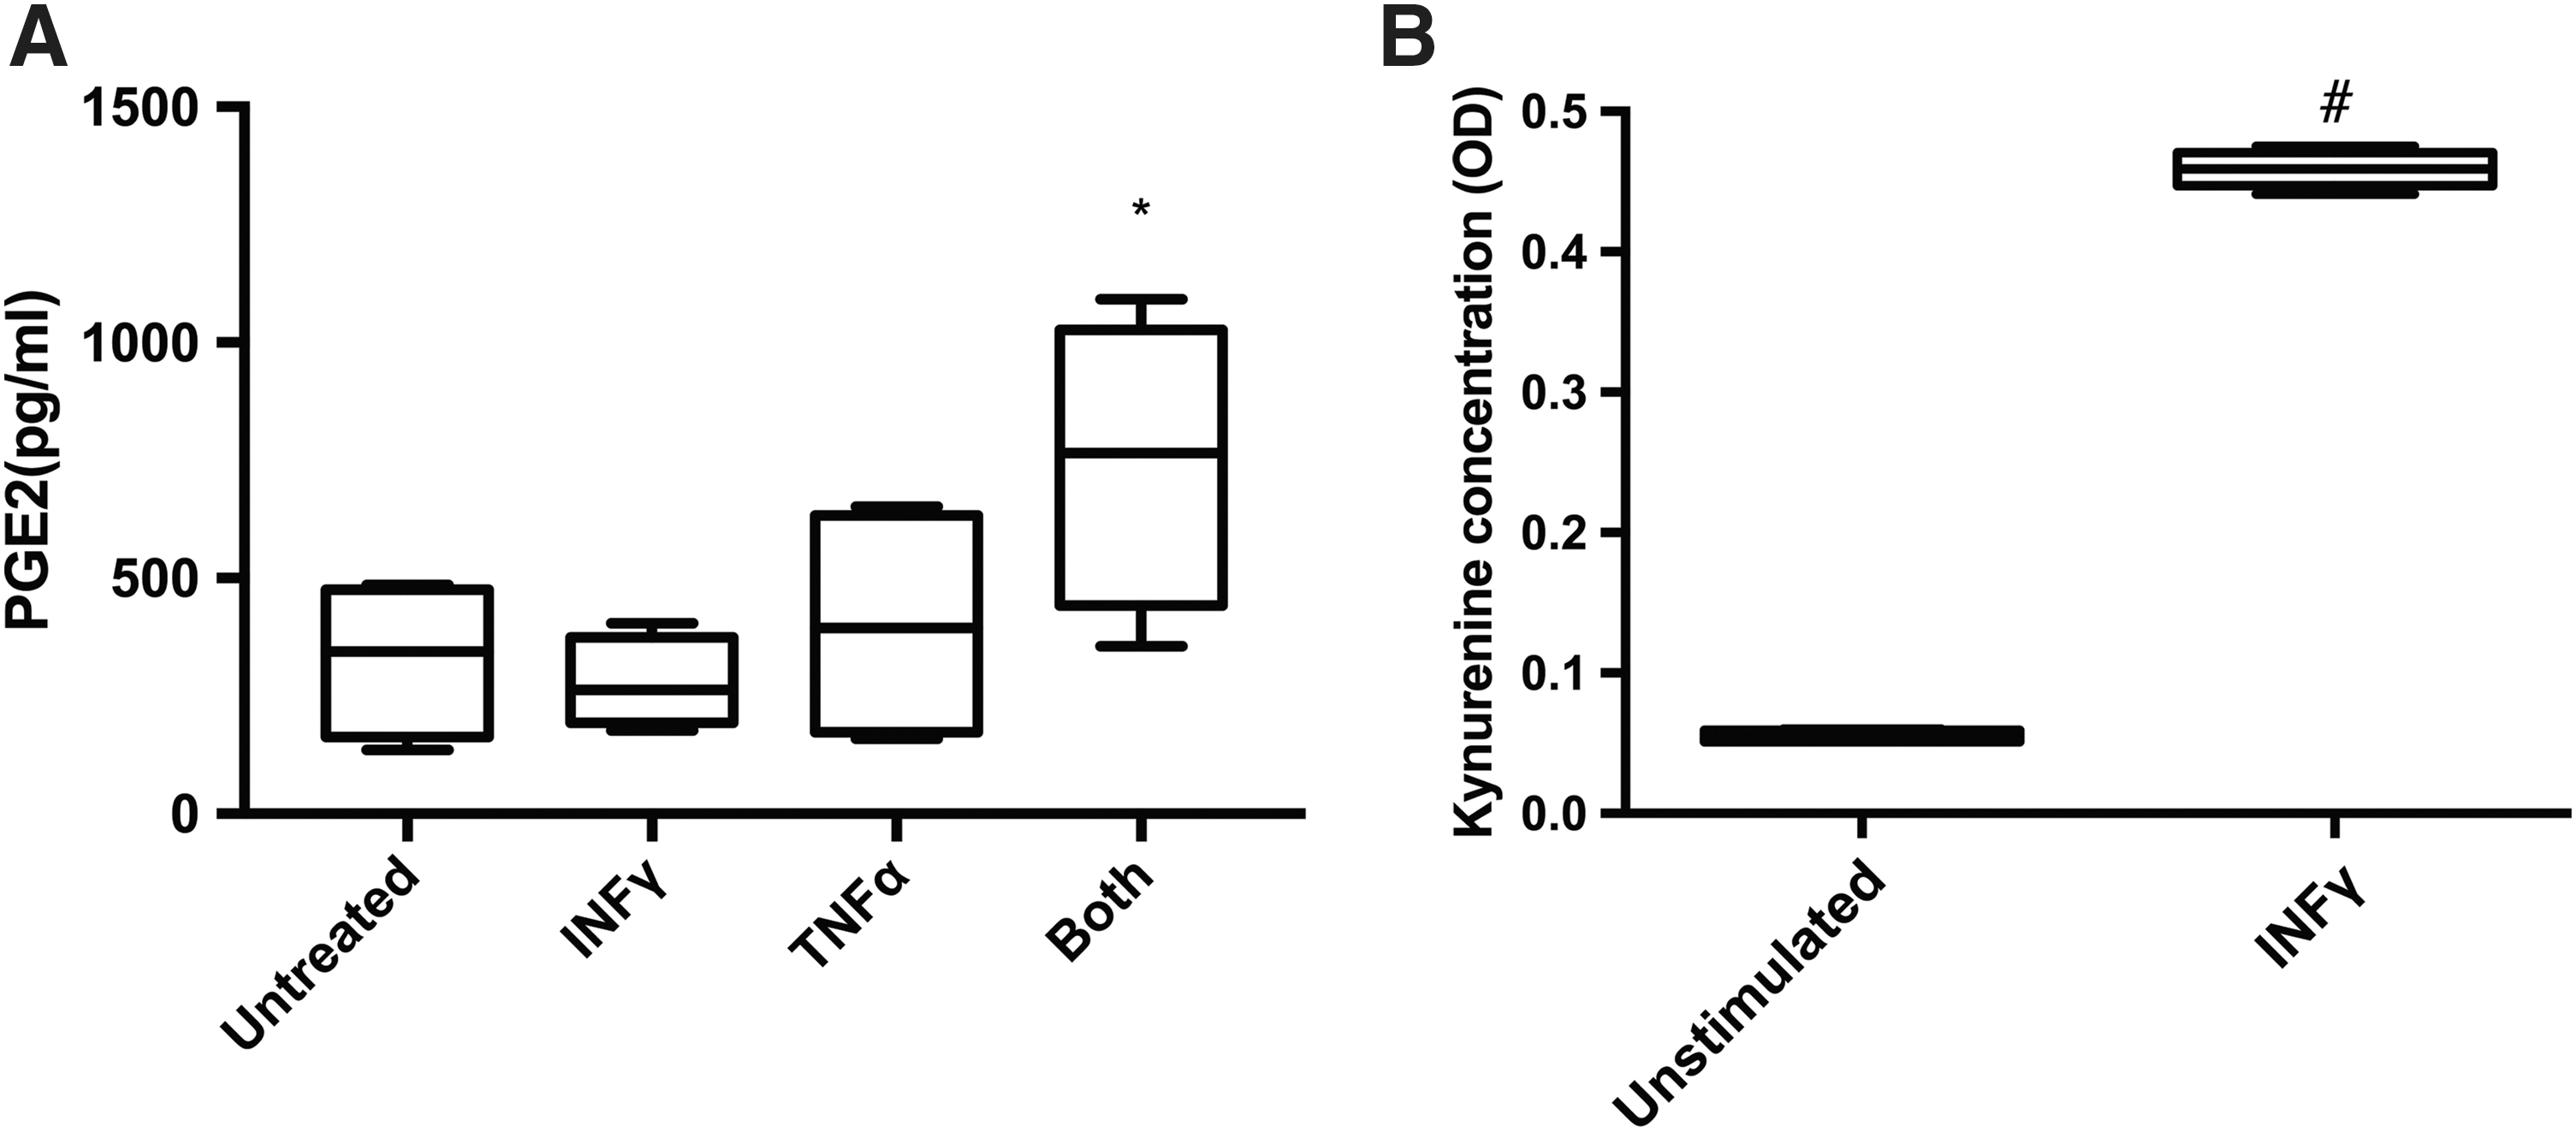
Levels of PGE2 significantly increased after stimulation of cell with both INFγ and TNFα for 3 days (P < 0.05, Fig. 5A).
IL10 values were below the detection limit of the only commercially available assay for feline IL10.
IDO activity
INFγ stimulation significantly increased kynurenine levels in cell culture supernatants after 3 days of incubation compared with unstimulated cells (P < 0.001, Fig. 5B).
Coculture experiments
Coculture of irradiated MSC with ConA-stimulated PBMCs at 1:5 ratio significantly blocked the proliferation of PBMCs as measured by EdU incorporation assay (P < 0.001; Fig. 6). Prestimulation of MSC with either INFγ or with both INFγ and TNFα did not change this effect.
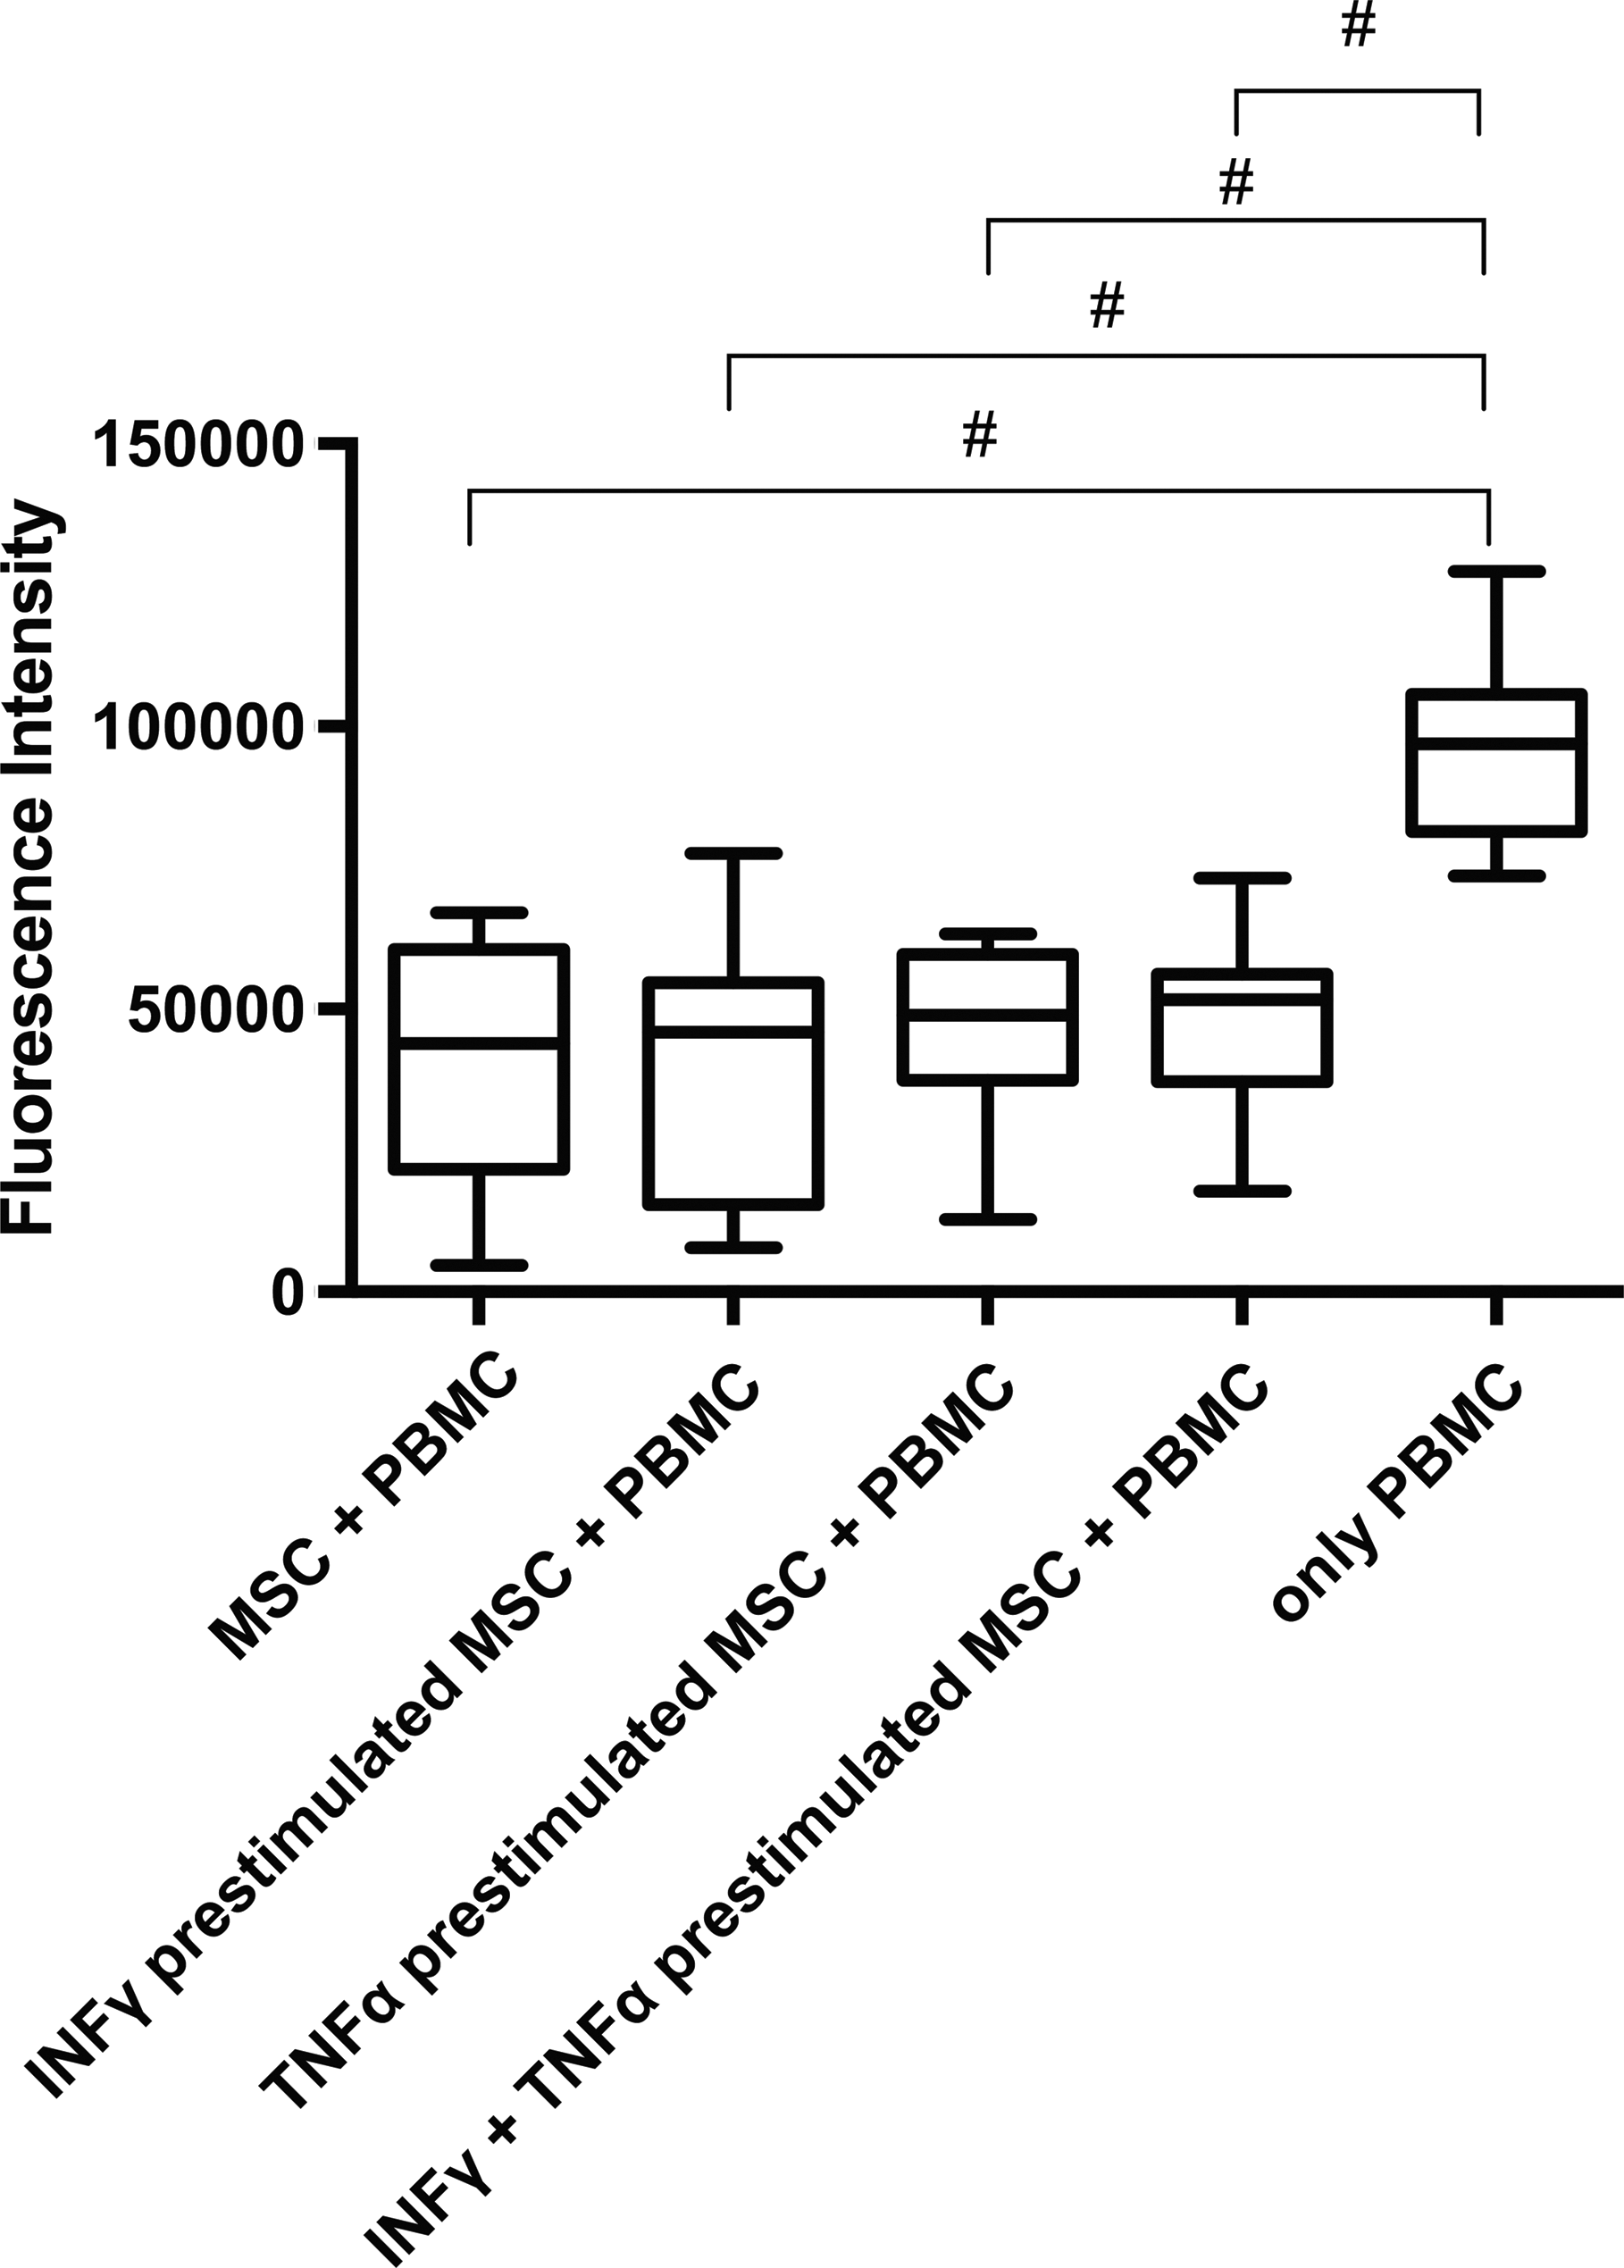
Coculture experiment revealed a strong decrease in PBMC proliferation at 1:5 ratio as measured by fluorescence intensity after subtraction of background proliferation of MSC. No effect of prestimulation with INFγ, TNFα, or both INFγ and TNFα was identified n = 4, each assay was run in triplicate. # P < 0.001.
Discussion
The data presented in this study document that feline MSC constitutively express IDO1, PTGES1, PTGES2, PTGES3, HGF, TGF-beta, IL6, PD-L1, and HMOX1. Significantly, stimulation with INFγ for 24 h resulted in up to 12 Log2-fold increase in IDO1 expression in MSC, in a manner similar to those observed in human MSC upon stimulation with this cytokine [34]. The upregulation was confirmed through measurement of kynurenine, an IDO1-mediated tryptophan metabolite. The increase in this metabolite was clearly detectable after 3 days of INFγ incubation.
Interestingly, IDO1 is strongly upregulated and functional in human MSC [20,34], whereas in the mouse, this gene is not responsive to INFγ [3,21,24]. Mouse MSC induce iNOS upon stimulation with INFγ, one of the key molecules involved in murine immunomodulation [25,35]. Expression of iNOS by feline MSC in our experimental conditions was low or undetectable, which closely parallel human MSC [24].
Expression of IL6 was upregulated by both INFγ and TNFα stimulation at the RNA level and that was further confirmed by protein assays. Constitutive expression of IL6 is characteristic for MSC [36,37].
FASL and IL10 transcripts were undetectable in the feline MSC and stimulation using INFγ and TNFα did not change this. FASL expression has been recently put forth as being important for MSC-mediated T cell apoptosis [15]. Interestingly, the authors of that study did not detect expression of PD-L1 in MSC. However, we have observed strong induction of PD-L1 after stimulation with INFγ. Our findings are concordant with data reported from placenta-derived MSC [38,39], where expression of PD-L1, but not FASL, has been reported. Thus, MSC may use different effectors to induce apoptosis of T cells. The differences may arise from culture conditions, source of MSC (adipose, placenta, bone marrow). In previously described studies, bone marrow-derived [15,39] and placenta-derived cells were utilized [22].
Expression of IL10 by feline MSC was not detectible in our study both at the gene and protein expression level. At the protein level, the signals generated were below the limit of detection of the commercially available feline IL10 assay (<125 pg/mL,). Reports on the production of IL10 by MSC are not concordant. In some studies with human MSC, IL10 was detectable at the gene expression level [40] and at the protein level [21,22], while in others, no IL10 was detected [3,41]. Both the source of MSC and culture conditions may affect the production of IL10.
We have also identified that feline MSC upregulated COX2 in response to both INFγ and TNFα stimulation, although all of the PGE2 syntheses were strongly expressed in our data set, we identified significant increase in PTGES1 expression only after TNFα stimulation, while stimulation with INFγ resulted in significant decrease in expression at the highest dose given. The results on PTGES1 have to be treated with caution as the changes, although statistically significant, may not be biologically effective due to low level of changes.
We also identified significant increase in PGE2 levels in cell culture medium after stimulation of MSC with both INFγ and TNFα, while this effect was not identified after stimulation with only a single cytokine. One potential hypothesis would be that increased degradation of PGE2 through upregulation of enzyme responsible for PGE2 degradation HPGD (Hydroxyprostaglandin Dehydrogenase 15-[NAD]). We have investigated this possibility and no increase in expression of HPGD was identified after stimulation with cytokines studied (data not shown). Thus, we hypothesize that strong expression of PGE2 syntheses in our experimental setting have precluded additional induction through stimulation. Another explanation could be potential species-specific differences in prostaglandin metabolism and further work would need to be done to answer this question.
Release of HGF by feline MSC into the supernatant was significantly decreased in all of the conditions and the amount of HGF further decreased at 72 h. In a study with human MSC, 24-h stimulation with INFγ was reported to increase HGF release by 10 times [42], however, the INF γ concentration used was four times higher (200 ng/mL) compared to our study. Thus, different doses of INFγ may induce release of HGF at different time points. HGF is being released as an inactive precursor, and for it to be fully functional, it requires proteolytic cleavage through urokinase-type plasminogen activator (uPA) [43]. To investigate if this enzyme is being induced by INFγ, we performed QPCR analysis of uPA after cytokine stimulation. We found significant 2- Log2-fold induction of uPA after stimulation of MSC with INFγ dose used in ELISA studies (50 ng/mL). One could speculate that this allows for HGF to be bound by its receptor MET. Interestingly, we found that after 3 days of incubation the levels of HGF were hardly detectable in all the conditions measured, which may suggest that HGF is being cleaved by uPA in all of the conditions.
The levels of TGFβ1 were significantly higher after stimulation with TNFα for 3 days, while lower after stimulation with both INFγ and TNFα for 3 days. The reason for this disparity is unknown. In one study on human MSC, the levels of TGFβ1 almost doubled after stimulation with INFγ [42]. In another study, stimulation of human MSC with INFγ and/or TNFα resulted in decreased production of TGFβ1 [44]. Importantly, we also identified that TGFβ1 is constitutively expressed by feline MSC and TGFβ1was detected as early as after 24 h of stimulation (Supplementary Fig. S2).
Feline adipose-derived MSC significantly blocked proliferation of ConA-stimulated PBMCs both in naïve state as well as post-prestimulation with INFγ, TNFα, or both. No difference was noted between the prestimulated and naïve cells in our experiments and mixed results have been previously reported in this aspect [25,42,45]. The MSC-mediated blockade of ConA PBMC proliferation was previously described [46] and our results are similar to these previously presented.
Significant reduction of stimulated PBMCs seen in coculture studies described above, along with the gene expression of immunomodulatory molecules documented, provides a strong rationale for clinical utilization of MSCs in treatment of feline inflammatory disease as well as for the utilization of cats in translational studies.
The current study documents that feline MSC share many similarities in immunomodulatory properties as human MSC and adds to the limited information available from large animal systems. Spontaneously occurring chronic inflammatory disorders in cats and dogs may serve as translational models of MSC-based therapy of human diseases [47]. Studies of MSC in mice have previously reported differences in mice compared to humans, especially with regard to expression of INOS versus IDO [21,24]. The appropriateness of mice models for human immune disorders has recently been challenged [48 –50]. Although mouse models will remain important tools in the biomedical field [51], use of spontaneously occurring disorders in cats can potentially successfully fill in the gap between mouse and human in development of new treatment strategies for a variety of disorders [47,52].
The immunomodulatory properties of feline adipose-derived MSC documented in this study provide the rational for the utilization of MSC-based approaches to feline diseases with inflammatory components for the treatment of both the feline diseases as well as an informative translational system, valuable for development of human therapies.
Footnotes
Acknowledgments
Authors thank the Morris Animal Foundation Fellowship Award (D13FE-405), and grants from the Michigan State University Center for Feline Health and Well Being and the Michigan State University, College of Veterinary Medicine Endowed Research Funds for their financial support. We thank Dr. Simon Petersen-Jones, Dr. Laurence Occelli, and Kristin Koehl, LVT for their assistance with animals and Dr. Yasser Aldhamen and Dr. Andrea Amalfitano for their help with performing Luminex assays. Authors thank Kyle Anderson, Taylor Aiello, and Jean Lafontaine Rivera for assisting with some aspects of this project.
Author Disclosure Statement
No competing financial interests exist
References
Supplementary Material
Please find the following supplemental material available below.
For Open Access articles published under a Creative Commons License, all supplemental material carries the same license as the article it is associated with.
For non-Open Access articles published, all supplemental material carries a non-exclusive license, and permission requests for re-use of supplemental material or any part of supplemental material shall be sent directly to the copyright owner as specified in the copyright notice associated with the article.