
Abstract
Marrow adipocytes pose a significant problem in post-transplant regeneration of hematopoiesis owing to their negative effects on regeneration of hematopoiesis. However, the precise mechanism operative in this negative regulation is not clear. In this study, we show that marrow adipocytes express neuropilin-1 (NRP1) as a function of differentiation and inhibit regeneration of hematopoiesis by three principal mechanisms: one, by inducing apoptosis in hematopoietic stem/progenitor cells (HSPCs) through the death receptor-mediated pathway; two, by downregulating CXCR4 expression on the HSPCs through ligand-mediated internalization; and three, by secreting copious amounts of transforming growth factor β1 (TGFβ1), a known inhibitor of hematopoiesis. Silencing of NRP1 in these adipocytes rescued the apoptosis of cocultured HSPCs and boosted the CXCR4 surface expression on them, showing an active role of NRP1 in these processes. However, such silencing had no effect on TGFβ1 secretion and consequent inhibition of hematopoiesis by them, showing that secretion of TGFβ1 by adipocytes is independent of NRP1 expression by them. Surprisingly, mesenchymal stromal cells modified with NRP1 supported expansion of HSPCs having enhanced functionality, suggesting that NRP1 exerts a context-dependent effect on hematopoiesis. Our data demonstrate that NRP1 is an important niche component and exerts context-dependent effects on HSPCs. Based on these data, we speculate that antibody- or peptide-mediated blocking of NRP1-HSC interactions coupled with a pharmacological inhibition of TGFβ1 signaling may help in combating the negative regulation of post-transplant regeneration of hematopoiesis in a more effective manner.
Introduction
T
Myeloablation leads to an increase in the number of adipocytes in the marrow and these adipocytes negatively affect the regeneration of hematopoiesis [4,8,9]. However, the precise mechanism involved in this negative regulation of hematopoiesis by adipocytes has not been elucidated. This is an important issue because if the molecular interactions happening in this process are identified, effective pharmacological strategies can be devised to improve recovery of hematopoiesis after HSC transplantation.
Hematopoietically inactive fatty marrow comprising adipocytes contains high levels of neuropilin-1 (NRP1) compared with the active red marrow [10], suggesting that perhaps NRP1 may have a role in the adipocyte-mediated negative regulation of hematopoiesis. Adipocytes are known to hamper granulopoiesis through NRP1 [11]. Similarly, stromal cells were thought to interfere with osteoblast-mediated enhancement of hematopoiesis through upregulation of NRP1 [12]. Conversely, NRP1 was speculated to be involved in cytokine secretion by stromal cells after their interaction with HSCs [13]. It is interesting to note that besides adipocytes, which are negative regulators of hematopoiesis, the positive regulators of hematopoiesis such as osteoblasts and endothelial cells also express NRP1 [14]. This paradoxical situation raises a question whether NRP1 has any active role to play in the niche-mediated regulation of hematopoiesis or it is just a bystander molecule having no function in the hematopoietic activity of these cells.
In the present study, we examined whether NRP1 participates in the negative regulation of hematopoiesis by adipocytes.
Materials and Methods
Experimental animals
C57BL/6J (CD45.2) and B6.SJL-PtprcaPepcb/BoyJ (Ptprc; CD45.1) mice (Jackson Laboratory) were bred in the experimental animal facility of NCCS, Pune, India. They were given free access to food and water. All the protocols used in the study were approved by the Institutional Animal Ethics Committee and performed according to the respective guidelines.
Cells
Murine bone marrow-derived mesenchymal stromal cells (BMSCs) and M2-10B4, a cell line of murine BM origin (ATCC CRL-1972), were used in the experiments. M2-10B4 cells have been shown to support hematopoiesis in vitro [15 –17]. BM cells isolated from bones of C57BL/6J mice were cultured in Iscove's modified Dulbecco's medium (IMDM; HiMedia) with 20% fetal bovine serum (FBS; mesenchymal stem cell-specific FBS from STEMCELL Technologies). After 48 h, the nonadherent cells were discarded and adherent cells were fed with fresh medium. At confluence, the cells were trypsinized and plated in fresh flasks in 1:2 ratio. The BMSCs at 3–5 passages were used for experiments. M2-10B4 cell line (M2) was purchased from ATCC and maintained in Roswell Park Memorial Institute medium 1640 (RPMI 1640; HiMedia) with 10% FBS (GIBCO; Invitrogen, Life Technologies). Phenotypic characterization of BMSCs and M2-10B4 cells has been reported in our previous publication [17]. BMSCs were positive for typical MSC surface markers, viz., Sca1, CD44, CD73, CD90.1, CD105, and CD106, and were negative for hematopoietic surface markers, CD45 and CD34, and they could differentiate towards all three mesenchymal lineages [17].
Lineage-negative (Lin−) cells were isolated from BM mononuclear cells (MNCs) of B6.SJL-PtprcaPepcb/BoyJ mice by using biotin-labeled anti-mouse lineage antibody cocktail prepared from Biotin Mouse Lineage panel (BD Pharmingen) and Dynabeads® biotin binder (Invitrogen).
Lin− Sca-1+ c-Kit+ (LSK) cells were sort-purified from BM MNCs of B6.SJL-PtprcaPepcb/BoyJ mice using BD FACS ARIA.
Cloning and transfection
Full-length NRP1 gene amplified from cDNA of HT1080 cells was cloned in the mammalian expression vector, eGFPN1 (Clonetech), between BglII and SalI restriction sites. Human and mouse Nrp1 genes share 95% homology. Plasmids encoding Nrp1-specific shRNAs or scrambled sequences were purchased from Origene. Both NRP1-eGFPN1 construct and shNRP1/scrambled sequences expressing plasmid constructs were independently transfected into M2 cells using Lipofectamine transfection reagent (Invitrogen). The positively transfected cells were selected against G418 (600 μg/mL; Invitrogen; for NRP1-eGFPN1) and puromycin (2 μg/mL; Invitrogen; for shNRP1/scrambled sequences) resistance. Positive clones were purified by sorting the GFP/RFP-positive cells using BD FACS ARIA. M2 cells expressing NRP1/eGFPN1 were named as M2-NRP1, eGFPN1 as M2-control, NRP1-specific shRNA as M2-shNRP1, and scrambled sequence as M2-Scr.
Adipocytic differentiation
Cells were treated with standard adipogenic differentiation medium comprising insulin (4 μg/L; Invitrogen), 3-isobutyl, 1-methyl xanthine (500 μM), dexamethasone (0.25 μM), and indomethacin (200 μM) (Sigma-Aldrich) for 5 days and then with 2 μg/mL insulin for 15–18 days. The adipogenic differentiation was confirmed by staining lipid droplets with Oil Red O dye (Sigma-Aldrich). The adipocytes differentiated from BMSCs, M2-10B4, M2-Scr, and M2-shNRP1 were named as BMSC-adipo, M2-adipo, M2-Scr-adipo, and M2-shNRP1-adipo, respectively.
Coculture assay
A total of 1 × 10⁵ Lin− or sort-purified LSK cells were cocultured with BMSCs, BMSC-adipo; M2-control (transfected with eGFPN1), M2-NRP1; M2-control (undifferentiated), M2-adipo; and M2-Scr-control, M2-Scr-adipo and M2-shNRP1-adipo for 7 days. The medium was supplemented with 25 ng/mL murine interleukin (IL)-6, 25 ng/mL murine stem cell factor (SCF), and 10 ng/mL murine IL-3 (Peprotech). After 7 days of coculture, these cells were harvested and subjected to further assays.
For culture with recombinant NRP1 (rNRP1), in one set, rNRP1 (0.5 μg/well; Peprotech) was coated onto wells of a 24-well plate overnight at 4°C, and in the other set, rNRP1 (0.5 μg/mL) was added in the culture media.
For inhibition of transforming growth factor β (TGFβ)-mediated signaling, SB431542 (Sigma-Aldrich) was added in the cocultures at a concentration of 10 μM. It was replenished after every 48 h.
Cell adhesion assay
A total of 1 × 10⁵ sort-purified LSK hematopoietic stem/progenitor cells (HSPCs) were seeded either on the wells of a 24-well plate coated with bovine serum albumin (BSA) or rNRP1, and on M2-control or M2-NRP1 cells for 6 h. Nonadherent cells were washed off using phosphate-buffered saline. The adhered cells were harvested by trypsinization and manually counted using a Neubauer chamber. Percent adhered LSK cells were calculated as follows: (No. of LSK cells adhered/total no. of cells seeded) × 100.
Western blotting
Whole cell lysates were prepared using RIPA lysis buffer [10 mM Tris pH 7.4, 100 mM NaCl, 1 mM ethylenediaminetetraacetic acid, 1 mM ethylene glycol tetraacetic acid, 1% Triton X-100, 0.1% sodium dodecyl sulfate (SDS), and 0.5% sodium deoxycholate] supplemented with phosphatase inhibitor-1, phosphatase inhibitor-2, protease inhibitor cocktail, 1 mM phenyl methyl sulfonyl fluoride, 1 mM sodium orthovanadate, and 1 mM sodium fluoride (Sigma-Aldrich). Protein concentration of samples was determined using the Micro-BCA™ Protein Assay Kit (Thermo Scientific). Equal protein samples were separated by SDS-polyacrylamide gel electrophoresis and transferred to polyvinylidene fluoride membranes (Bio-Rad Laboratories) for detection of specific proteins using specific primary and secondary antibodies (Supplementary Table S1; Supplementary Data are available online at
Gene expression studies
Cells were lysed in lysis buffer and mRNA was isolated using the Dynal mRNA Isolation Kit (Invitrogen) and cDNA was synthesized using Superscript II enzyme (Invitrogen) as per the manufacturers' instructions. The cDNA was subjected to quantitative real-time or semiquantitative RT-PCR using gene-specific primers (Supplementary Table S2). Data were normalized with GAPDH as an endogenous control. Quantitative real-time experiments were performed using Platinum® SYBR® Green qPCR SuperMix-UDG (Invitrogen) to quantify the gene expression on ABI 7500 Fast (Applied Biosystems). ABI 7500 Fast Real-Time PCR Software (preinstalled in the computer provided with the system) was used to analyze the gene expression data and threshold cycle (C T) value, dC T value, and relative quantification (RQ) value were determined. RQ value was calculated as RQ value = 2−ddCT.
Immunofluorescence studies
M2-NRP1 cells grown on coverslips were fixed with freshly prepared buffered 4% paraformaldehyde (pH 7.4), blocked with 1% BSA, and stained with specific antibodies (Supplementary Table S1). Images were captured on a Confocal laser microscope (LSM 510 META; Carl Zeiss; 63 × /oil/1.4 NA objective).
Long-term culture-initiating cells and colony-forming unit assays
Lin− cells (1 × 10⁵ cells/well) isolated from BM were seeded on irradiated (8,000 rads, γ rays; Co60) M2-control or M2-NRP1 cells cultured in 24-well plates in MyeloCult long-term hematopoietic progenitor cell culture media (STEMCELL Technologies) supplemented with freshly prepared hydrocortisone (Sigma-Aldrich). Cultures were maintained for 4 weeks with half medium change twice a week. Cells were harvested after 4 weeks and subjected to colony-forming unit (CFU) assay.
CFU assays were performed using methylcellulose medium containing 10 ng/mL murine IL-6, 10 ng/mL murine SCF, 10 ng/mL murine IL-3, and 2 U/mL erythropoietin (Peprotech) for development of colonies. The plates were incubated for 14 days in humidified atmosphere at 37°C in a 5% CO2 incubator. The colonies were manually counted under a phase-contrast microscope using standard morphological criteria.
Flow cytometry
Cocultured hematopoietic cells were stained with fluorescently tagged antibodies (Supplementary Table S1). The isotype-stained cells were used as controls. The stained cells were acquired on BD FACS Canto II and analyzed using BD FACS-DIVA SOFTWARE, version 5.0.
For cell cycle analysis, cocultured hematopoietic cells were first stained with Hoechst (1 μg/mL) and then with Pyronin Y (0.5 μg/mL; Sigma-Aldrich) in Hanks' balanced salt solution buffer containing 20 mM HEPES (Sigma) and 50 μM verapamil (Sigma). The cells were then stained with lineage cocktail-APC, Sca1-FITC, and cKit-PECy7. Gated LSK cells were analyzed for their cell cycle status.
For apoptosis analysis, cells were stained with Annexin V-FITC and analyzed on a flow cytometer.
BM transplantation
A total of 1 × 10⁶ donor cells (Ptprc mice, CD45.1) harvested from various cocultures were infused along with 2 × 10⁵ fresh MNCs from C57BL/6J mice (as survival dose, CD45.2) intravenously into lethally irradiated C57BL/6J (CD45.2) recipient mice (9.5 Gy γ rays, Co60) through the tail vein within 24 h of irradiation. Multilineage engraftment analysis of peripheral blood (PB) was carried out after 4 and 16 weeks post-transplant. PB was collected in heparin-containing tubes by orbital plexus bleeding using sterile capillaries. The blood samples were directly stained with PE-conjugated anti-mouse CD45.1, FITC-conjugated anti-mouse CD 45.2, APC-conjugated anti-mouse CD3e, Pacific blue-conjugated anti-mouse CD45R (B220), PECy7-conjugated anti-mouse CD11b, and PECy7-conjugated anti-mouse Ly6G/6C (BD Pharmingen) antibodies (Supplementary Table S1). After staining with antibodies, RBCs were lysed using RBC lysis solution (BD Pharmingen) at room temperature for 10 min and acquired on BD FACS Canto II. The engraftment levels of donor cells were also determined in the BM after 16 weeks of transplantation. For secondary transplantation, engrafted donor cells from primary recipients were sort-purified by BD FACS ARIA and 1 × 10⁶ sorted cells were infused into secondary lethally irradiated recipients and engraftment analysis was done as described above.
Migration assay
Cocultured cells were analyzed for their migration ability toward CXCL12/SDF1α; 1 × 10⁵ cocultured hematopoietic cells were suspended in 100 μL of IMDM +1% fetal calf serum and seeded into 0.8-μm transwell inserts (Corning). Medium containing CXCL12 (100 ng; Peprotech) was added in the lower chamber. The migrated cells were counted after 6 h and % migration was calculated as follows: (No. of migrated cells/No. of seeded cells) × 100.
Statistical analysis
Data were analyzed by Sigma Stat software using one-way repeated measures analysis of variance (Jandel Scientific Software) and plotted as mean ± standard error of mean. Significance is indicated in figures as follows: *P ≤ 0.05, **P ≤ 0.01, and ***P ≤ 0.001.
Results
BMSCs express NRP1 as a function of adipocytic differentiation
Since NRP1 is highly expressed in inactive fatty marrow compared with active red marrow [10], we speculated that NRP1 expression may perhaps be related to the differentiation state of BMSCs, which are the precursors of adipocytes. To validate this hypothesis, we incubated murine BMSCs in standard adipocytic induction media to differentiate them into adipocytes. Adipocytic differentiation was confirmed by staining the cells with Oil Red O (Fig. 1A). Results of western blot experiments showed that naïve BMSCs did not express NRP1 at a detectable level, but when they were differentiated toward adipocytic lineage, the NRP1 levels went up (Fig. 1B and Supplementary Table S1). Results of quantitative RT-PCR experiments showed that naïve BMSCs expressed Nrp1-specific mRNA, but it increased significantly after adipocytic differentiation (Fig. 1C and Supplementary Table S2). Expression of Ppar-g was used as the marker of adipocytic differentiation. These data demonstrate that NRP1 is expressed as a function of adipocytic differentiation.
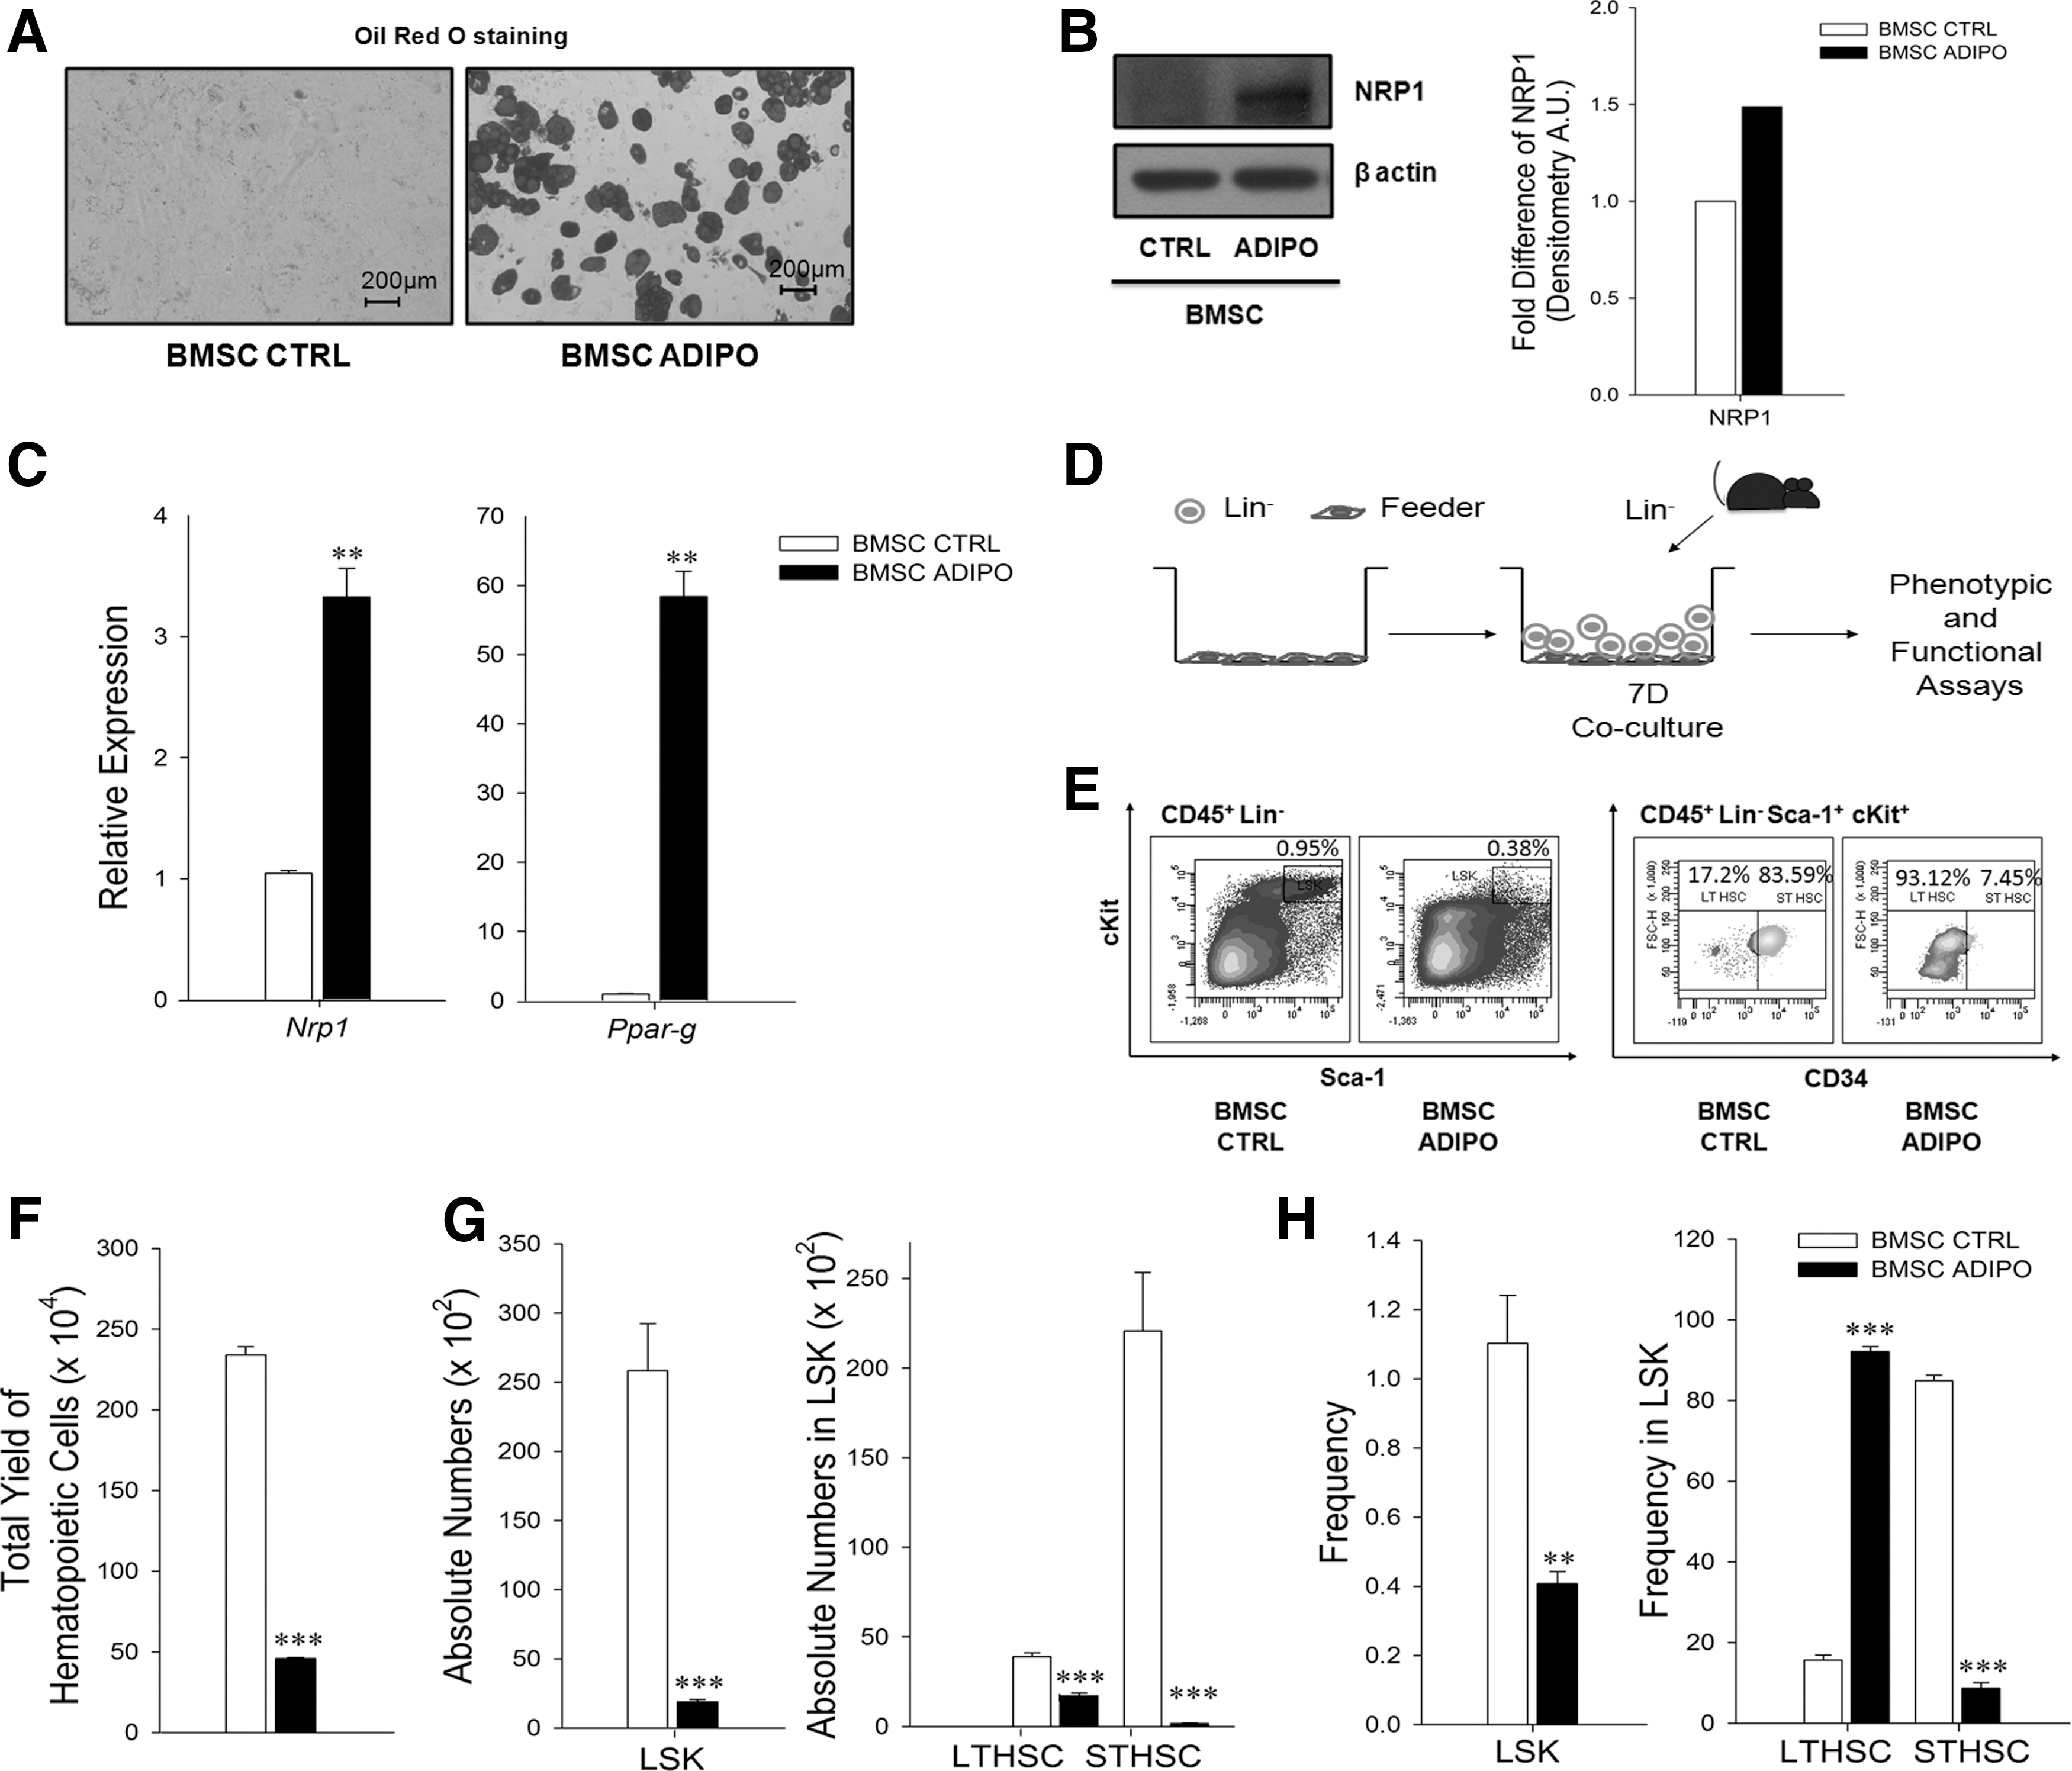
Adipocytes differentiated from BMSCs express NRP1 and suppress hematopoiesis.
In vitro differentiated adipocytes inhibit hematopoiesis
To examine whether the adipocytes differentiated from BMSCs in vitro inhibit regeneration of hematopoiesis, we cocultured them with HSC-enriched Lin− fraction of BM cells (hereafter referred to as Lin− cells; adipo-cocultures). Cocultures set with naïve BMSCs were used as controls (control-cocultures). Phenotypically defined HSPC subsets present in the output cells were enumerated by flow cytometry after 7 days of coculture (Fig. 1D, E). We found that the total output of hematopoietic cells and the absolute numbers of LSK-, long-term (LT-, LSK CD34-), and short-term (ST-; LSK CD34+) HSCs were significantly reduced in adipo-cocultures compared with control-cocultures (Fig. 1F, G). The frequencies of LSK-HSCs and ST-HSCs were also significantly affected, and as a consequence of reduction in ST-HSCs, the relative frequency of LT-HSCs became comparatively higher in the output cells from adipo-cocultures (Fig. 1H).
These data showed that the in vitro differentiated adipocytes exert a negative effect on the regeneration of hematopoiesis.
rNRP1 has no effect on hematopoietic regeneration
We then verified whether NRP1 by itself has any effect on the regeneration of hematopoiesis. In one set of experiments, we added recombinant soluble NRP1 (rNRP1) in the feeder-free cultures of Lin− cells, while in the second set, we coated the wells of tissue culture plates with rNRP1 and cultured Lin− cells in them. We found that addition of rNRP1 did not affect total hematopoietic cell yield or HSPC frequencies in either set (Supplementary Fig. S1A, B), showing that rNRP1 does not have any direct effect on regeneration of hematopoiesis.
HSPCs interact with NRP1
This lack of effect by rNRP1 on the HSPCs prompted us to examine whether the HSPCs physically interact with it. To determine this, sort-purified LSK HSPCs were seeded in wells coated with rNRP1 or BSA and on M2-control or M2-NRP1 cells. After 6 h, the nonadherent cells were washed off and the adherent cells were manually counted. We found that a significantly higher number of LSK HSPCs adhered to the coverslips coated with rNRP1 compared with the BSA-coated ones (Supplementary Fig. S1C). Similarly, M2-NRP1 cells showed a significantly higher percentage of LSK HSPCs adhering to them compared with M2-control cells (Supplementary Fig. S1C). These data showed that HSPCs physically interact with NRP1.
Exogenous expression of NRP1 in mesenchymal stromal cells boosts their hematopoiesis support
Since rNRP1 by itself did not affect hematopoiesis, but they did interact with rNRP1 and M2-NRP1 cells, we speculated that perhaps it needs to be presented in the context of stromal cells to have any effect. To examine this possibility, Lin− cells were cocultured with M2-control (M2-control-cocultures) or M2-NRP1 (M2-NRP1-cocultures; Supplementary Fig. S2A, B) for 7 days, and the output cells were analyzed by multicolor flow cytometry. Surprisingly, we found that M2-NRP1 cells supported a significantly higher proliferation of hematopoietic cells compared with controls (Fig. 2A). The frequencies of LSK- and LT-HSCs as well as the absolute numbers of all HSPC subsets were also significantly higher in M2-NRP1-cocultures (Fig. 2B, C). Frequency of ST-HSCs was reduced in M2-NRP1-cocultures. Similar results were observed when sort-purified LSK cells were cocultured with M2-control and M2-NRP1 (Supplementary Fig. S2H, I). Progenitor cell analyses showed that the frequencies as well as the absolute numbers of common myeloid progenitors (CMPs), megakaryocyte erythroid progenitors (MEPs), and multipotent progenitors (MPPs) were significantly high in the output cells in the M2-NRP1-cocultures (Supplementary Fig. S2C, D). The frequencies of granulocyte–macrophage progenitor (GMP) and common lymphoid progenitors (CLPs) were significantly lower in M2-NRP1-cocultures (Supplementary Fig. S2D). The absolute number of GMPs was low in M2-NRP1-cocultures, but that of CLPs was not affected.
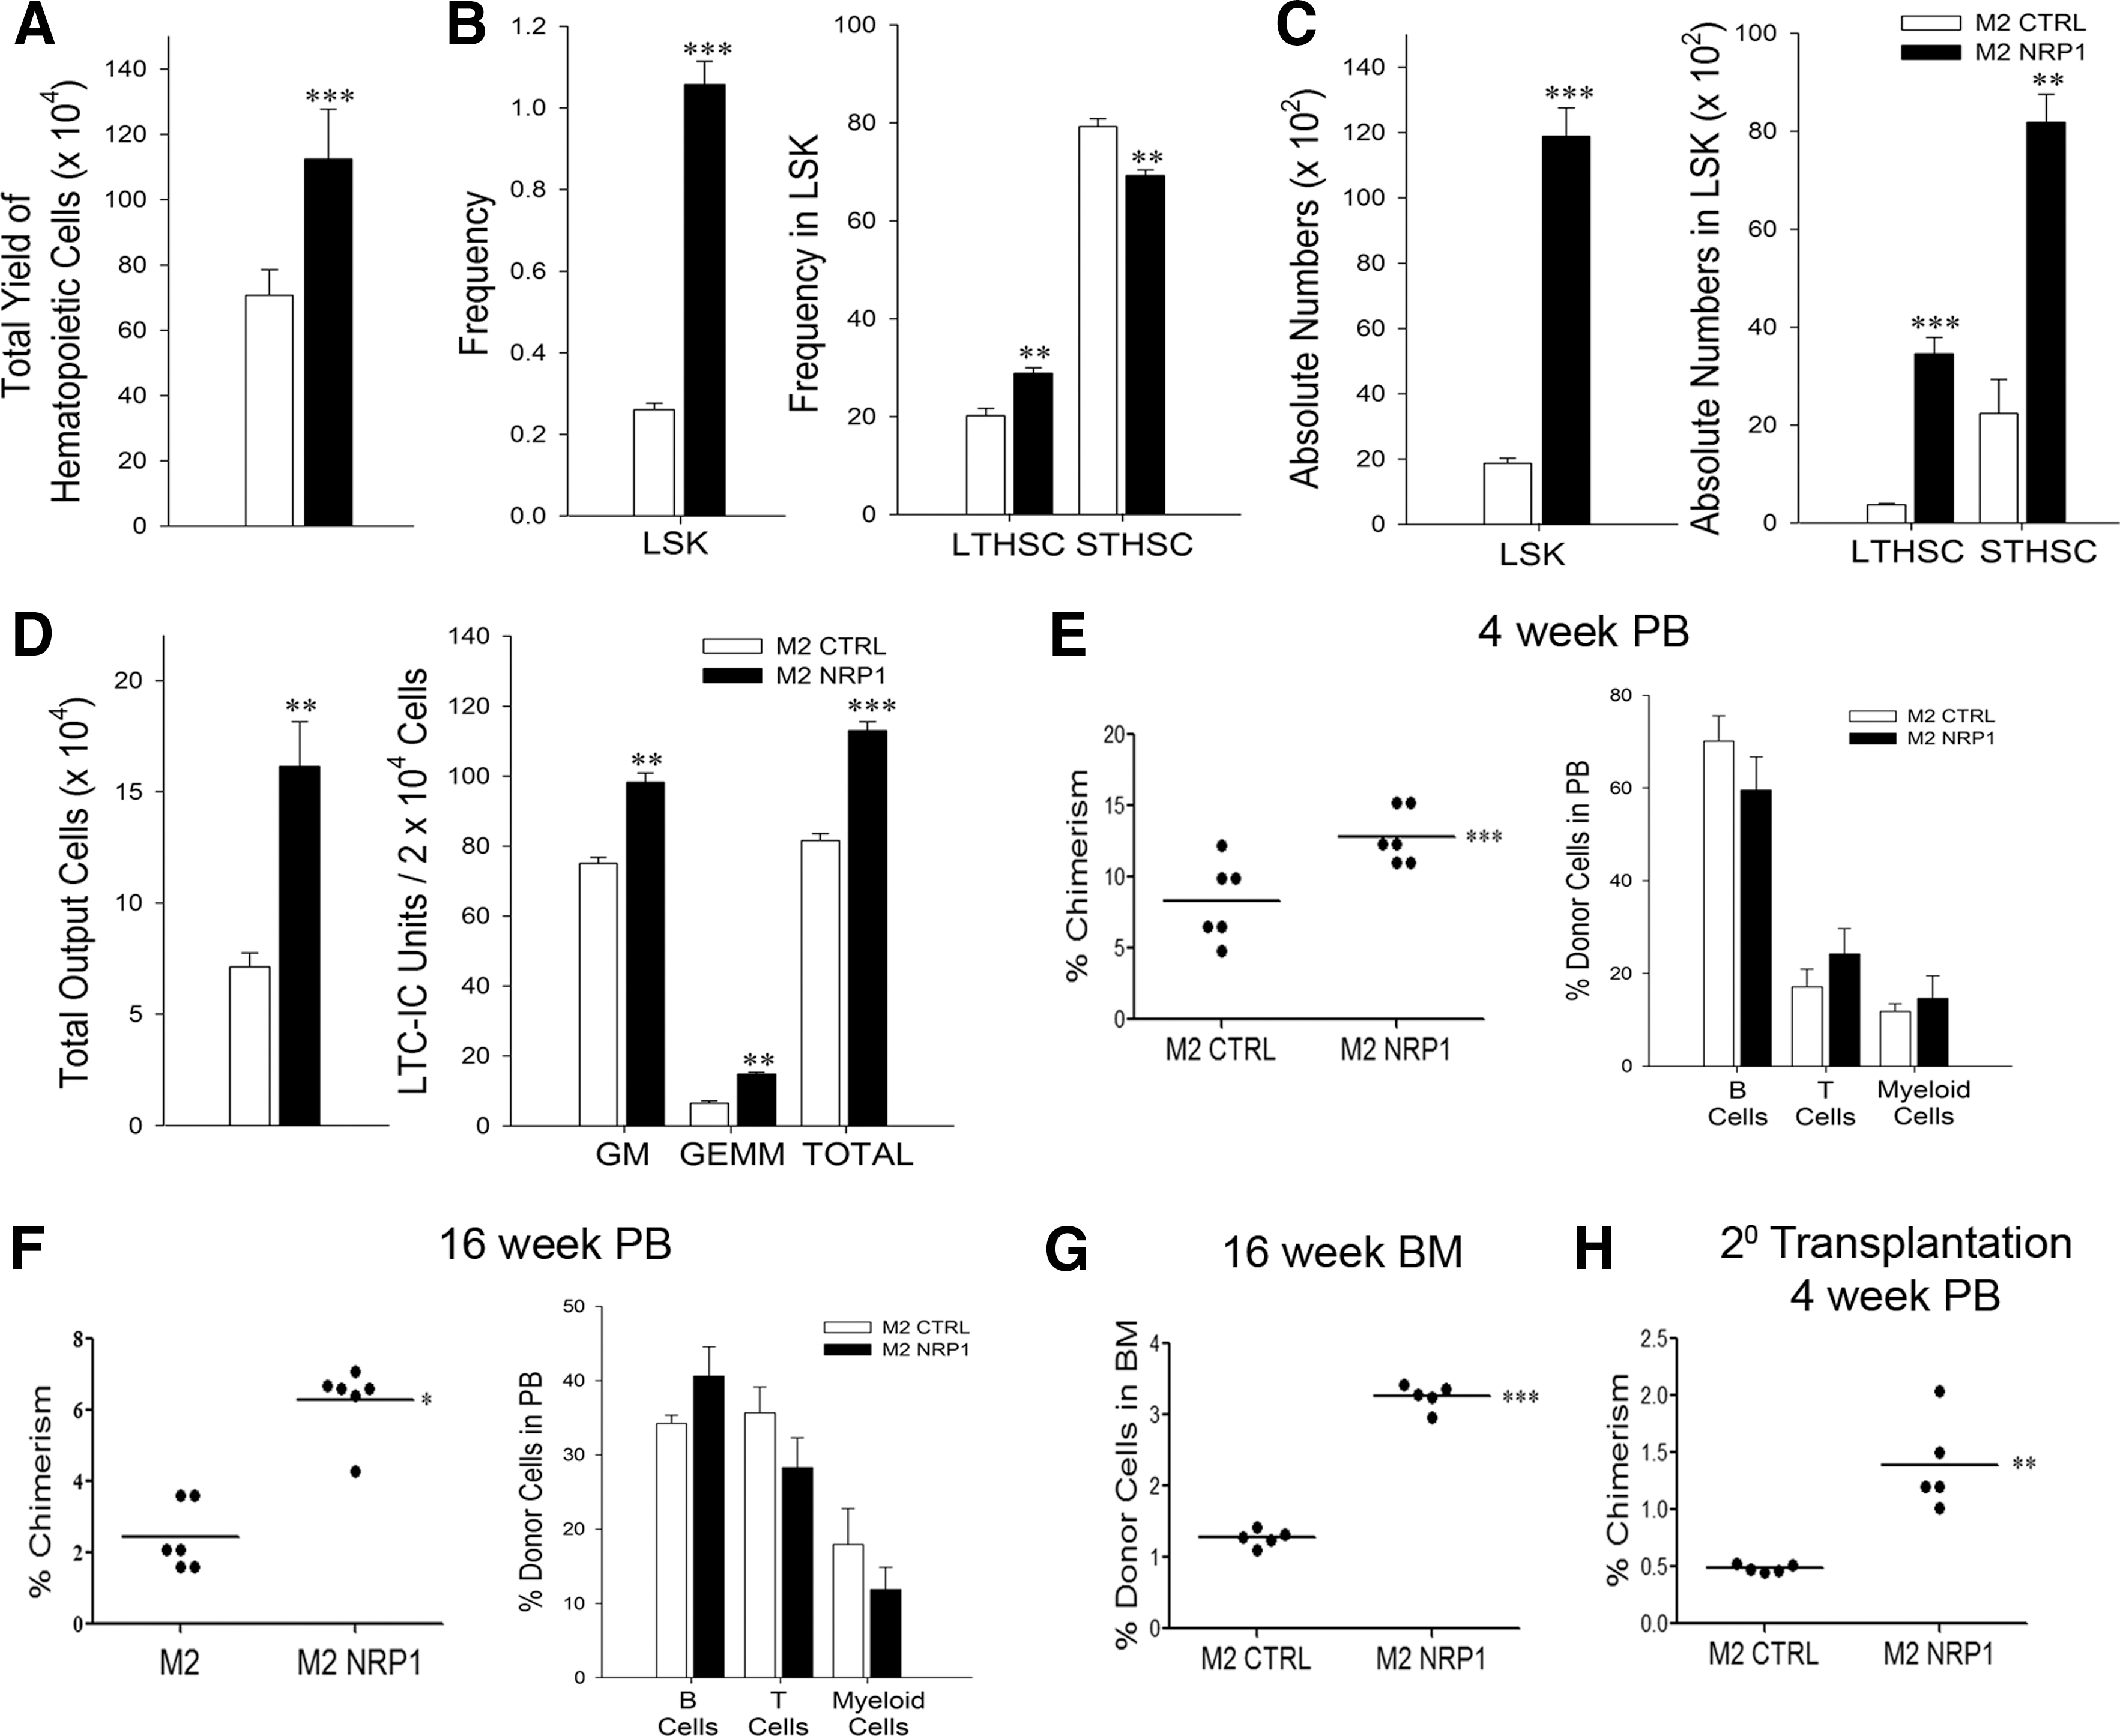
Mesenchymal stromal cells expressing NRP-1 support expansion of functional HSCs.
Cell cycle analysis showed that the output cells from M2-NRP1-cocultures contained significantly higher numbers of proliferating (G2/M/S) LSK population (Supplementary Fig. S2E).
These data supported our contention that perhaps NRP1 needs to be presented in the context of a stromal cell to show any effect on hematopoiesis, and also demonstrated that when NRP1 is exogenously expressed on mesenchymal stromal cells, it supports significantly higher regeneration of most branches of hematopoiesis in vitro. Frequencies of GMP and CLP were significantly lower in the M2-NRP1 set compared with M2 set, but their absolute numbers were comparable in both sets.
NRP1 presented on mesenchymal stromal cells boosts HSPC functionality
The increase in HSPC content in the output of M2-NRP1-cocultures made it necessary to examine whether these cells retained their functionality. When the Lin- cells were cocultured with M2-control or M2-NRP1 cells under long-term culture (LTC) conditions, we found that M2-NRP1-cocultures produced a significantly higher output of cells and these output cells contained significantly higher numbers of LTC-initiating cell units in them. These data showed that M2-NRP1 cells expand primitive progenitors (Fig. 2D). We transplanted the output cells (CD45.1) from the cocultures into lethally irradiated recipients (CD45.2) and monitored the PB chimerism at 4 and 16 weeks post-transplant (Supplementary Fig. S2F, G). We found that the cells cocultured with M2-NRP1 established significantly higher chimerism in the recipients' PB compared with their control counterparts at both time points (Fig. 2E, F; left panels). There was no lineage bias in either set (Fig. 2E, F; right panels). The BM analyses done at 16 weeks post-transplant showed that % engraftment of donor cells in the recipients receiving output cells from the M2-NRP1 set was significantly higher than those receiving cells from the M2-control set (Fig. 2G). Secondary transplantation experiments showed that engrafted donor cells sorted from the marrow of primary recipients receiving the cells from M2-NRP1-cocultures had enhanced LT engraftment ability (Fig. 2H).
Collectively, these data show that presentation of NRP1 through mesenchymal stromal cells supports expansion of functional HSCs.
Adipocytes differentiated from M2-10B4 cells express NRP1 and negatively affect hematopoiesis
To determine whether the negative effects of adipocytes are mediated through NRP1, we first examined whether M2 cells express NRP1 after adipogenic differentiation. We found that naïve M2 cells did not express NRP1 at detectable levels, both at mRNA and protein levels; however, consistent with the results obtained with primary BMSCs, M2 cells also expressed a higher level of Nrp1 after adipogenic differentiation (M2-adipo; Supplementary Fig. S3A). Adipocytic differentiation was confirmed by expression of PPAR-γ and also staining the cells with Oil Red O (Supplementary Fig. S3B, C).
Lin− cells were cocultured with M2-control or M2-adipo and the output cells were enumerated and analyzed on a flow cytometer for their HSPC content. We found that consistent with the earlier results obtained with adipocytes differentiated from BMSCs, the output of hematopoietic cells was significantly reduced in the M2-adipo-cocultures (Fig. 3A). Flow analysis of the output cells showed a significant reduction in the frequencies of LSK- and ST-HSCs in the M2-adipo-cocultures (Fig. 3B), but the ratio of LT:ST HSCs was reversed. The absolute numbers of LSK- and ST-HSC subsets were significantly lower in the output of M2-adipo-cocultures, but the absolute numbers of LT-HSCs were comparable in both sets (Fig. 3C). Similar results were observed when LSK cells were cocultured with M2-control and M2-adipo (Supplementary Fig. S3E–G). Frequencies as well as absolute numbers of various progenitors were also significantly reduced in M2-adipo-cocultures (Supplementary Fig. S3D). When the output cells were subjected to CFU assay, we found that the M2-adipo-cocultures yielded significantly fewer granulocyte-erythroid-macrophage-megakaryocyte (GEMM) and burst forming unit - erythroid types of colonies (Fig. 3D) compared with the M2-control-cocultures, showing that the adipocytes suppress functional progenitors as well. The reduction in the number of GM (granulocyte-macrophage) type of colonies was not statistically significant.
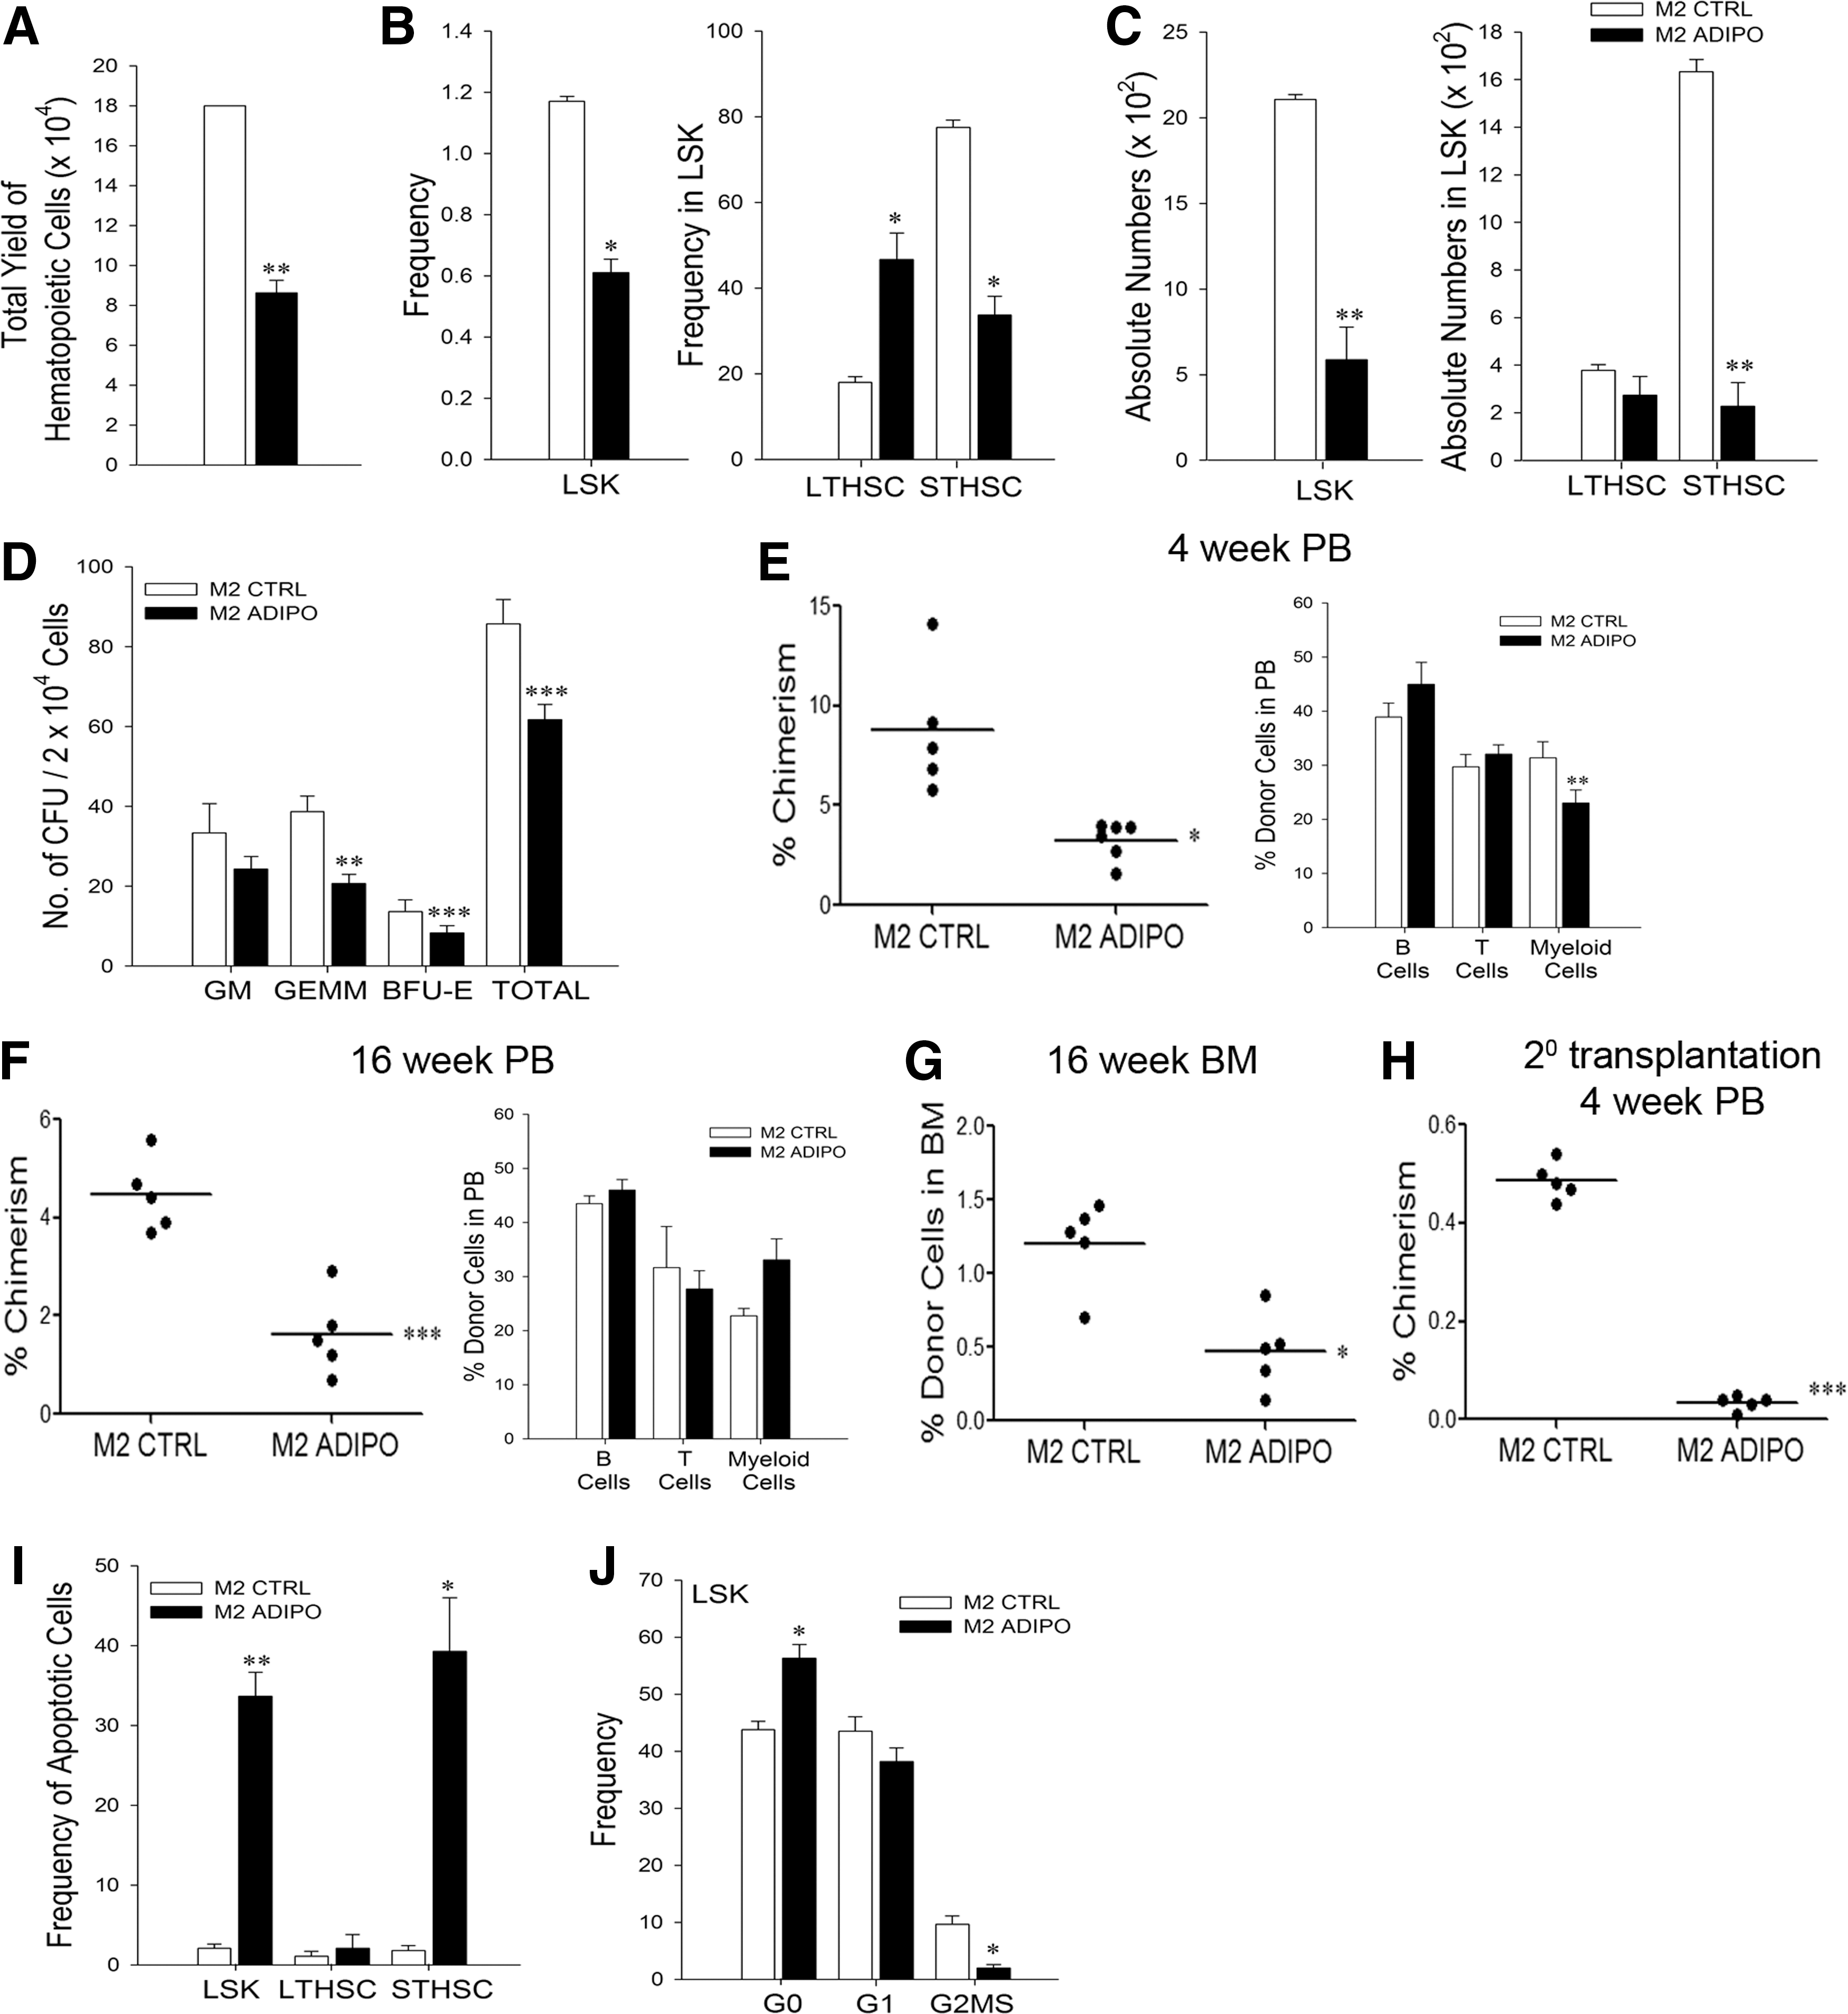
Adipocytes derived from M2-10B4 affect hematopoiesis in negative manner.
When these output cells were examined for their repopulation ability by transplantation in irradiated recipients, we found that at both 4 and 16 weeks post-transplant, the cells from M2-adipo-cocultures showed significantly reduced chimerism in the PB of the recipients (Fig. 3E, F; left panels) in spite of relative increase in frequency of LT-HSCs in them. Cells from both cocultures produced multilineage hematopoiesis. In the M2-adipo set, myeloid cells were significantly fewer at 4 weeks post-transplant, but this difference was not seen at 16 weeks (Fig. 3E, F; right panels). BM analysis done at 16 weeks post-transplant also showed that the cells from M2-adipo-cocultures engrafted at a significantly lower level compared with those from M2-control-cocultures (Fig. 3G). When these engrafted cells were sorted and infused in the irradiated secondary recipients at equal numbers, the cells from the M2-adipo set failed to engraft in the secondary recipients (Fig. 3H).
These data showed that M2-adipo cells not only inhibited the regeneration of hematopoiesis but also affected the functionality of HSPCs cocultured with them.
Adipocytes induce apoptosis of cocultured HSPCs and also arrest them in the G0 phase of cell cycle
The inhibition of hematopoiesis in the M2-adipo-cocultures and the failure of the output HSPCs to engraft in irradiated recipients prompted us to examine whether this was related to an increased level of apoptosis or to cell cycle arrest. We found that the percentage of apoptotic cells in the LSK- and ST-HSCs, but not in LT-HSCs, was significantly higher in the M2-adipo-cocultures (Fig. 3I). Similar results were observed when LSK cells were cocultured with M2-control and M2-adipo (Supplementary Fig. S3H). The cell cycle analysis showed that significantly higher numbers of LSK HSCs from M2-adipo-cocultures were in G0 state, and also very few LSK HSCs were in the G2/M/S phase of cell cycle (Fig. 3J).
These results demonstrate that adipocytes inhibit hematopoiesis by inducing apoptosis in the HSPCs and also by maintaining them in a quiescent stage.
NRP1 plays an active role in the HSPC inhibitory activity of adipocytes
In earlier experiments, we had observed that NRP1 expressed on mesenchymal background supports hematopoiesis; on the other hand, adipocytes express NRP1 as a function of differentiation and exert inhibitory effects on hematopoiesis. We then determined whether NRP1 plays an active role in the hematopoiesis inhibitory effects of adipocytes. We used M2 cells stably expressing NRP1-specific shRNA (M2-shNRP1) or scrambled sequences (M2-Scr) for the purpose (Supplementary Fig. S4A, B). The M2-shNRP1 and M2-Scr cells were differentiated into adipocytes and then cocultured with Lin− cells and sort-purified LSK cells. Undifferentiated M2-Scr were used as controls. Silencing of NRP1 did not affect the adipogenic differentiation of M2 cells (Supplementary Fig. S4C).
We found that shRNA-mediated silencing of NRP1 significantly rescued the absolute numbers of LSK- and LT-HSCs; but this rescue was not complete (Fig. 4B). Silencing of NRP1 also did not restore the total hematopoietic cell output (Fig. 4A). The frequency of LSK HSCs was also significantly high in M2-shNRP1-adipo-cocultures, but the frequencies of LT- and ST-HSCs remained unaltered (Fig. 4C). Similar results were observed when LSK cells were cocultured with M2-Scr-control, M2-Scr-adipo, and M2-shNRP1-adipo (Supplementary Fig. S4E–G). The inhibitory effect of adipocytes on frequencies and absolute numbers of MPP, CMP, and CLP, but not that of MEP and GMP, was significantly rescued after silencing of NRP1 in them (Supplementary Fig. S4D). Most importantly, enumeration of Annexin-V+ cells showed that the knockdown of NRP1 expression from M2-adipocytes completely rescued the apoptosis of LSK and ST-HSCs (Fig. 4D). LT-HSCs had not shown a significant level of apoptosis in M2-adipo-cocultures and therefore silencing of NRP1 had no effect on them. Similar results were observed when LSK cells were cocultured with M2-Scr-adipo and M2-shNRP1-adipo (Supplementary Fig. S4H). Silencing of NRP1 in M2-adipo did not alter the cell cycle status of LSK HSCs. (Fig. 4E). CFU assay of output cells showed that cells from M2-shNRP1-adipo-cocultures harbored a significantly higher number of GEMM type of progenitors (Fig. 4F).

NRP1 is actively involved in adipocyte-mediated inhibition of hematopoiesis.
We then transplanted the output cells into irradiated recipients to examine whether silencing of NRP1 on adipocytic background also restores the functionality of cocultured HSPCs. Indeed, we found that the output cells of M2-shNRP1-adipo-cocultures produced a higher level of multilineage chimerism in the recipients' PB compared with those cultured with M2-Scr-adipo and M2-Scr cells, at both 4 and 16 weeks post-transplant (Fig. 4G, H). The engrafted cells from the recipients' marrow were sorted and infused into irradiated secondary recipients. Analyses of secondary recipients' PB at 4 weeks post-transplant showed that there was significantly higher chimerism by the engrafted donor cells isolated from primary recipients infused with cells from the M2-shNRP1-adipo set compared with those isolated from the M2-Scr-adipo set (Fig. 4J). This rescue was, however, not complete as evidenced by lower chimerism seen in the M2-shNRP1-adipo set compared with that seen in the M2-Scr-control set. These data clearly show that NRP1 presented to HSPCs on adipocytic background affects the HSPC functionality by inducing apoptosis in HSC subsets.
Adipocytes induce apoptosis in HSPCs through the death receptor-mediated pathway
We observed that adipocytes inhibit HSPCs by inducing apoptosis in LSK- and ST-HSCs and knockdown of NRP1 rescued this effect. To examine whether the intrinsic or extrinsic pathway is involved in the process, we analyzed the Bax:Bcl2 ratio in the cocultured HSPCs for intrinsic pathway and FasL expression in the stromal cells for the extrinsic or death receptor pathway. We found that the Bax:Bcl2 ratio was unchanged in HSPCs cocultured with M2-Scr-control, M2-Scr-adipo, and M2-shNRP1-adipo (Supplementary Fig. S5A, B). When we determined the expression of FasL in whole cell lysates of M2-Scr-control, M2-Scr-adipo, and M2-shNRP1-adipo cells by western blotting, we found an increased expression of FasL in M2-Scr-adipo, compared with M2-Scr-control and M2-shNRP1-adipo cells (Fig. 5A, B). These data suggest that perhaps adipocytes induce death receptor-mediated apoptosis of HSPCs.

Adipocytes induce apoptosis in HSCs through the death receptor-mediated pathway and affect CXCR4 expression on HSCs through NRP1.
NRP1 expressed on adipocytes affects CXCR4 expression on HSPCs
CXCR4 plays an important role in the engraftment of HSCs. To examine whether adipocytes affect the engraftment ability of HSPCs by affecting CXCR4 expression on them, we enumerated CXCR4+ HSPCs in the output cells from various cocultures. Consistent with their lower engraftment potential, the output HSPCs from M2-adipo-cocultures contained a significantly reduced frequency and absolute numbers of CXCR4+ HSPCs compared with those from M2-Scr-cocultures (Fig. 5C, D). On the other hand, the output cells from M2-shNRP1-adipo-cocultures showed a significantly higher frequency and absolute numbers of CXCR4+ HSPCs in them (Fig. 5C, D). Importantly, the mean fluorescence intensity (MFI) of CXCR4 signal was noticeably high in the HSPCs cocultured with M2-shNRP1-adipo cells (14-fold high in LT-HSCs and 11-fold high in LSK HSCs; Table 1). Consistent with their higher CXCR4 expression, the output cells from the M2-shNRP1-adipo set migrated in significantly higher numbers toward CXCL12/SDF-1α (Fig. 5E) compared with those from M2-Scr-control and M2-Scr-adipo-cocultures.
Flow analyses showed that MFI of CXCR4 was the highest in HSCs cocultured with M2-shNRP1-adipo cells. The data are represented as mean ± SEM. (N = 3, n = 4. ** P < 0.01, *** P < 0.001).
N, no. of independent experiments performed; n, no. of replicates per set; MFI, mean fluorescence intensity; LSK, Lin− Sca-1+ c-Kit+, HSC, hematopoietic stem cell; SEM, standard error of mean.
Ligand-mediated internalization of CXCR4 is known [18]. Therefore, we determined whether this was the case in the cells used in our experiments. Results of Cxcl12-specific quantitative PCR showed that M2-adipo cells expressed very high levels of Cxcl12, which was significantly reduced after silencing of NRP1 in them (Fig. 5F). These data suggested that loss of CXCR4 in the HSPCs cocultured with M2-adipo was perhaps due to ligand-mediated downregulation of CXCR4 and NRP1 has a role in the expression of CXCL12 in the adipocytes.
CXCR7 acts as a decoy receptor for CXCL12/SDF1α and reduces CXCL12-mediated CXCR4 interactions, thereby protecting CXCR4 from internalization and subsequent degradation [19]. We therefore examined whether adipocytes have reduced expression of Cxcr7. We found that indeed M2-Scr-adipo cells expressed significantly reduced levels of Cxcr7 and it was rescued upon silencing of NRP1 (Fig. 5F). We also examined the Cxcl12 and Cxcr7 expression in BMSCs and adipocytes differentiated from them. The expression of Cxcl12 was significantly high in BMSC adipocyte, whereas that of Cxcr7 was very low, supporting the data obtained with M2-control and M2-adipo cells (Fig. 5G).
These data suggest that the NRP1–CXCL12/SDF1α-CXCR7 axis is perhaps involved in adipocyte-mediated downregulation of CXCR4 expression in the HSCs, leading to their functional impairment. These data also showed that both Cxcl12 and Cxcr7 are downstream events of NRP1 expression in murine adipocytes.
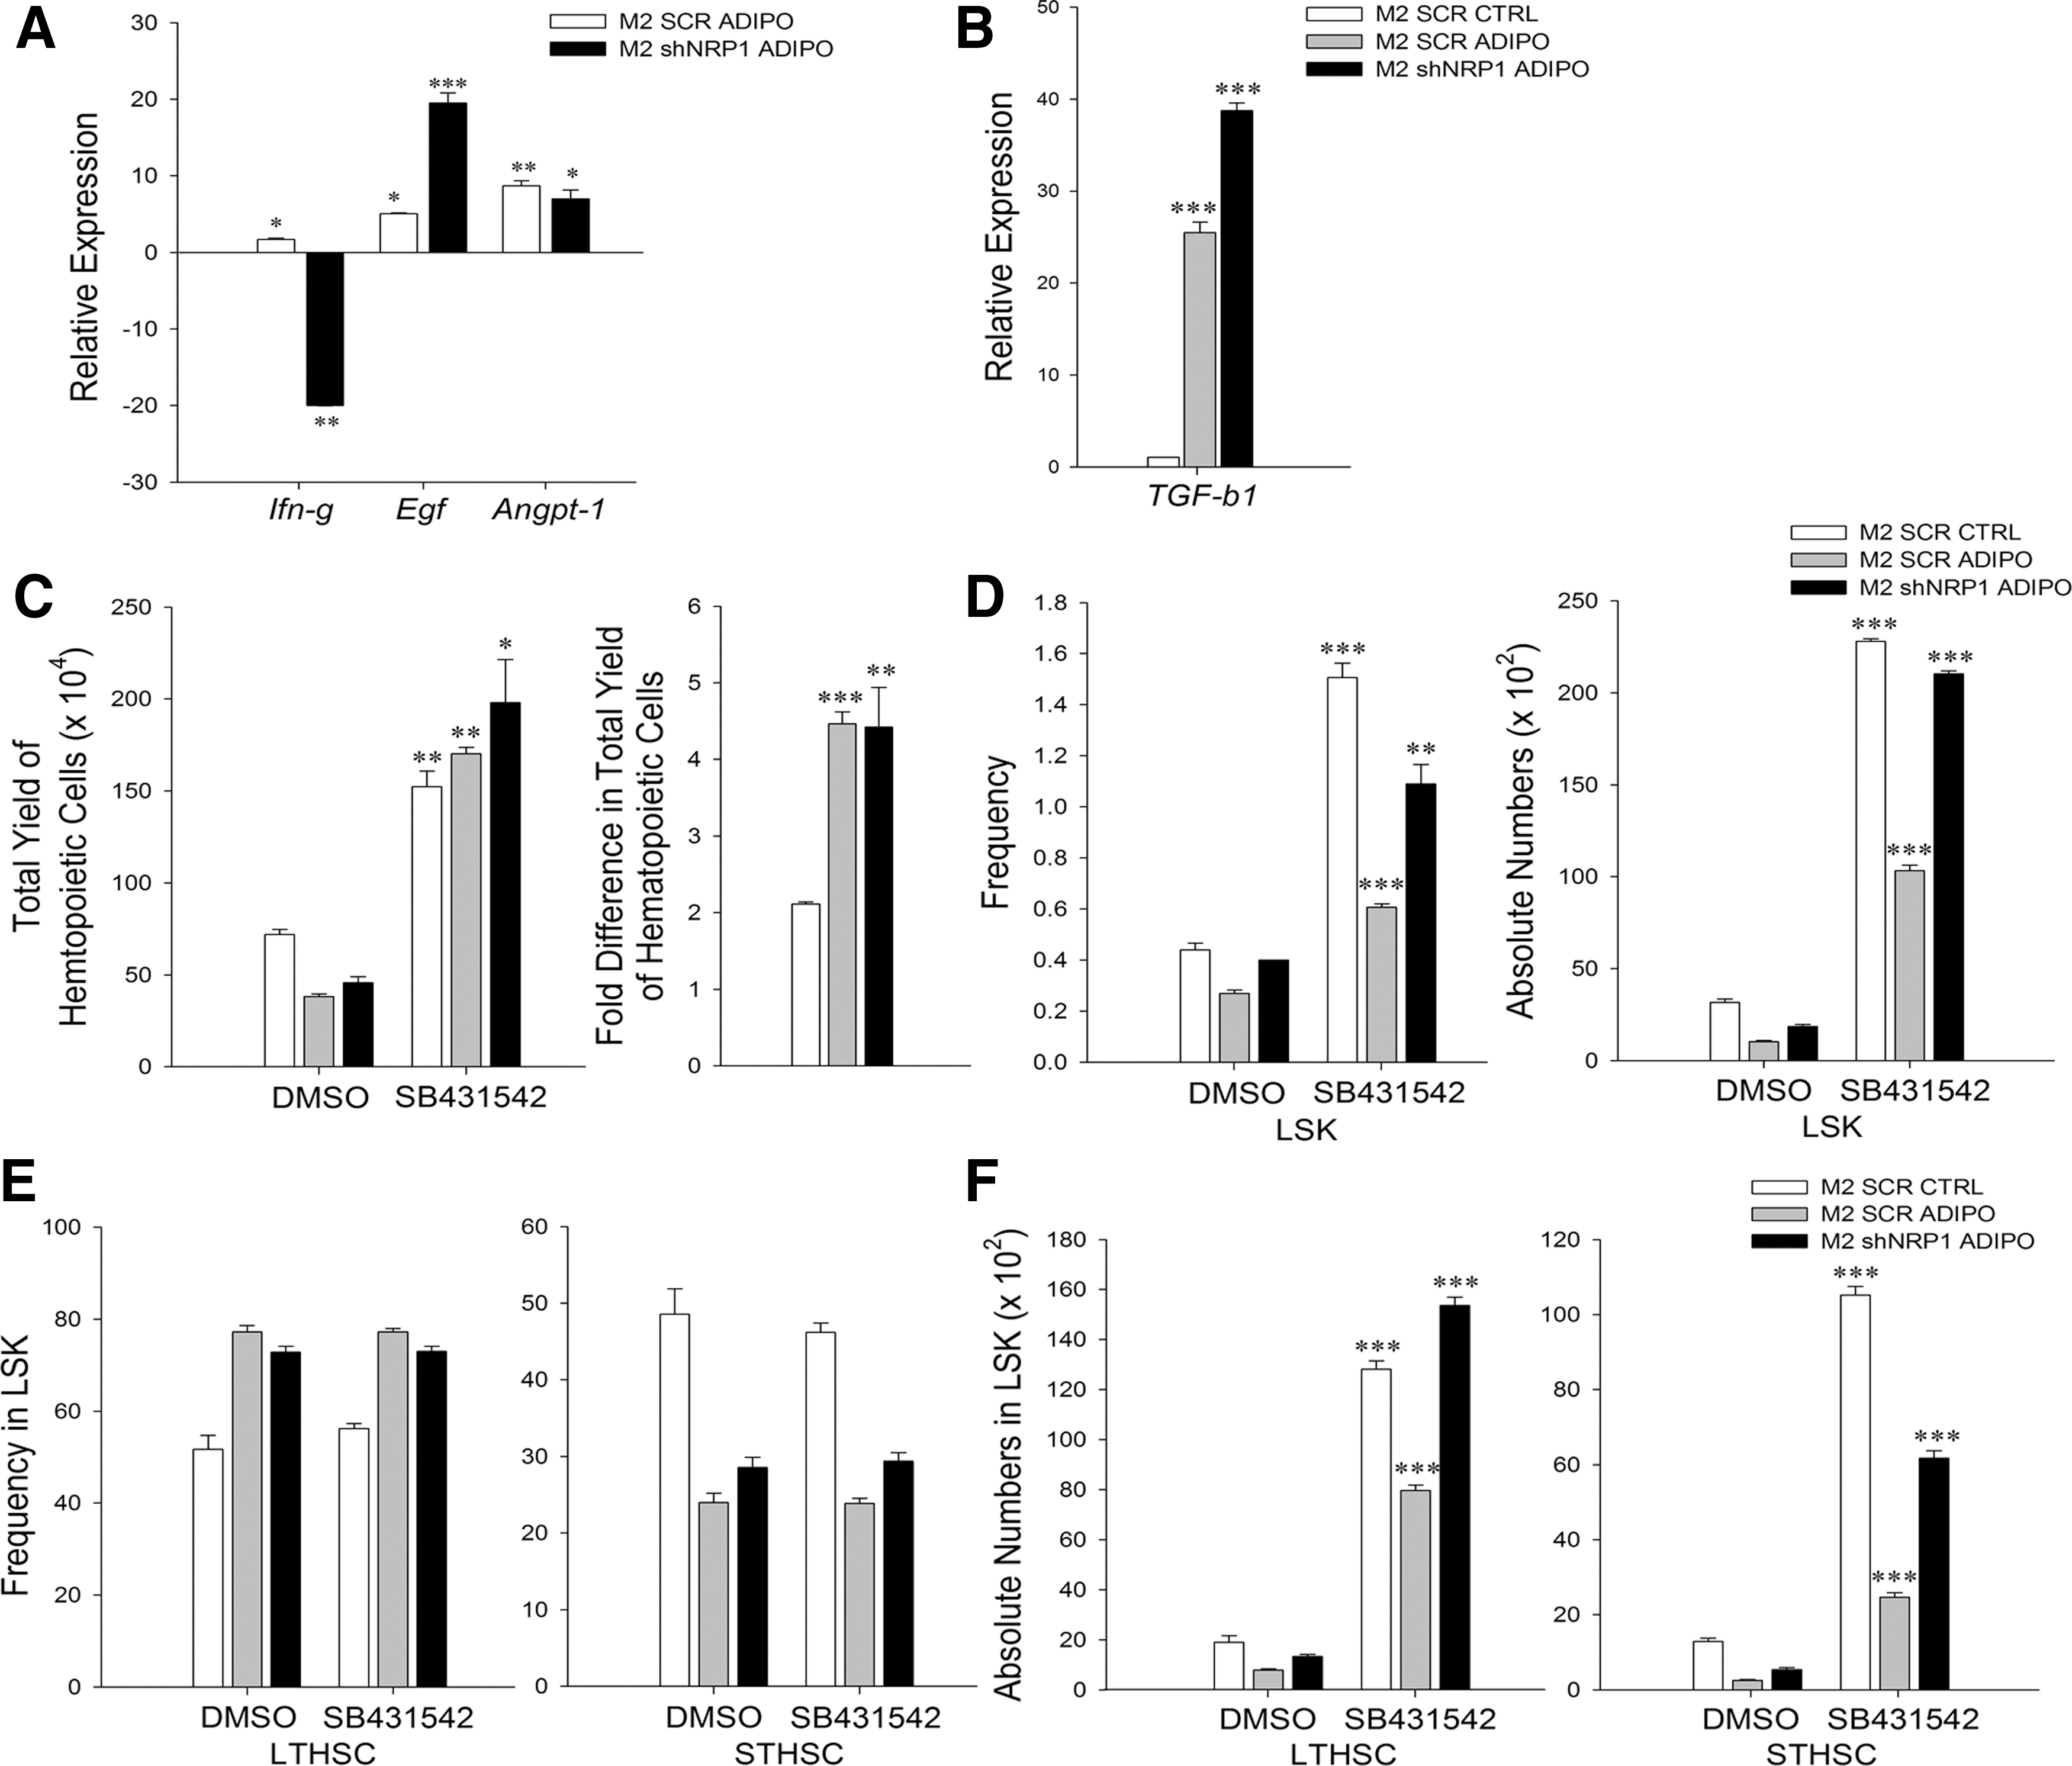
Silencing of NRP1 favorably alters transcriptome of adipocytes
We then examined whether the salutary effects of silencing of NRP1 in adipocytes were also related to altered expression of genes implicated in the niche-mediated apoptosis of HSCs. Expression of interferon (IFN)-γ in stromal cells causes apoptosis and functional impairment in HSCs [20]. We found that the level of Ifn-g was higher in M2-Scr-adipo cells and this was significantly reduced after NRP1 was silenced (Fig. 6A). Recently, epidermal growth factor (EGF) has been implicated in the protection of HSCs from irradiation-induced apoptosis [21]. Expression of Egf was significantly higher in M2-shNRP1-adipo cells compared with M2-Scr-adipo cells (Fig. 6A). Thus, a reduced expression of Ifn-g coupled with an increased expression of Egf may have resulted in the rescue of HSCs from apoptosis in M2-shNRP1-adipo-cocultures. Additional experiments would be needed to validate these findings. The level of Angpt-1 was higher in both M2-Scr-adipo and M2-shNRP1-adipo cells compared with M2-Scr-control cells (Fig. 6A), and perhaps the Ang-1-Tie2 axis may have contributed to HSPC quiescence [22]. Expression of Jag-1 was significantly higher in M2-Scr-adipo and M2-shNRP1-adipo cells compared with M2-Scr-control cells. Expression of Kitl was significantly lower and that of Vegf-a was significantly higher in both M2-Scr-adipo and M2-shNRP1-adipo cells compared with M2-Scr-control cells. Expression of Thpo was significantly reduced in M2-shNRP1-adipo cells compared with M2-Scr-control and M2-Scr-adipo cells. Expression of N-cadherin/cdh2 was significantly reduced in both M2-Scr-adipo and M2-shNRP1-adipo cells than M2-Scr-control. Loss of N-cadherin may be one of the reasons behind lack of complete rescue in long-term functionality by shNRP1-adipo-coculture cells (Supplementary Fig. S5B).
Silencing of NRP1 rescues apoptosis of HSCs, but does not improve TGFβ1-mediated inhibition of hematopoiesis.
Although we find that silencing of NRP1 alters the transcriptome of adipocytes, the mechanism involved is incompletely understood at this point. NRP1 is classically defined as an adhesion molecule and hence these effects could be indirect ones. This aspect needs further investigation.
Adipocytes restrict the extent of hematopoiesis through secretion of TGFβ1
Although the silencing of NRP1 in M2-adipo cells rescued the apoptosis of HSPCs and boosted their engraftment capacity, it neither improved the overall output hematopoietic cells nor did it alter the G0 state of cocultured HSPCs. In addition, it did not completely rescue the long-term engraftment ability of HSPCs, as evidenced in the secondary transplant experiments. These data suggested that in addition to NRP1, adipocytes also express yet another inhibitor of hematopoiesis. Since TGFβ1 is a known inhibitor of hematopoiesis, we examined whether this observed effect was related to TGFβ1 expression by the adipocytes. We found that the expression of Tgf-b1 was very high in M2-adipo cells, and this was not affected by silencing of NRP1, showing that this is an NRP1-independent event (Fig. 6B). These data suggested that secretion of TGFβ1 by both M2-Scr-adipo and M2-shNRP1-adipo may be the reason behind the maintenance of G0 status of output HSCs [23] and inhibition of overall proliferation of hematopoietic cells in their respective cocultures [24].
To confirm the role of TGFβ1 signaling in the inhibitory activity of adipocytes, we applied SB431542, a TGFβ type I receptor kinase inhibitor, in the cocultures. Inhibition of TGF-β1 signaling resulted in a significant increase in the output of hematopoietic cells in both M2-Scr-adipo and M2-shNRP1-adipo-cocultures (Fig. 6C), showing that TGFβ1 secreted by the adipocytes was primarily responsible in controlling the overall regeneration of hematopoiesis in the cocultures. Interestingly, inhibition of TGFβ1 signaling in control cocultures also boosted hematopoiesis in them, showing that TGFβ1 signaling was operative in the undifferentiated M2 cells as well. Inhibition of TGFβ1 signaling further enhanced frequency as well as absolute numbers of LSK-HSPCs in the M2-shNRP1-adipo set compared with the M2-Scr-adipo set (Fig. 6D), suggesting that TGFβ1 had also limited HSPC expansion in the adipo-cocultures. The frequencies of LT- and ST-HSCs were similar in both M2-Scr-adipo and M2-shNRP1-adipo even after the inhibitor treatment, but their absolute numbers were significantly higher when TGF-β1 signaling was inhibited (Fig. 6E, F).
Collectively, the data show that NRP1 actively participates in the adipocyte-mediated inhibition of hematopoiesis by inducing apoptosis in the HSPCs and affecting their functionality through downregulation of CXCR4 through the CXCL12-CXCR7 axis, whereas TGFβ1 secreted by the adipocytes restricts the overall hematopoietic cell output.
Discussion
Negative regulation of hematopoiesis by adipocytes is of great concern in clinical context as pretransplant myelosuppression causes marrow adipogenesis and affects the post-transplant regeneration of hematopoiesis; however, the mechanism(s) by which these adipocytes inhibit hematopoiesis is not clear. Mechanistic understanding of this process may lead to the development of effective therapeutic strategies to overcome this suppressive effect [4,7,8]. In the present study, we examined whether NRP1 plays any role in the negative regulation of hematopoiesis by adipocytes.
NRP1 has been shown to be abundantly present in the fatty marrow, but whether its expression is a function of adipocytic differentiation was not known. In this study, we show that adipocytes express NRP1 as a function of adipocytic differentiation of mesenchymal stromal cells. Using coculture models, we show that in vitro differentiated adipocytes, both from primary BMSCs and the M2-10B4 stromal cell line, inhibit regeneration of hematopoiesis. Using the shRNA-mediated silencing approach, we demonstrate that the inhibitory activity of adipocytes on regeneration of hematopoiesis was related to NRP1-mediated apoptosis in HSPCs through the cell death receptor-mediated pathway. In sharp contrast, stromal cells modified with NRP1 supported expansion of functional HSPCs, indicating that the apoptotic effect of NRP1 on HSPCs was context dependent. It is possible that besides NRP1, HSPCs simultaneously interact with other adhesion molecules, which are perhaps differentially expressed on mesenchymal cells vis-à-vis adipocytes. It would be interesting to identify these molecular interactions. The contrasting results seen in coculture experiments with NRP1-transduced M2 cells and M2-shNRP1-adipo cells suggest that NRP1 has distinct nonoverlapping effects on hematopoietic support provided by these cells, and most probably the effect is determined by the cellular biochemistry.
We found that although HSPCs physically interact with rNRP1, rNRP1 by itself did not have any effect on the regeneration of hematopoiesis. On the other hand, when it was presented in the context of stromal cells, either in the form of exogenous expression on mesenchymal stromal cells or as a function of differentiation on adipocytes, it regulates the hematopoiesis in a positive and negative manner, respectively. These data further support our contention that perhaps NRP1 needs to be presented to HSPCs by the stromal cells in conjunction with other adhesion molecules to exert its effects, and perhaps the combination of other adhesion molecules determines the outcome of HSC-NRP1 interaction.
We have shown that adipocytes show increased expression of FasL, suggesting that they induce death receptor-mediated apoptosis in HSPCs. This higher expression of FasL in adipocytes could be related to PPAR-γ expression in them [25]. Since the expression of FasL on M2-Scr-adipo cells, although statistically significant, was not very highly upregulated compared with M2-Scr-control or M2-shNRP1-adipo, but the level of apoptosis in LSK cells is very high in M2-Scr-adipo-coculture, we speculate that perhaps this is related to surface versus cytoplasmic expression of FasL [26] and perhaps NRP1 may be involved in membrane expression of FasL in adipocytes. This possibility needs to be examined formally and we propose to do these experiments in the near future.
CXCR4 is known to play an important role in the engraftment process. We found that HSPCs cocultured with adipocytes showed compromised engraftment ability. Silencing of NRP1 in adipocytes not only restored but also enhanced the engraftment ability of cocultured HSPCs in the primary transplant recipients. Consistent with this, HSPCs cocultured with NRP1 knockdown adipocytes exhibited increased chemotactic migration toward CXCL12/SDF1α. This was clearly related to the significantly increased expression of CXCR4 in them, both in terms of frequency and MFI. The increase in MFI indicates receptor clustering, which is known to enhance the functionality of receptors. Such clustering of CXCR4 would improve homing and marrow retention of transplanted HSCs.
We investigated the molecular mechanisms behind the drastic loss of CXCR4 on HSPCs cocultured with M2-Scr-adipo cells by performing gene expression analyses of these various feeder cells. These analyses revealed that M2-Scr-adipo cells expressed very high levels of Cxcl12. Although high level of CXCL12/SDF1α in marrow stromal cells is needed to retain CXCR4+ HSCs in the marrow, a ligand-mediated internalization, and subsequent degradation of CXCR4, also happens [18]. CXCR-7 acts as a decoy receptor for CXCL12/SDF1α and reduces CXCL12-mediated CXCR4 interactions [19]. We show that adipocytes express Cxcl12 at high level, but have significantly reduced levels of Cxcr7, thereby making CXCR4 susceptible to ligand-mediated internalization and degradation. Silencing of NRP1 resulted in a drastic decrease of Cxcl12 in the adipocytes and a significant increase in the expression of Cxcr7, and perhaps this prevented the internalization of CXCR4 on HSPCs cocultured with adipocytes lacking NRP1.
Although silencing of NRP1 on adipocytes rescued the apoptosis of HSPCs and also increased their numbers and functionality, it neither changed their cell cycle status nor did it restore the overall proliferation of hematopoiesis. The long-term engraftment ability of HSPCs was also not fully restored by silencing of NRP1. We speculated that perhaps adipocytes produce yet another negative regulator of hematopoiesis in an NRP1-independent manner. Indeed, we found that both M2-Scr-adipo and M2-shNRP1-adipo cells expressed very high levels of Tgf-b1, a cytokine that is known to inhibit the proliferation of hematopoietic cells and also maintain them in a quiescent state [27,28]. A pharmacological inhibition of TGFβ1 signaling in the M2-shNRP1-adipo-cocultures resulted in rescuing the inhibition of hematopoietic cell output. NRP1 is known to augment the effects of TGFβ1 by acting as its coreceptor [29]. However, silencing of NRP1 did not reduce the TGFβ1-mediated inhibition of hematopoiesis, suggesting that the observed effect was independent of NRP1. TGFβ1 is known to induce apoptosis in multipotent hematopoietic cells [24]; however, the adipocyte-mediated apoptosis in HSPCs was rescued by silencing of NRP1 alone, showing that TGFβ1 did not have any role in the apoptosis of HSPCs in these cocultures. Silencing of NRP1 significantly reduced the levels of Ifn-γ in adipocytes. These cells also showed elevated expression of FasL. Taken together, these data suggest that perhaps both IFN-γ and FasL play a role in the adipocyte-mediated apoptosis of HSPCs. Further experiments are needed to confirm these results.
TGFβ1 exerts its effects in a dose-dependent manner [30, 31] and thus it is possible that the salutary and inhibitory effects of TGFβ1 are related to its prevailing concentration in the microenvironment. Based on our data, we speculate that an increase in the number of adipocytes postmyeloablation would increase NRP1 expression and would simultaneously also lead to a significant rise of TGFβ1 in the marrow milieu, thereby hampering the regeneration of hematopoiesis. Blockade of TGFβ1 signaling after chemotherapy accelerates hematopoietic reconstitution and delays the return of cycling HSCs to quiescence [32]. Our data suggest that in addition to such pharmacological inhibition of TGFβ1 signaling, peptide- or antibody-mediated blocking of NRP1 may result in even higher recovery of hematopoiesis. Since anti-NRP1 antibodies are already in phase I/II trials, clinical application of this approach might be relatively straightforward [33,34].
The works of Dexter et al. show that formation of giant fat cells (adipocytes) is required for maintenance of CFU-S (colony forming unit- spleen) in murine LTCs [35]. In the present study, we show that adipocytes do not cause apoptosis of LT-HSCs, although their engraftment potential is severely affected. It is possible that either adipocytes do not affect the functionality CFU-S or the difference in results could be related to differences in culture conditions.
In summary, our data show that NRP1 is an important niche constituent and exerts a context-dependent effect on hematopoiesis (Supplementary Fig. S6).
Footnotes
Acknowledgments
The authors would like to thank the Department of Biotechnology, Government of India, New Delhi (grants to V.P.K., Grant number: BT/PR14036); the Director, NCCS (intramural grants to V.P.K.); the Council of Scientific and Industrial Research, Government of India, New Delhi (fellowship award to S.S.G. and R.S.K.); FACS core facility (sample acquisition); Drs. B. Ramanmurthy and R. Bankar, Experimental Animal Facility (supply of mice); and the confocal facility (acquisition of images). The authors would like to thank the anonymous reviewers for their excellent critique.
A part of this article was presented as a poster at the 44th International Society for Experimental Hematology (ISEH) Annual Scientific Meeting, September 2015, in Kyoto, Japan.
Author Disclosure Statement
No competing financial interests exist.
References
Supplementary Material
Please find the following supplemental material available below.
For Open Access articles published under a Creative Commons License, all supplemental material carries the same license as the article it is associated with.
For non-Open Access articles published, all supplemental material carries a non-exclusive license, and permission requests for re-use of supplemental material or any part of supplemental material shall be sent directly to the copyright owner as specified in the copyright notice associated with the article.