




Abstract
The intrinsic basis of cancer-related anemia (CRA) is erythropoiesis disorder, which is a common complication of cancer and exerts a negative influence on the life quality of cancer patients. Cell therapy using mesenchymal stromal cells (MSCs) is considered as a promising method in cancer treatment. Furthermore, MSCs have been used to cure few type of anemia and be considered as a potential strategy to recover anemia radically. However, none reports its application in CRA treatment. In CRA model mice, we found that the number of lin−c-kit+Sca-1+ and Sca-1+ MSCs was decreased. And CRA resulted in an increased number of proerythroblasts and basophilic erythroblasts and decreased number of orthochromatic erythroblasts. Furthermore, in CRA model mice transplanted with Sca-1+ MSCs and MSCs, the levels of red blood cell count and Hb in peripheral blood were obviously increased. And the accumulation of proerythroblasts and basophilic erythroblasts was inhibited. In addition, the expression patterns of GATA-1 and GATA-2, which is pivotal to anemia, were remarkably recovered. Our results demonstrated that either MSCs or its subpopulation could effectively recover CRA erythropoiesis through GATA-1/GATA-2 signaling, which outstrips the traditional symptomatic therapy.
Introduction
C
More and more researches showed that erythropoiesis could be regulated by highly specific BM microenvironments (niches) [8 –11]. It was confirmed that insufficiency of the hematopoietic niche could also result in anemia [12]. Bone associated CD45-CD31-Ter119-CD146-CD166-Sca-1+ mesenchymal stromal cells (Sca-1+ MSCs) were recently identified as a common mesenchymal stromal progenitor for the adult hematopoietic niche by us [13]. And we also reported that Sca-1+ MSCs could regulate differentiation of lymphocytes, macrophages, and dendritic cells [14,15]. In our previous research, Sca-1+ MSCs had been used to inhibit graft-versus-host disease in mice after BM transplantation [16]. However, it is unknown whether Sca-1+ MSCs have an effect on CRA treatment.
In the erythropoiesis, GATA transcription factor family is characterized as a critical switch for erythrocyte differentiation and maturation [1,17]. The unique expression pattern of GATA-1 and GATA-2 reflects distinct biological function. GATA-1 is the dominant transcription factor initiating downstream signaling cascades relative to erythroid-specific differentiation [18,19]. GATA-2 is necessary for hematopoietic stem cell (HSC) pool maintenance [20]. The abnormal expression pattern of GATA-1 and GATA-2 may result in erythropoiesis disorder [21].
Herein, we explored the changes in the number of lin-c−kit+Sca-1+ (LSK) HSCs, erythroid progenitors, and the Sca-1+ MSC subpopulation and the mRNA expression levels of GATA transcriptional factors in CRA model mice. We further researched the therapy efficiency of Sca-1+ MSCs on CRA. Our data shared light on the interaction between erythropoiesis and hematopoietic microenvironment in CRA circumstance.
Materials and Methods
Ethics statement
All animal experiments were performed in compliance with relevant regulatory standards and approved by the Animal Resource Center of the Fourth Military Medical University.
Mice
Six- to eight-week-old C57BL/6 mice of which female and male mice accounted for half were purchased from Animal Center of the Fourth Military Medical University. All mice were maintained in a pathogen-free room and handled in accordance with the guidelines of the Animal Care and Use Committee of the Fourth Military Medical University.
Preparation of mouse MSC mixture and Sca-1+ MSC subpopulation cells
Six- to eight-week-old C57BL/6 mice were used to obtain samples. Femurs and tibias were aseptically dissected. And bones were disassociated from muscles and carefully rubbed to remove attached soft tissue. Then epiphyses were removed to insert a syringe needle into the cavity and flush BM out with phosphate-buffered saline (PBS) at least five times. After getting rid of BM cells, the bones were crushed gently with a mortar and pestle in PBS buffer until they became colorless. The remaining bone fragments were incubated with collagenase type I (3 mg/mL; Sigma, Ronkonkoma, NY) and gently agitated for 60 min at 37°C. The digested mixture cells were then filtered through a 70 μm nylon cell strainer (BD Bioscience, San Jose), centrifuged at 200 g at 4°C, 5 min, and resuspended in PBS, and red blood cells were removed using red blood cell lysate (RBCL) buffer (Sigma, CA) to get MSCs. Then the phenotype of MSCs was identified based upon cell-surface expression of CD44, CD51, CD90, and CD105 (Supplementary Fig. S1; Supplementary Data are available online at
Sca-1+ MSCs were sorted from MSC mixture using EasySep mouse Sca-1 Positive Selection Kit (Stem Cell Ltd., Vancouver, Canada), according to the manufacturer's instructions. Sorted cells were washed once and suspended in PBS for intravenous infusion without cultivation. The characteristics of Sca-1+ MSCs were reported in our pervious article [16].
Preparation of mouse BM cells
Tibias and femurs were excised from 6 to 8 weeks old C57BL/6 mice. After cleaning of the muscle and connective tissue, BM cells were gently flushed and collected. Red blood cells were lysed by RBCL buffer (Sigma, CA). The cells were filtered through a 70 μm nylon cell strainer (BD Bioscience, San Jose), centrifuged at 200 g at 4°C, and then resuspended in PBS.
Animal models of anemia of cancer
For the mouse model of metastatic melanoma, animals were subcutaneously injected with 2.5 × 10⁶ B16 cells (ATCC). The mouse melanoma cell line B16 cells were cultured as adherent cells in RPMI 1640 with 10% heat-inactivated fetal bovine serum (FBS), 60 mg/mL penicillin, and 100 mg/mL streptomycin with 5% CO2 at 37°C. All the cell culture reagents are bought from Gibco@Life Technologies, Grand Island, NY.
On the day of treatment, tumor cells were resuspended in PBS, counted with a hemacytometer, and subcutaneously injected in a volume of 250 μL PBS (abbreviation for B16 group). Control mice were subcutaneously injected with 250 μL PBS (abbreviation for control group). At 20th day after injection, tumor volume was measured and recorded length (mm) as “a” and width (mm) as “b” to calculate tumor volume under formula a × b2/2. Peripheral blood, bone, and BM were collected for later use. Eight mice were used per group and pooled from two independent experiments.
For the mouse model of rescuing anemia with MSCs/Sca-1+ MSCs, mice were intravenously injected with 2.5 × 10⁶ B16 cells in a volume of 250 μL PBS in B16 cell injected group (abbreviation for B16 group). For binary injection of 2.5 × 10⁶ B16 cells with either 2 × 10⁵ MSCs or 4 × 10⁴ Sca-1+ MSC subpopulation, cells intravenously injected were separately named as B16/MSC group and B16/Sca-1+ group for brief. Control mice were injected with 250 μL PBS. Tumor volume, peripheral blood, bone, and BM were collected at 20th day after injection. Eight mice per group were collected from two independent experiments.
Hematologic studies and histocytopathology
Whole blood samples were collected from the retro-orbital sinus. The red blood cell count (RBC), hematocrit (Hct), and Hb were analyzed using Sysmex XP-100 instrument (Sysmex, Japan). Peripheral blood smears were performed using 10 μL whole blood at the time of necropsy and were prepared with Wright-Giemsa stain (Fisher, Hampton, NH). They were examined on Olympus BX40 fluorescence microscope.
Flow cytometry
MSCs, Sca-1+ MSC subpopulation cells, and BM cells were harvested, filtered through a nylon filter, and resuspended in PBS containing 2% FBS (Gibco; Life Technologies, Grand Island, NY) and 0.05% NaN3.The cells were stained by various antibodies as follows at 4°C for 30 min before analysis using a FACSCalibur CellQuest Pro (BD Immunocytometry System, San Jose). Dead cells were excluded first by propidium iodide gating. MSCs were identified by PE anti-mouse CD44 (IM7; BD), PE anti-mouse CD51 (RMV-7; eBioscience, San Diego), APC anti-mouse CD90 (OX-7; BD), and APC anti-mouse CD105 (MJ7/18; BioLegend, CA). Sca-1+ MSC subpopulation was identified by APC anti-mouse CD45 (30-F11; BioLegend, CA), APC anti-mouse CD31 (MEC 13.3; BioLegend, CA), APC anti-mouse Ter119 (17-5921; eBioscience, San Diego), PE anti-mouse CD146 (P1H12; eBioscience, San Diego), PE anti-mouse CD166 (R&D Systems, Inc.), and FITC anti-mouse Sca-1 (E13-161.7; BioLegend, CA). Erythroid progenitors in BM were characterized by APC anti-mouse Ter119 (17-5921; eBioscience, San Diego) and FITC anti-mouse CD71 (RI7217; BioLegend, CA). Hematopoietic stem progenitor cells were characterized by APC anti-mouse CD3 (17A2; BioLegend, CA), APC anti-mouse CD4 (GK1.5; BioLegend, CA), APC anti-mouse CD8a (53-6.7; BioLegend, CA), APC anti-mouse B220 (RA3-6B2; BioLegend, CA), APC anti-mouse CD11b (M1/70; BioLegend, CA), APC anti-mouse Ter119 (17-5921; eBioscience, San Diego), APC anti-mouse Gr1 (17-5931; eBioscience, San Diego), PE anti-mouse c-Kit (2B8; BioLegend, CA), and FITC anti-mouse Sca-1 (E13-161.7; BioLegend, CA). Finally, data were analyzed by FlowJo software.
RNA isolation and quantitative real-time PCR
Total RNA was extracted using RNeasy RNA Isolation Kit (Qiagen, Dusseldorf, Germany) according to the instructions and was reverse-transcribed into cDNA using Sensiscript RT Kit (Qiagen, Dusseldorf, Germany). Quantitative real-time PCR (qRT-PCR) was performed and analyzed under the manual instruction of Fast Essential DNA Green Master Kit (Roche), Bio-Rad® CFX Connect™ instrument, and Bio-Rad CFX manager software. The reaction mix contains 2 × Master mix, 0.5 μM forward primer, and 0.5 μM reverse primer in a total volume of 20 μL. Relative expression of GATA-1 and GATA-2 normalized with β-actin was calculated with ΔΔCq method. Gene gata-1, gata-2, and β-actin (control) primers were as follows: gata-1-F 5′ GGA GGA ATG CCA GCG GAG AT 3′ and gata-1-R 5′ TGC AGT GCC CAG TGC CAA GC 3′ gata-2-F 5′ TCA GAC GAC AAC CAC CAC CTT A 3′ and gata-2-R 5′ ATT TGC TGG ACA TCT TCC GAT T3 β-actin-F 5′ GAT CAT GTT TGA GAC CTT CAA CAC C 3′ and β-actin-R 5′ CGT GAGGGA GAG CAT AGC CC 3′
Statistics
Statistical analyses were performed using GraphPad Prism software v.6. If not otherwise stated, error bar indicates mean ± standard deviation. The Student's t-test was performed to evaluate the differences between two groups. Significance levels were set as *P < 0.05; **P < 0.01; and ***P < 0.001.
Results
Anemia was developed in melanoma-bearing mice
Anemia model was established by subcutaneously injecting B16 melanoma cells into wild-type C57BL/6 mice. At 20th day after injection, an apparent solid tumor was seen in B16 cell-injected mice (B16 group) (Fig. 1A). Hematologic studies showed that the index of the red blood cell count (RBC), Hct, and Hb in peripheral blood was significantly reduced at 20th day post-B16-injection. There were the number of RBC (1.993 × 10¹²/L ± 0.1081), Hct (0.1121% ± 0.0055%), and Hb (33.43 ± 1.462 g/L) in B16 cell injected mice, and the number of RBC (5.762 × 10¹²/L ± 0.1081), Hct (0.2876% ± 0.0187%), and Hb (90.60 ± 5.455 g/L) in wild-type mice (Fig. 1B–D). The histocytopathology of blood slides showed an obviously decreased density of RBCs in peripheral blood of tumor-bearing mice compared with that of control mice (Fig. 1E). These results indicated that the CRA mice model has been successfully established.
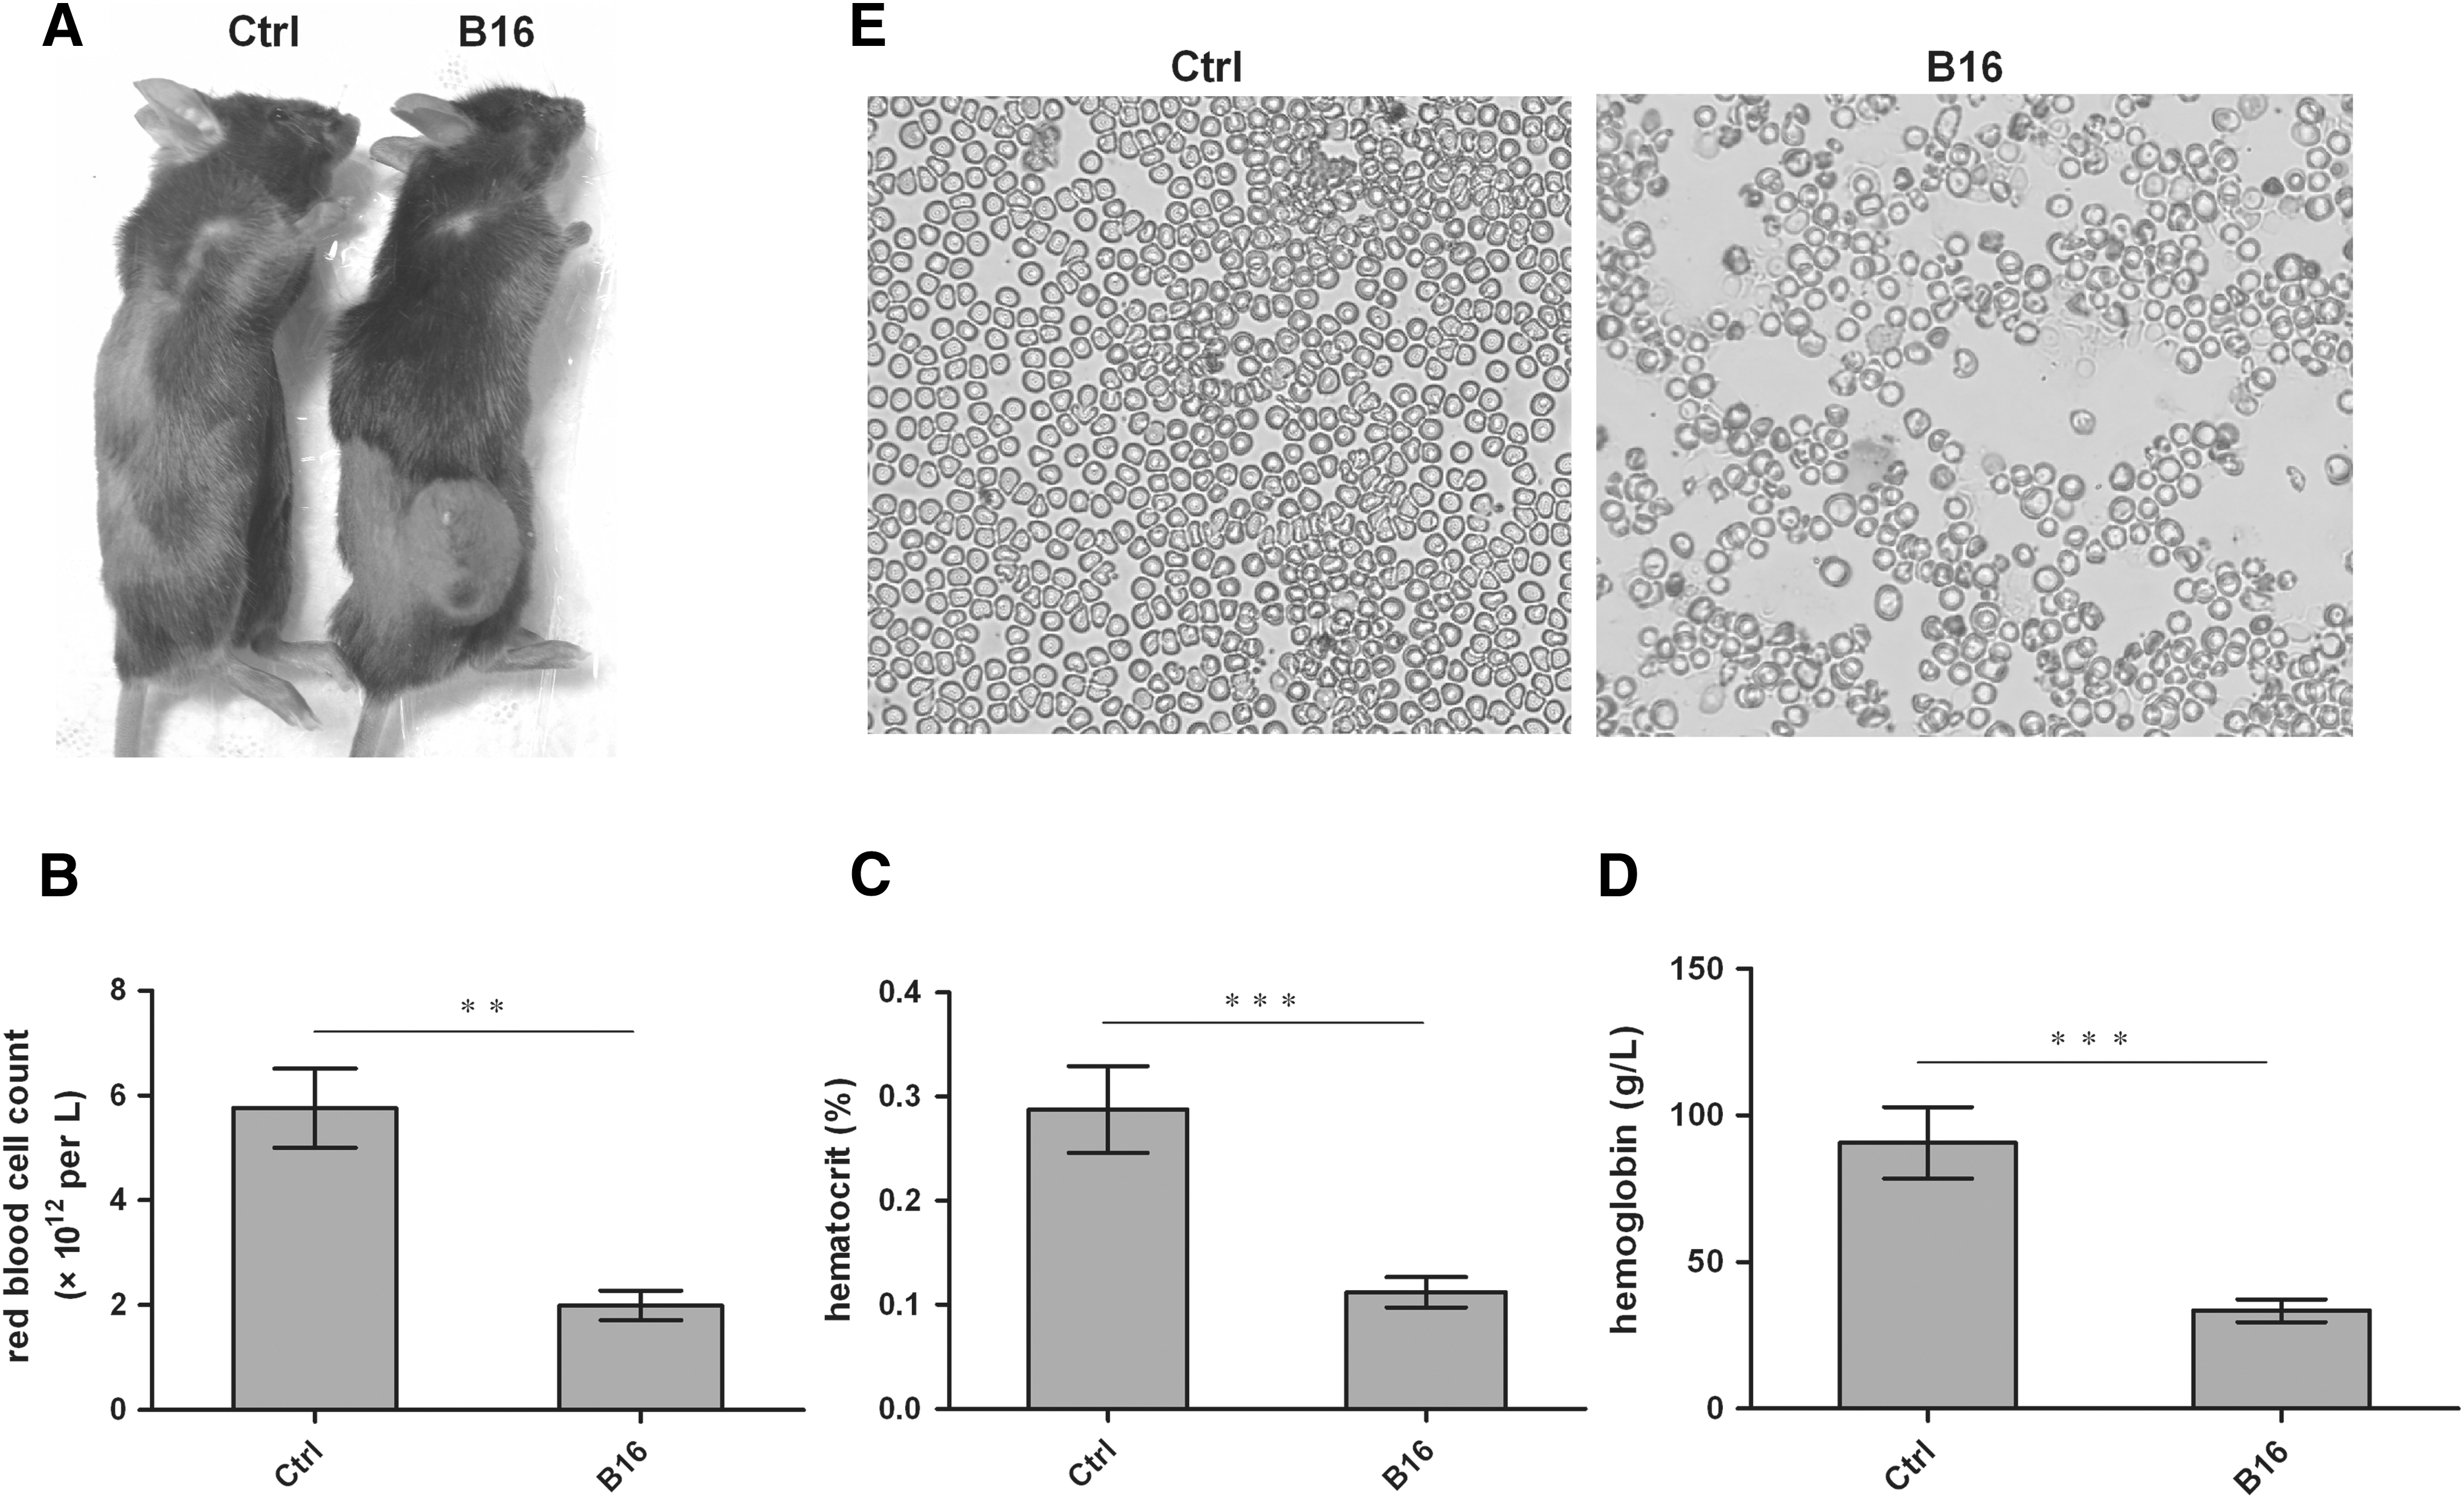
Mice erythroid phenotype and parameter counts after B16 cell injection.
The intrinsic basis of anemia was the disorder of HSC development and/or abnormal erythropoiesis in BM [5]. The morphological analysis showed that the femurs of CRA mice were paler than those of wild-type mice (Fig. 2A). It suggested that CRA may be traceable in BM. Thus, we subsequently analyzed the number of HSC and erythroid progenitors in BM of CRA model mice using flow cytometry. The cell number of LSK of CRA mice was less than half of those of wild-type mice (P < 0.01) (Fig. 2B, C). In CRA mice, the cell numbers of proerythroblasts (P < 0.05) and basophilic erythroblasts (P < 0.01) were significantly increased, and the cell numbers of orthochromatic erythroblasts were remarkably decreased (P < 0.0001; Fig. 2D, E). These data demonstrated that the maturation of erythroid progenitors in CRA mice was ceased between basophilic erythroblasts and polychromatophilic erythroblast.
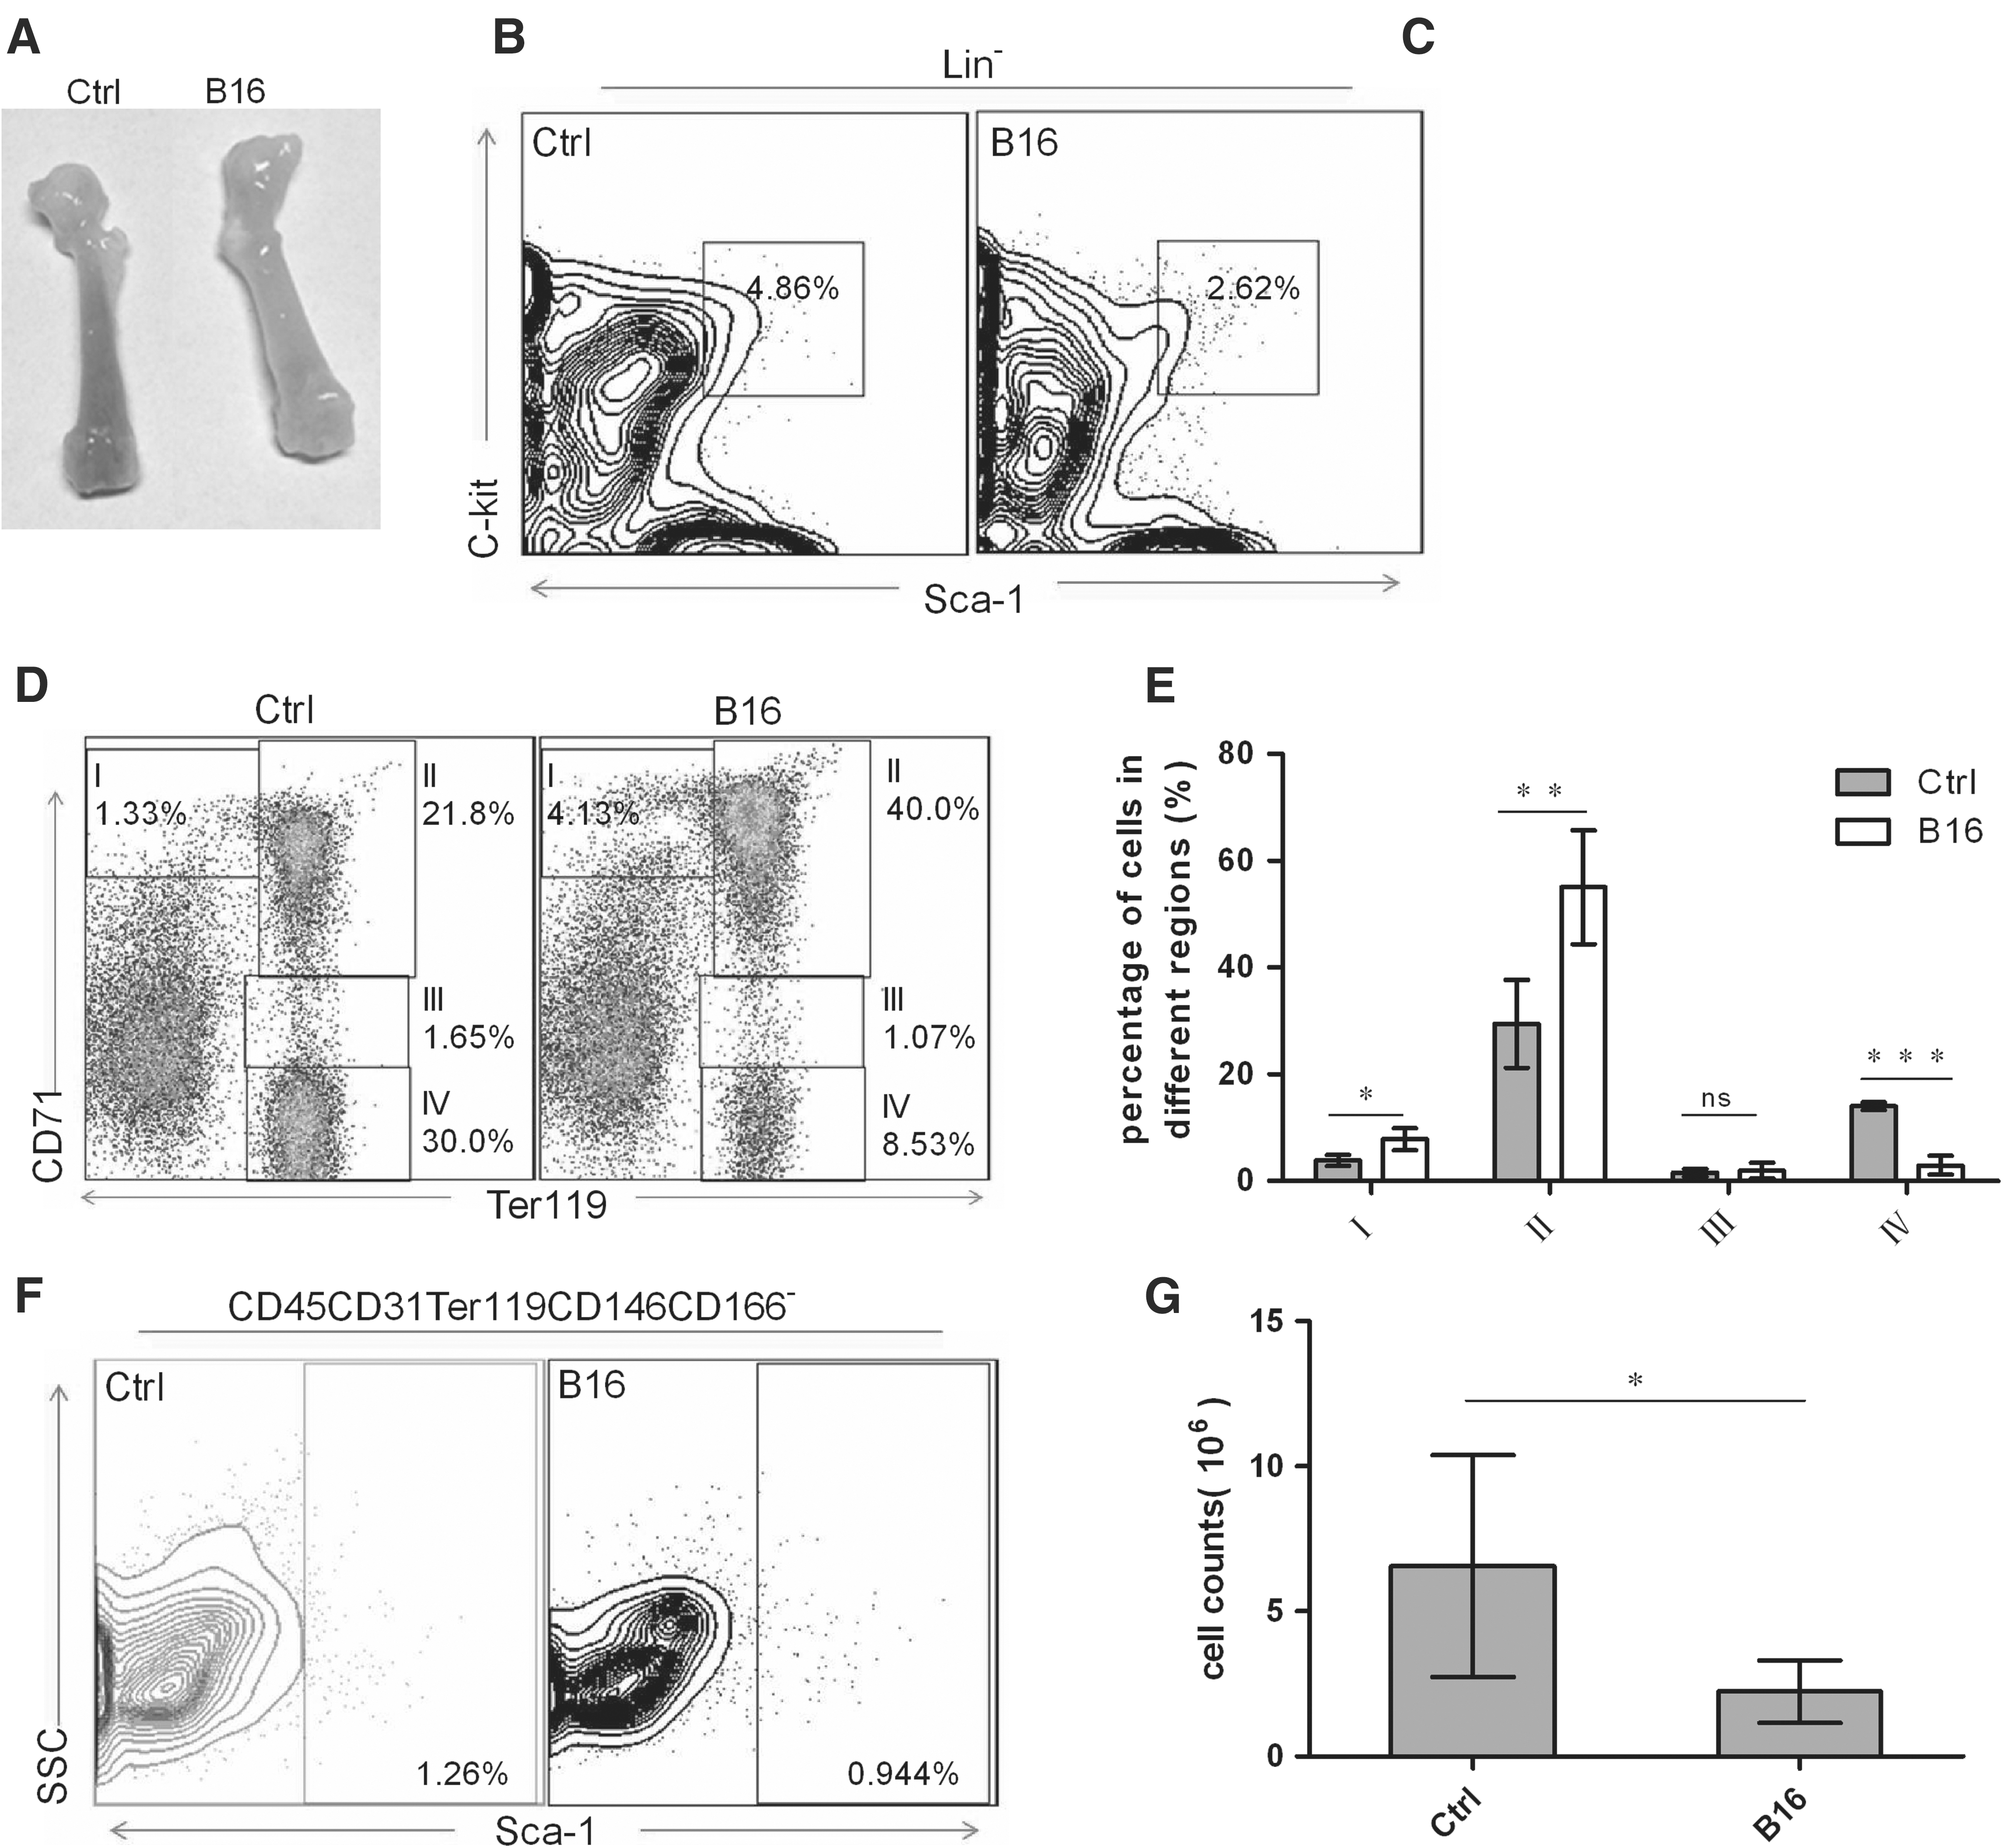
Erythroid and niche progenitor changes in CRA mouse model. After injection for 20 days, the mice were scarified and analyzed by flow. All dead cells were excluded by propidium iodide.
To investigate whether Sca-1+ MSCs in niche was an important regulatory factor for erythropoiesis, we further tested the difference of Sca-1+ MSCs in CRA mice and wild-type mice. It showed that the number of Sca-1+ MSCs decreased by 50% in CRA mice, compared to that in wild-type mice (P < 0.05) (Fig. 2F, G). Taken together, these results suggested that Sca-1+ MSCs, as an important composition of BM niche, may involve in CRA pathogenesis by regulating erythropoiesis.
Anemia was rescued by Sca-1+ MSC in CRA mice
It was reported that Sca-1+ MSCs could support HSC maintenance [13] and participate in hemocyte differentiation [14,15]. And we found that the number of Sca-1+ MSCs decreased in CRA mice (Fig. 2F, G). Therefore, we assumed that transplantation of Sca-1+ MSCs into CRA mice may treat the anemia. As expected, the survival of CRA mice transplanted with Sca-1+ MSCs was significantly prolonged compared to that of CRA mice without any treatment (P < 0.05). However, MSCs had no obvious effect on prolonging survival (P = 0.1393; Fig. 3A).
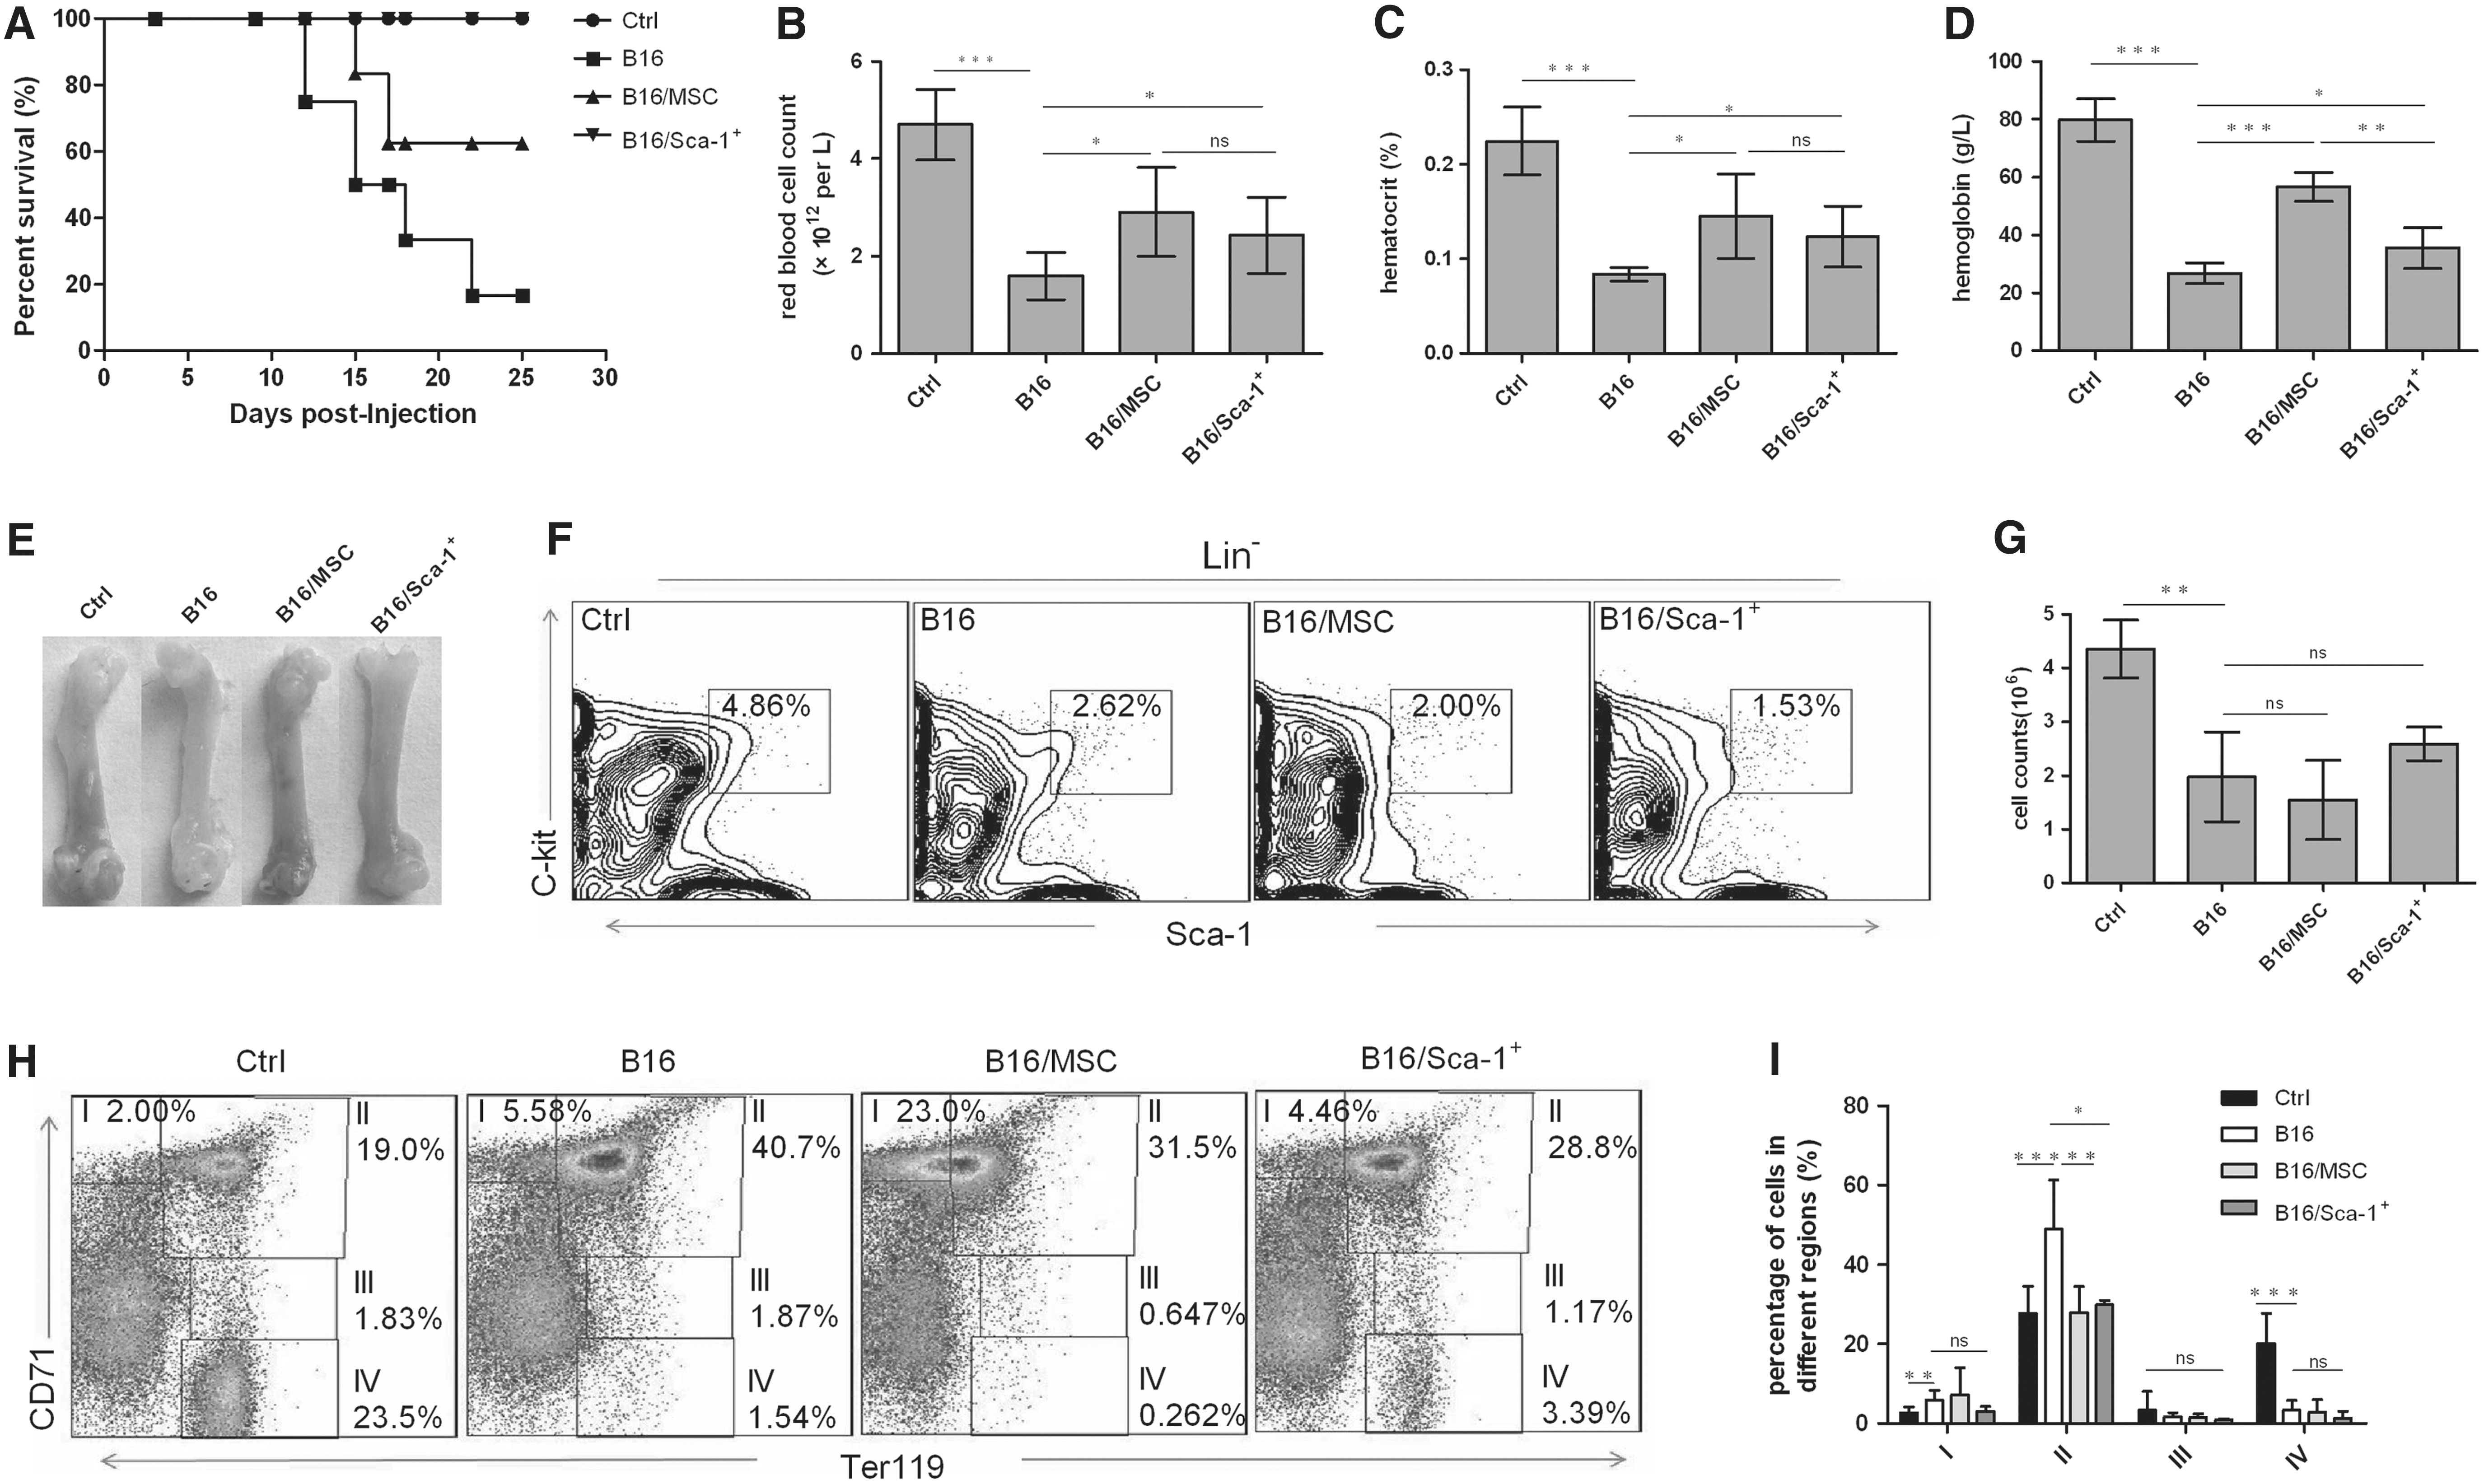
Mice erythroid phenotype, parameter counts, and erythroid progenitors coinjected with B16 cell and bone-associated MSCs/Sca-1+ MSC subpopulation. 2.5 × 10⁶ B16 cells were injected subcutaneously into C57BL/6 mice which subsequently were injected with either 2 × 10⁵ MSCs or 4 × 10⁴ Sca-1+ MSC subpopulation cells intravenously. The animals were scarified and analyzed after 20 days.
On the 20th day after treatment, the number of RBCs, Hct, and Hb in peripheral blood of CRA mice transplanted with Sca-1+ MSCs or MSCs was higher than those of CRA mice without any treatment (Fig. 3B–D; Table 1). And the morphological analysis also showed that femurs of CRA mice transplanted with Sca-1+ MSCs were ruddier compared with CRA mice without treatment (Fig. 3E). We also calculated tumor volume of all CRA mice. The results showed that there was no obvious difference between Sca-1+ MSC transplanted group and CRA group (P = 0.8754; Supplementary Fig. S2 and Supplementary Table S1). And the tumor volume was biggest in the MSC transplanted group (P < 0.001 for B16 group and P < 0.05 for B16/Sca-1+ group) (Supplementary Fig. S2 and Supplementary Table S1). Taken together, these data indicated that Sca-1+ MSCs could rescue the anemia.
All data are shown as mean ± SD.
Hb, hemoglobin; Hct, hematocrit; MSC, mesenchymal stromal cell; SD, standard deviation.
We subsequently evaluated erythropoiesis in BM of CRA mice after treating with Sca-1+ MSCs. The results showed that the number of LSK cells in all mice bearing tumor was decreased (Fig. 3F, G). The increase of basophilic erythroblasts was obviously inhibited by the transplantation of Sca-1+ MSCs (P < 0.05), which was also observed in mice transplanted with MSCs (P < 0.01) (Fig. 3H, I). As for the proerythroblasts, polychromatophilic erythroblast, and orthochromatic erythroblasts, there was no significant difference among all of CRA mice (Fig. 3H, I). Together, these results suggested that Sca-1+ MSC subpopulation cells could rescue CRA by modulating erythroid progenitor development.
The mRNA level of transcription factors GATA-1 and GATA-2 was rebalanced by Sca-1+ MSC transplantation
GATA-1 and GATA-2 are the vital transcription factors in regulating RBC development. The abnormal expression pattern of GATA-1 and GATA-2 may result in abnormal erythropoiesis. Therefore, we explored the mRNA level of GATA-1 and GATA-2 in CRA mice transplanted with Sca-1+ MSCs. As shown in Fig. 4, the expression pattern of GATA-1 and GATA-2 was reversed in CRA mice without any treatment, compared to that of wild-type mice. And after transplanting with Sca-1+ MSCs or MSCs, the expression pattern was almost back to normal (Fig. 4). These results indicated that the therapeutic effects of Sca-1+ MSCs/MSCs on CRA were related to transcription factors GATA-1 and GATA-2.
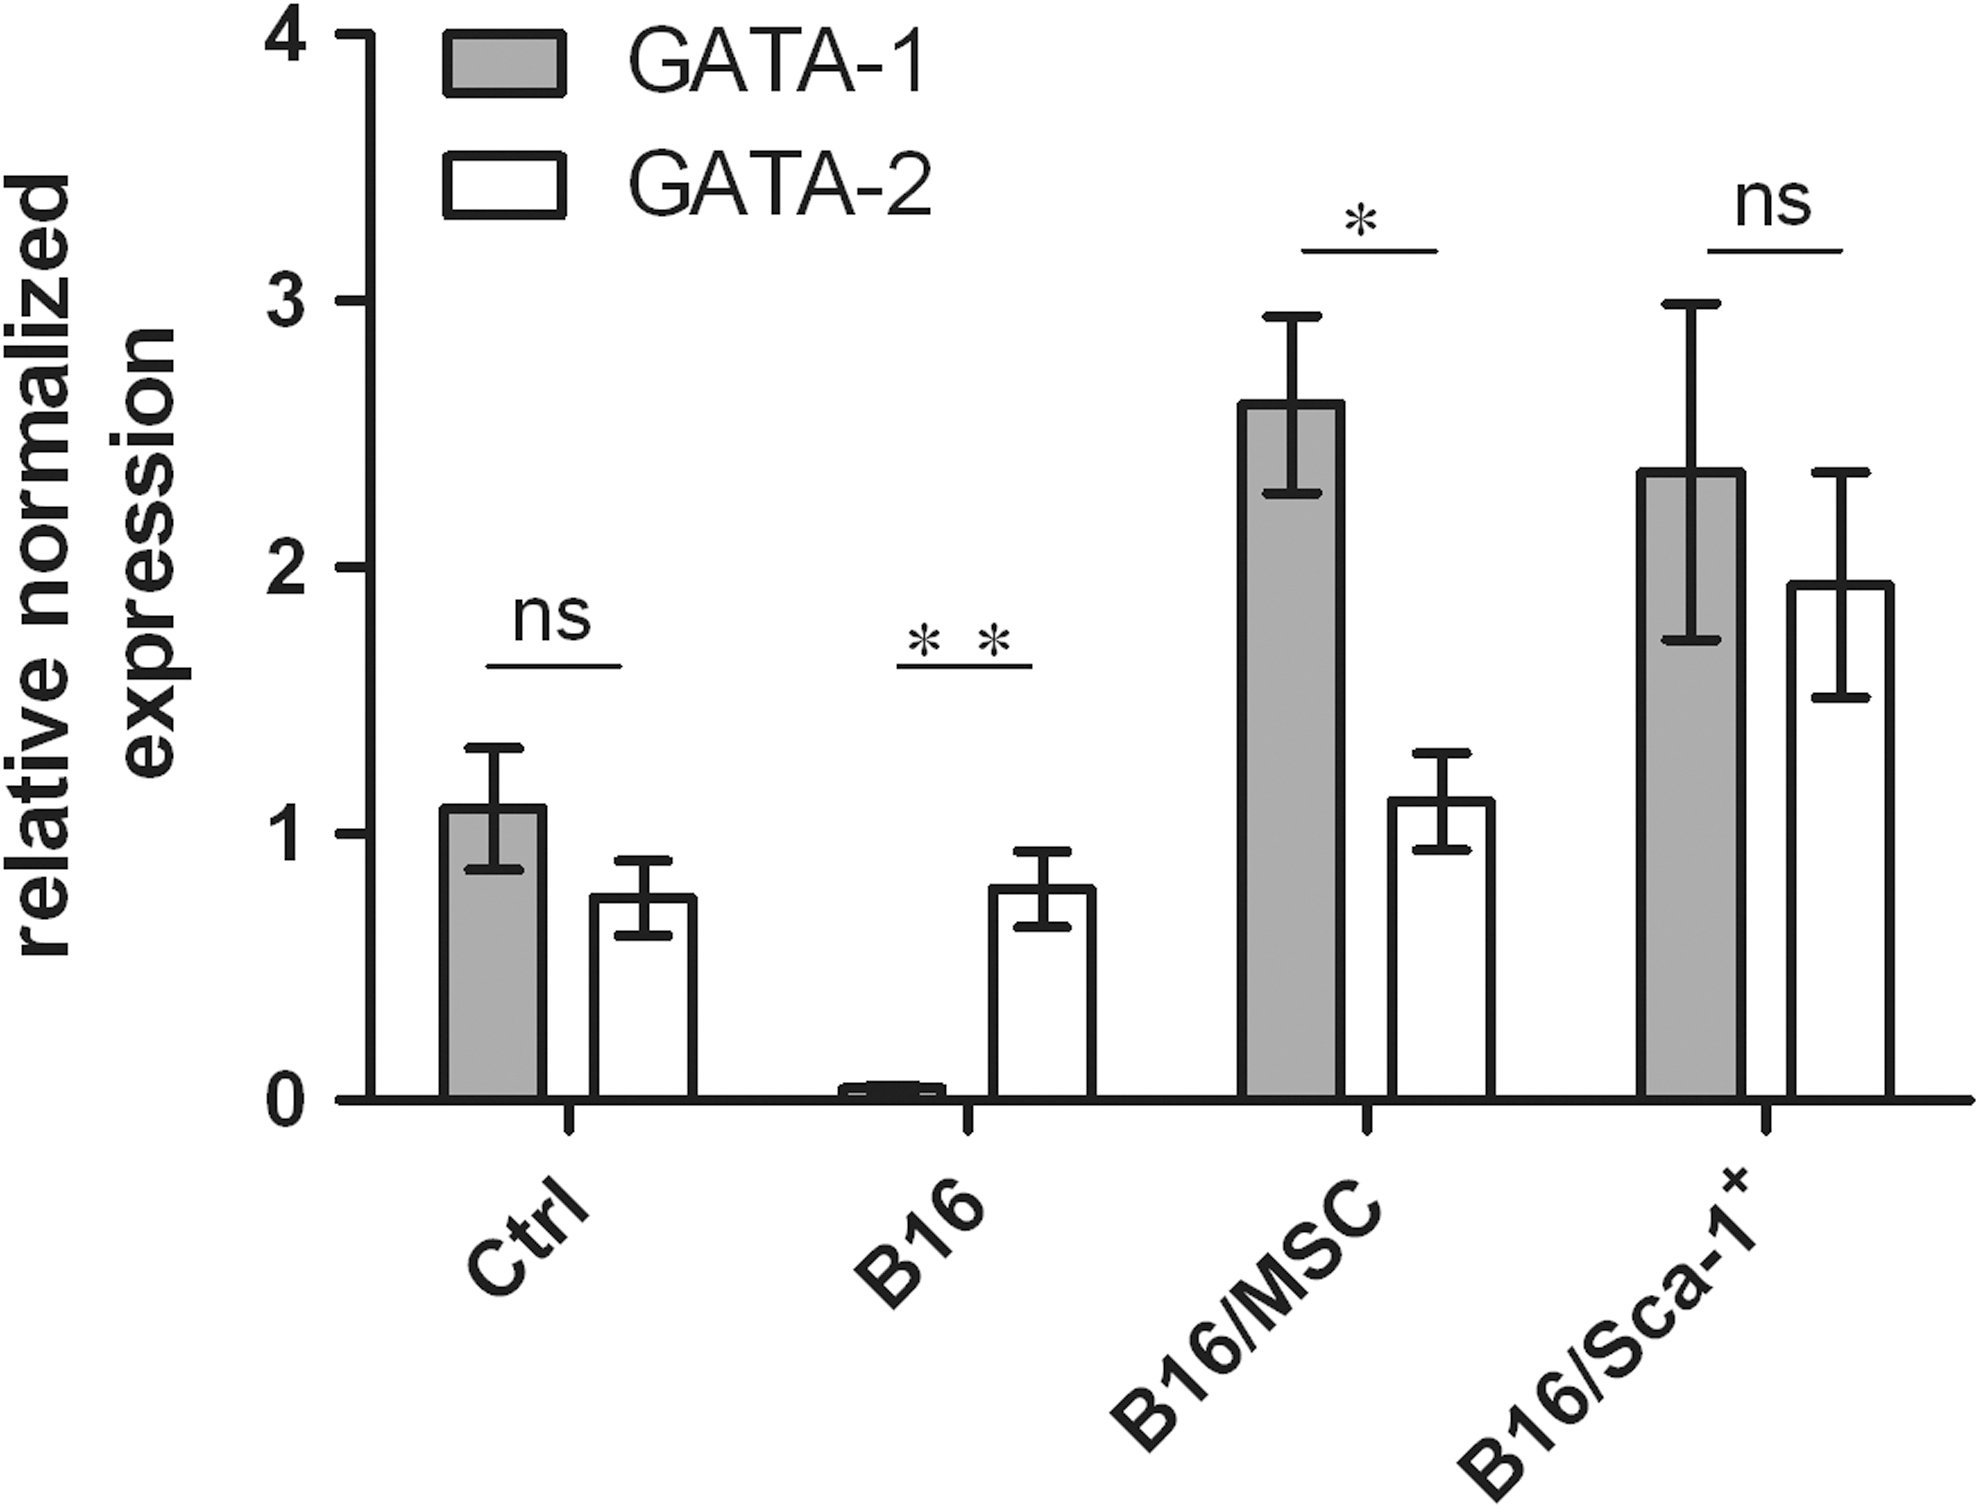
The expression levels of GATA-1 and GATA-2 in BM of various treated mice using quantitative real-time PCR (qRT-PCR). 2.5 × 10⁶ B16 cells were injected subcutaneously into C57BL/6 mice which subsequently were injected with either 2 × 10⁵ MSCs or 4 × 10⁴ Sca-1+ MSC subpopulation cells intravenously. The animals were scarified and analyzed after 20 days. BM cells were collected, and RNA was extracted for performing quantitative real-time PCR. GATA-1 and GATA-2 mRNA levels were determined by qRT-PCR. All data are shown as mean ± SD. *P < 0.05; **P < 0.01; ***P < 0.001, n = 3.
Discussion
In the current study, we generated CRA model mice whose number of RBCs, Hct, and Hb in peripheral blood remarkably decreased. In BM, the number of LSK cells was decreased, but the cell numbers of proerythroblasts and basophilic erythroblasts were accumulated. In hematopoietic microenvironment (niche), the number of Sca-1+ MSC subpopulation cells was decreased. Following cell therapeutic strategy, Sca-1+ MSCs, one subpopulation of MSCs, were transplanted into CRA mice for anemia treatment. Our results demonstrated that the anemia, at least caused by melanomas, could be ameliorated by Sca-1+ MSCs.
Clinically, CRA is considered as a kind of secondary hematologic disease induced by tumor. For the nosogenesis of hematologic diseases, most of the researches focused on the interaction between hematopoietic microenvironment and HSCs in BM. We also focused on this interaction, and we found that Sca-1+ MSCs were decreased significantly in mice suffering with melanoma. In our previous work, we found that Sca-1+ MSCs could support HSC maintenance [13], participated in hemocyte differentiation [14,15], and showed clinical application in inhibiting GVHD in mice after BM transplantation [16]. In the current study, hematologic results supported that Sca-1+ MSCs could efficiently increase RBC, Hct, and Hb in CRA mice.
Recently, many studies showed that MSCs, as an important component in niche, exhibited the function in regulating hematopoiesis [22 –25]. Therein, MSCs were used to treat anemia, including acquired aplastic anemia [12]. However, MSCs comprise different types of cells, expressing surface markers such as CD105+, CD51+, Nestin+, and so on [22]. So it was difficult to accurately evaluate the function of MSC mixture. For CRA patient, MSC treatment may be a double-edged sword. Because of immunosuppression, MSCs may enhance immune escape of tumor cells. Our results about tumor volume suggested that MSCs could promote the tumor progression, which may lead to side effects on CRA therapy. So we used Sca-1+ MSCs, one subpopulation of MSCs, to treat CRA. The results showed that Sca-1+ MSCs rescued CRA without promoting the tumor progression.
We also studied the molecule mechanism of Sca-1+ MSCs on CRA treatment. The abnormal expression pattern of GATA-1 and GATA-2 may result in erythropoiesis disorder [21]. In CRA mice model, the expression pattern of GATA-1 and GATA-2 was unusual. Sca-1+ MSCs rebalanced GATA-1 and GATA-2 in CRA mice model. Therefore, it was suggested that GATA-1 and GATA-2 joined in CRA treatment by Sca-1+ MSCs. In the following investigation, it is needed to probe the GATA-1 and GATA-2 level in different erythroid progenitors.
Meanwhile, we found different effects between Sca-1+ MSCs and MSCs on rescuing CRA. For example, the levels of Hb of two treatment groups were different, which suggested that MSCs and Sca-1+ MSCs had different potential for treating CRA.
In summary, Sca-1+ MSCs could notably suppress the accumulation of erythroid progenitors through regulating the expression pattern of GATA-1/2. Anemia syndrome could be significantly amended in both peripheral blood and BM. The observations in the current study may inspire a potential therapeutic target in CRA treatment using a single MSC subpopulation.
Footnotes
Acknowledgments
The authors thank Animal Resource Center of the Fourth Military Medical University for providing mice and Department of Clinical Diagnostics Laboratory of the Fourth Military Medical University for providing BD FACSCalibur. This work was supported by the Scientific and Technological Research Project in Shaanxi province (grant no. 2014K11-03-06-06) and the National Natural Science Foundation of China (grant no. 31570907).
Author Disclosure Statement
No competing financial interests exist.
References
Supplementary Material
Please find the following supplemental material available below.
For Open Access articles published under a Creative Commons License, all supplemental material carries the same license as the article it is associated with.
For non-Open Access articles published, all supplemental material carries a non-exclusive license, and permission requests for re-use of supplemental material or any part of supplemental material shall be sent directly to the copyright owner as specified in the copyright notice associated with the article.
