
Abstract
Amniotic fluid contains multipotent cells and could be a source of stem cells for clinical use. Amniotic fluid cells (AFCs) are made up of a heterogeneous population of fetal cells that can be retrieved during pregnancy without ethical concerns as it is a standard clinical procedure. Studies of proliferation, multipotent marker expression, differentiation, and gene expression were performed after culturing with dexamethasone, valproic acid, and magnesium sulfate. There were correlations between known drug effects on the human fetus and changes seen in human AFCs in culture, as well as previously undescribed observations in neural and chondrogenic inducibility. Gene expression profiles confirmed these observations. AFC culture may provide a novel method to evaluate pharmacological agents before clinical use in pregnancy.
Introduction
H
AFCs are frequently obtained for clinical indications and may be used in regenerative medicine [9 –11]. Pharmacological agents used in pregnancy are not usually tested on pregnant women due to ethical concerns, including potential effects on the fetus. Animal models and epidemiologic studies are the primary source of information regarding the safety of pharmacological agents employed in pregnancy. Exposing AFCs in culture to these agents might predict their effects on the developing human fetus.
Our hypothesis was that AFC cultures will express the effects of pharmacologic agents. We sought to determine this by examining alterations in proliferation, stem cell and lineage markers, and differentiation as well as genomic changes. We chose valproic acid (VPA), dexamethasone (DEX), and magnesium sulfate (MgSO4) for study. VPA is a known teratogen, prescribed as an anticonvulsant [12]. DEX is used to promote fetal maturation in the setting of premature birth for pulmonary development and to prevent intraventricular hemorrhage as well as necrotizing enterocolitis in the newborn [13,14]. MgSO4 is frequently prescribed for seizure prophylaxis in preeclampsia and recently for fetal neuroprotection [15 –19].
Materials and Methods
Ethics
This study was approved by the Institutional Review Board of New York University Langone Medical Center. Samples were collected from three gravid patients. Each patient underwent a clinically indicated midtrimester amniocentesis and had a normal karyotype. Both fresh amniotic fluid and samples from the cytogenetics laboratory were cultured. Samples were used from early passages of actively dividing cells. Samples 1113C and 1407C were 46 XX, while 1205C was 46 XY.
Isolation of human AFCs
Fresh amniotic fluid samples (2–5 mL for each sample) were diluted with phosphate buffer solution and then centrifuged at 300 g (4°C) for 5 min. The supernatant was discarded; pelleted cells were suspended in culture medium and then transferred to 60- or 100-mm tissue culture dishes (Nunc Thermo Scientific, Hampton, NH). The dishes were incubated at 37°C with 5% humidified CO2 using complete AFC medium consisting of MEM-alpha GlutaMAX (Life Technologies, Grand Island, NY), 20% Chang medium D (Irvine Scientific, Santa Ana, CA), 15% embryonic stem cell-qualified fetal bovine serum (Life Technologies), and 100 μg/mL normocin (InvivoGen, San Diego, CA).
Cells were grown to ∼70% confluency in a 37°C humidified incubator with 5% CO2. Absence of mycoplasma in culture was periodically verified with Plasmotest (InVivogen). Cells were detached from plates using Accutase (MP Biomedicals, Irvine, CA) for further experiments. After initial culture, an aliquot was cryopreserved at passages 2–5 for subsequent use of each sample. Samples obtained from the cytogenetics laboratory were processed in the same manner.
Pharmacologic agents
VPA, DEX sodium phosphate (Fresenius Kabi USAL, LLC, Lake Zurich, IL), and MgSO4 (Amresco, Solon, OH) (MgSO4) were studied. VPA (Sigma-Aldrich, St. Louis, MO) dosage was used as suggested by Huangfu [20], where the functional dose was 1 mM [21,22]. DEX [23 –26] and MgSO4 [27 –29] functional doses used were 3.4 μMol and 8.26 mMol as calculated for an average gravid patient. To maximize the total potential effects relative to the clinical situation, total body water (TBW) was assumed to be 3,500 mL, the lower limit for pregnancy. The functional dose was calculated based on an assumption that the agents were uniformly distributed in the gravidas' TBW and published rates of placental transfer as cited above. Cultures were either exposed to each agent for a single treatment or were exposed to the agent continuously for the entire period of culture.
Cell culture of human AFCs
Samples were plated in 60- or 100-mm tissue culture dishes (Nunc Thermo Scientific) in complete AFC medium. The cultures were subcultured at ∼1:4. Subculturing was performed at 3–4-day intervals depending on the growth rate of the cells.
Morphology and proliferation analysis
Individual cell morphology was observed using 10 × magnifications. After differentiation, morphology of spheroids was again evaluated with Nikon Eclipse TE2000-E (Nikon Instruments, Inc., Melville, NY) and images were acquired with Nikon NIS-Elements Imaging Software BR 3.10. Cell counts were determined by examining gridded culture dishes and counting the cells each day for 4 days. The proliferation of each sample was compared at different concentrations of agents, including the functional dose, ½ functional dose, 2 × functional dose, and 10 × functional dose. Cell counts were validated by CellTiter 96 Aqueous One Solution Cell Proliferation Assay (Promega, Madison, WI).
Flow cytometry
Fluorescence active cell sorting was performed for detection of cell surface markers and viability–apoptosis analysis. AFCs were diluted to concentrations of 1 × 10⁶−1 × 10⁷ cells/mL. Cells were stained in 100 mL volumes with 1:1,000 dilutions of the following mouse monoclonal antibodies: anti-human SSEA-4-PerCP-Cy5.5 (BD Pharmingen, San Jose, CA), anti-human CD90-APC (BD Pharmingen), and anti-human TRA-1–60-FITC (BD Pharmingen). Analysis was performed with WinList™ software (Verity Software House, Topsham, ME). Our previous studies demonstrated that these markers of multipotent cells were widely and consistently present and therefore were used to confirm potential stem cell functionality [4]. Pacific Blue (BD Pharmingen) conjugate to Annexin V (BD Pharmingen) antibody was used to analyze for apoptosis.
Production of spheroids
We have found that differentiation of AFCs occurs most efficiently and rapidly when they are grown as spheroids—small, three-dimensional spherical colonies—and have developed a convenient method for producing these structures in large numbers [4]. Tissue quality, round bottom 96-well plates (BD Falcon, Franklin Lakes, NJ) were coated with a thin layer of 0.8% low-melting agarose (Sigma-Aldrich) dissolved in alpha-MEM-GlutaMAX by filling the wells with the melted agarose and then removing the fluid and allowing the remaining film of agarose to solidify during a brief incubation (∼5 min) at 4°C. Cells were seeded at a concentration of 10,000 cells in 100 μL to each coated well. The plates were incubated in a 37°C incubator with 5% CO2 for 2 days. Spheroids formed rapidly and these were transferred into receiving wells of a 4-well chamber slide (EMD Millipore, Billerica, MA) or 96-well flat-bottomed tissue culture plates (BD Biosciences, Billerica, MA) using wide-bore pipette tips. Respective differentiation media were added to each well and the plates incubated at 37°C in a 5% CO2 atmosphere for 2–3 weeks. Methods detecting differentiation are described below.
In vitro neural differentiation
STEMdiff™ Neural Induction medium (Stemcell Technologies, Vancouver, Canada) was used to differentiate AFCs toward a neuronal lineage. The spheroids were transferred into STEMdiff Neural Induction medium supplemented with 10 μM Y-27632 ROCK inhibitor (StemGent, Cambridge, MA), five spheroids per well, and differentiated for 21 days under the following conditions: unexposed to medication, single exposure to medication, and continuous exposure to medication, in addition to uninduced controls. The spheroids were fixed with 3.5% buffered formalin (Thermo Fisher Scientific, Hampton, NH) and incubated with 1:100 dilutions of the following monoclonal antibodies: mouse-anti-human-Nestin-AlexaFluor647 (BD Pharmingen), mouse-anti-human B-tubulin III-AlexaFluor488 (BD Pharmingen) and mounted with VECTASHIELD Mounting Medium with DAPI (Vector Labs, Burlingame, CA), or mouse-anti-human glial fibrillary acidic protein (GFAP)-AlexaFluor488 (BD Pharmingen) and VECTASHIELD Mounting Medium with DAPI (Vector Laboratories, Burlingham, CA). Cells were visualized under fluorescence microscopy with a Nikon Eclipse TE2000-E (Nikon Instruments, Inc.) inverted microscope, and images were acquired with Nikon NIS-Elements Imaging Software BR 3.10. Images were analyzed and quantitated using ImageJ 1.47v (National Institutes of Health, Bethesda, MD).
In vitro osteocyte differentiation
Nonhematopoietic OsteoDiff Medium (Miltenyi Biotech, Cambridge, MA) was used to differentiate AFCs to osteocytes; 4.5 × 10⁴ cells were required per assay (1 assay = 1 well of a 6-well tissue culture plate) (BD Falcon). Differentiation was carried out for 10 days with medium changes every 2–3 days. Spheroids were transferred to osteocyte induction medium and incubated for 2 weeks. Differentiation was performed with samples unexposed to medication, single exposure to medication, and continuous exposure to medication, in addition to uninduced controls. Cells were either fixed with cold methanol and stained with SIGMA FAST BCIP/NBT (Sigma-Aldrich) for alkaline phosphatase-producing cells or fixed with 3.7% buffered formalin for 30 min at room temperature and stained with 2% Alizarin Red solution pH4.3 (Sigma-Aldrich) for 45 min in the dark at room temperature. Cells were visualized under bright-field and phase-contrast microscopy as above. Osteogenic induction patterns were then studied under the same conditions with Ab83369 (Abcam, Cambridge, MA), a quantitative, alkaline, phosphatase, enzymatic colorimetric assay for analysis.
In vitro chondrocyte differentiation
Nonhematopoietic ChondroDiff Medium(Miltenyi Biotech) was used to differentiate AFC spheroids to chondrocytes. The spheroids were transferred to a 4-well chamber slide, five spheroids per well, under the following medium conditions: unexposed to medication, single exposure to medication, and continuous exposure to medication, in addition to uninduced controls. The spheroids were incubated for 21 days, with medium changes every 2–3 days. The spheroids were fixed in 3.5% buffered formalin (Thermo Fisher Scientific) and incubated with 1:100 dilutions of the primary monoclonal antibody, mouse anti-human Aggrecan antibody (Invitrogen, Carlsbad, CA), and 1:200 dilution of the secondary AlexaFluor594 goat anti-Rabbit IgG (H+L) antibody (Invitrogen). Coverslips were mounted with VECTASHIELD Mounting Medium with DAPI (Vector Laboratories). Cells were visualized under fluorescence microscopy with a Nikon Eclipse TE2000-E (Nikon Instruments, Inc.) inverted microscope and images were acquired with Nikon NIS-Elements Imaging Software BR 3.10. Images were analyzed and quantitated using ImageJ 1.47v (National Institutes of Health).
Human AFC genomic characterization
Each patient sample was either left untreated, treated with VPA, or treated with DEX. Each sample treated with VPA was analyzed separately. In addition, the VPA samples were pooled and a combined analysis was performed to control for heterogeneity. DEX samples were pooled and combined analysis was performed as individual analysis did not alter pooled results as studied in the VPA samples. All cells were harvested and RNA collected through the RNeasy Mini Kit (Qiagen, Valencia, CA). Concentration and purity were determined by the NanoDrop Spectrophotometer (ND200) (Thermo Fisher Scientific, Springfield Township, NJ). An aliquot was made for Gene Technology Center (GTC; NYU School of Medicine, New York, NY) RNA quality control. Samples were stored in RNase-free water at −80°C and delivered to the GTC for Affymetrix Gene 2.0 arrays (Santa Clara, CA). Using the Affymetrix method of expression analysis, principal component analysis (PCA) for gene expression was performed. This was a differential gene expression analysis from six Affymetrix Human Gene 2.0 ST microarray chips processed at the GTC. Since this was a highly granular analysis of gene expression, no karyotype studies were indicated.
The Affymetrix Expression Console software was used to extract expression data from each microarray chip using the robust multiarray average algorithm. Data were imported into the R statistical programming environment. The R/Bioconductor package, Limma (Linear Models for Microarray Data, version 3.22.3), was used to assess the quality of the data and to analyze for differential expression after control and low expressing probes were filtered from the data set.
Statistical analysis
Each sample's spheroids were separately analyzed by ImageJ for chondrogenic and neural differentiation studies. For osteogenic induction, samples were analyzed by Ab83369 (Abcam). At least five spheroids were used for each sample and each analysis was done in triplicate. Mean and standard deviation were calculated for results of induction for each assay. As the number of spheroids varied for each sample, an average of averages was calculated for reporting each condition. For genomic studies, enrichment score ≥2, fold change ≥2.0, and P value <0.01 were considered significant. Bonferroni and Benjamini corrections were applied and compared with the uncorrected data.
Genomic analysis
PCA was employed to determine significant differences in gene expression between treated and untreated cell cultures.
Database for Annotation, Visualization, and Integrated Discovery (DAVID) [30] was utilized for cluster analysis to determine pertinent affected functions due to exposure to the agents studied. GOTERM FAT library was chosen to reflect gene ontology and biological processes.
Ingenuity Pathway Analysis (IPA) (IPA®; Qiagen, Redwood City, CA) was utilized to analyze data identified by Affymetrix analysis for both VPA and DEX. Canonical pathways, network functions, and disease and pathway heat maps were generated and analyzed. All function results were coded to reflect either upregulation or downregulation and to reflect z-score. The size of a depicted function reflected P value. Canonical pathways representing well-known well-defined pathways for which there is a well-established gene library were depicted. Networks illustrating gene expression and gene–gene of each pathway were demonstrated.
Results
Morphology
Phase-contrast images at 10 × magnification were taken for each sample. The size of the spheroids varied, but this was not related to treatment. No significant differences were observed among the three cell line samples or pharmacological agent treatment groups.
Proliferation
Cell lines exhibited heterogeneity among samples, but patterns of growth were similar for each treatment. 1407C consistently proliferated most rapidly, followed by 1205C, while 1113C grew more slowly than the others with exposure to DEX, VPA, or MgSO4. For all individual samples in the DEX group, untreated samples, 1/2 × dose and 1 × dose, proliferated at a similar rate. Double dose of DEX appeared to slow the rate of proliferation, while 10 × dose markedly slowed proliferation.
VPA treatment inhibited growth proliferation. Compared with untreated samples, the addition of ½ dose, 1 × dose, 2 × dose, and 10 × dose steadily retarded growth with increased dose concentration of VPA.
MgSO4 treatment had minimal effect on proliferation rates. Although ½ × , 1 × , and 2 × MgSO4 doses appear to have caused more rapid proliferation of all individual samples, the difference in the rate of growth compared with untreated samples was not significant. In contrast to untreated samples, treatment with 10 × MgSO4 slowed cell growth (Fig. 1).
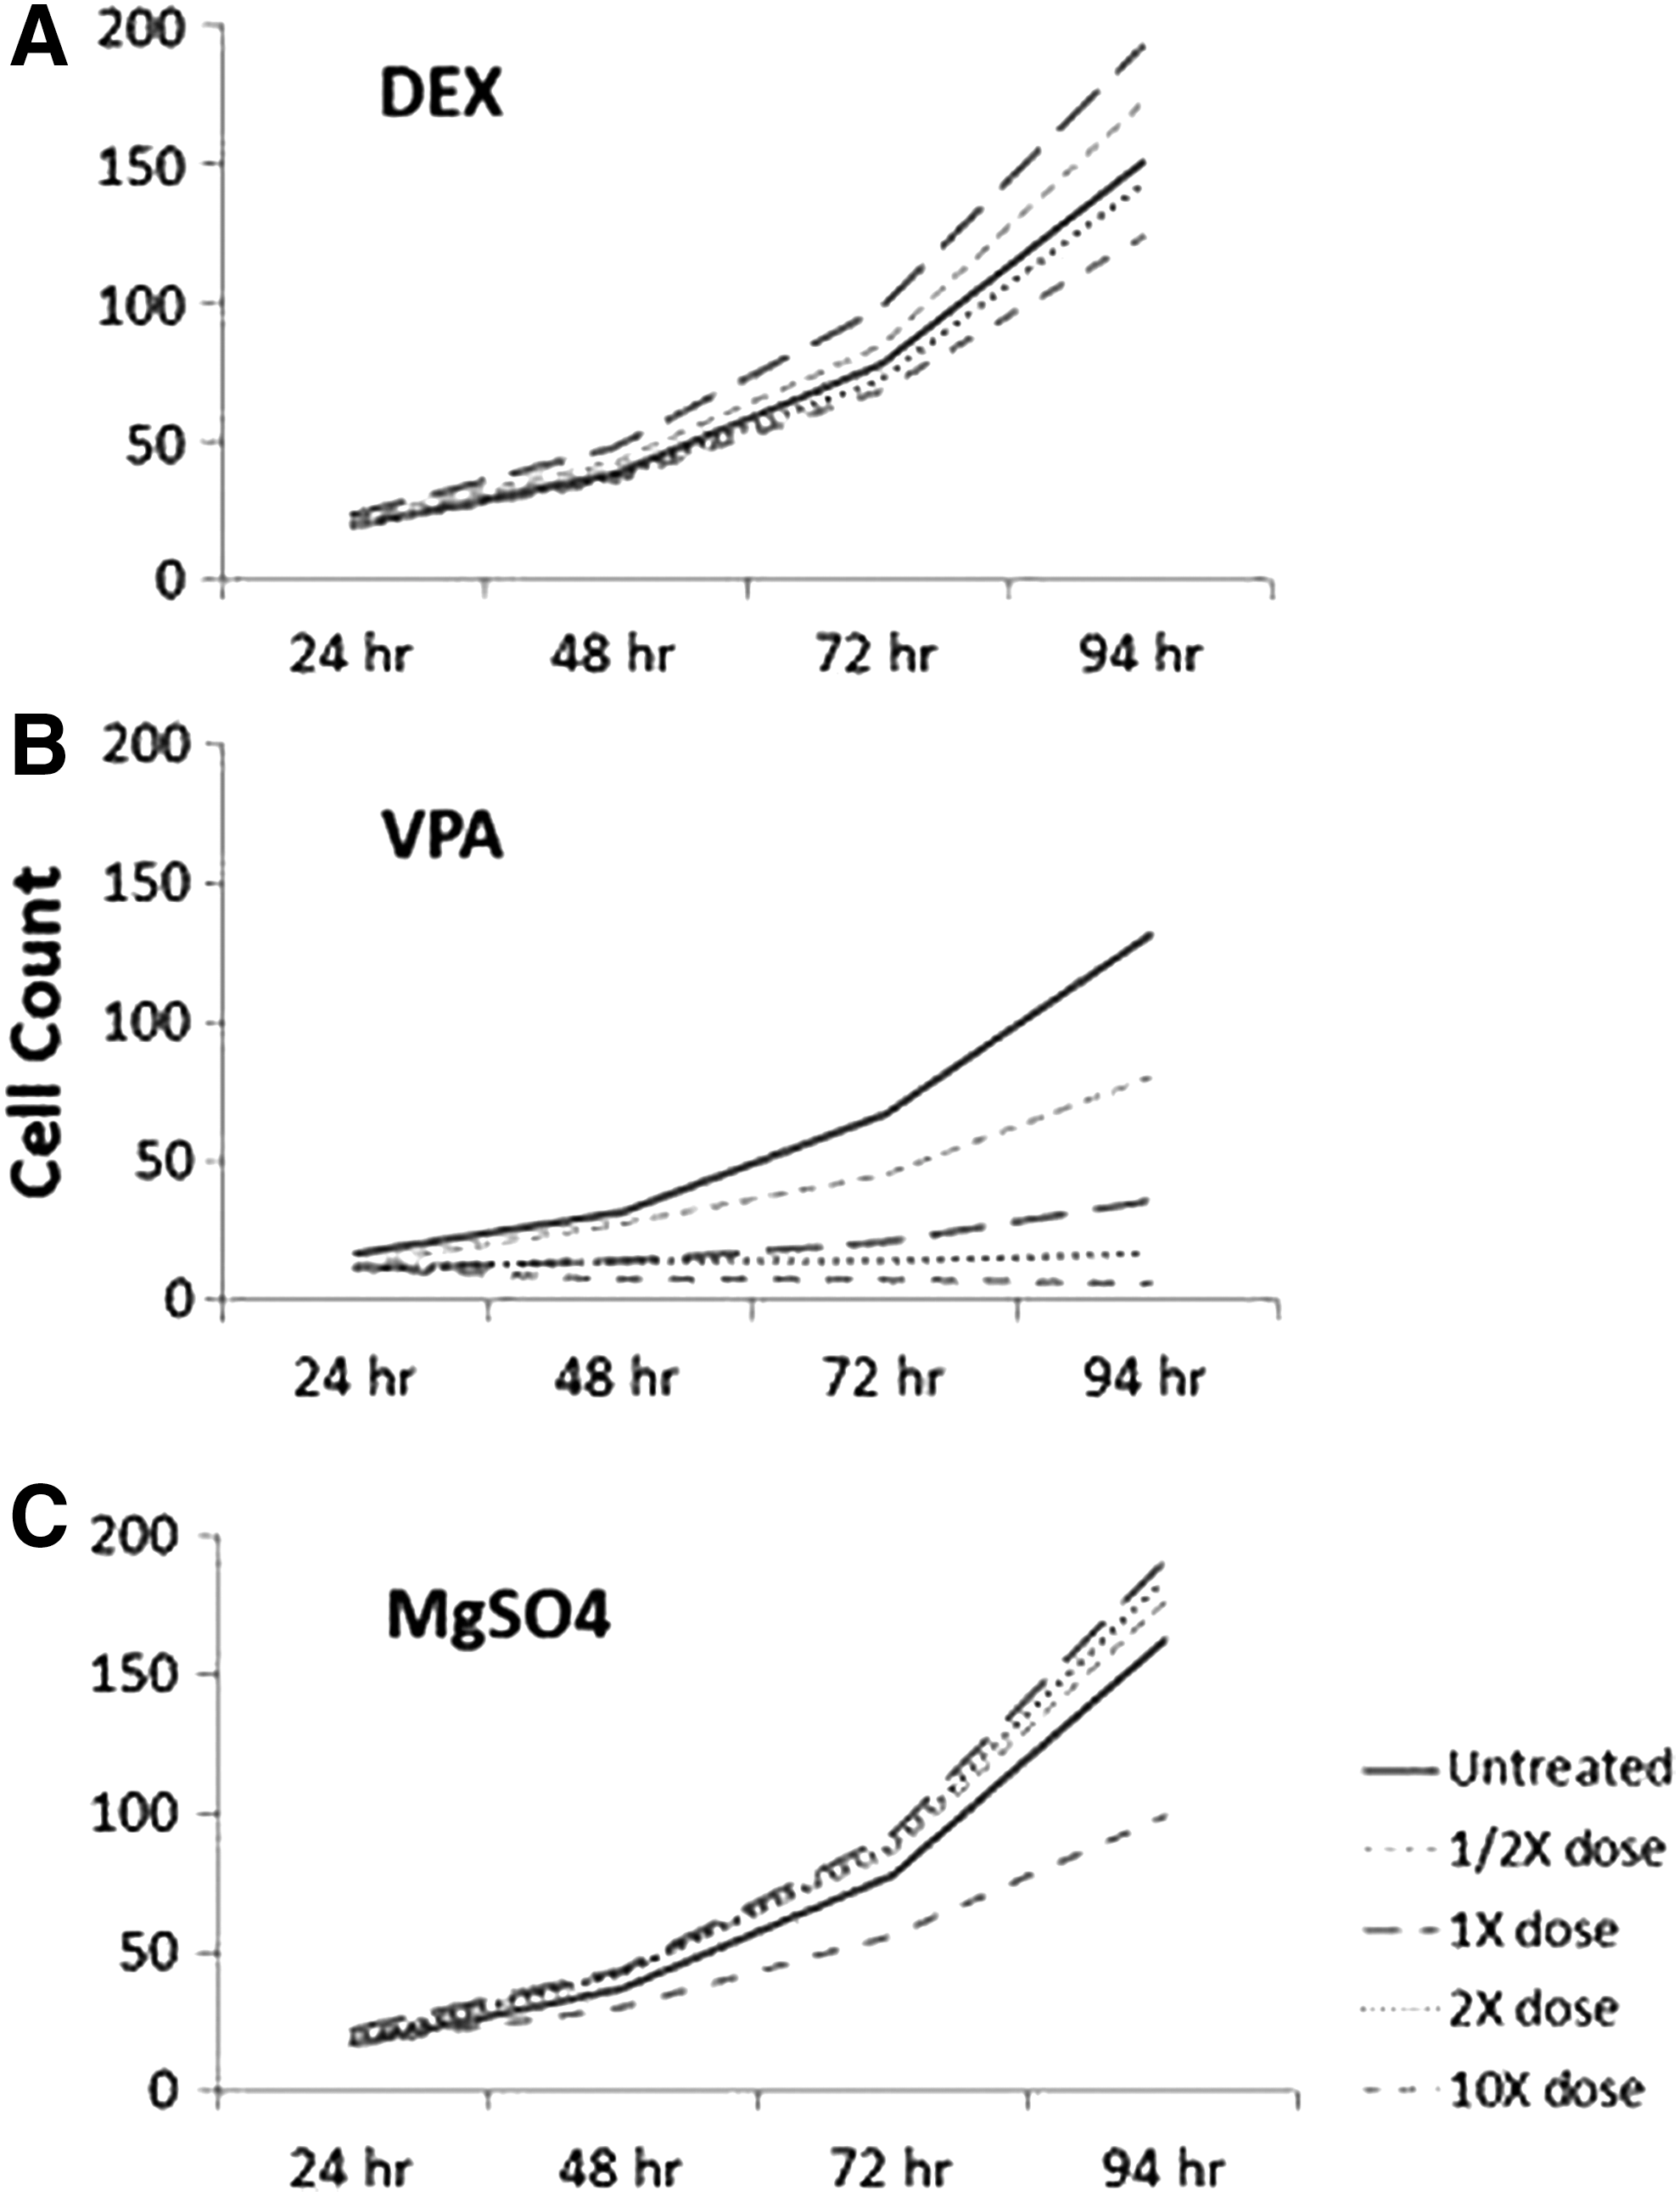
Human AFC proliferation with treatment. This is a representative example (1407C) of the proliferation pattern, which was similar, but not identical, among samples.
Flow cytometry
Cell surface markers examined, including CD90, TRA-1-60, and SSEA-4, were expressed by all untreated and treated samples. Although cell lines were not uniform, expression of multipotent cell markers was similar for each treatment. DEX-treated samples were enriched greatly for CD90 expression and moderately for SSEA4 and TRA-1-60 expression, with an overall increased brightness of 15%.
VPA treatment altered surface marker expression toward double positive expression of both CD90 and SSEA4, with an increased brightness of 36%, at its greatest expression. TRA-1-60 expression was minimally increased. Annexin V expression indicating apoptosis was evaluated and showed an increase from <1% in untreated samples to 2% with VPA treatment.
MgSO4 treatment altered CD90 expression more than SSEA4 expression, with an increase in double positivity of 14%. TRA-1-60 marker expression was only minimally increased as well. Cells lacking any of the three markers were rare. A representative result of sample 1113C phenotype of APC (SSEA4) and PerCP-Cy5.5 (CD 90) marker expression is shown in Fig. 2.

Expression of AFC markers, CD90 and SSEA4 (1113C), through Flow Cytometry. Each figure's uppermost right panel represents +CD90 and +SSEA4.
Osteogenic differentiation
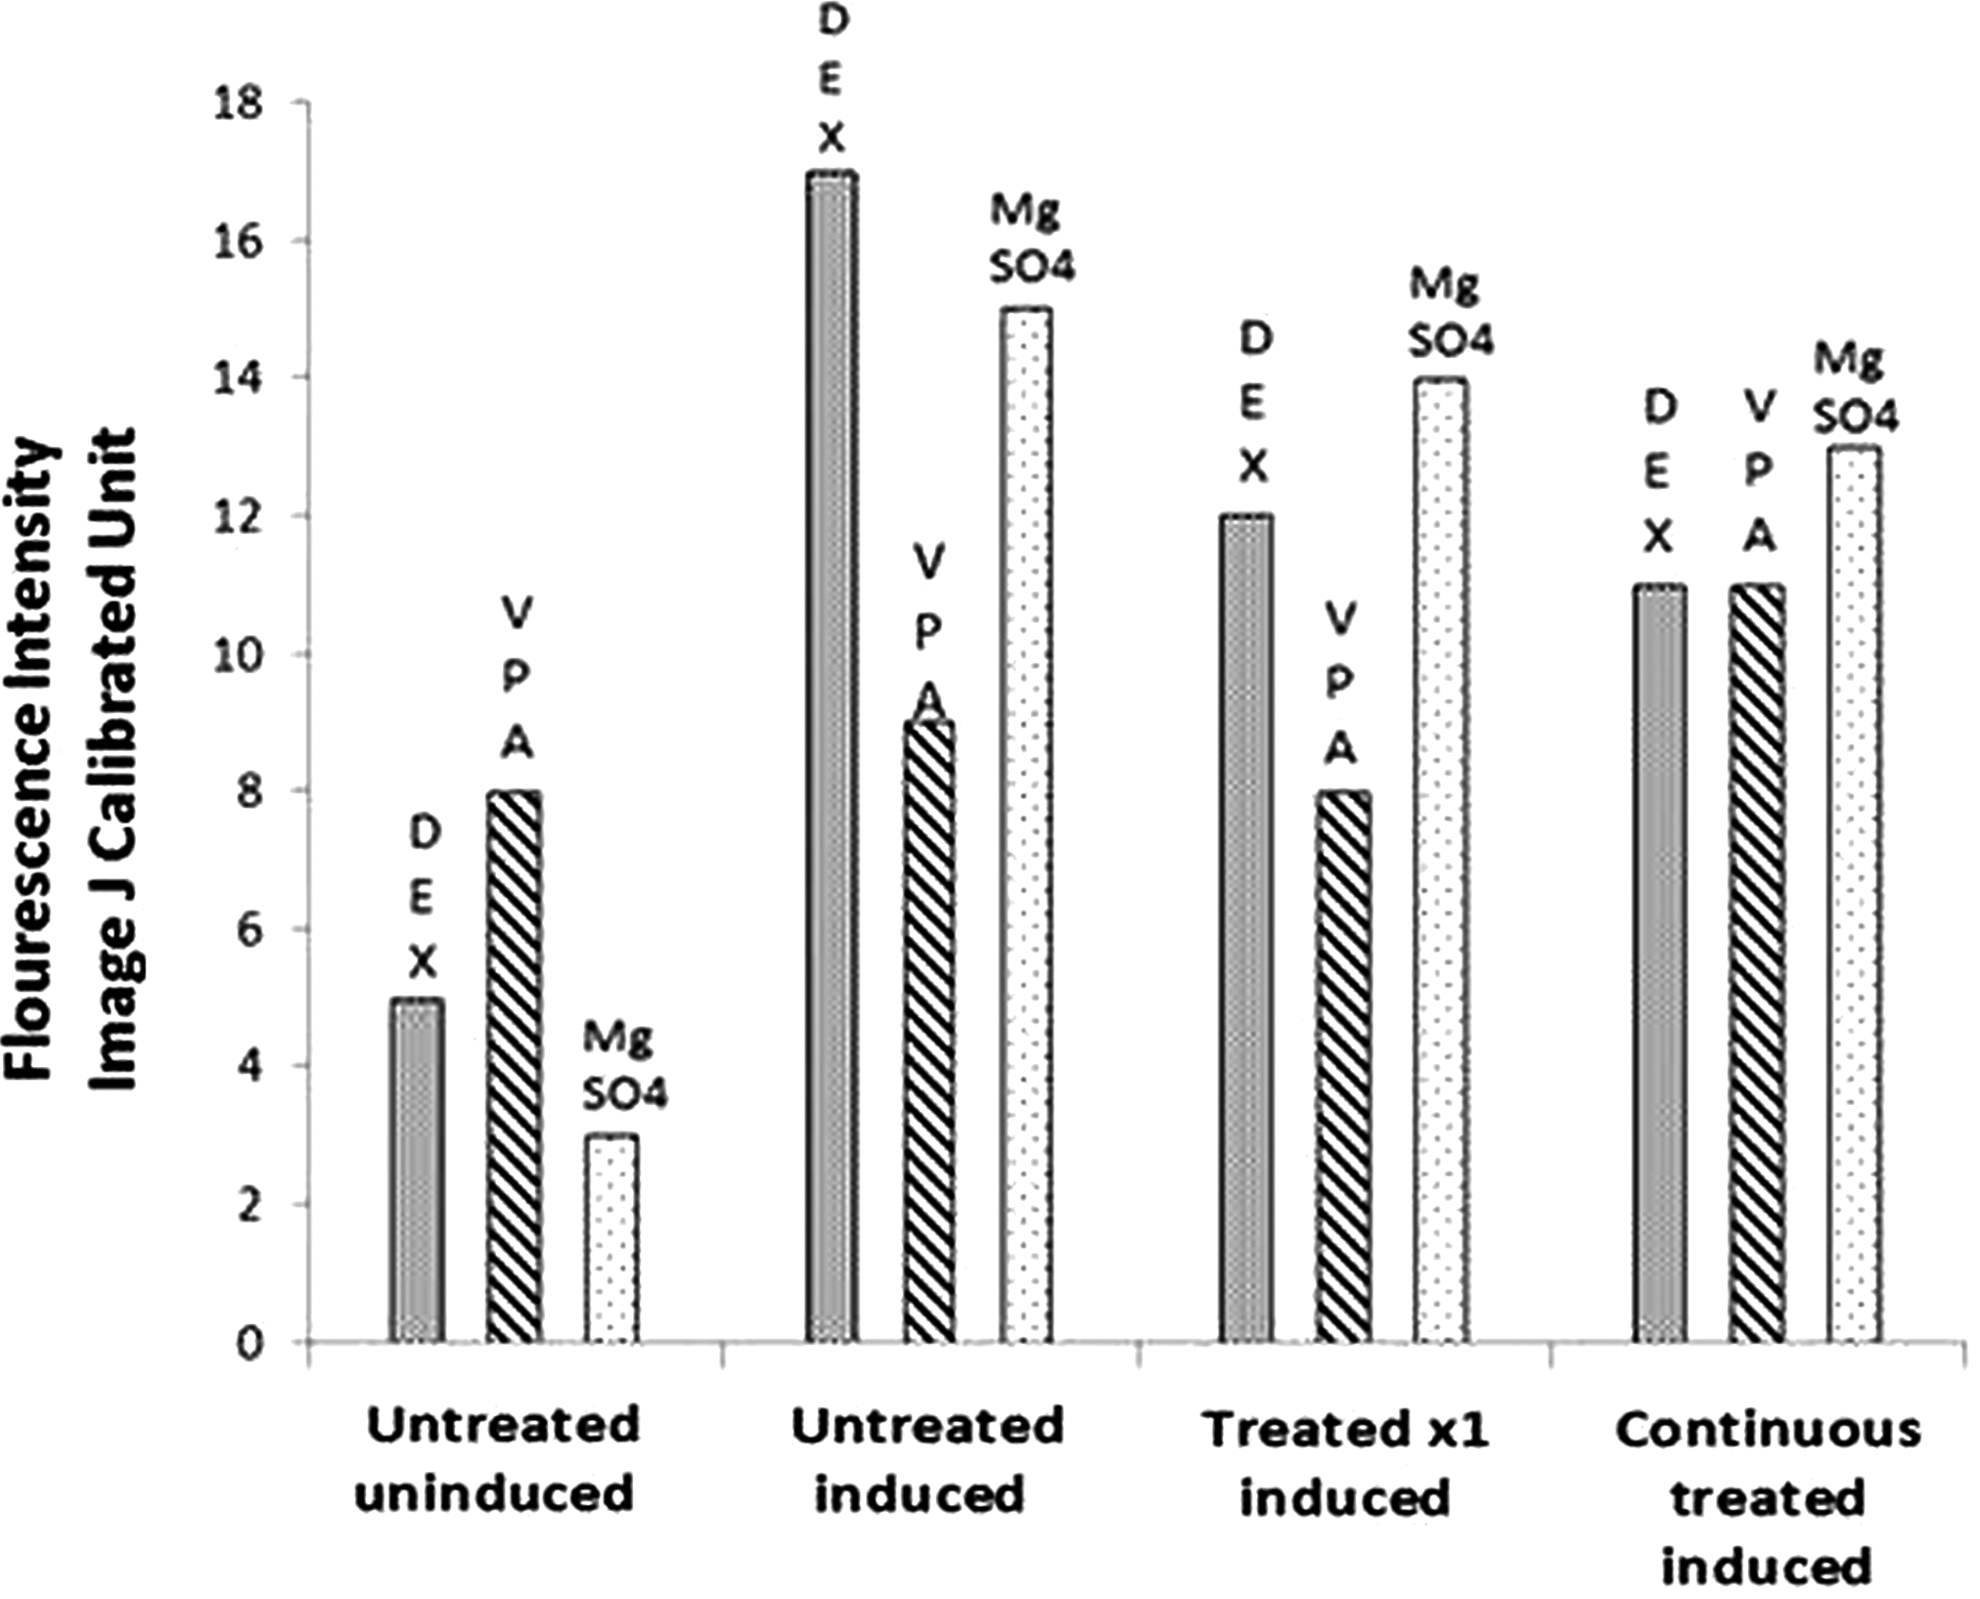
Alizarin Red and alkaline phosphatase staining and visualization under bright-field and phase-contrast microscopy were performed. Studies revealed that continuous DEX treatment induced more strongly than single DEX exposure and untreated induction to osteogenic lineage. Staining also revealed that continuous VPA treatment marginally increased osteogenic induction, while MgSO4 treatment showed little to no effect on osteogenic differentiation.
Quantitative alkaline phosphatase enzymatic assay was performed. An average was used to analyze all samples' response (1113C, 1205C, 1407C) treated with the same pharmacological agent. ImageJ objective analysis of alkaline phosphatase response to induction to osteogenic lineage was performed. DEX induced osteogenic induction variably with strongest response for sample 1113C. VPA again showed moderate response to continuous exposure. MgSO4 showed little to no effect of treatment on osteogenic differentiation (Fig. 3).
Osteogenic differentiation—alkaline phosphatase staining for DEX, VPA, and MgSO4.
Chondrogenic differentiation
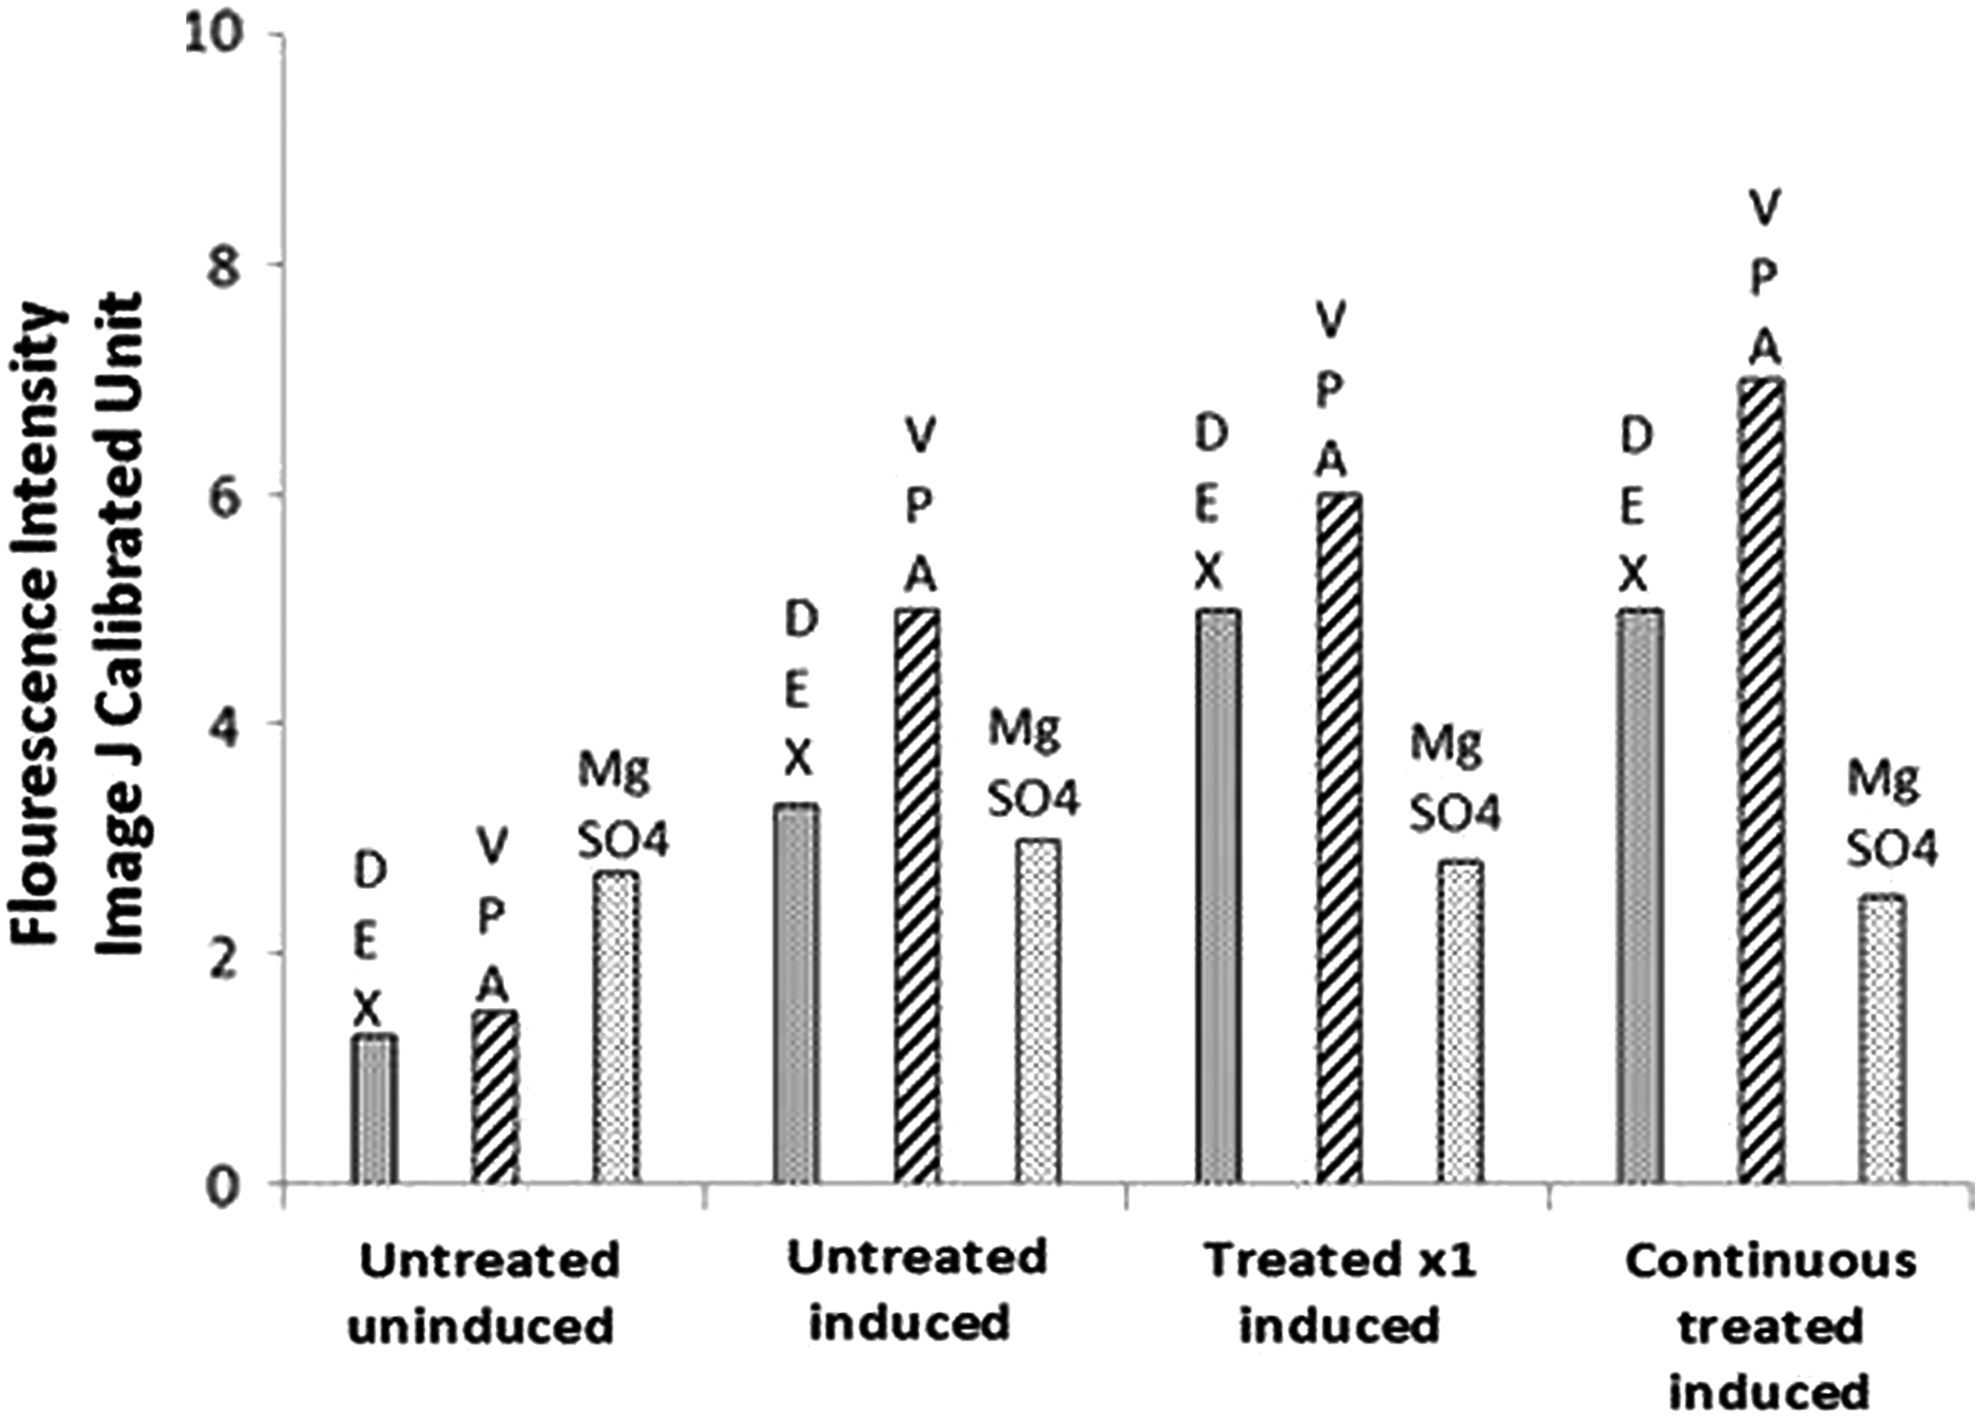
ImageJ objective analysis of Aggregan response to induction to chondrocyte lineage was performed. DEX treatment decreased chondrocyte induction. VPA treatment increased differentiation potential to chondrocyte lineage for both single treatment and continuous treatment. MgSO4 treatment showed no change in differentiation potential. The average of all samples' response is shown in Fig. 4.
Chondrogenic differentiation—Aggrecan staining for DEX, VPA, and MgSO4.
Neural differentiation
As in the other studies, an average was used to analyze all samples' response (1113C, 1205C, 1407C) treated with the same pharmacological agent. ImageJ objective analysis of nestin, tubulin, and GFAP response to induction toward neural lineage was performed (Fig. 5). DEX increased differentiation potential to neural lineage with nestin, tubulin, and GFAP analysis. VPA treatment decreased induction with both single treatment and continuous treatment. MgSO4 treatment had no effect on neural induction. When the cells were exposed to the various agents without induction, there was no difference from the uninduced controls without agent exposure.
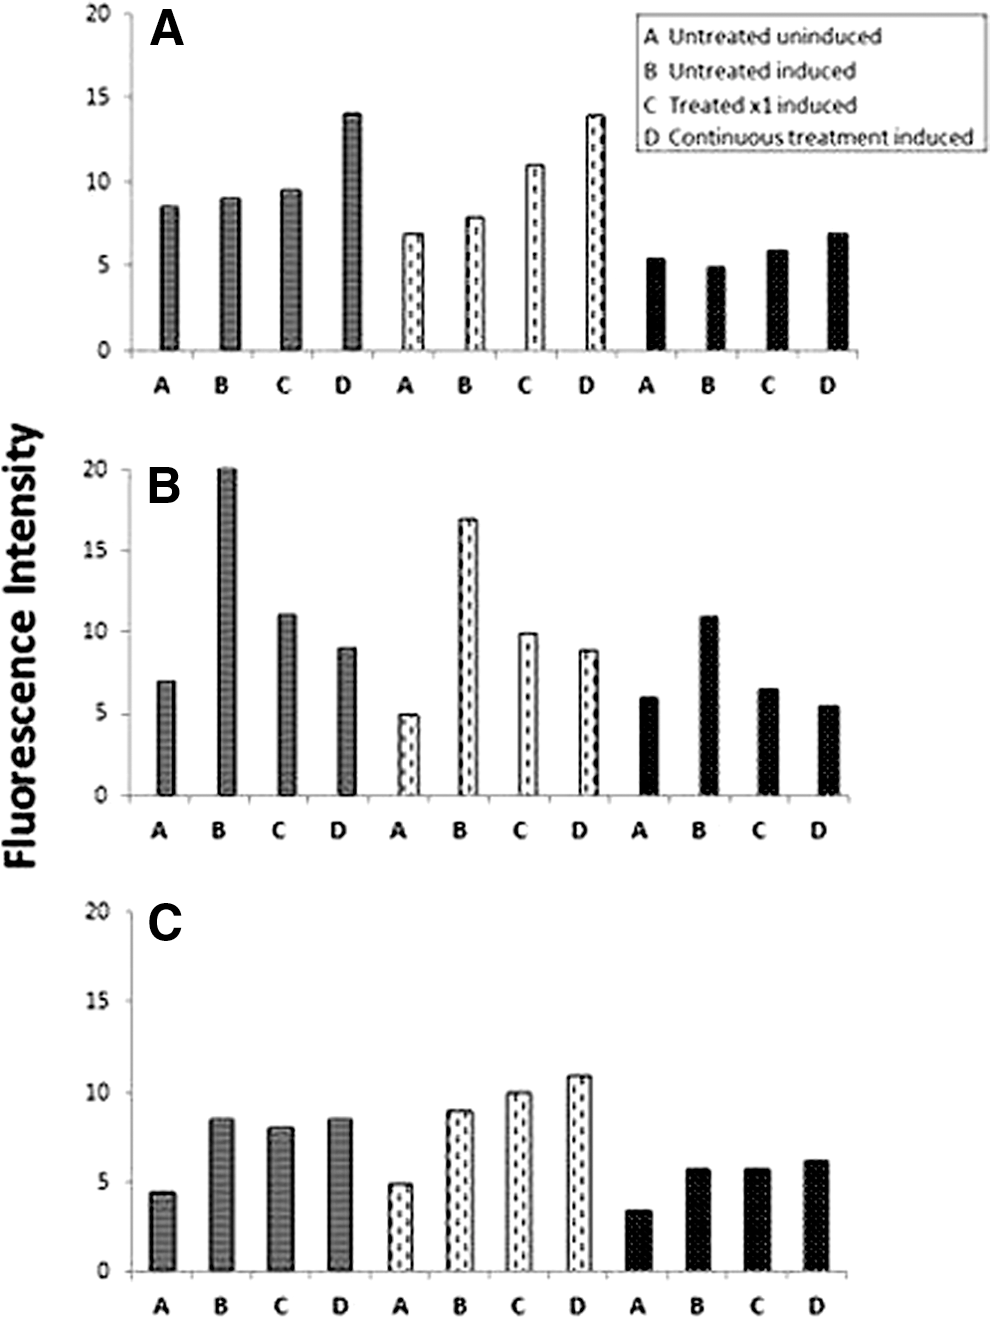
Neural differentiation—Nestin, tubulin, and glial fibrillary acidic protein (GFAP) staining.
Gene expression analysis
VPA and DEX samples were pooled and analyzed for 1113C, 1205C, and 1407C. MgSO4 treatment was not analyzed as proliferation and differentiation studies showed no difference after treatment.
PCA showed clear variation between individual samples as well as between treated and untreated samples (Fig. 6). The majority of variation was seen between treated and untreated samples (vertical axis). Treatment showed a similar magnitude order of response for all three samples.
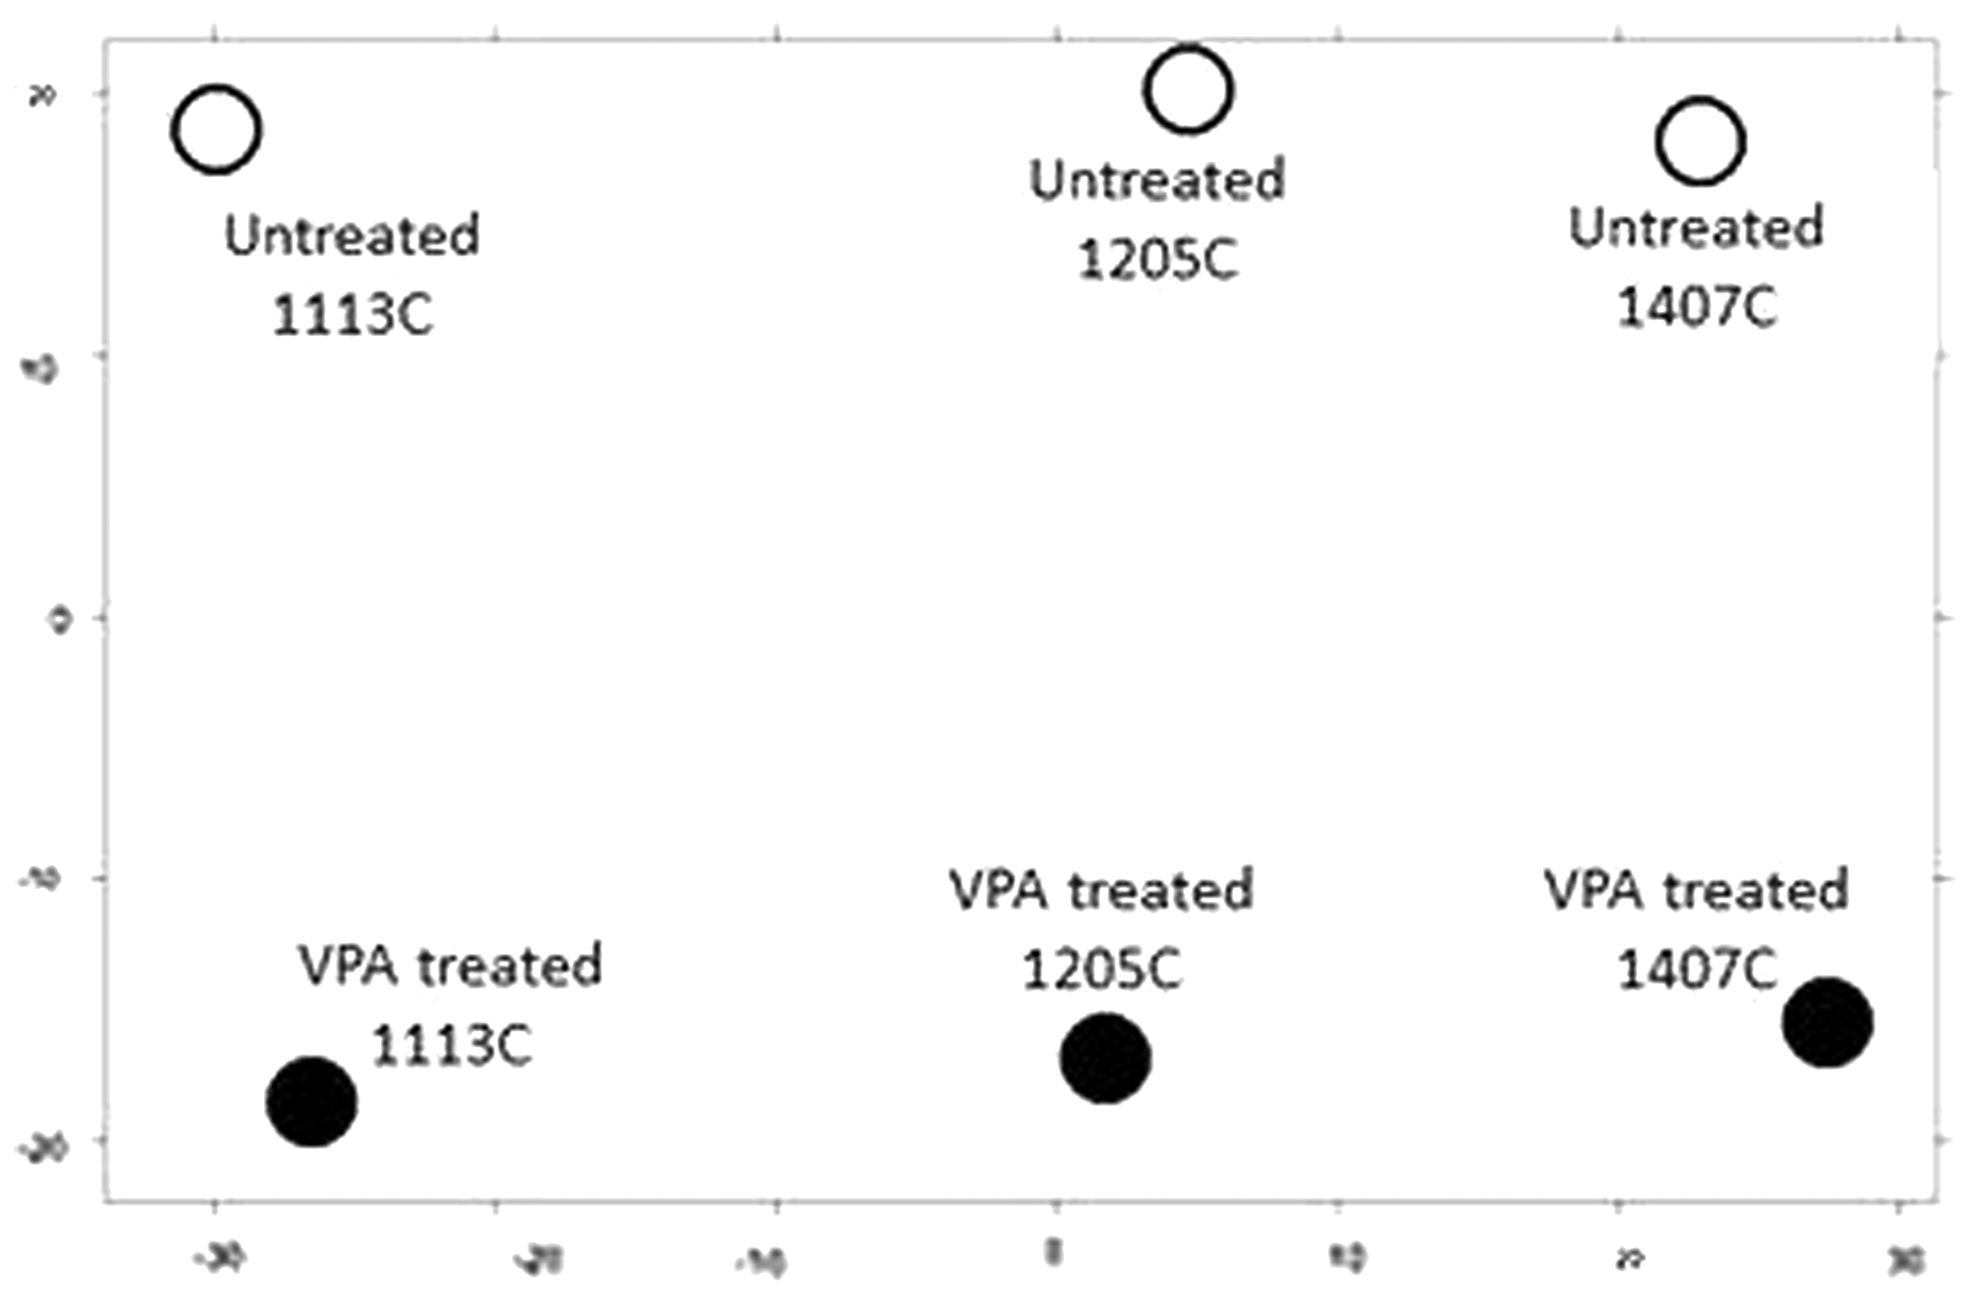
Principal component analysis for untreated and VPA-treated samples.
We sought to identify genes whose expression was altered significantly among the total 1,525 genes of interest analyzed. A total of 181 genes were expressed uniquely by DEX (107 upregulated, 74 downregulated) and 319 genes were uniquely expressed by VPA (56 upregulated, 263 downregulated).
DAVID cluster analysis
Functional annotation clustering was performed and a list of genes generated by similar function. DAVID cluster analysis was performed for each pharmacological agent separately. Gene clusters upregulated by DEX treatment were associated with bone development and growth (Table 1). DEX-treated samples of AFCs showed decreased expression of gene clusters that were associated with regulation of cellular behavior and growth as well as response to hormones for the downregulated gene group (Table 2). Gene clusters upregulated by VPA treatment included glycoprotein-related processes and glycosylation (Table 3). VPA-treated samples showed a decrease in expression of gene clusters associated with cell adhesion and neural function (Table 4).
DAVID, Database for Annotation, Visualization, and Integrated Discovery; DEX, dexamethasone.
VPA, valproic acid.
The genes that were most highly expressed as either up or downregulated by DEX or VPA were selected for functional analysis. DEX treatment caused upregulation of SFTA1P, which is associated with surfactant-associated pseudogene. Functional analysis of VPA genes showed downregulation of neural crest migration (RP11-47J17.1, RP11-419117.1), apoptosis (MIRLET 7A2, BLID), and cell cycle arrest and apoptosis (LINC001152). Other genes significantly downregulated by VPA were associated with optic disc development, neuronal migration, neurogenesis, neuronal apoptosis (DCLK1), angiogenesis, T cells, IL-8, alveolar macrophages, inflammation mediation, and chemoattraction (CXL8).
Ingenuity pathway analysis
Disease and Pathway heat map analysis showed that DEX treatment upregulated cell growth, cell proliferation, formation of bone cells, and secretion of steroid hormones. VPA treatment had an inhibitory effect on genes related to central nervous system development, neuron development, and neural proliferation. VPA treatment upregulated genes responsible for cartilage development.
Canonical pathway analysis for genes in the DEX-exposed group showed an upregulation in glioma invasiveness, an upregulation in cholecystokinin and gastrin-mediated signaling, a significant effect on the role of osteoclasts and chondrocytes, and an upregulation in HMGBI signaling responsible for nucleoprotein assembly and significant regulation of gene transcription. For VPA-exposed cells, canonical pathways showed a decrease in glioma invasiveness. Axonal pathway signaling and netrin proteins, which are involved in axonal guidance, were significantly affected by VPA treatment. LPS (lipopolysaccharide)/IL1 proinflammatory cytokines, which affect neural receptors, also showed significant effect of VPA treatment (Fig. 7).
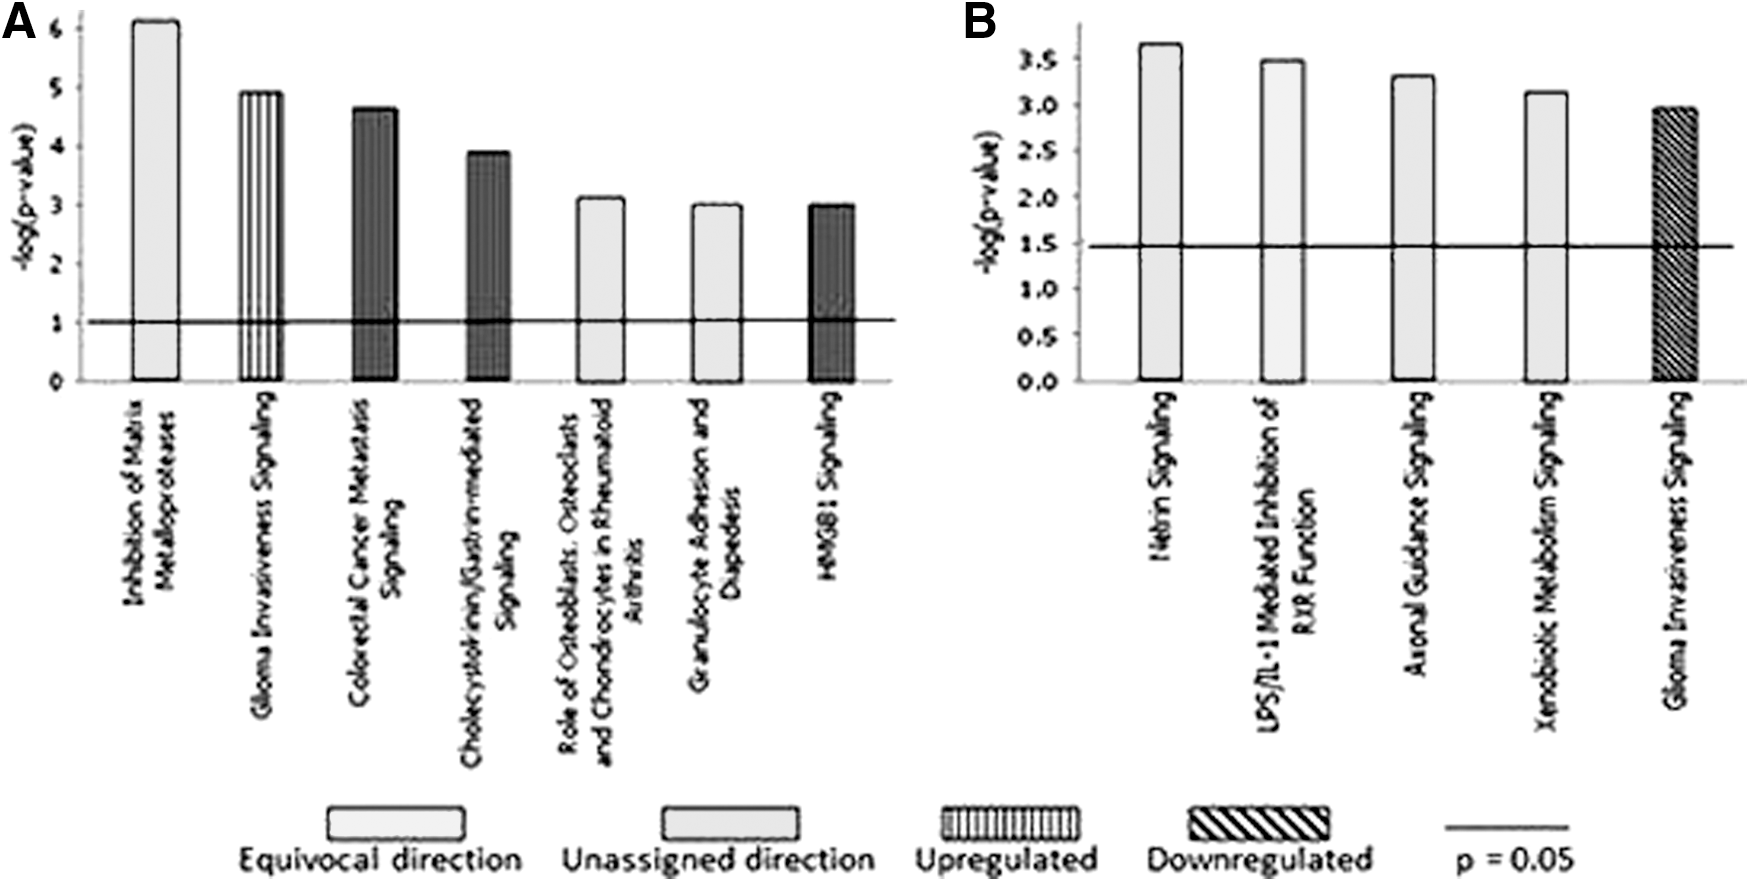
Ingenuity pathway analysis canonical pathways.
IPA revealed 21 significant networks for DEX treatment and 25 significant networks for VPA treatment. The most highly affected network for DEX was the skeletal and muscular function, tissue morphology, and cardiovascular development network. The nexus gene was AKT, responsible for fibroblasts. In the network, cyclooxygenase and prostaglandin synthesis was upregulated, while DNA damage (DDIT4) was downregulated (Table 5). The most highly affected network for VPA involved embryonic and neurological development and centered around its nexus gene TP53. It reflected promotion of birth defects with ANXA3, decreased transcription of genes related to neural tube, ocular, facial, and limb development (TFAP2C), decreased cell proliferation (PRRX2), and decreased neurogenesis (HEY1) (Table 6).
Discussion
Many patients receive pharmacological treatment during pregnancy. However, it is difficult to evaluate teratogenic potential as pregnant women are excluded from clinical studies [31]. Previous reports have shown that addition of VPA to AFC studies alters stem cell pluripotency and molecular expression [21,22]. DEX and MgSO4 have not previously been studied in AFC culture.
Our observations confirmed and extended the previous VPA studies. In addition, both DEX and VPA-treated samples proliferated, differentiated, and expressed genes differently from untreated samples. None of the agents were found to alter cell morphology. DEX treatment enhanced cell proliferation, the splitting of spheroids, and multiplication. We showed that DEX drove induction to osteogenic lineage and neural lineage. In contrast, DEX decreased induction to chondrogenic lineage. Affymetrix analysis showed an increase in SFTA1P surfactant associated pseudogene, which is consistent with DEX induction of pulmonary surfactant in the fetus. Genomic studies confirmed promotion of bone growth, cell development, neural signaling, gastrin signaling, skeletal and muscular system development, cardiovascular development, and steroid secretion. Cell cycle regulation was decreased. Taken together, the data indicate DEX enhancement of cellular growth as well as enhanced neural and bone development in utero.
Analysis of VPA treatment of AFCs in culture revealed alterations consistent with known teratogenic effects. VPA inhibited cell growth at low concentrations and caused cell death at concentrations comparable with doses used clinically. Although osteogenic and chondrogenic lineage induction was not impaired, neurological lineage induction was significantly retarded. VPA treatment decreased gene expression responsible for neurological development, neural cell signaling, cell adhesion, and transcription. However, gene expression data confirmed satisfactory osteogenic and chondrogenic differentiation.
MgSO4 is frequently administered in pregnancy for seizure prophylaxis and fetal neuroprotection, although mechanisms are poorly understood. It has long been believed that it is not harmful to mother or fetus. MgSO4 treatment showed minimal to no effect on morphology, proliferation, and differentiation studies of induction to osteogenic, chondrogenic, and neural lineage. Interestingly, there appeared to be an increase in CD90 expression with MgSO4. Absent any demonstrable biologic effect, this observation needs further study.
While the increase of surfactant gene expression with DEX treatment was expected because it correlates with clinical observations, it was unexpected that there would be decreased chondrogenic activity. Equally unexpected was DEX enhancement of neurological differentiation and promotion of gene expression for genes specific to neural development. These results in culture imply a potential for possible alterations of fetal brain development [32,33]. Further studies on clinical implications of such changes are warranted as there is increasing interest in expanding the use of DEX in pregnancy.
VPA studies reflected inhibition of neural development. As a known teratogen associated with neural tube defects and delay of neural development in neonates exposed to VPA during pregnancy, our data are consistent with clinical findings. Gene expression for neural developmental pathways was downregulated by VPA and fits the adverse clinical profile of VPA as well. In addition, VPA treatment promotion of osteogenic and chondrogenic induction is tempting to associate with the neonatal findings of frontal bone bossing and abnormal facial structural development.
The data observed using human AFCs in culture demonstrate the feasibility of human amniotic fluid-derived multipotent cells as a model for pharmaceutical screening. This method is a supplement to animal or population-based studies for evaluating effects of drugs on human fetal development. Because of differences in animal physiology and necessary exclusion of pregnant women from drug trials, human AFC cultures may provide a highly useful modality for assessing potential fetal hazards from exogenous agents. Using AFCs for evaluating pharmacological agents may accelerate drug development and improve our understanding of human fetal physiology.
Footnotes
Acknowledgments
This research was funded by The William and Linda Haugland Foundation. The authors wish to thank Dr. Steven Shen, Associate Professor, Director of Genomics, Bioinformatics, and Computational Support at the Genome Technology Center, Department of Biochemistry and Molecular Pharmacology, NYU School of Medicine, New York, NY, as well as Lisa Cohen and Igor Dolgalev from the Center for Health Informatics and Bioinformatics, NYU School of Medicine, New York, NY, for their assistance and guidance.
Presentations and abbreviations: Dziadosz M, Chan M, Basch R, Young BK. Dexamethasone Enhances Neural Differentiation of Human Amniotic Fluid Derived Cells in Culture ID O-154 Society for Reproductive Investigation March 19, 2016, NY Obstetrical Society April 12, 2016, NY Perinatal Society April 20, 2016. Dziadosz M, Chan M, Basch R, Young BK. Valproic Acid and Human Amniotic Fluid Derived Cells: A Model for Mechanistic Studies ID 114 Society for Reproductive Investigation March 18, 2016.
Author Disclosure Statement
No competing financial interests exist.