
Abstract
The epigenetic background of pluripotent stem cells can influence transcriptional and functional behavior. Most of these data have been obtained in standard monolayer cell culture systems. In this study, we used exome sequencing, array comparative genomic hybridization (CGH), miRNA array, DNA methylation array, three-dimensional (3D) tissue engineering, and immunostaining to conduct a comparative analysis of two induced pluripotent stem cell (iPSC) lines used in engineering of 3D human epidermal equivalent (HEE), which more closely approximates epidermis. Exome sequencing and array CGH suggested that their genome was stable following 3 months of feeder-free culture. While the miRNAome was also not affected, ≈7% of CpG sites were differently methylated between the two lines. Analysis of the epidermal differentiation complex, a region on chromosome 1 that contains multiple genes involved in skin barrier maturation (including trichohyalin, TCHH), found that in one of the iPSC clones (iKCL004), TCHH retained a DNA methylation signature characteristic of the original somatic cells, whereas in other iPSC line (iKCL011), the TCHH methylation signature matched that of the human embryonic stem cell line KCL034. The difference between the two iPSC clones in TCHH methylation did not have an obvious effect on its expression in 3D HEE, suggesting that differentiation and tissue formation may mitigate variations in the iPSC methylome.
Introduction
R
We reprogrammed human foreskin BJ fibroblasts (HFFs) into iPSC using modified synthetic mRNA. Two iPSC clones, iKCL004 and iKCL011, that we used to build human skin equivalents [human epidermal equivalent (HEE)] with a functional permeability barrier [10] showed subtle differences, which prompted us to investigate in depth the genetic and epigenetic footprint of both lines. Since the focus of our work was keratinocyte differentiation culminating in the stratum corneum derived epidermal permeability barrier, we concentrated on the epidermal differentiation complex (EDC) on chromosome 1, which contains multiple genes involved in epidermal cornification [11 –19]. One of our clinical grade lines, KCL034, was used as a control in most analyses [20].
Materials and Methods
Reprogramming
Human neonatal foreskin fibroblasts BJ (ATCC, CRL-2522) were reprogrammed using modified synthetic mRNA as described [10]. At day 2–17 of reprogramming, some cells also were treated with 1 μM pifithrin-α. Two clones with a similar growth rate, one derived in the absence (iKCL004) and one in the presence of 1 μM pifithrin-α (iKCL011), were further characterized; pluripotency marker expression and differentiation into three germ layers in vitro and in vivo (teratomas) revealed no obvious difference between the lines [10].
Cell culture
Undifferentiated hESC line KCL034 and iPSC lines, iKCL004 and iKCL011, were cultured under standard feeder-free conditions on Matrigel (Becton Dickinson) in mTeSR1 medium (STEMCELL Technologies) under hypoxic (5% O2) conditions. Differentiation into keratinocytes and generation of HEEs were described previously [10]. Transepithelial electrical resistance was measured with epithelial voltohmmeter EVOM (World Precision Instruments) as described [10,21]. Normal human keratinocytes (NHK) were cultured in EpiLife (Life Technologies). Human neonatal foreskin fibroblasts BJ were cultured in Dulbecco's modified Eagle's medium supplemented with 10% fetal bovine serum (Hyclone).
Quantitative reverse transcriptase–polymerase chain reaction
Total RNA was extracted using the RNeasy Mini Kit (QIAGEN) following the manufacturer's instructions. A 20-min DNase I (Qiagen) treatment step was included to eliminate the potential contamination of genomic DNA. cDNA was generated by reverse transcription of total RNA (350 ng) using the RT2 First Strand Kit (Qiagen) following the manufacturer's instruction. The quantitative reverse transcriptase–polymerase chain reaction (qPCR) consisted of 3 μL of cDNA diluted 1:10 in water, 6.25 μL of RT2 Real Time SYBR® Green qPCR Master Mix (Qiagen), and 400 nM of each primer for a final volume of 12.5 μL. qPCR cycling conditions were as follows: one cycle 95°C for 10 min; 40 cycles 95°C for 15 s, 61°C for 30 s followed by melt curve acquisition from 59°C to 95°C with 0.5°C increment. The BAX (Fw: CGGGTTGTCGCCCTTTTCTA; Rv: CGGGGATTGATCAGACACGTA) and p21 (Fw: GC ACTTTGATTAGCAGCGGA; Rv: AAGACAACTACTCCCAGCCC) primers were designed using Primer3 software. The GAPDH and ACTB primers were from PrimerDesign Ltd. All samples were analyzed in triplicate, Ct values were determined, and the expression was calculated by the 2−ΔΔCt method. GAPDH and ACTB were used for internal normalization.
Array comparative genomic hybridization
Array comparative genomic hybridization (CGH) was performed following strict protocols for each of the different steps as provided by the manufacturers of the reagents. CGH Labeling Kit (Enzo Life Sciences) was used to label 1 μg DNA. Post labeling, DNA was purified with QIAquick PCR Purification Kit (Qiagen). Labeling efficiency and yield were assessed by spectrophotometry (NanoDrop). For hybridization, washing, and scanning of arrays, we used an Agilent 4 × 44K platform. Image quantification, array quality control (QC), and aberration detection were performed using feature extraction and DNA Analytics software packages (Agilent); 95% of array data were required to pass QC. The ADM-2 algorithm at threshold 6 (with a three-probe sliding window providing a mean detection interval of 200 kb) was used for aberration calling.
Exome sequencing
Exome sequencing was undertaken using genomic DNA extracted from BJ parental fibroblasts before and after reprogramming (two clones: iKCL004 and iKCL011). Libraries were prepared using the SureSelect Human All Exon Capture v4 (Agilent) and sequenced with 100-bp paired end reads on the HiSeq platform (Illumina).
The resulting sequence reads were aligned to the reference genome (hg19) with NovoAlign (Novocraft Technologies). Duplicate reads, resulting from PCR clonality or optical duplicates, and reads mapped to multiple locations were excluded from downstream analysis. Single-nucleotide substitutions and small insertions or deletions were identified and quality filtered within the SAMtools software package and in-house software tools. Variants were annotated with respect to genes and transcripts with the ANNOVAR tool.
To identify differentially arising new mutations, we undertook a series of pairwise comparisons with the VarScan 2 tool. Comparison was limited to protein coding regions and associated splice sites of genes defined by the GENCODE project and sites at which >20 reads were observed in all three samples (∼90% of the targeted exome).
The resulting differentially called variants were filtered with the following criteria to retain high quality changes; presence of the new allele in >20% of reads in the sample in which the variant was identified, absence of any reads representing the alternative allele in the other two samples. Variants located within repeat elements or segmentally duplicated regions were excluded as likely alignment artifacts. The sequence alignments spanning each candidate variant were checked manually using the Integrative Genomics Viewer 2.3.
miRNA expression analysis
miRNA expression was evaluated in biological triplicates of undifferentiated hESC and iPSC using TaqMan Array MicroRNA Cards (Panel A and Panel B; Applied Biosystems). The cards contain primer sets for 736 human miRNA sequences (667 unique miRNAs), two sequences from Arabidopsis, eight measurements of MammU6, and 22 RNU sequences.
The cell samples were collected in 200 μL of total volume of lysis buffer. MicroRNA isolation and purification were conducted through the TaqMan miRNA ABC (Anti-miRNA Bead Capture) Purification Kit (Applied Biosystems). This system is designed for rapid and specific purification of human miRNAs. The Human Panel A or Panel B v3.0 Beads are superparamagnetic Dynabeads® covalently bound to a unique set of 377 anti-miRNA oligonucleotides for each panel. The miRNA isolation relies on hybridization of endogenous miRNAs to the corresponding anti-miRNA oligonucleotides attached to the beads. The purification protocol was followed according to the manufacturers' instructions. The bead hybridization and the miRNA elution steps were conducted on the Thermomixer® R (Eppendorf). All the washing steps were performed through the DynaMag™-2 magnet (Applied Biosystems), to clear up the solution from DNA, proteins, contaminants, and residual binding solution, while keeping the miRNAs bound to the beads. MicroRNAs were eluted in 20 μL of final volume, to concentrate them in the smallest possible volume. The cDNA was then generated using the specific Megaplex RT Primer pools A and B v3.0 (Applied Biosystems), which include 377 primer sets for each specific miRNA isolated in the previous step, according to the manufacturer protocol. Preamplification was performed according to manufacturer instructions and protocol using the specific Megaplex PreAmp Primer pools A and B v3.0 (Applied Biosystems). Briefly, 25 μL of preamplification products were added to 425 μL nuclease-free water and mixed with 450 μL TaqMan Universal Master Mix II, No UNG, then dispensed into the 384 wells by centrifugation on a Heraeus Megafuge 40 (Thermo Scientific) with the proper TaqMan Low Density Arrays card adapters. The reactions were incubated in a 384-well plate at 95°C for 10 min followed by 40 cycles of 95°C for 15 s and at 60°C for 1 min on a ViiA™ 7 Real-Time PCR System (Applied Biosystems).
Raw data were analyzed using SDS software (Applied Biosystems), and Ct values were used as a readout. Manual inspection of all amplification plots was performed and miRNAs were excluded from the analysis if: Ct values were too high (above 35, indicating a miRNA expression too low for accurate detection) or if amplification was not achieved in at least two samples (biological replicates). Data were processed through the RealTime StatMiner 5.0 software (Integromics).
Presence/absence indicators were compared among groups through a logistic mixed model, with a slide specific intercept to capture any overdispersion. The P-values arising from Wald tests on the group indicator coefficients were then adjusted using Benjamini–Hochberg (BH) correction. The global false discovery rate (FDR) was guaranteed below the rate of 5%. We then proceeded to compare expression levels after Loess normalization as this normalization approach has been shown to effectively reduce standard deviations, increase sensitivity and improve accuracy of differential miRNA expression detection, and increase interplatform concordance [22]. Once again we controlled for multiplicity using BH correction. Effect sizes of miRNAs relative concentration were measured by means of fold changes. Pearson's correlation was used to generate a heatmap for intragroup correlation plot among all biological samples.
Hierarchical clustering analysis exploiting complete linkage clustering method and Euclidean distance similarity measure was performed on fold changes using KCL034 cell lines as a calibrator to compare similarity of miRNA expression profile between iPSC and hESC lines. A Volcano plot was generated using significance versus fold change on the y- and x-axes, respectively.
Whole epigenome methylation array
Epigenome-wide methylation (>480,000 CpG sites) was analyzed using Infinium Human Methylation 450 BeadChip Kit (Illumina) in biological triplicates of 500 ng bisulfite treated DNA for each: BJ parental fibroblasts (negative control), KCL034 (positive control), iKCL004, and iKCL011 line. GenoSplice Technology performed QC of the data, their processing, and further analyses. Microarray data have been deposited in the NCBI Gene Expression Omnibus (GEO) with the accession number GSE55006.
Whole genome gene-expression array
Total RNA from undifferentiated hESC and iPSC, as well as control primary (NHK) and hESC/iPSC-differentiated keratinocytes (NHK), was reverse transcribed into cDNA using SuperScript III Reverse Transcriptase (Life Technologies). A total amount of 750 ng of biotin-labeled aRNA in a 5 μL volume was then used for HumanHT-12 Expression BeadChip whole-genome gene expression direct hybridization assay system (Illumina) according to manufacturer's instructions, run on iScan system (Illumina) and analyzed as described [10]. All samples were analyzed as biological replicates from three independent experiments. Microarray data have been deposited in the NCBI GEO with the accession number GSE55898.
Immunostaining
Immunostaining has been performed as previously described [23,24]. The following antibodies were used: rabbit anti-KRT14 (Covance), -Oct4 (Santa Cruz Biotechnology), -Sox2 (GeneTex), -LCE2B (Bioss), -p63 (Abcam), mouse anti-cMyc (Santa Cruz Biotechnology), -Klf4 (ATGen), -TCHH (ImmuQuest), and goat anti-LIN28 (R&D Systems). Secondary antibodies were purchased from Jackson ImmunoResearch. Actin stress fibers were visualized with rhodamine-conjugated phalloidin and DNA with a nuclear stain Hoechst 33342, both from Life Technologies.
Results
Reprogramming had no effect on mutation rate and genomic stability of iKCL004 and iKCL011 lines
We first reprogrammed HFFs using synthetic modified mRNA and following a modified version of the protocol originally described by Warren et al. [25]. mRNA transfection efficiency was on average >75% (Fig. 1A, B). We increased the B18R concentration from 200 to 300 ng/mL to further suppress the innate immune response triggered with the exogenous mRNA cocktail. We also added B18R to the medium 4 h prior the first transfection to precondition the cells. Regardless, a regime of daily transfection had a deleterious effect on the cells; the vast majority did not survive (Fig. 1C). At day 4 of reprogramming, we assessed the inhibitory effect of pifithrin-α on p53-mediated transcription using qPCR. Transcription of two p53 target genes BAX and CDKN1A (known as p21) was elevated > sixfold in cells subjected to daily mRNA transfections, suggesting that p53 activation is induced by reprogramming itself. Pifithrin-α treated cells had reduced levels of BAX, but no effect on p21 transcription was observed (Fig. 1D). Daily mRNA transfections caused massive cell death in both conditions, although cell survival seemed to be somewhat higher in the presence of pifithrin-α. Although reprogramming efficiency was about 30% higher in the presence of 1 μM pifithrin-α (0.86% vs. 0.66%), in our hands, it was still lower than the reprogramming efficiency reported by Warren et al. [25] regardless of the p53 inhibition (Fig. 1E).
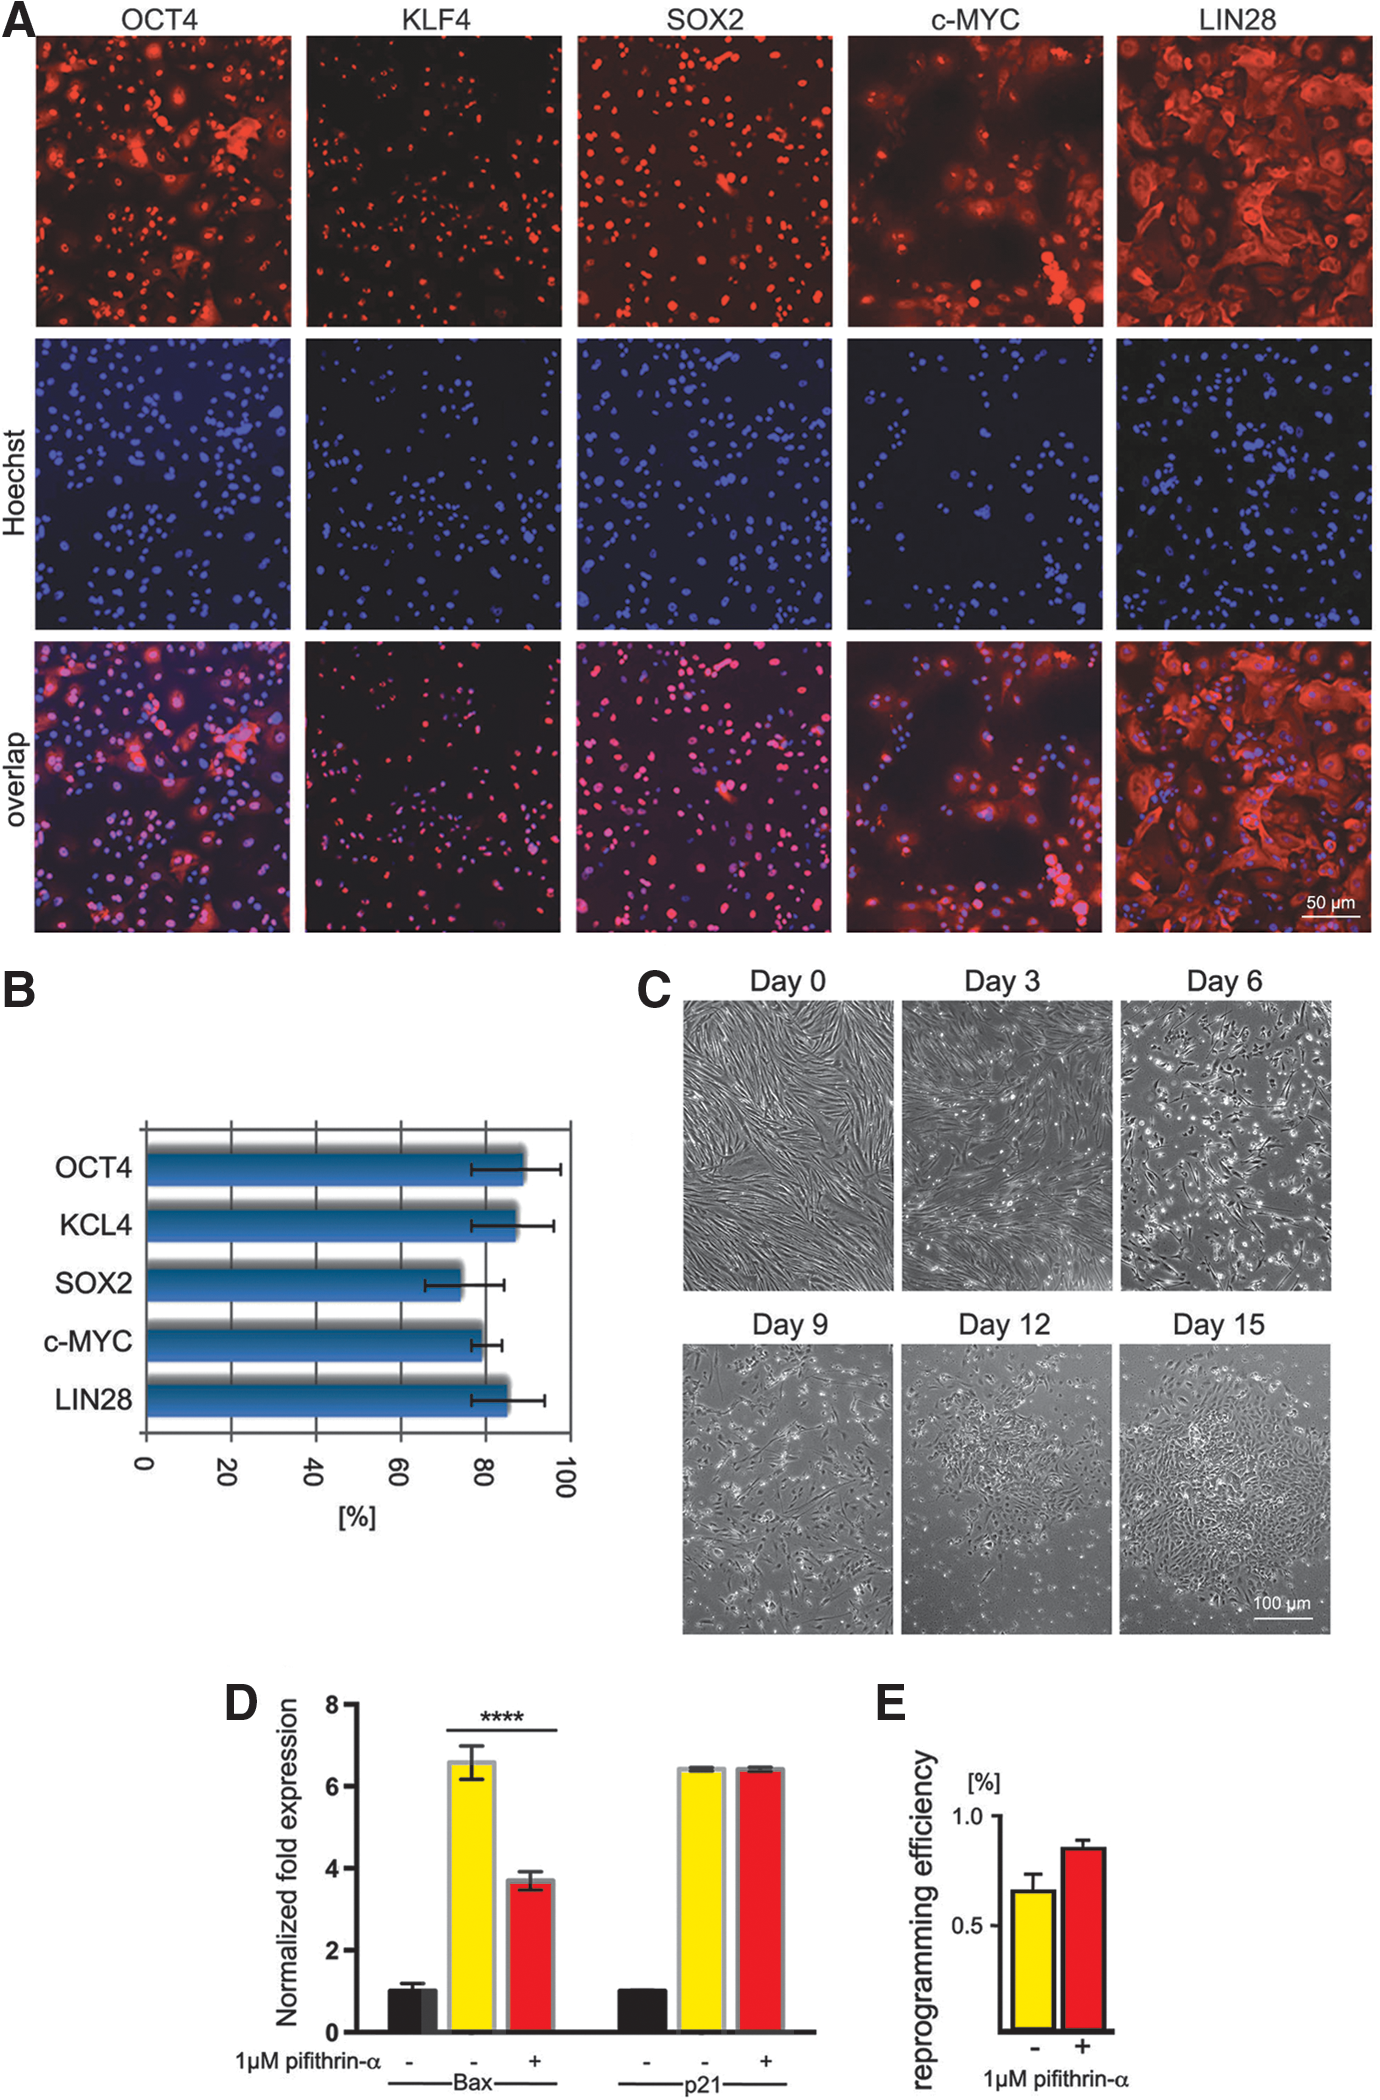
Reprogramming HFFs using synthetic modified mRNA.
Harsh conditions in cell culture might result in survival of clones that carry growth-promoting mutation(s) associated with tumorigenesis. To assess the genomic integrity of our lines, we subjected iKCL004 and iKCL011 to array CGH at two different time points, one at early passages (<10) and the other about 3 months after the lines were adapted to the feeder-free culture. Even though it is widely known that extended periods of cell culture under feeder-free conditions are linked to higher rates of chromosomal abnormalities in pluripotent stem cells, especially iPSC [8,9], we did not detect any copy number changes using array CGH in either iKCL004 or iKCL011 over 3 months of culture on Matrigel in mTeSR1 medium [10], suggesting that the genome of both lines is relatively stable. Next, we subjected iKCL004, iKCL011, and parental BJ fibroblast to exome sequencing. The comparative analysis did not identify any alleles that had arisen during the reprogramming, which suggested that the rate of mutation was not substantially affected during reprogramming of BJ fibroblasts.
miRNAome is similar in both iPSC lines
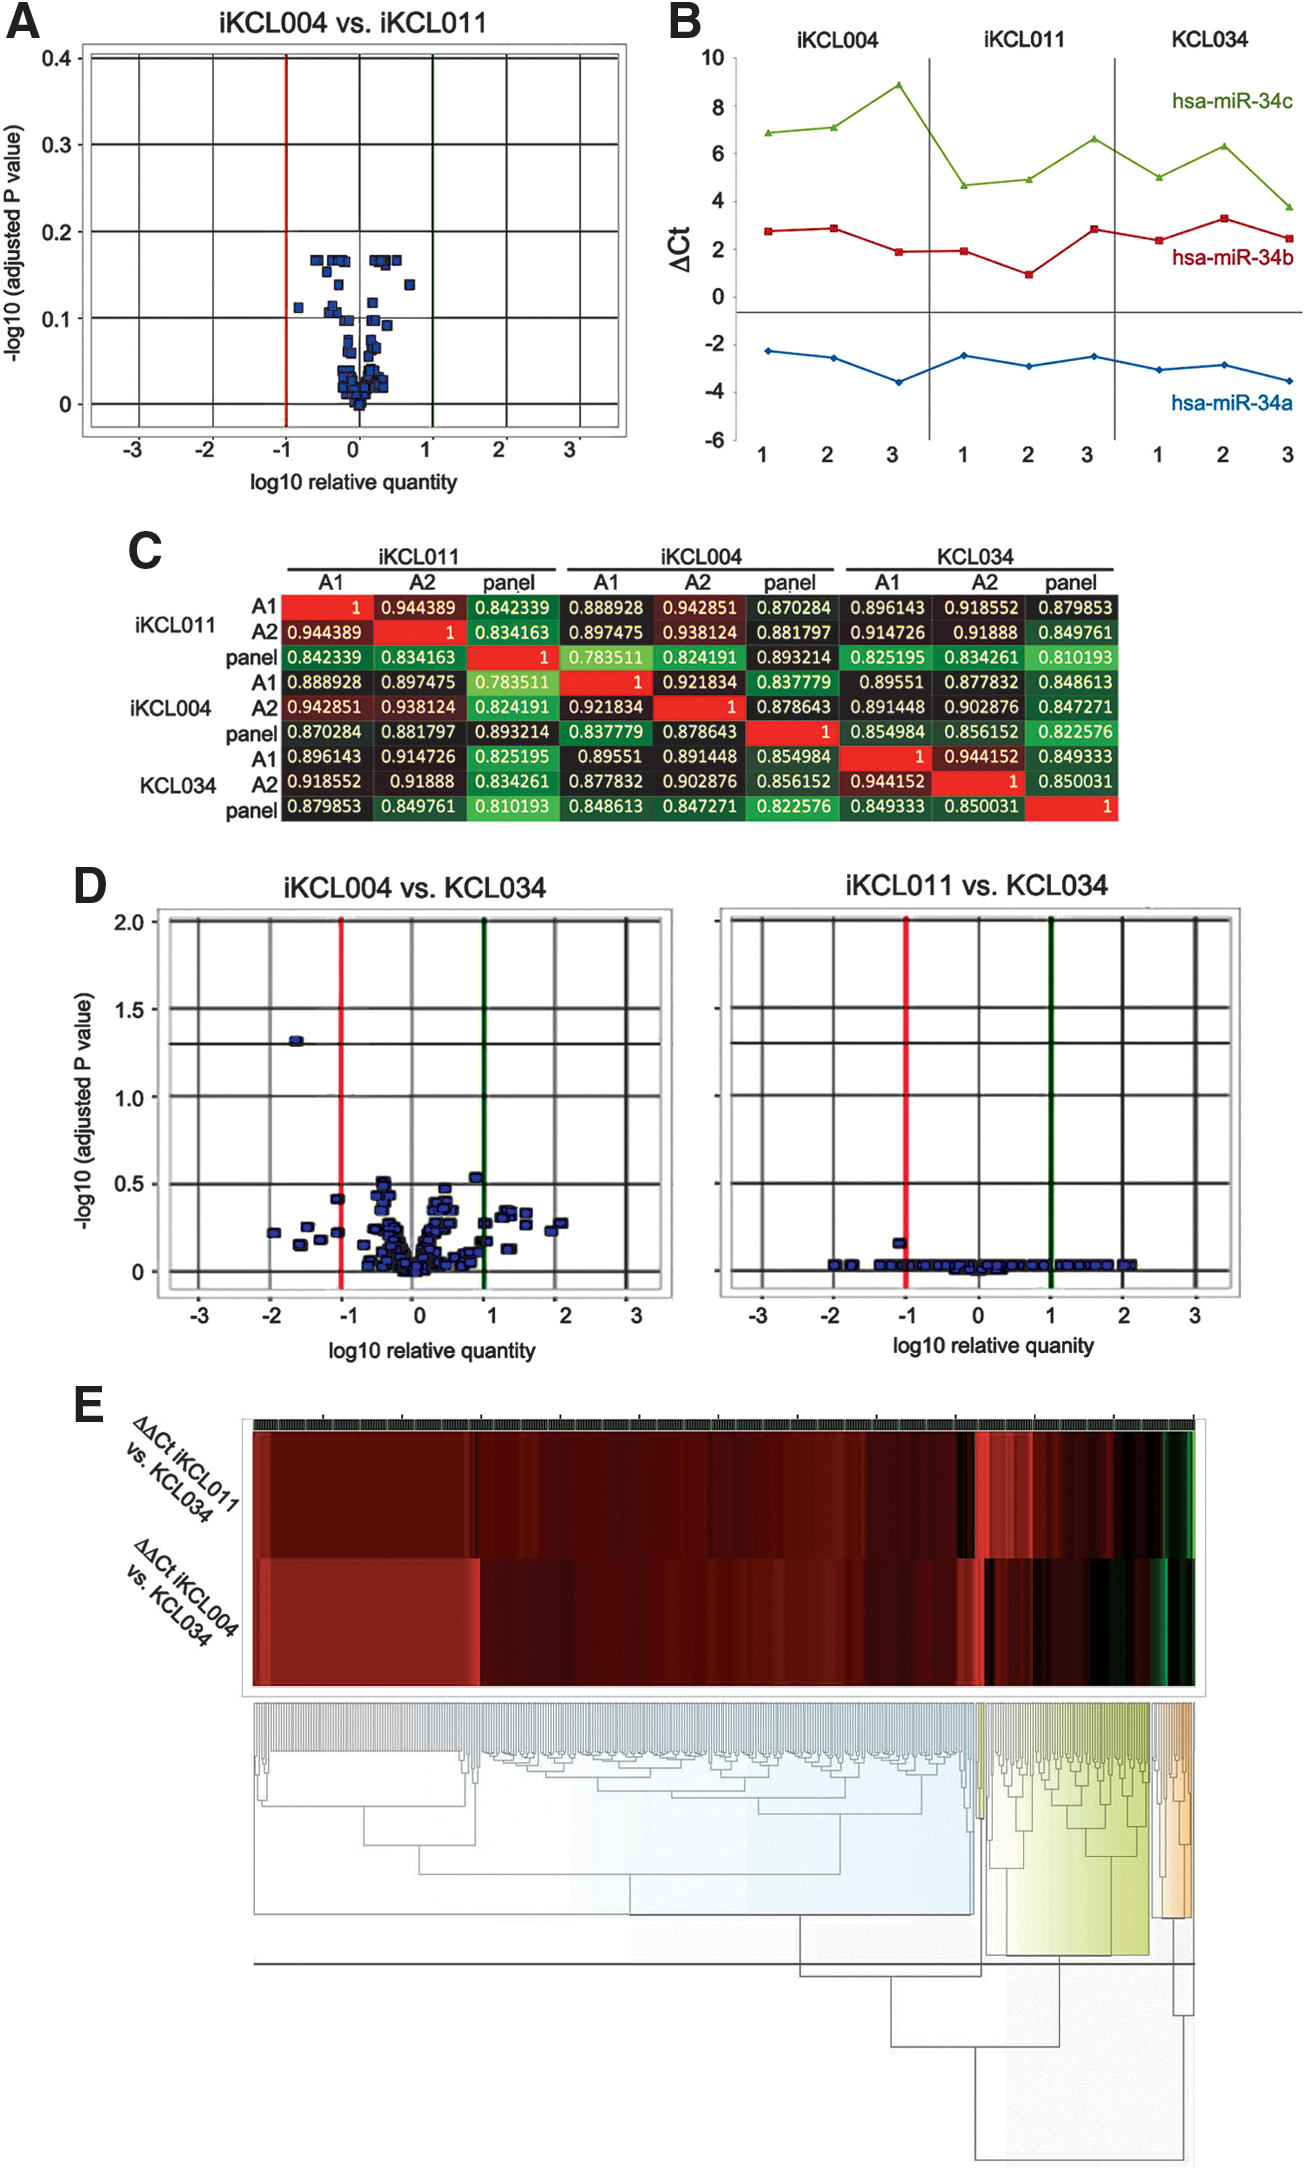
Recently, it has been demonstrated that miRNAs can contribute to iPSC somatic donor memory [26]. Therefore, we evaluated miRNA expression in biological triplicates of iKCL004 and iKCL011 using TaqMan Array MicroRNA Cards containing primer sets for 736 human miRNA sequences. This miRNA profiling technology is a medium throughput approach that holds the advantage of high accuracy thanks to the use of single assay TaqMan chemistry [27]. After filtering, as described in “Materials and Methods” section, and Loess-based normalization, we compared 383 miRNA expressed in iKCL004 and iKCL011. We found that the average fold change was 0.9998, with a confidence interval 0.995–1.004, P = 0.702. Kendall's Tau rank correlation coefficient was 0.860, P < 0.0001 (if the two rankings are the same, the value is 1 and if they are completely independent, the value is 0). No miRNA was flagged as differentially expressed after multiplicity correction with Benjamini–Hochberg FDR method at the 5% level (Fig. 2A).
hESC/iPSC miRNA profiling.
Considering that even minimal cellular variation of miRNA concentration can be biologically significant, we next repeated every single miRNA analysis at the 10% and 20% levels, which are less stringent. Even with these larger values for the Type I error, no miRNA was selected as statistically significant in any analysis.
We then analyzed the relative expression miRNA profiles of iKCL004 and iKCL011 against the hESC line KCL034 to see if one of the two iPSC lines was more similar to hESC. Pearson's correlation showed high similarity between all cell samples analyzed (>0.78; Fig. 2B). No significance was found between miRNA signature of KCL034 compared with iKCL011 and iKCL004 (Fig. 2C, E).
iKCL004 and iKCL011 have a different methylation signature
During reprogramming, to acquire pluripotency potential, the DNA of somatic cells undergoes a global epigenetic transformation. Variability of methylation in iPSC lines very often influences the molecular and functional properties of iPSC lines [2,7,28]. Although epigenome-wide methylation analysis suggested that both iKCL004 and iKCL011 display the methylation signature of pluripotent stem cells [10], about 7% of CpG sites (35,550 out of >480,000) were differentially methylated (difference >0.2) between iKCL004 and iKCL011, suggesting that these iPSC lines are likely to harbor spots of aberrant epigenetic reprogramming (Fig. 3A, B). Although the differences in DNA methylation signature appeared to have no effect on miRNA expression profile (Fig. 2), they may influence the differentiation propensity of these two iPSC lines.
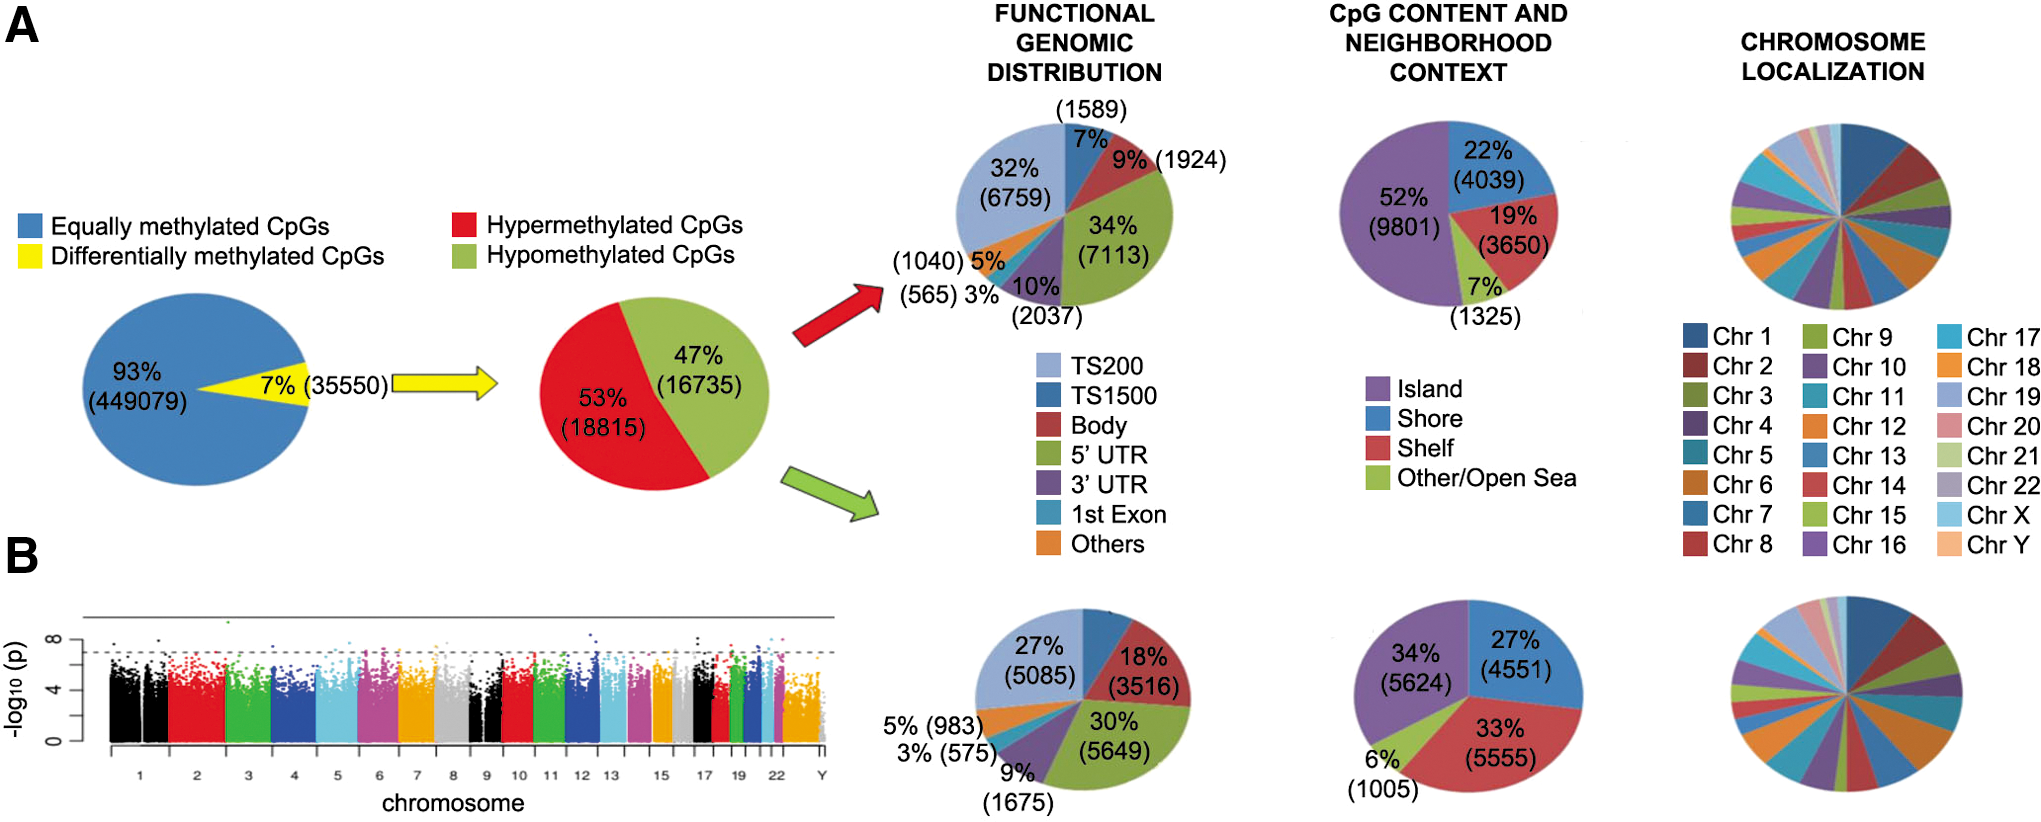
Whole epigenome methylation profile.
Since our group is primarily interested in differentiation of hESC and hiPSC into keratinocytes, especially the formation of the epidermal permeability barrier, we next focused on the EDC on chromosome 1. EDC is a ≈2-Mb region at chromosome band 1q21, which contains multiple conserved gene encoding stratum corneum proteins [11
–19] (Fig. 4A). We found no difference in DNA methylation of regions associated with either late cornified envelope or small proline-rich region (SPRR) families, as well as with filaggrin, filaggrin 2, involucrin, and loricrin (Supplementary Table S1; Supplementary Figs. S1–S3; Supplementary Data are available online at
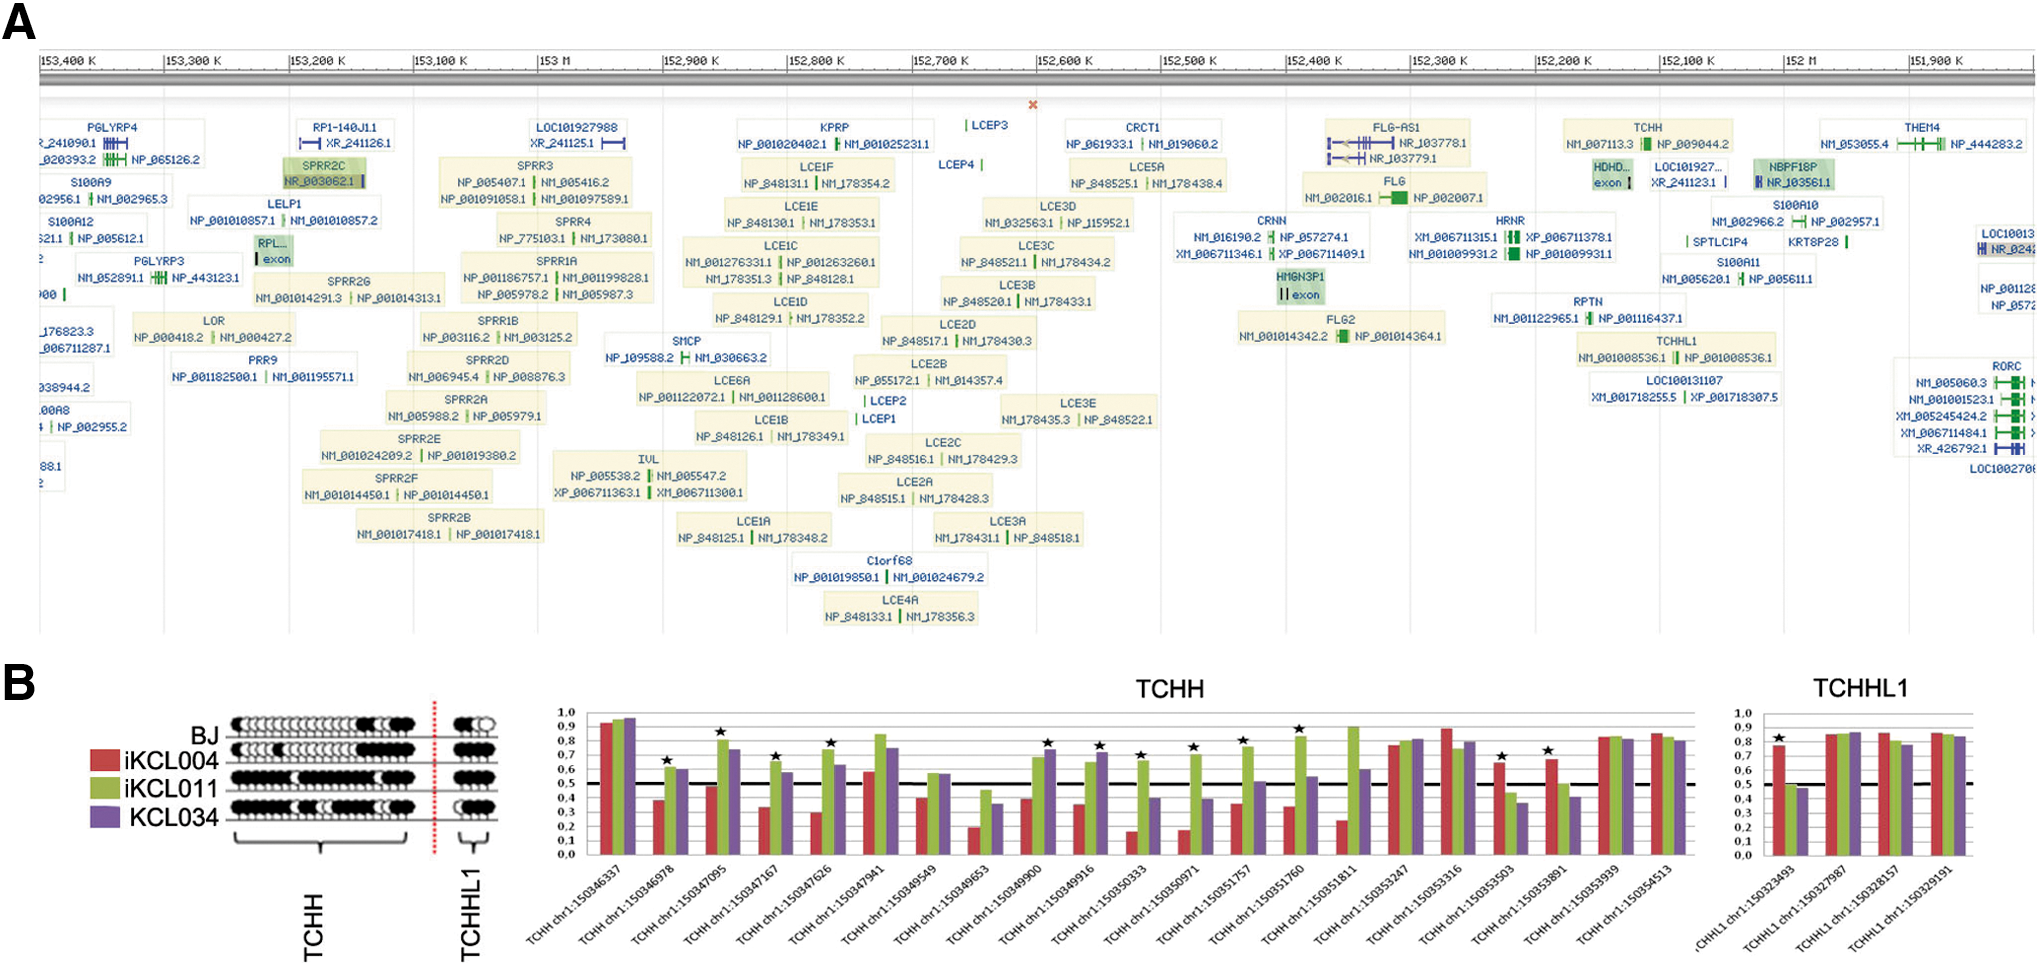
DNA methylation of EDC genes.
TCHH expression pattern in HEE resembles neonatal, not adult, skin
Next, we investigated whether the difference in methylation signature of TCHH in iKCL004 had an effect on expression of EDC genes and hESC/iPSC differentiation into keratinocytes. We compared the transcriptome of EDC genes in undifferentiated hESC/iPSC (T0), hESC/iPSC-derived keratinocytes (T3), and NHK from skin biopsies of two donors. The T0 and T3 transcriptomes were analyzed as biological replicates from three independent sets of differentiation experiments. Heatmaps showing relative expression for EDC genes and the principal component analysis clearly demonstrate that (i) hESC/iPSC-derived keratinocytes at T3 cluster together with NHK; and that (ii) no significant difference was observed between iKCL004 and iKCL011 (Fig. 5A, B). hESC/iPSC-derived keratinocytes, in general, express keratin 14 (KRT14) and TP63 (p63) (Fig. 5C), which are markers of keratinocytes in the stratum basale of human epidermis. No TCHH expression at protein level was detected in any of the samples (data not shown), which suggested that aberrant DNA methylation of TCHH gene did not affect hESC/iPSC differentiation into keratinocytes and did not induce its expression in KRT14+/p63+ cells.
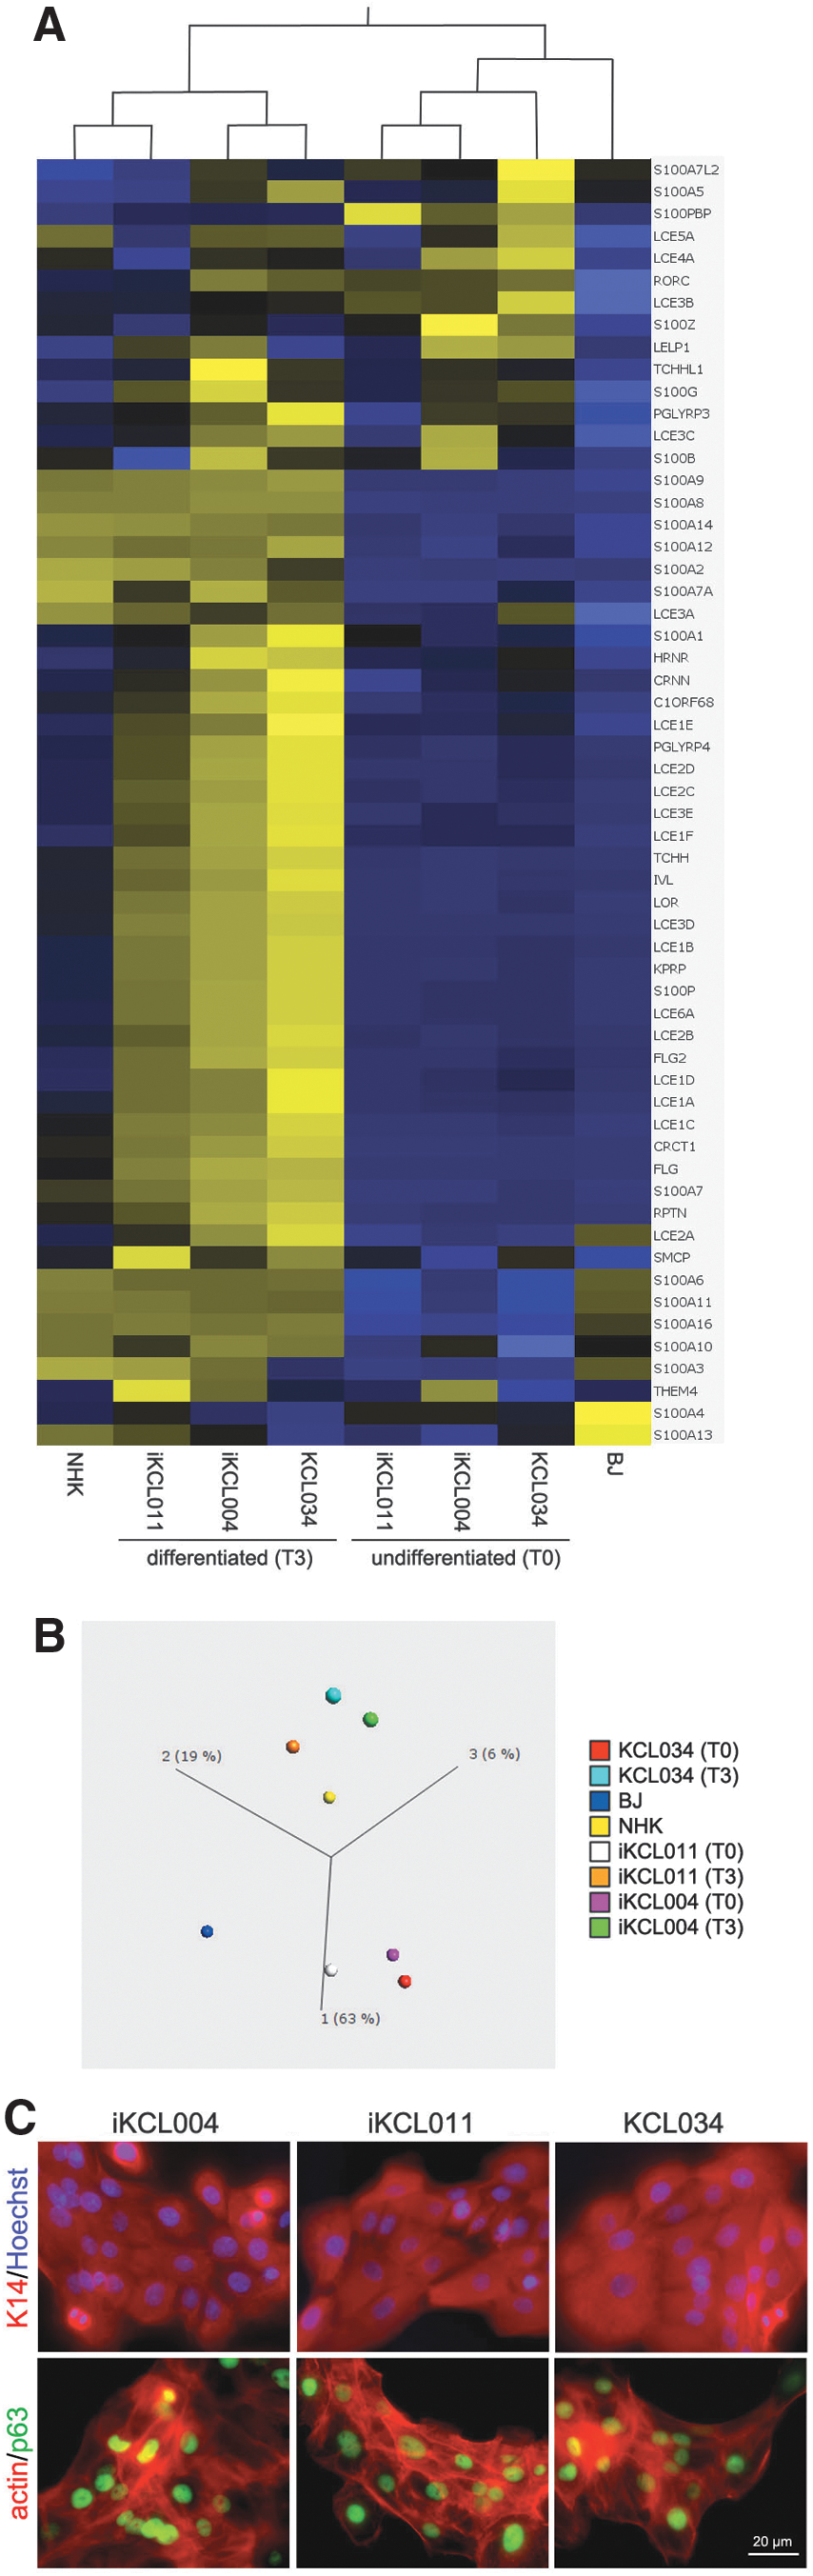
hESC/iPSC-derived keratinocytes.
TCHH is not normally seen in interfollicular adult skin, but is found only in the stratum granulosum (SG) of neonatal skin [30]. To examine TCHH expression in a neonatal model of SG cells, we generated multilayered HEEs from the hESC/iPSC-derived keratinocytes and primary human foreskin keratinocytes following our high-to-low humidity protocol [10,21]. All resulting HEEs, regardless of the keratinocytes' origin, had a similar TCHH expression, which resembled the pattern seen in the neonatal skin (Fig. 6). The data suggest that a difference between two iPSC clones in DNA methylation of TCHH gene did not have an obvious effect at TCHH expression pattern in three-dimensional (3D) HEEs.
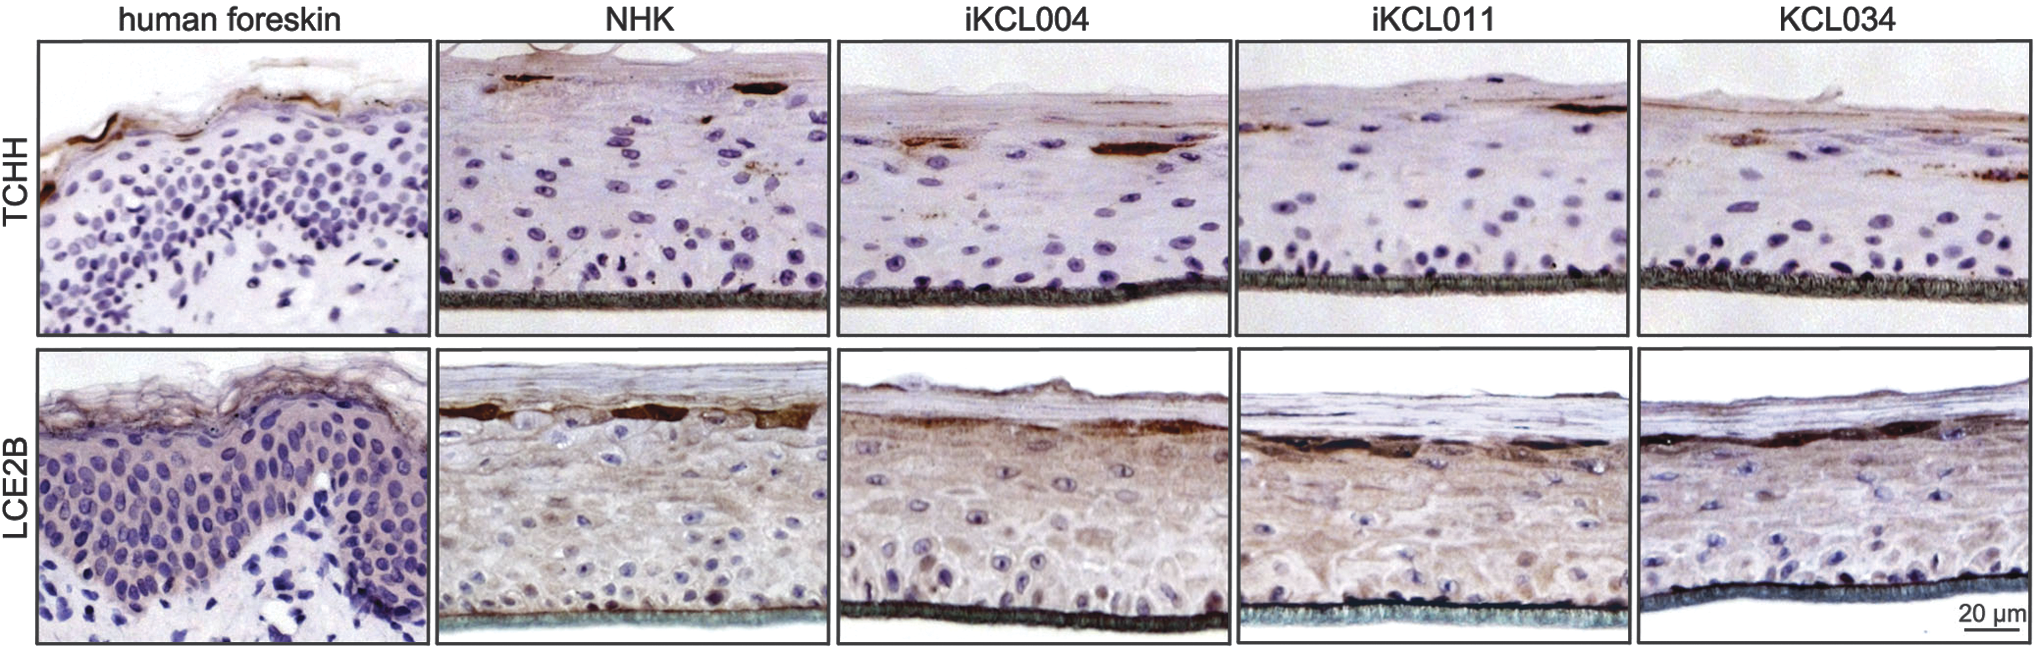
The expression pattern of TCHH in human epidermal equivalents is similar to human neonatal skin. Localization in the granular layer corresponds to expression of other proteins involved in cornification such as LCE2B.
Discussion
Exome sequencing of both iPSC lines and parental HFFs BJ confirmed that the reprogramming used to generate these cells did not lead to increased number of mutations. Moreover, both lines were genetically identical to their parental line. Karyotype of both iPSC lines was stable over the extended periods of in vitro culture under feeder-free conditions. Cytogenetic resilience of iKCL004 and iKCL011 lines might arise from particular aspects of cell culture, as well as reflect a genetic predisposition to chromosomal stability/instability, commonly noted with hESC lines [8,9,33,34]. hESC is derived from embryos created by in vitro fertilization, often from donors that have problems with fertility. Prevalence of balanced structural chromosomal abnormalities in patients seeking assisted conception is higher than in general population and it is reasonable to speculate that undiagnosed genetic mutations might be underlying cause of infertility, and consequently, genomic instability in the hESC lines.
Although ideally, hiPSC should be functionally and molecularly indistinguishable from hESC, often that is not the case [35]. These differences may manifest only upon differentiation, not in the pluripotent state; miRNA profile [36] and residual DNA methylation [28] are likely to influence differentiation propensity. For example, upon induction of keratinocyte differentiation with bone morphogenic protein 4 and all-trans retinoic acid, none of the three lines used in the study (iKCL004, iKCL011, and KCL034) responded equally [10]. Over time, by end of the differentiation, these differences were diminished, probably through selection and purification by selective attachment to collagen IV-coated surface as described [10]. Indeed, the miRNA profile of both iPSC lines, iKCL004 and iKCL011, was not significantly different from control hESC KCL034 line (Fig. 2). Interestingly, epigenome-wide methylation (>480,000 CpG sites) analysis using Infinium Human Methylation 450 BeadChip Kit found more differences between iKCL004 and iKCL011 (7%) than between either iKCL004 and KCL034 (5%) or iKCL011 and KCL034 (4%) (Fig. 3) [10].
Differently methylated CpG sites are in general randomly scattered across the genome. Within one gene, DNA methylation often is significantly different on only one or two CpG sites (Supplementary Table S1; Supplementary Figs. S1–S3). One of the few genes in which DNA methylation was significantly different on most of its CpG sites (12 out of 21) was TCHH (Supplementary Table S1; Fig. 4). TCHH is normally expressed in the inner root sheet and medulla of hair follicles and transiently in the SG and corneum of the epidermis during late stages of fetal skin development [30]. It is also present in isolated cells of the SG of some regions of epidermis (Supplementary Fig. S4) [37]. While in normal skin, TCHH expression correlates with expression of filaggrin, this correlation is lost in psoriatic skin [38]. By forming multiple complex cross-links with itself and other structural proteins, including epiplakin, involucrin, and SPRRs, TCHH is important for the mechanical strength of the hair follicle and epithelial tissues such as hard palate or filiform papillae of the tongue [39]. TCHH is also thought to be a potential major autoantigen in alopecia areata [40]. CpG sites within TCHH were mostly hypomethylated in HFFs and hypermethylated in the hESC KCL034 line (Fig. 4). TCHH methylation pattern suggested that iKCL004 retained methylation signature of the parental fibroblasts, whereas iKCL011 matched the hESC line. We found, however, no differences in TCHH expression pattern in HEE (Fig. 6) suggesting that DNA methylation of the TCHH gene in establishing an iPSC population may not play an essential role.
The data presented in this study highlight our limited understanding of the epigenetic heterogeneity. It is generally considered that faithful genetic and epigenetic reprogramming is critical to obtain fully naive “ground state” of pluripotency.” Indeed, DNA methylation defects have been linked to multiple human diseases [41]. However, as there are significant differences among the genomes of healthy human individuals that do not affect normal fetal and postnatal growth, it is quite plausible that the same rule can also be applied for the epigenome–DNA methylation status may not be equally important for regulation of all genes. Differentiation and tissue formation may, in some cases, attenuate variations in iPSC methylome. These findings should enhance future research using these 3D cultures, since iPSC methylome differences produced by the transformation and culture techniques do not result in phenotypic variation.
Footnotes
Acknowledgments
This work was supported, in part, by grants from the Medical Research Council UK (G0801061 to D.I.), the NIH (R21 ARO61583 and R01 AR051930), the Research Service of the Department of Veterans Affairs (to T.M.M.), and the Dystrophic Epidermolysis Bullosa Research Association (DebRA) (to J.A.M.). A.P. was a DebRA-supported PhD student. We thank Prof Caroline Ogilvie from the Genetics Center at Guy's Hospital for a critical reading of the article.
Author Disclosure Statement
No competing financial interests exist.
References
Supplementary Material
Please find the following supplemental material available below.
For Open Access articles published under a Creative Commons License, all supplemental material carries the same license as the article it is associated with.
For non-Open Access articles published, all supplemental material carries a non-exclusive license, and permission requests for re-use of supplemental material or any part of supplemental material shall be sent directly to the copyright owner as specified in the copyright notice associated with the article.