
Abstract
Mesenchymal stem cell (MSC)-mediated bone regeneration is used to replace lost bone. However, methods to accelerate the process and stabilize regenerated bone remain limited. Therefore, we investigated the effect of bisphosphonates (BPs) on the function of bone marrow mesenchymal stem cells (BMMSCs) to determine if they might enhance MSC-mediated bone regeneration. We isolated and cultured BMMSCs from BALB/c mice and treated the cells with 0.1, 0.5, 1, 5, or 10 μM zoledronic acid (ZA; Zometa, a commercially available BP). ZA had a dose-dependent effect on BMMSCs proliferation and osteogenesis. ZA at concentrations of 5 and 10 μM inhibited the proliferation and osteogenic differentiation of BMMSCs. By contrast, in addition to inducing the proliferation and osteogenesis of BMMSCs, 0.5 μM ZA upregulated expressions of the osteogenesis-related genes Alp, osterix (Osx), and bone sialoprotein (Bsp) and enhanced osteogenesis in vivo when ZA-treated BMMSCs were implanted subcutaneously in nude mice. In addition, 0.5 μM ZA increased expression of Opg in BMMSCs, decreased the Rankl/Opg ratio, and decreased the number of osteoclasts. However, it was not associated with adverse effects on numbers of regulatory T cells or levels of Th17, transforming growth factor-β1 (TGF-β1), and interleukin-17a (IL-17a) when cocultured with T cells. In conclusion, 0.5 μM ZA pretreatment enhanced the proliferation and osteogenesis of BMMSCs in vitro and in vivo and decreased the number of osteoclasts without impairment of BMMSCs immunomodulatory properties. In vitro pretreatment of BMMSCs with BP and subsequent implantation may be a safe and effective way of enhancing MSC-mediated bone regeneration.
Introduction
T
Bisphosphonates (BPs) are an alternative to pyrophosphate. They are widely used in the treatment of osteoporosis and other diseases involving excessive bone resorption, such as Paget's disease, hypercalcemia of malignancy, and cancer-related osteolytic lesions [3]. Because BPs inhibit osteoclasts, reduce bone resorption, and have a high affinity for hydroxyapatite (HA), they have been used as a targeted treatment. Some of their uses include decreasing graft resorption [4,5], enhancing osseointegration, and stabilizing dental implants [6 –8]. The effects of BPs in humans vary depending on the molecular structure, dosage, experimental model, and route and frequency of administration [9 –12].
BP therapy is associated with complications such as BP-related osteonecrosis of the jaw (BRONJ) [13,14], which can cause pain, swelling, infection, loose teeth, and even exposed bone; these complications can seriously compromise patients' quality of life. Although the etiology of BRONJ remains unclear, it appears to be related to the BP dosage. Multiple studies have investigated strategies for the delivery and sustained release of BPs to avoid BRONJ during bone tissue engineering.
Accumulation of high concentrations of BP can harm local tissue, including bone cells. There is thus a need for safe techniques to administer BPs to avoid conditions such as BRONJ. One promising approach is pretreatment of bone marrow mesenchymal stem cells (BMMSCs) in vitro with BP. This method could potentially minimize complications while optimizing the positive effects of the drug. To date, however, few studies have investigated the effects of BP pretreatment of BMMSCs.
Our objective in the present study was to determine whether pretreating BMMSCs with a BP ex vivo before implanting them in mice would regulate mesenchymal stem cell (MSC)-mediated bone regeneration. We tested the proliferation, osteogenesis, and immunomodulatory properties of BMMSCs that had been treated with the BP zoledronic acid (ZA, brand name Zometa). We found that ZA had a dose-dependent effect on BMMSCs proliferation and osteogenesis; while higher concentrations of ZA inhibited proliferation and osteogenic differentiation of BMMSCs, low concentrations of ZA induced BMMSCs proliferation and osteogenesis without impairing BMMSCs immunomodulatory properties.
Materials and Methods
Mice
This study was approved by the Animal Care and Use Committee of Capital Medical University. BALB/c mice were purchased from Beijing Vital River Laboratory Animal (Beijing, China). Mice were maintained in a specific pathogen-free animal facility and kept under conventional conditions with free access to water and food.
Cell culture of BMMSCs
BMMSCs were flushed out from the bone cavity of femurs and tibias and cultured with alpha-minimum essential medium (Gibco) supplemented with 15% fetal bovine serum (Gibco), 2 mM glutamine, 100 U/mL penicillin, and 100 mg/mL streptomycin (Invitrogen), and then incubated in 5% carbon dioxide at 37°C. After three or four passages, BMMSCs were seeded onto six-well plates. The markers of BMMSCs were characterized (Supplementary Fig. S1; Supplementary Data are available online at
Cell sorting of STROL-1+ BMMSCs
Single-cell suspensions (1 × 10⁶ cells) were incubated with Anti-mouse-IgM STRO-1 antibody (Invitrogen). Subsequently, the cells were washed and suspended in 80 μL of buffer per 107 total cells, and then 20 μL of Anti-Mouse IgM MicroBeads (Miltenyi Biotec) per 107 total cells was added. The samples were mixed well and incubated for 15 min in the refrigerator (2°C–8°C). Then, the cell suspension was loaded onto a MACS® Column and placed in the magnetic field of a MACS Separator. The flow-through containing unlabeled cells were collected, which were STROL-1− BMMSCs. After removing the column from the magnetic field, the magnetically retained cells were eluted by firmly pushing the plunger into the column, which were STROL-1+ BMMSCs. The percentage of STROL-1+ BMMSCs was analyzed by fluorescence-activated cell sorting (FACS), and the percentage enrichment was up to 90.0% ± 3.6%.
Assessment of cell proliferation of real-time cell analyzer system
The real-time cell analyzer (RTCA) instrument was used to assess the proliferation of BMMSCs according to the previous study [15] and was repeated three times. Cells were trypsinized briefly, counted, and resuspended in culture medium. Cells were plated at a density of 2,000/well with fresh medium to a final volume of 200 μL. The wells containing 50 μL of the same medium in the E-16 plates were measured as background. Cells were incubated at 37°C and 5% CO2 in the RTCA cradle. Subsequently, RTCA Software Package 1.2 was used to calibrate the plates. The impedance signals were recorded every 1 h until the end of the experiment (up to 110 h). Cell proliferation index for real-time dynamic assessment (n = 3) was measured automatically by the RTCA system. The results are represented as mean ± standard deviation of three independent experiments performed in triplicate.
Carboxyfluorescein succinimidylester labeling for cell proliferation analysis
Single-cell suspensions (1 × 10⁶ cells) were incubated with 5 mM carboxyfluorescein succinimidylester (CFSE) for 10 min in prewarmed 0.1% bovine serum albumin. Five volumes of ice-cold medium were added to stop the staining process, and cells were washed three times with the culture medium. Then, cells were seeded onto six-well plates (BD Biosciences, San Jose, CA) at 2 × 10⁵ cells/well, after 3 days cultured, cells were trypsinized. Flow cytometry was used to analyze the cell proliferation index. The results are represented as mean ± standard deviation of three independent experiments performed in triplicate.
CCK-8 assay of cell proliferation
The CCK-8 assay was used to measure cell proliferation. Cells were cultured in 96-well plates at an initial density of 2 × 10³ cells per well. At 60% confluence, cells were serum starved for 24 h and treated with ZA. At the indicated time points, 10 μL of the Cell Counting Kit solution was added to each well and the microplate was incubated at 37°C in 5% CO2 for 2 h. The absorbance was read at 450 nm with an automatic enzyme-linked immunosorbent assay (ELISA) reader. The assay results are represented as mean ± standard deviation of three independent experiments performed in triplicate.
Cell apoptosis
BMMSCs apoptosis was evaluated using the FITC Annexin V Apoptosis Detection Kit I (BD Biosciences). A total of 106 cells were washed twice with cold phosphate-buffered saline (Invitrogen) and centrifuged at 200g for 5 min. The cell pellet was resuspended in 1× Binding Buffer at a concentration of 1 × 10⁶ cells/mL. Transferred 100 μL of the solution, added 5 μL of FITC Annexin V and 5 μL propidium iodide (PI), gently vortexed the cells and incubated for 15 min at room temperature (25°C) in the dark at room time, and analyzed by flow cytometry.
Adipogenic potential detection
To evaluate the adipogenic differentiation potential, 2 × 10⁴ BMMSCs (three or four passages) were seeded onto six-well plates (BD Biosciences). Subconfluent cultures were incubated in the adipogenic medium (Invitrogen) for 4 weeks. The medium was changed every 2 days. Oil red O staining and real-time reverse transcription polymerase chain reaction (RT-PCR) were used to determine the potential of adipogenesis of BMMSCs.
Osteogenesis potential detection
To evaluate the osteogenic differentiation potential, cells were retreated with 0.1, 0.5, 1, 5, 10 μM ZA for 3 days. Then, 2 × 10⁴ BMMSCs (three or four passages) were seeded onto six-well plates (BD Biosciences). Subconfluent cultures were incubated in the osteogenic medium (Invitrogen) for 4 weeks. The medium was changed every 2 days. Then cells were fixed with 70% ethanol, and 2% Alizarin red staining and real-time RT-PCR were used to determine the potential of osteogenic differentiation of BMMSCs. The mineralization was measured by using the Image-Pro Plus 6.0 program (Media Cybernetics, Rockville, MD).
Flow cytometric analysis of immunoregulatory activity of BMMSCs
Splenocytes isolated from 6-week-old BABL/c mice, activated with anti-CD3 and anti-CD-28 antibody (eBioscience). After being cultured with BMMSCs for 3 days, lymphocytes were harvested and determined by flow cytometric analysis. Anti-mouse CD4-FITC, mouse CD25-APC, and mouse Foxp3-PE antibodies were used for (regulatory T cells) Tregs staining. Anti-mouse CD4-FITC and mouse interleukin-17a (IL-17a)-PE antibodies were used for (T helper cells) Th17 staining. Data were acquired using FACS caliber (BD Biosciences). To detect the secretion level of transforming growth factor-β1 (TGF-β1) and IL-17a, the cell supernatant was collected and the concentrations of cytokines determined using ELISA kits (Dakewe Biotech) according to the manufacturer's instructions.
Real-time RT-PCR for assessing gene expression
Cells were treated with TRIzol (Invitrogen). Total messenger RNA (mRNA) was extracted and reverse transcribed. We obtain Gapdh primer, forward 5′-TGACCTCAACTACATGGTCTACA-3′, reverse 5′-CTTCCCATTCTCGGCCTTG-3′; Alp primer, forward 5′-CCAACTCTTTTGTGCCAGAGA-3′, reverse 5′-GGCTACATTGGTGTTGAGCTTTT-3′; osterix (Osx) primer, forward 5′-GGAAAGGAGGCACAAAGAAGC-3′, reverse 5′-CCCCTTAGGCACTAGGAGC-3′; bone sialoprotein (Bsp) primer, forward 5′-ATGGAGACGGCGATAGTTCC-3′, reverse 5′-CTAGCTGTTACACCCGAGAGT-3′; Opg primer, forward 5′-CACTCGAACCTCACCACAGA-3′, reverse 5′-CAAGTGCTTGAGGGCATACA-3′; Rankl primer, forward 5′-TGTACTTTCGAGCGCAGATG-3′, reverse 5′-CCCACAATGTGTTGCAGTTC-3′; lipoprotein lipase (Lpl) primer, forward 5′-TTTGTGAAATGCCATGACAAG-3′, reverse 5′-CAGATGCTTTCTTCTCTTGTTTGT-3′; and peroxisome proliferator-activated receptor gamma (Pparγ) primer, forward 5′-TGCTGTTATGGGTGAAACTCTG-3′, reverse 5′-CTGTGTCAACCATGGTAATTTCTT-3′ from Primer 3. The complementary DNAs (cDNAs) were amplified by PCR with the following thermocycler conditions: 95°C for 2 min, then 40 cycles of 95°C for 15 s, and 60°C for 1 min.
Transplantation in nude mice
Midlongitudinal skin incisions of about 1 cm in length were made on the dorsal surface of each mouse, and subcutaneous pockets were formed by blunt dissection. A single transplant was placed into each pocket with four transplants per animal. Approximately 4.0 × 10⁶ of cells were mixed with 40 mg of hydroxyapatite/tricalcium phosphate (HA/TCP) ceramic particles and then transplanted subcutaneously into the dorsal surface of 10-week-old immunocompromised beige mice. HA/TCP without BMMSCs was transplanted as control. These procedures were performed in accordance with an approved animal protocol. This experiment was repeated three times, each time using five mice. Eight weeks after transplantation, the transplants were harvested, fixed with 10% formalin, decalcified with buffered 10% EDTA (pH 8.0), and then embedded in paraffin. We observed consecutive section to confirm the mineral tissues were generated on the surface of HA/TCP, which was similar to the previous studies [16]. A section was prepared close to the block surface, and then each section was prepared after 0.1 mm of consecutive cut in the block. A total of 10 sections of each block were assessed. We measured the percentage of lamellar bone area in one visual field. Sections were deparaffinized, hydrated, and stained with hematoxylin and eosin (H&E) and Masson. Bone formation was blindly quantitatively analyzed by three independent investigators. To detect the number of osteoclast, sections were stained with the tartrate-resistant acid phosphatase (TRAP; Sigma) following the manufacturer's protocol. Bone formation area was measured by using the Image-Pro Plus 6.0 program (Media Cybernetics).
Statistical analysis
All statistical calculations were performed using SPSS 13.0 statistical software. Student's t-test or one-way analysis of variance was used to determine statistical significance. P ≤ 0.05 was considered statistically significant.
Results
Effects of different dosages of ZA on in vitro proliferation of BMMSCs
We isolated and cultured BMMSCs that were positive for CD44 and STRO-1 and negative for CD34 and CD45. Expression of these markers remained unchanged after the cells were treated with 0.5 μM ZA (Supplementary Fig. S1).
To investigate the effects of ZA on the proliferation of BMMSCs, we added ZA to BMMSCs at concentrations of 0.1, 0.5, 1, 5, and 10 μM. CCK-8 analyses were performed 1–8 days after treatment with ZA to determine when the effects of the BP were significant on BMMSC proliferation. Proliferation was significant on 3 days after treatment in cells treated with 0.5 or 1 μM ZA compared to the control group and other ZA concentration groups. This effect lasted until 5 days posttreatment, at which point cell proliferation plateaued (Supplementary Fig. S2A).
To further verify the effects of ZA on BMMSCs proliferation, we used a RTCA (xCELLigence; Roche) to dynamically analyze cell proliferation over the course of the experiment. The results confirmed that 0.5 and 1 μM ZA increased the proliferation ∼72 h after ZA was added, while 5 and 10 μM ZA inhibited proliferation (Fig. 1A).
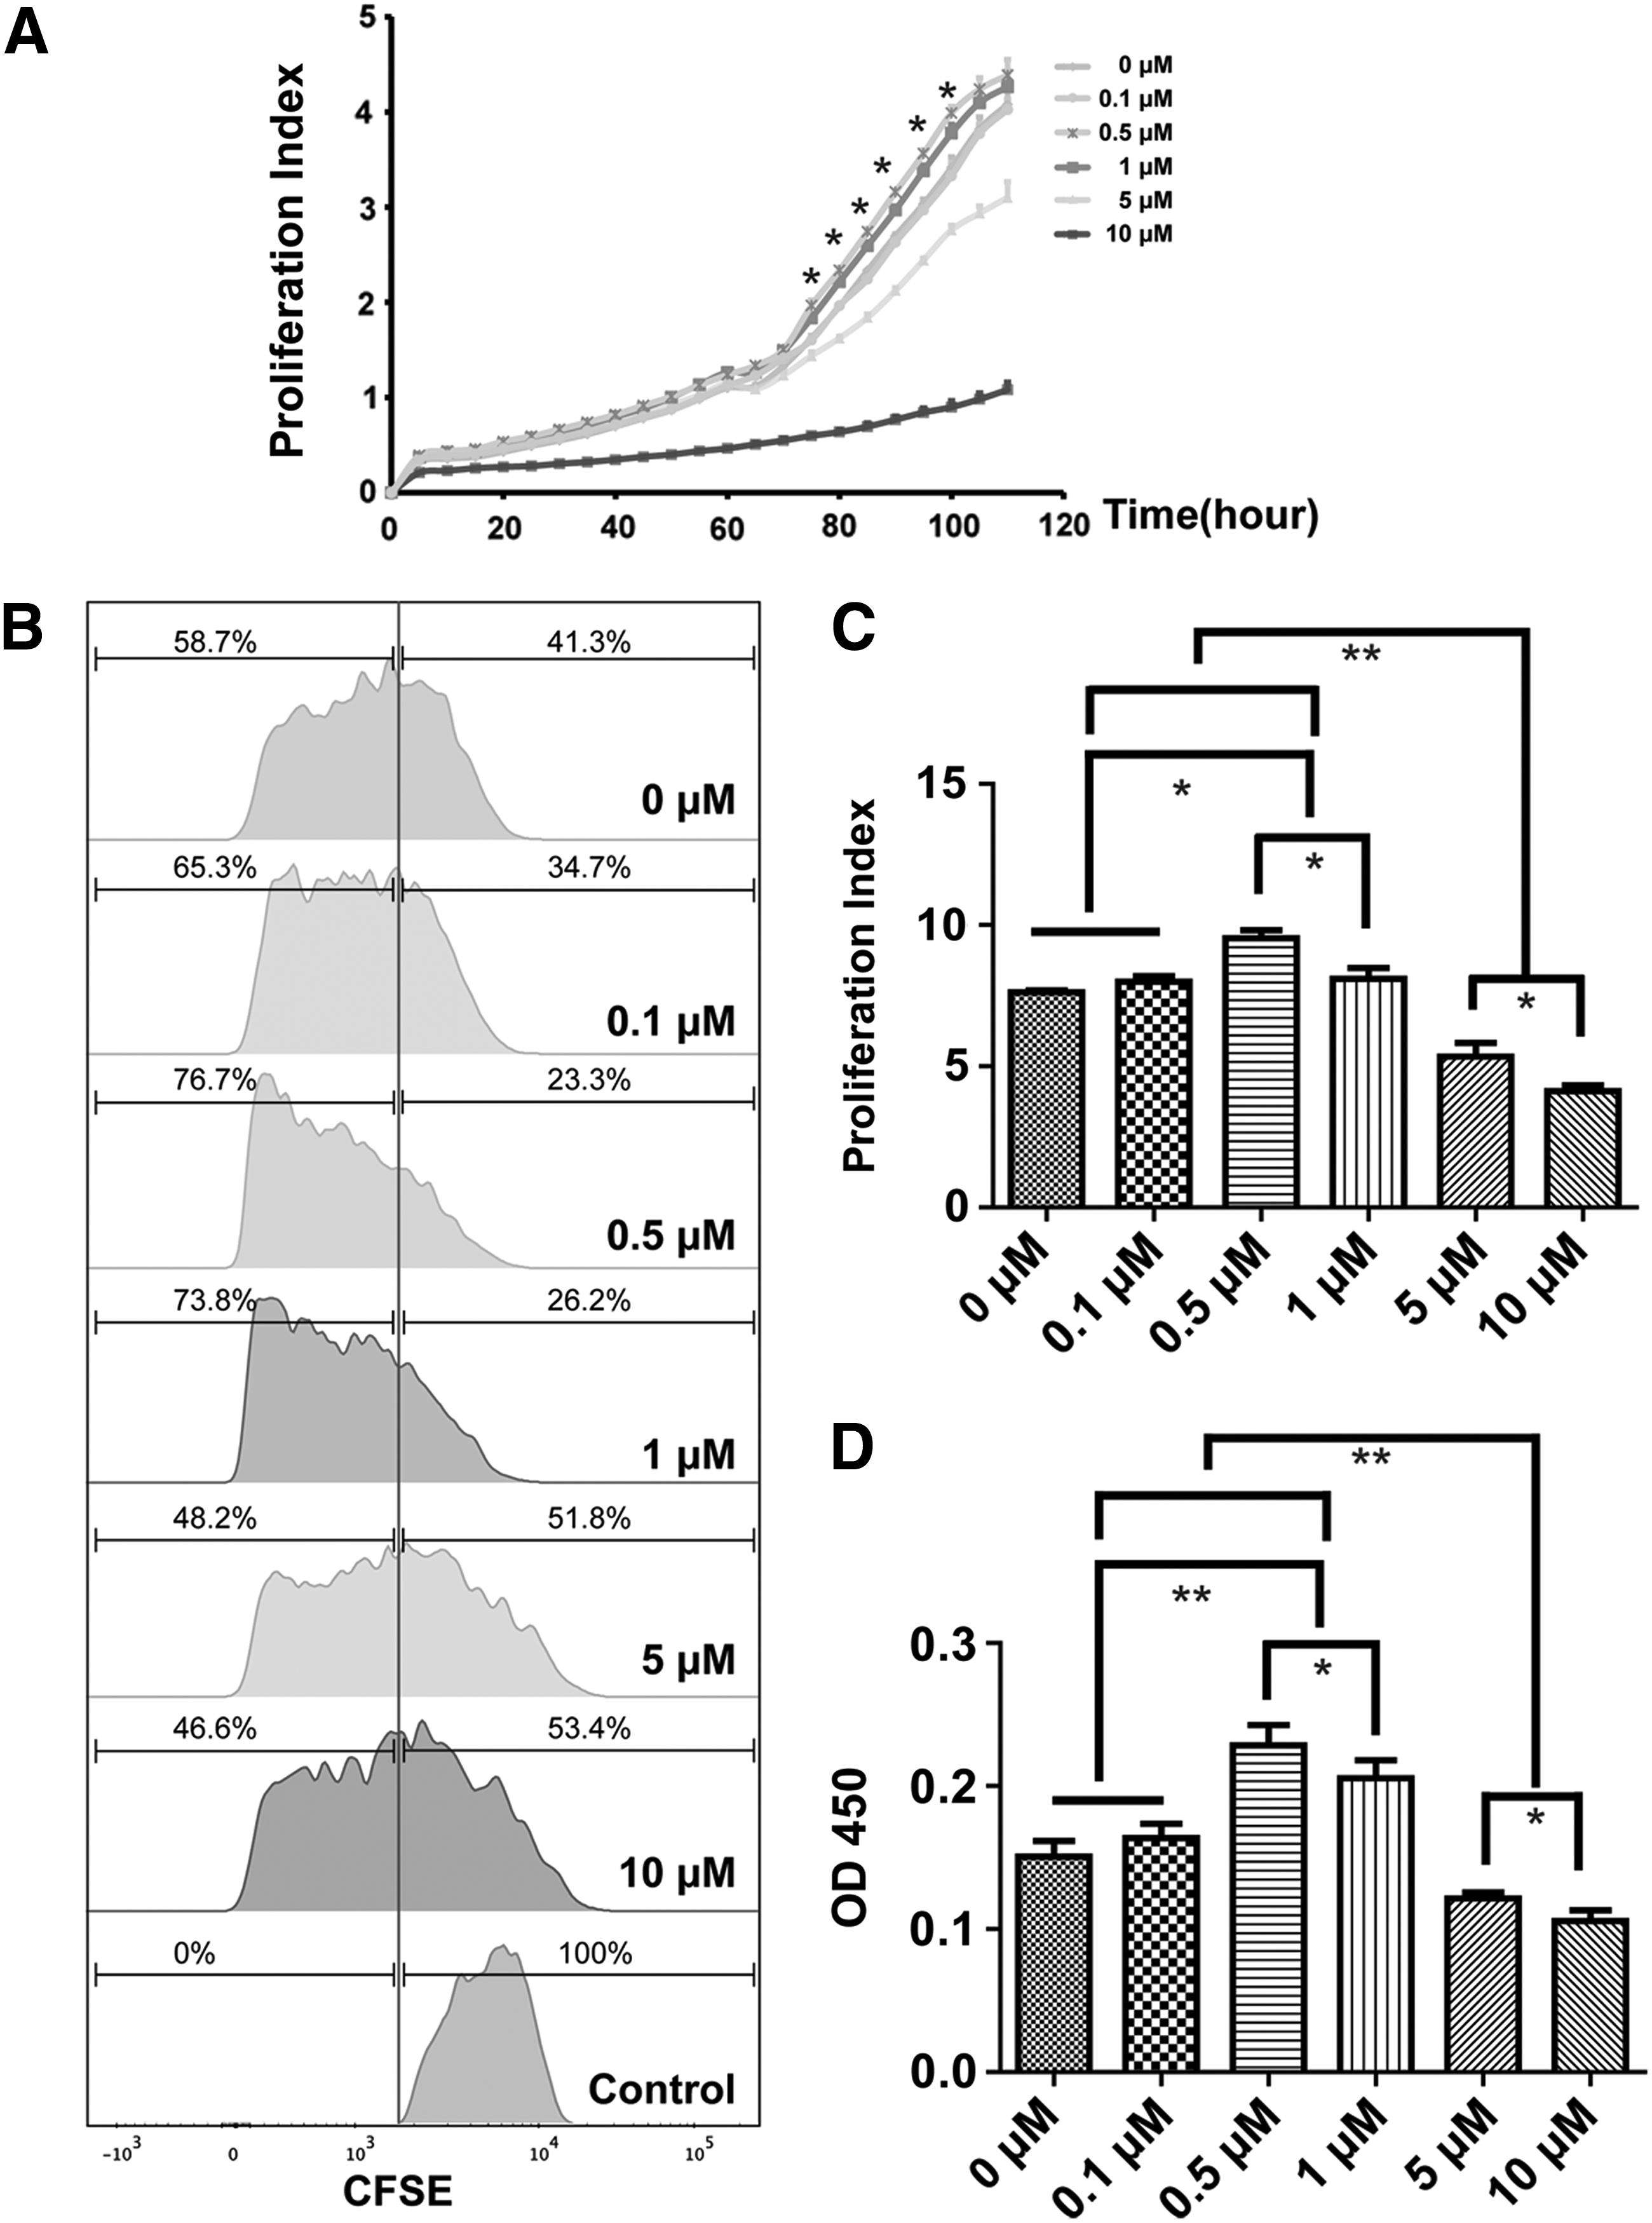
ZA affected in vitro proliferation of BMMSCs in a dose-dependent manner. To investigate the effect of ZA on the proliferation of BMMSCs, ZA was added to BMMSCs at concentrations of 0.1, 0.5, 1, 5, 10 μM. RTCA
Based on the results described above, we used BMMSCs that had been treated with ZA for 3 days in subsequent experiments. After 3 days of stimulation, CFSE and CCK-8 assays revealed that ZA influenced the proliferation of BMMSCs in a dose-dependent manner. ZA concentrations of 0.5 and 1 μM ZA significantly induced BMMSCs proliferation compared to the control group and other ZA concentration groups; the increase in proliferation was higher with 0.5 μM compared to 1 μM ZA. A lower concentration, 0.1 μM ZA, had no effect on BMMSCs proliferation, while higher concentrations of 5 and 10 μM ZA inhibited BMMSCs proliferation (Fig. 1B–D).
To determine whether ZA affects various subpopulations of BMMSCs differently, we used microbeads to isolate STROL-1+ BMMSCs. FACS revealed that the percentage of STRO-1+ BMMSCs had been enriched to 90.0% ± 3.6%. We next used CCK-8 assay to compare cell proliferation in STROL-1+ and STROL-1− BMMSCs and found that ZA had the same effect on both cell populations: 0.5 μM increased cell proliferation, while 5 μM had an inhibitory effect (Supplementary Fig. S2B).
To investigate the effects of ZA on BMMSC apoptosis, we performed double fluorescence staining with Annexin V—fluorescein isothiocyanate and PI. After 3 days of treatment with ZA, 10 μM ZA induced apoptosis of BMMSCs, while 0.1–5 μM ZA did not have any effect on BMMSC apoptosis (Supplementary Fig. S3).
Effects of ZA on osteogenic differentiation potential of BMMSCs in vitro
We next investigated the effects of ZA on the ability of BMMSCs to undergo osteogenic differentiation. We pretreated BMMSCs with ZA at concentrations of 0.1, 0.5, 1, 5, or 10 μM for 3 days. We then incubated the BMMSCs in osteogenic medium for 4 weeks. Alizarin red staining revealed that 0.5 and 1 μM ZA markedly increased the osteogenic differentiation of BMMSCs compared to the control group and other ZA concentration groups. By contrast, 0.1 μM ZA had no effect on BMMSCs osteogenic differentiation, while 5 and 10 μM ZA dramatically inhibited BMMSCs osteogenic differentiation (Fig. 2A, B). Alizarin red staining revealed that the different ZA concentrations had equivalent effects on the osteogenic differentiation of STROL-1+ and STROL-1− BMMSCs: 0.5 μM induced osteogenic differentiation, while 5 μM inhibited osteogenic differentiation (Supplementary Fig. S2C, D).

0.5 μM ZA enhanced the osteogenic differentiation of BMMSCs in vitro.
We next examined the effects of ZA on the expression of key genes associated with osteogenic differentiation after 3 days of ZA treatment and 3, 7, and 14 days of osteogenic induction. Real-time RT-PCR analysis revealed that expression of the early marker of osteogenic differentiation alkaline phosphatase (Alp) changed markedly after 3 days of ZA treatment. During osteogenic induction on days 3, 7, and 14, cells treated with 5 and 10 μM ZA had lower expression of Alp compared to the other groups. On day 7, Alp expression was higher in BMMSCs pretreated with 0.5 and 1 μM ZA compared to the control group and 5 and 10 μM ZA treatment groups (Fig. 2C). In addition, expressions of the osteogenic marker gene Bsp, which encodes bone extracellular matrix proteins, changed markedly after 3 days of ZA treatment. During osteogenic induction on days 3, 7, and 14, Bsp was largely downregulated in BMMSCs treated with 5 and 10 μM ZA. During osteogenic induction on days 3 and 7, Bsp was upregulated in BMMSCs treated with 0.5 and 1 μM ZA compared to the control group and other ZA concentration groups (Fig. 2D). We also investigated the expression of Osx and runt-related transcription factor 2 (Runx2), two key transcription factors involved in BMMSC osteogenic differentiation. Osx expression was significantly decreased after 5 and 10 μM ZA treatments for 3 days and during osteogenic induction on days 3, 7, and 14. During osteogenic induction on days 3 and 7, Osx expression was increased in BMMSCs treated with 0.5 and 1 μM ZA compared to the control group and 5 and 10 μM ZA treatment groups (Fig. 2E). Expression levels of Runx2 did not significantly change after ZA treatment (data not shown).
To determine the effect of ZA on the multilineage differentiation of BMMSCs, we added ZA to BMMSCs and then measured adipogenic differentiation. Oil red O staining revealed that 5 and 10 μM ZA inhibited adipogenic differentiation of BMMSCs, while 0.1–1 μM ZA had no significant effects (Supplementary Fig. S4A, B). RT-PCR analysis indicated that expression of the adipogenic differentiation marker Lpl and Pparγ decreased in BMMSCs treated with 5 and 10 μM compared to the control group, while there were no significant changes in Lpl and Pparγ expression levels in BMMSCs treated with 0.1–1 μM ZA compared to the control group (Supplementary Fig. S4C, D).
Effect of ZA on in vitro immunoregulatory function of BMMSCs
The immunoregulatory activities of BMMSCs play an important role in bone reconstruction. Therefore, we investigated the effects of ZA on BMMSCs immunoregulatory activity. To do so, we cocultured splenocytes from BALB/C mice with BMMSCs pretreated with 0.5 μM ZA. Flow cytometric analysis revealed that the frequency of CD4+ CD25+ FoxP3+ T regulatory (Treg) cells and CD4+ IL-17a+ T cells (Th17) among T cells cocultured with 0.5 μM ZA pretreated BMMSCs did not change compared to untreated BMMSCs (Fig. 3A–G). We next examined expression of the cytokines TGF-β1 and IL-17a. An ELISA showed no significant differences between 0.5 μM ZA pretreated BMMSCs and untreated BMMSCs (Fig. 3E, F).
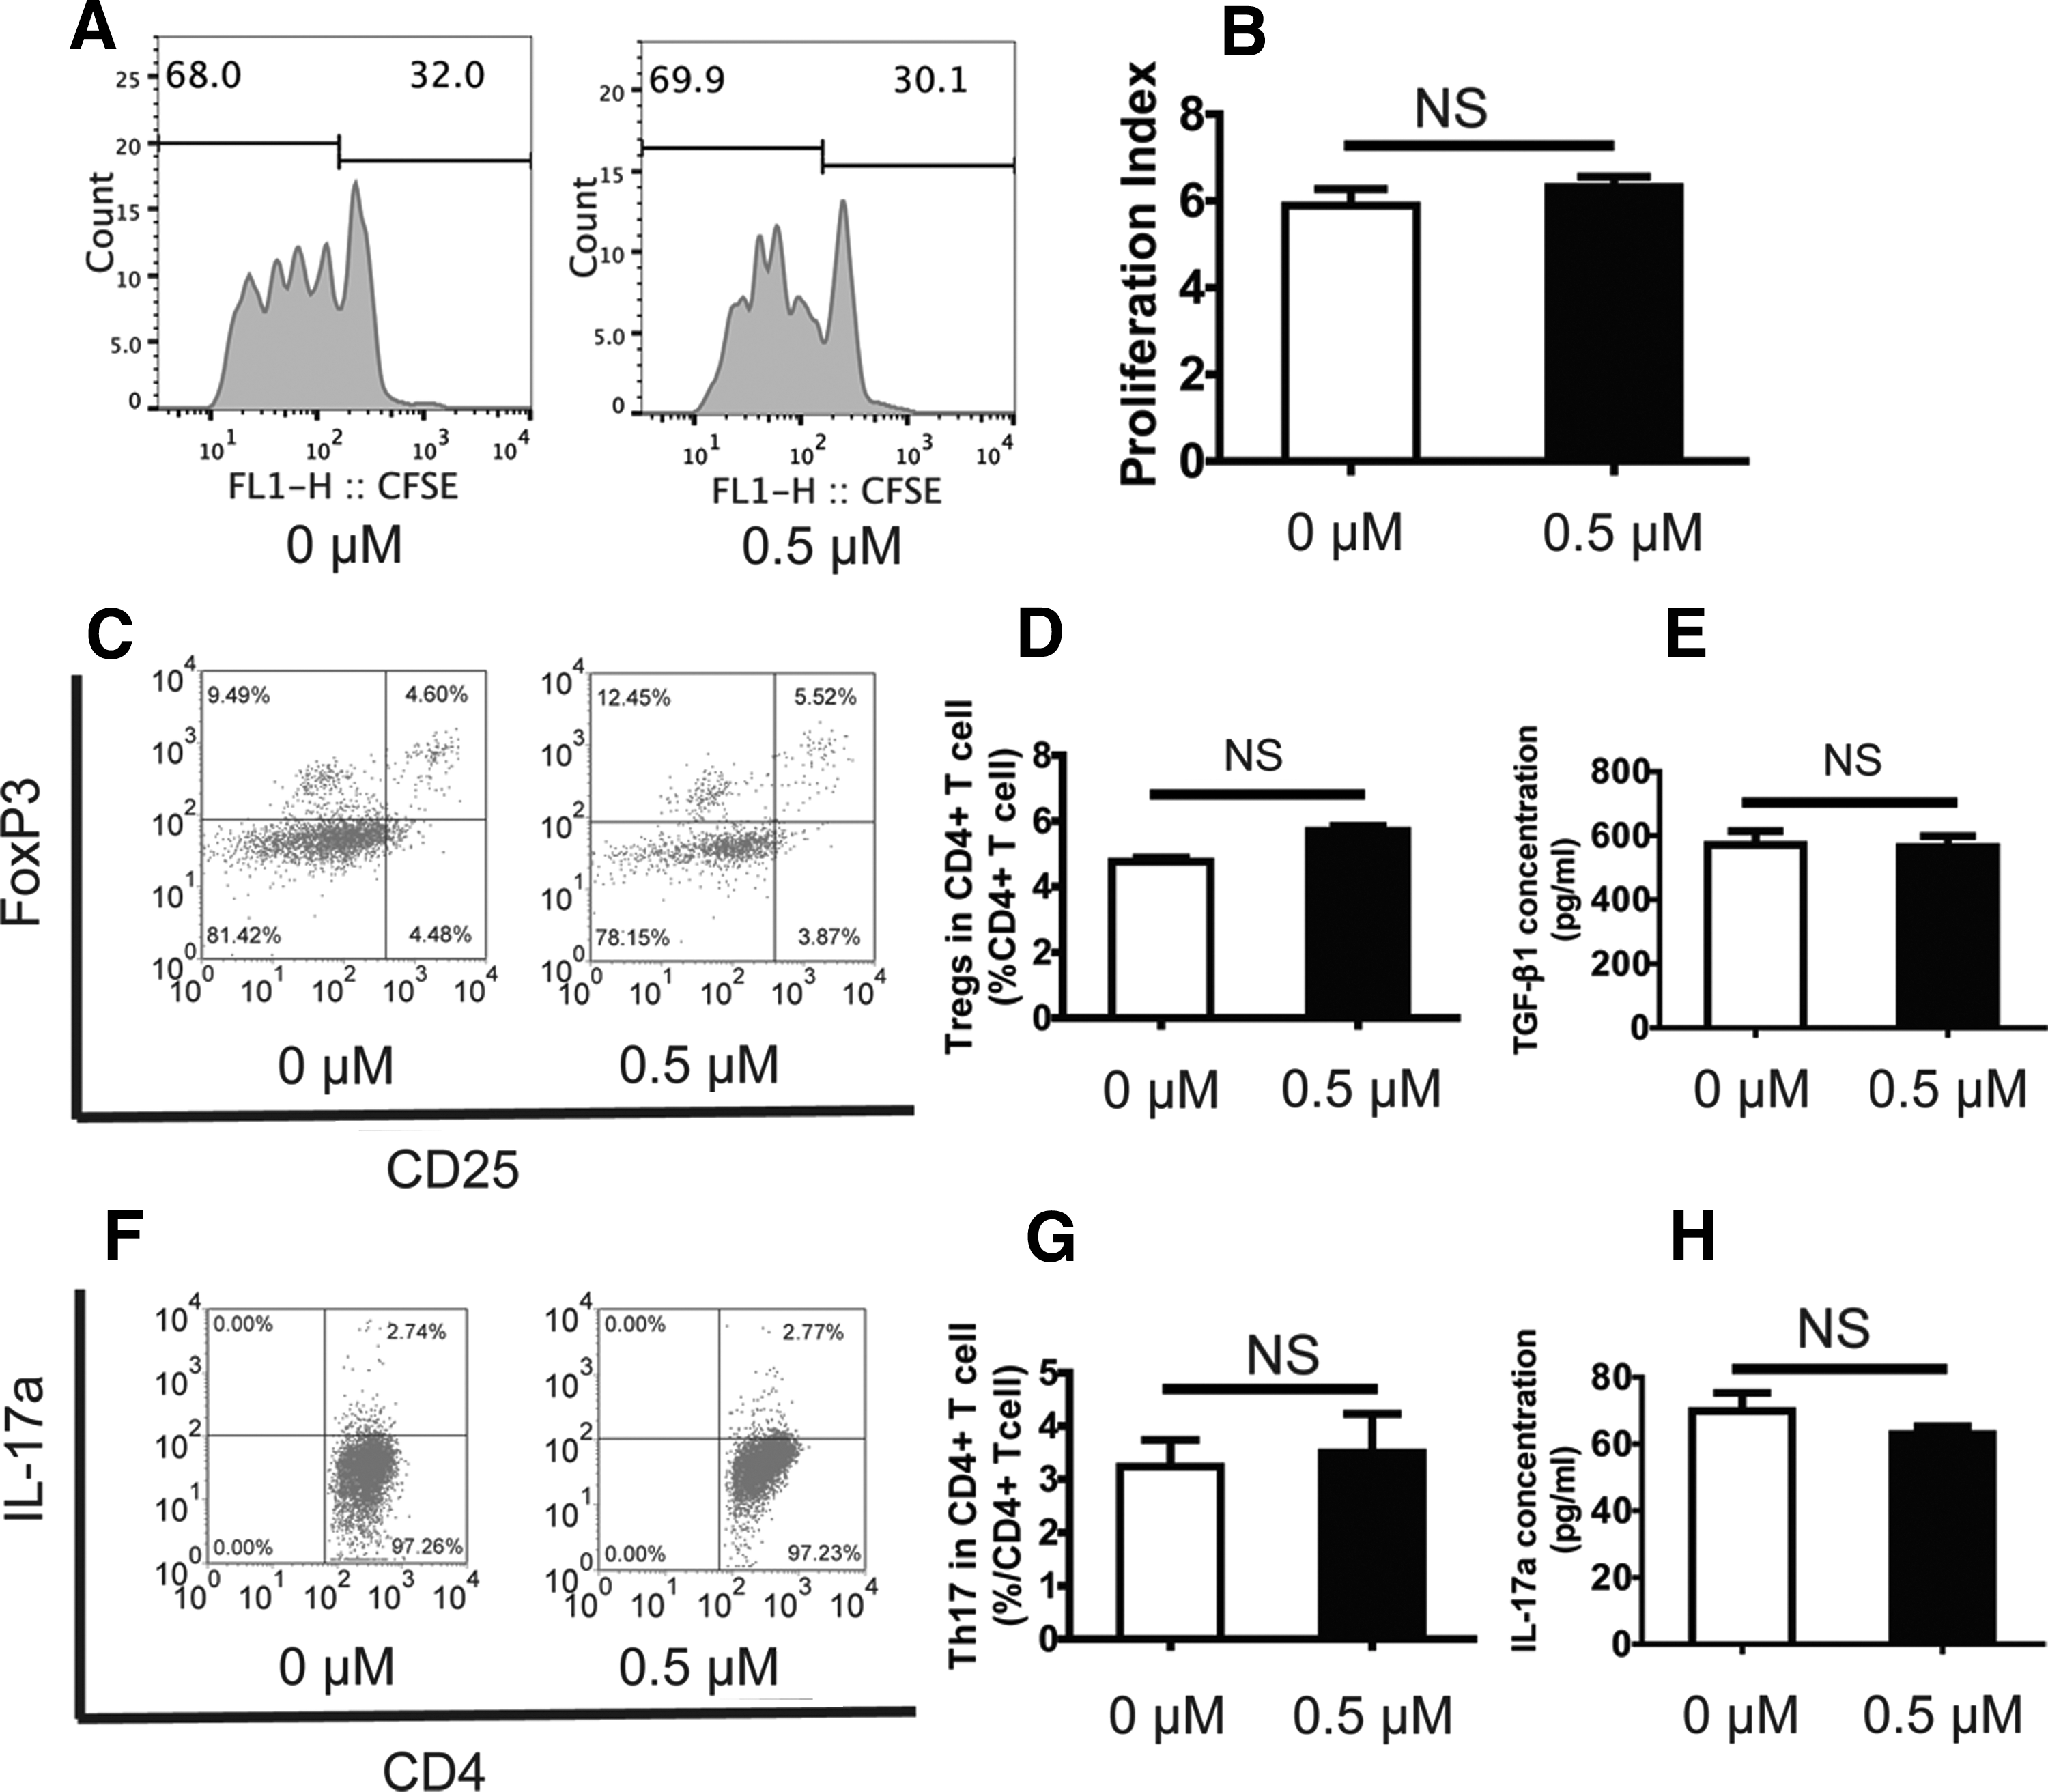
0.5 μM ZA did not affect the immunoregulatory activities of BMMSCs.
ZA promotion of osteogenesis of BMMSCs in vivo
To determine the effect of ZA on osteogenesis of BMMSCs in vivo, we subcutaneously implanted BMMSCs pretreated with 0.5 μM ZA or untreated BMMSCs into nude mice and harvested the implanted tissue 8 weeks later. H&E and Masson staining of the tissues derived from HA/TCP without implanted BMMSCs revealed almost no bone-like tissue formation. This finding indicates that host cells contribute very little to ectopic bone formation; the bone-like tissue formation in implanted mice was thus largely attributable to the donor BMMSCs (Fig. 4A, D). H&E and Masson staining revealed that more bone-like tissue was formed in tissues derived from 0.5 μM ZA pretreated BMMSCs (25.1% ± 4.5%) than in the untreated group (12.6% ± 2.6%; Fig. 4). Thus, pretreatment of BMMSCs with 0.5 μM ZA was associated with significantly enhanced osteogenesis of BMMSCs in vivo.
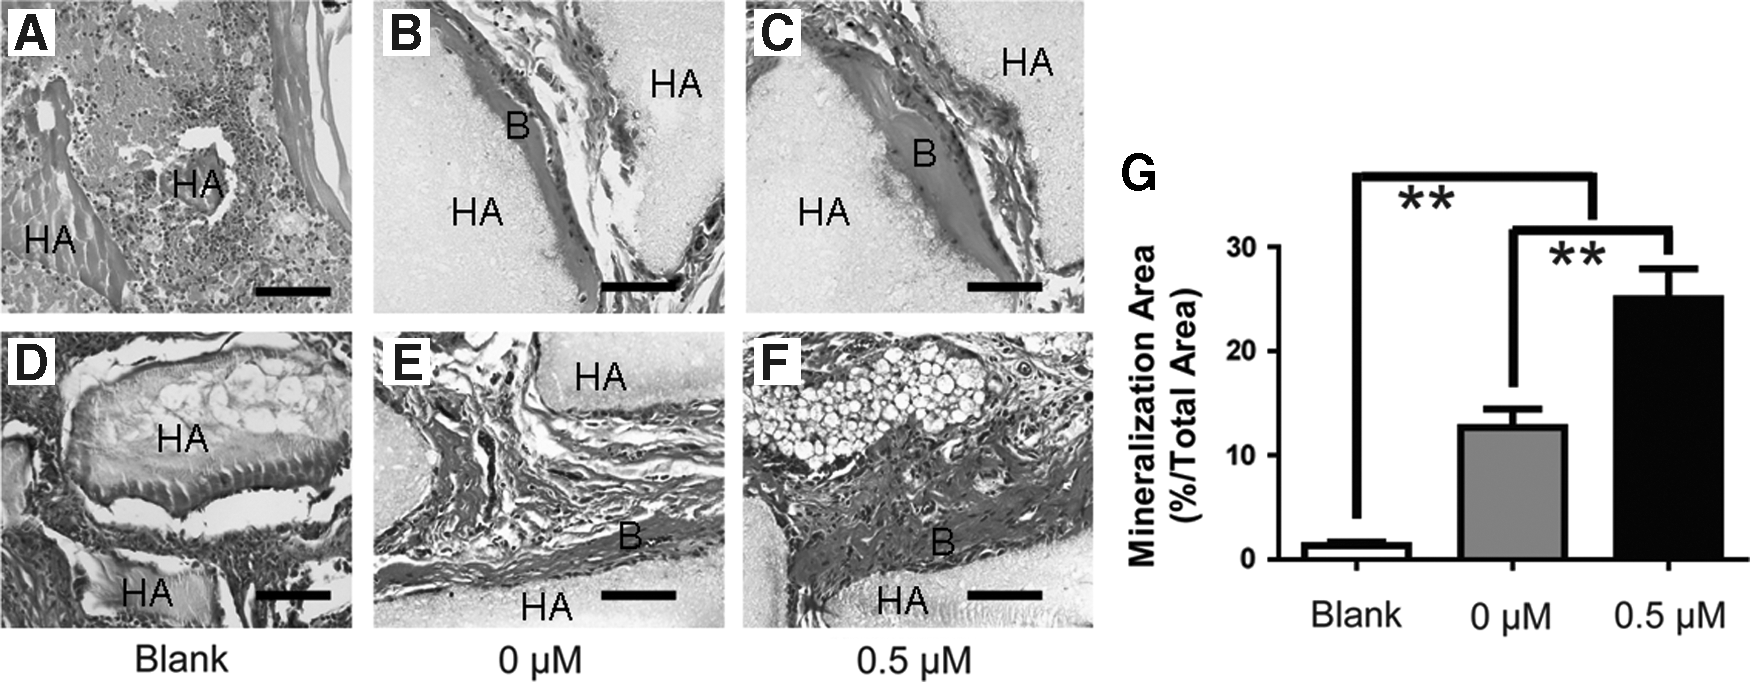
0.5 μM ZA promoted osteogenesis of BMMSCs in vivo.
Effect of ZA on Rankl/Opg ratio and osteoclast formation
We examined the effects of ZA on Rankl and Opg expression and the Rankl/Opg ratio in BMMSCs with and without osteogenic induction. Real-time RT-PCR analysis revealed that after 0.5 μM ZA treatment, expression of Opg in BMMSCs without osteogenic induction was upregulated (Fig. 5A), while expression of Rankl was unaffected (Fig. 5B). The Rankl/Opg ratio was thus significantly lower compared to the control group (Fig. 5C). After osteogenic induction for 7 days, the upregulated expression of Opg decreased but was still higher than in control groups (Fig. 5D). Rankl expression was unchanged (Fig. 5E); thus, the Rankl/Opg ratio declined (Fig. 5F). TRAP staining revealed fewer osteoclasts in tissue derived from BMMSCs pretreated with 0.5 μM ZA (2.5% ± 0.9%) compared to tissue derived from untreated BMMSCs (6% ± 1%; Fig. 5G–I).

0.5 μM ZA decreased Rankl/Opg ratio and the number of osteoclast.
Discussion
In the present study, we showed that ZA had a marked dose-dependent effect on BMMSCs proliferation and osteogenesis. ZA concentrations of 5 and 10 μM inhibited proliferation of BMMSCs. By contrast, 0.5 μM ZA induced the proliferation and osteogenesis of BMMSCs; upregulated expression of the osteogenesis-related genes Alp, Osx, and Bsp; and enhanced osteogenesis in vivo when ZA-pretreated BMMSCs were subcutaneously implanted in nude mice. At 0.5 μM, ZA also increased Opg expression in BMMSCs and decreased the Rankl/Opg ratio, which is associated with impaired osteoclast differentiation. However, there were limited effects on the numbers of Treg and Th17 cells and expression of TGF-β1 and IL-17a when 0.5 μM ZA-treated BMMSCs were cocultured with T cells.
MSCs are multipotent stromal cells that can differentiate into a variety of cell types, such as osteoblasts, chondrocytes, myocytes, and adipocytes. The properties of MSCs play a crucial role in MSC-mediated tissue regeneration, including the capacity to proliferate and differentiate into multiple lineages of cells, the ability to secrete soluble factors that regulate crucial biological functions like proliferation and differentiation in a wide variety of target cells, and the ability to migrate to damaged tissues [17]. Although studies have shown MSC-mediated bone regeneration in animal models, the regeneration is inadequate with respect to clinical purposes for a number of reasons, including delayed bone regeneration and difficulty maintaining a stable phenotype. Consequently, researchers have turned to small osteogenic drug molecules or growth factors that could potentially be used to promote bone regeneration.
ZA concentrations of 5 and 10 μM significantly inhibited proliferation of BMMSCs. This finding is in concordance with our findings in a BRONJ model in miniature pigs [18]. Concentrations of ZA in patients with BRONJ range from 0.4 to 4.6 μM [19]. Direct inhibitory effects of ZA on BMMSCs may partially contribute to the pathogenesis of BRONJ. However, we found that lower concentrations of ZA (0.5–1 μM) could induce the proliferation and osteogenesis of BMMSCs and consequently increase expression of the osteogenesis-related genes Alp, Osx, and Bsp. Indeed, 0.5 μM ZA pretreated BMMSCs implanted subcutaneously into nude mice resulted in the formation of larger bone-like tissues compared to the control group and higher ZA concentration groups.
High concentrations of ZA are known to inhibit the activation of Ras proteins by suppressing farnesyl transferase and geranylgeranyl transferase enzymes within the mevalonate pathway, with consequent inhibition of cellular growth proliferation and induction of apoptosis [20]. Ras proteins are monomeric GTPases that can participate in the regulation of osteogenesis by activating MEK and Erk and inducing activation of the mitogen-activated protein kinase (MAPK) cascade. High concentrations of ZA may inhibit the osteogenesis of BMMSCs by inhibiting MAPK signaling.
Previous studies have indicated that p-mTOR and p-AKT levels are significantly reduced in BMMSCs treated with low concentrations of ZA; moreover, ZA enhances DNA repair of BMMSCs and thus maintains their capacity for self-renewal through the PI3K/Akt/mTOR pathway [21]. MSCs cultured in the presence of inhibitors of Akt or mTOR robustly maintain high clonogenic frequency and have enhanced proliferative capacity and osteogenic potential [22]. Thus, we speculate that low concentrations of ZA may enhance osteogenic differentiation through inhibition of the PI3K/Akt/mTOR pathway. However, the mechanism remains unknown and requires further investigation.
The immunomodulatory properties of MSCs have been the focus of increasing attention. The host immune system, especially T lymphocytes, is known to affect bone regeneration [23]. Systemic infusion of MSCs can modulate regulation of the local immune response and thus enhance the tissue regeneration process through secretion of paracrine factors and direct or indirect upregulation of FoxP3+ Treg [24]. Our previous study revealed high numbers of Th17 and decreased numbers of Treg in a miniature pig model of BRONJ; this immune imbalance could impair bone regeneration [18]. In the present study, we found that 0.5 μM ZA had no adverse effects on the immunoregulatory activities of BMMSCs.
The bone remodeling process can be divided into three distinct phases: (a) initiation, in which osteoclasts are formed and begin to resorb damaged bone; (b) reversal, in which osteoblasts replace osteoclasts; and (c) formation, in which osteoblast-mediated new bone replaces the portion of bone that was resorbed [25]. The process of MSC-mediated bone regeneration is similar to this process and involves osteoclasts, osteoblasts, MSCs, and other cells and their close interactions. The inhibition of osteoclasts and recruitment/differentiation of MSCs are the key steps during MSC-mediated bone regeneration. Indeed, MSCs may regulate osteoclasts by a mechanism that involves the Opg/Rankl axis. BMMSCs secrete OPG and RANKL [26]. RANKL binds its receptor RANK on osteoclast precursors and activates downstream signals, consequently promoting the maturation of osteoclasts to induce bone resorption. OPG is the endogenous antagonist of RANKL. OPG competitively inhibits RANKL, thereby interrupting the maturation of osteoclasts and suppressing bone resorption [27]. According to our findings, 0.5 μM ZA pretreated BMMSCs may reverse the Opg/Rankl ratio and decrease the number of osteoclasts, leading to enhanced bone formation.
In conclusion, concentrations of 5 and 10 μM ZA inhibited proliferation and osteogenic differentiation of BMMSCs. However, low concentrations of ZA (around 0.5 μM) induced the proliferation and osteogenesis of BMMSCs. Pretreatment with 0.5 μM ZA may thus enhance the proliferation and osteogenesis of BMMSCs and decrease the number of osteoclasts without impairing BMMSCs immunomodulatory properties in clinical settings. Thus, we recommend that 0.5 μM ZA be further investigated as part of a therapeutic strategy for MSC-mediated bone regeneration.
Footnotes
Acknowledgments
This work was supported by grants from Beijing Municipality Government grants (Beijing Scholar Program—PXM2016_014226_000034, PXM2016_014226_000006, PXM2015_014226_000116, PXM2015_014226_000055, PXM2015_014226_000052, PXM2014_014226_000048, PXM2014_014226_000013, PXM2014_014226_000053, Z121100005212004, PXM2013_014226_000055, PXM2013_014226_000021, PXM 2013_014226_07_000080, and TJSHG201310025005), National Natural Science Foundation of China (81300896), Beijing Municipal Natural Science Foundation (7142069), and Beijing NOVA Program (2015B062).
Author Disclosure Statement
No competing financial interests exist.
References
Supplementary Material
Please find the following supplemental material available below.
For Open Access articles published under a Creative Commons License, all supplemental material carries the same license as the article it is associated with.
For non-Open Access articles published, all supplemental material carries a non-exclusive license, and permission requests for re-use of supplemental material or any part of supplemental material shall be sent directly to the copyright owner as specified in the copyright notice associated with the article.