
Abstract
Recent findings indicate that microRNAs (miRNAs) are critical for the regulatory network of adipogenesis in human mesenchymal stem/stromal cells (MSCs). Fetal MSCs derived from amniotic fluid (AF-MSCs) represent a population of multipotent stem cells characterized by a wide range of differentiation properties that can be applied in cell-based therapies. In this study, miRNA microarray analysis was performed to assess miRNA expression in terminal differentiated AF-MSCs into adipocyte-like cells (AL cells). MiR-26a was identified in high expression levels in AL cells indicating a critical role in the process of adipogenesis. Overexpression of miR-26a in AF-MSCs led to significant induction of their adipogenic differentiation properties that were altered after miR-26a inhibition. We have demonstrated that miR-26a regulates adipogenesis through direct inhibition of PTEN, which in turn promotes activation of Akt pathway. Also, miR-26a modulates cell cycle during adipogenesis by interacting with Cyclin E1 and CDK6. These results point to the regulatory role of miR-26a and its target genes PTEN, Cyclin E1, and CDK6 in adipogenic differentiation of AF-MSCs, providing a basis for understanding the mechanisms of fat cell development and obesity.
Introduction
H
Our group has identified and characterized two distinct populations of MSCs derived from human second trimester AF, obtained during routine amniocenteses for prenatal diagnosis, termed as spindle-shaped (SS) and round-shaped (RS) AF-MSCs [6,7]. SS-AF-MSCs express the pluripotency markers SOX2 (SRY sex determination SRY region Y-box2), OCT4 (octamer-binding transcription factor 4), and homeobox transcription factor NANOG, exhibit a high proliferation rate, and differentiate in vitro into mesoderm- and endoderm-derived cells [6 –8]. More importantly, we have recently shown that adipocyte-like cells (AL cells) derived from SS-AF-MSCs can regain their plasticity [9]. In more detail, differentiated SS-AF-MSCs into AL cells can dedifferentiate into a more primitive phenotype and can also trandifferentiate into hepatocytes under certain culture conditions [9].
We have previously shown that factors released by AF-MSCs can induce liver repair due to paracrine effects and stimulate downregulation of the systemic inflammation by secretion of cytokines such as IL-10, in the acute hepatic failure NOD/SCID mouse model [10]. Therefore, AF-MSCs may represent a valuable tool in cell-based therapies as being able to facilitate tissue repair [11].
Differentiation mechanisms are regulated by various molecules and signaling pathways. Numerous studies have shown that microRNAs (miRNAs) participate in stem cell biological processes, such as lineage commitment, cell proliferation, and cell differentiation [12,13]. miRNAs are endogenous single-stranded noncoding RNAs of 19–23 nucleotides that can alter gene expression post-transcriptionally by regulating mRNA translation or its stability [14 –16]. Notably, miRNAs regulate stem cell transcription factors' expression and cell cycle, affecting in this way the differentiation potential of various types of stem cells [17,18]. Recently, the miR-26 family has been described to be dynamically expressed in human adipocytes, promoting brown adipocyte formation due to blunting of ADAM17 activity. The results of this study suggested that miR-26 can be used for miRNA-based drugs for obesity [19].
Previously, we have analyzed the miRNA profile of MSCs derived from AF, BM, and umbilical cord blood (UCB) and identified miR-21 as negative regulator of Sox2 in hMSCs, inhibiting also indirectly the expression of pluripotency genes such as Oct4 and Nanog, altering the proliferation rate, the clonogenic potential, the cell cycle, and the differentiation properties of hMSCs [18].
To further investigate the molecular determinants of MSC differentiation, we identified and compared the miRNA profile of AF-MSCs versus AL cells to distinguish miRNAs that can regulate adipogenesis of AF-MSCs. Understanding the role of miRNAs in adipogenesis of AF-MSCs is essential and may reveal an alternative mechanism for controlling adipogenic gene expression. Among the miRNAs described, we have further investigated the role of miR-26a in the differentiation properties of AF-MSCs. More importantly, in this study, we have demonstrated the role of miR-26a in cell cycle of AL cells, and the mechanism by which cell cycle regulators govern the maintenance of the differentiation potential.
Our findings suggest that miR-26a may play a crucial role in terminal adipocyte differentiation of AF-MSCs through direct inhibition of PTEN (phosphatase and tensin homolog) and regulation of the Akt pathway. In addition, it is demonstrated that miR-26a regulates the cell cycle during adipogenesis by interacting with Cyclin E1 and CDK6 (Cyclin-dependent kinase 6).
Materials and Methods
Isolation, cell culture of human AF-MSCs
AF-MSCs were isolated and cultured according to the methods described in previous studies [6 –8,10,18]. Spindle-shaped (SS) and round-shaped (RS) colonies were selected and cells were subcultured as described previously [7,9]. For all the experiments, SS-AF-MSCs already established in the laboratory were used and termed in the present study as AF-MSCs. All protocols involving human subjects were approved by the Ethics Committee of the Alexandra Hospital, Athens, Greece, the Bioethics Committee of the School of Medicine of the University of Athens, and the Bioethics Committee of Biomedical Research Foundation of the Academy of Athens (BRFAA). All samples were collected after informed consent from each individual.
Adipogenic differentiation
AF-MSCs were differentiated into AL cells using the adipogenic medium [40% DMEM-HG (Gibco-BRL), 50% F12 (Gibco-BRL), 10% rabbit serum (Sigma-Aldrich Ltd.), 10–2 μM dexamethasone (Sigma-Aldrich Ltd.), and 0.5 mg/ml insulin (Sigma-Aldrich Ltd.)] as previously described [6,7,18]. The adipogenic assay was carried out for 21 days. In addition, SS-AF-MSCs were transfected with the miR-26a inhibitor or scramble inhibitor (Exiqon A/S), or transduced with miR-26a or EF1 lentivirus and further cultured in adipogenic media for 3 days and 21 days, respectively.
In addition, SS-AF-MSCs were cultured in adipogenic media for 21 days containing 60 μM of a small-molecular-weight c-MYC inhibitor (10058-F4; Sigma-Aldrich Ltd.), which had been dissolved in dimethylsulfoxide (DMSO) to a stock concentration of 10 mM, according to the manufacturer's instructions.
For the quantification of the adipogenic differentiation, intracellular lipid droplets were stained with Oil Red O reagent (Sigma-Aldrich Ltd.) and destaining was performed by adding 1 mL of isopropyl alcohol (Sigma- Aldrich Ltd.) and measured at 500 nm using a spectrophotometer.
miRNA microarray and data analysis
Total RNA from 2 AF-MSCs and 2 AL cell samples, respectively, were extracted using the TRIzol reagent according to the manufacturer's protocol (Invitrogen Ltd.). The miRCURY™ Hy3™/Hy5™ labeling kit (Exiqon A/S) was used to label the samples and hybridization was performed on the miRCURY LNA Array (v.10) (Exiqon A/S), updated to miRBase release 11 annotation at the Wellcome Trust Sanger Institute. The expression matrix contains normalized Hy3/Hy5 ratios of miRNAs that were found to be more than twofold differentially regulated between the two sample pools in the dye swap. The miRNA microarray data are available in the Gene Expression Omnibus database (submission number GSE86388). Fold expression was calculated as POWER [2;LogMedianRatios log2(Hy3/Hy5)] for each miRNA tested.
Real-time quantitative PCR
For miRNA real-time quantitative PCR, 50 ng RNA was reverse transcribed to cDNA using the TaqMan MicroRNA Transcription Kit (Applied Biosystems), with individual stem cell loop TaqMan primers for hsa-miR-26a and hsa-miR-34a (Applied Biosystems). The RNU44 TaqMan real-time probe (Applied Biosystems) was used as internal control.
cDNA synthesis was performed using 1 μg of total RNA from each sample using random primers and the M-MLV Reverse Transcriptase-RNase H Minus kit (Promega Ltd.). TaqMan real-time PCR was performed for Sox2, Oct4, and Nanog genes according to the manufacturer's protocol (Assays on Demand™, Gene Expression Products; Applied Biosystems). The expression of Sox2, Oct4, and Nanog was normalized to GAPDH internal control (Applied Biosystems). Gene-specific primers for Cyclin D1 (CCND1), Cyclin E1 (CCNE1), Cyclin E2 (CCNE2), Cyclin A2 (CCNA2), Cyclin B2 (CCNB2), CDK2, CDK4, CDK6, p18, p27, PPARg, and FABP4 (Invitrogen Ltd.) were mixed with the SYBR Green PCR master mix according to the manufacturer's protocol (Kapa Biosystems). The primer sequences are described in Supplementary Table S1 (Supplementary Data are available online at
Real-time quantitative PCR analyses were performed using the ABI Prism 7700 SDS software (Applied Biosystems). Data were analyzed by the relative quantification (ΔΔCt) method and the fold change difference in expression was determined using the formula of 2−ΔΔCt as described in our previous studies [7,18,20].
Western blot
Total protein was isolated from all samples using lysis buffer [20 mM Tris-HCl pH8.0, 150 mM NaCl, 5 mM EDTA, 1% NP40, 10% glycerol, 1 mM PMSF, 10 μL cocktail inhibitors (Sigma-Aldrich Ltd.)] for 1 h at 4°C. The suspension was centrifuged at 13,000 rpm for 20 min and the supernatants were collected. Protein concentration was estimated by the use of Bradford reagent (BioRad).
Extracts were separated by 10% SDS-PAGE, transferred to Hybond-ECL NC membranes (Amersham Biosciences), and probed with the following antibodies: anti-CCND1 (RM9104; Thermo Fisher Scientific, Inc.), anti-CCNE (sc198; Santa Cruz Biotechnology, Inc.), anti-CCNA (sc239; Santa Cruz Biotechnology, Inc.), anti-CDK4 (07–659; Merck KGaA), anti-CDK6 (MABC280; Merck KGaA), anti-pAkt (9271; Cell Signaling Technology, Inc.), anti-Akt (9272; Cell Signaling Technology, Inc.), anti-c-myc (ab32072; Abcam) and anti-PTEN (91885; Cell Signaling Technology, Inc.). A mouse anti-tubulin antibody (T4026; Sigma-Aldrich Ltd.) or b-actin (A1978; Sigma-Aldrich Ltd.) was used as a control.
The membranes were then incubated with an anti-mouse HRP-conjugated secondary antibody (A4416; Sigma-Aldrich Ltd.) or anti-rabbit HRP-conjugated secondary antibody (A0545; Sigma-Aldrich Ltd.) and developed using the ECL detection system (Thermo Fisher Scientific, Inc.). Quantification was performed using Quantity One software (BioRad Laboratories, Inc.).
Lentiviral vector construction and transduction of AF-MSCs
The four plasmid expression lentiviral system was used to enhance miR-26a expression. The construction of the lentiviral vector expressing the human pre-miR-26a and the production of miR-26a or EF1 (empty vector) viruses were performed, as described in our previous studies [18].
In more detail, pCCLsin.cPPT.hEF1a.DLNGFR.Wpre plasmid, which includes the elongation factor 1a (EF1a), was used to induce miR-26a expression [21]. The pre-miR-26a-1 sequence, from the genomic locus miR-26a-1, which resides in the introns of the gene coding for CTDSPL, was amplified by polymerase chain reaction from human genomic DNA using the following primers: forward 5′-CCTGGCAC GCGTGTGATATCACAAGGTCCCA-3′ and reverse 5′-TGG ACGGCTAGCTTTGCTACATGCAAAGGGC-3′. miR-26a or EF1 (empty vector) viruses were produced by transient transfection of HEK293T cells and collected with Amicon Ultra Centrifugal Filters-100K Units (Merck), as previously described [18]. Infection of HT1080 cells with serial dilutions of the concentrated viral stock was conducted to determine the lentiviral titers.
The pCCLsin.cPPT.hEF1a.DLNGFR.Wpre plasmid contained a complementary DNA sequence for the low-affinity nerve growth factor receptor (DLNGFR) that can be used as a positive expression marker. NGFR-positive cells were identified by fluorescence-activated cell sorting (FACS) analysis using a PE mouse anti-human CD271 antibody (BD Biosciences) and a Beckman Coulter Cytomics FC500 flow cytometer (Beckman Coulter). Titers ranged from 106 to 5 × 10⁶ infectious units (IU)/mL. For the transduction, 2.5 × 10⁴ AF-MSCs/well were seeded in a 12-well plate and lentivirus was added in a multiplicity of infection (MOI) of 4. Seven days after, FACS analysis was performed to identify NGFR-positive cells followed by cell sorting using a FACS Aria cell sorter (BD Biosciences). Cell sorting efficiency was determined greater than 98%.
miR-26a inhibitor and/or shPTEN transfection
AF-MSCs were transfected with 0.3 μM miR-26a inhibitor (Exiqon A/S) and/or with pLKO.1-sh-PTEN using Lipofectamine 2000 reagent according to the manufacturer's protocol (Invitrogen Ltd.). miR-26a scramble sequence (Exiqon A/S) and/or pLKO.1-sh-control plasmid were used as control. Transfection was conducted and cells were cultured in adipogenic media. Three days after Oil Red O staining, RNA and protein extraction was performed.
MTS proliferation assay
AF-MSCs expressing miR-26a or EF1, sorted for NGFR, were plated at a density of 103/well in a 96-well plate and cultured for 3, 7, and 10 days, respectively. Appropriate amount of MTS reagent (Promega Ltd.) was added to each well and incubated for 3 h. The absorbance was recorded at 490 nm using an ELISA plate reader (ELX 800; BioTek Instruments, Inc.). The percentage increase of proliferation was calculated using the following formula: [(ODdayx-ODday0)/ODday0x100)].
Cell cycle analysis
Transduced AF-MSCs, with miR-26a or EF1 lentivirus sorted for NGFR, were fixed and stained with propidium iodide (Sigma-Aldrich Ltd.), as described in our previous published studies [18]. Cells were analyzed by flow cytometry using the Beckman Coulter Cytomics FC 500 flow cytometer (Beckman Coulter Ltd.). Nuclear debris and overlapping nuclei were gated out.
Statistics
Three independent experiments were performed for each experiment; each including appropriate number of replicates, and the mean was calculated. Error bars in all cases indicate standard deviation. Student t-test was performed to determine statistical significance and P-values were indicated in the figures where (*) represents P < 0.05, (**) represents P < 0.01, and (***) represents P < 0.001. For experiments including miR-26a inhibitor, two independent western blot and real-time PCR experiments were performed, each including three replicates.
Results
Analysis of miRNA patterns in AF-MSCs versus AL cells
We have previously analyzed the miRNA profile of MSCs derived from AF, BM, and UCB revealing miR-21 to be a key molecule determining MSC proliferation and differentiation properties [18]. As a next step, we have attempted to analyze the post-transcriptional pattern of AF-MSCs and differentiated AF-MSCs to AL cells. Initially, we performed an miRNA microarray (miRCURY™ LNA Array v.10) analysis of AF-MSC and AL samples, each sample hybridized to the captured probes against the other. Significantly, the miRNAs that were found to be more than twofold up- or downregulated in one or more slides were considered as differentially expressed candidates.
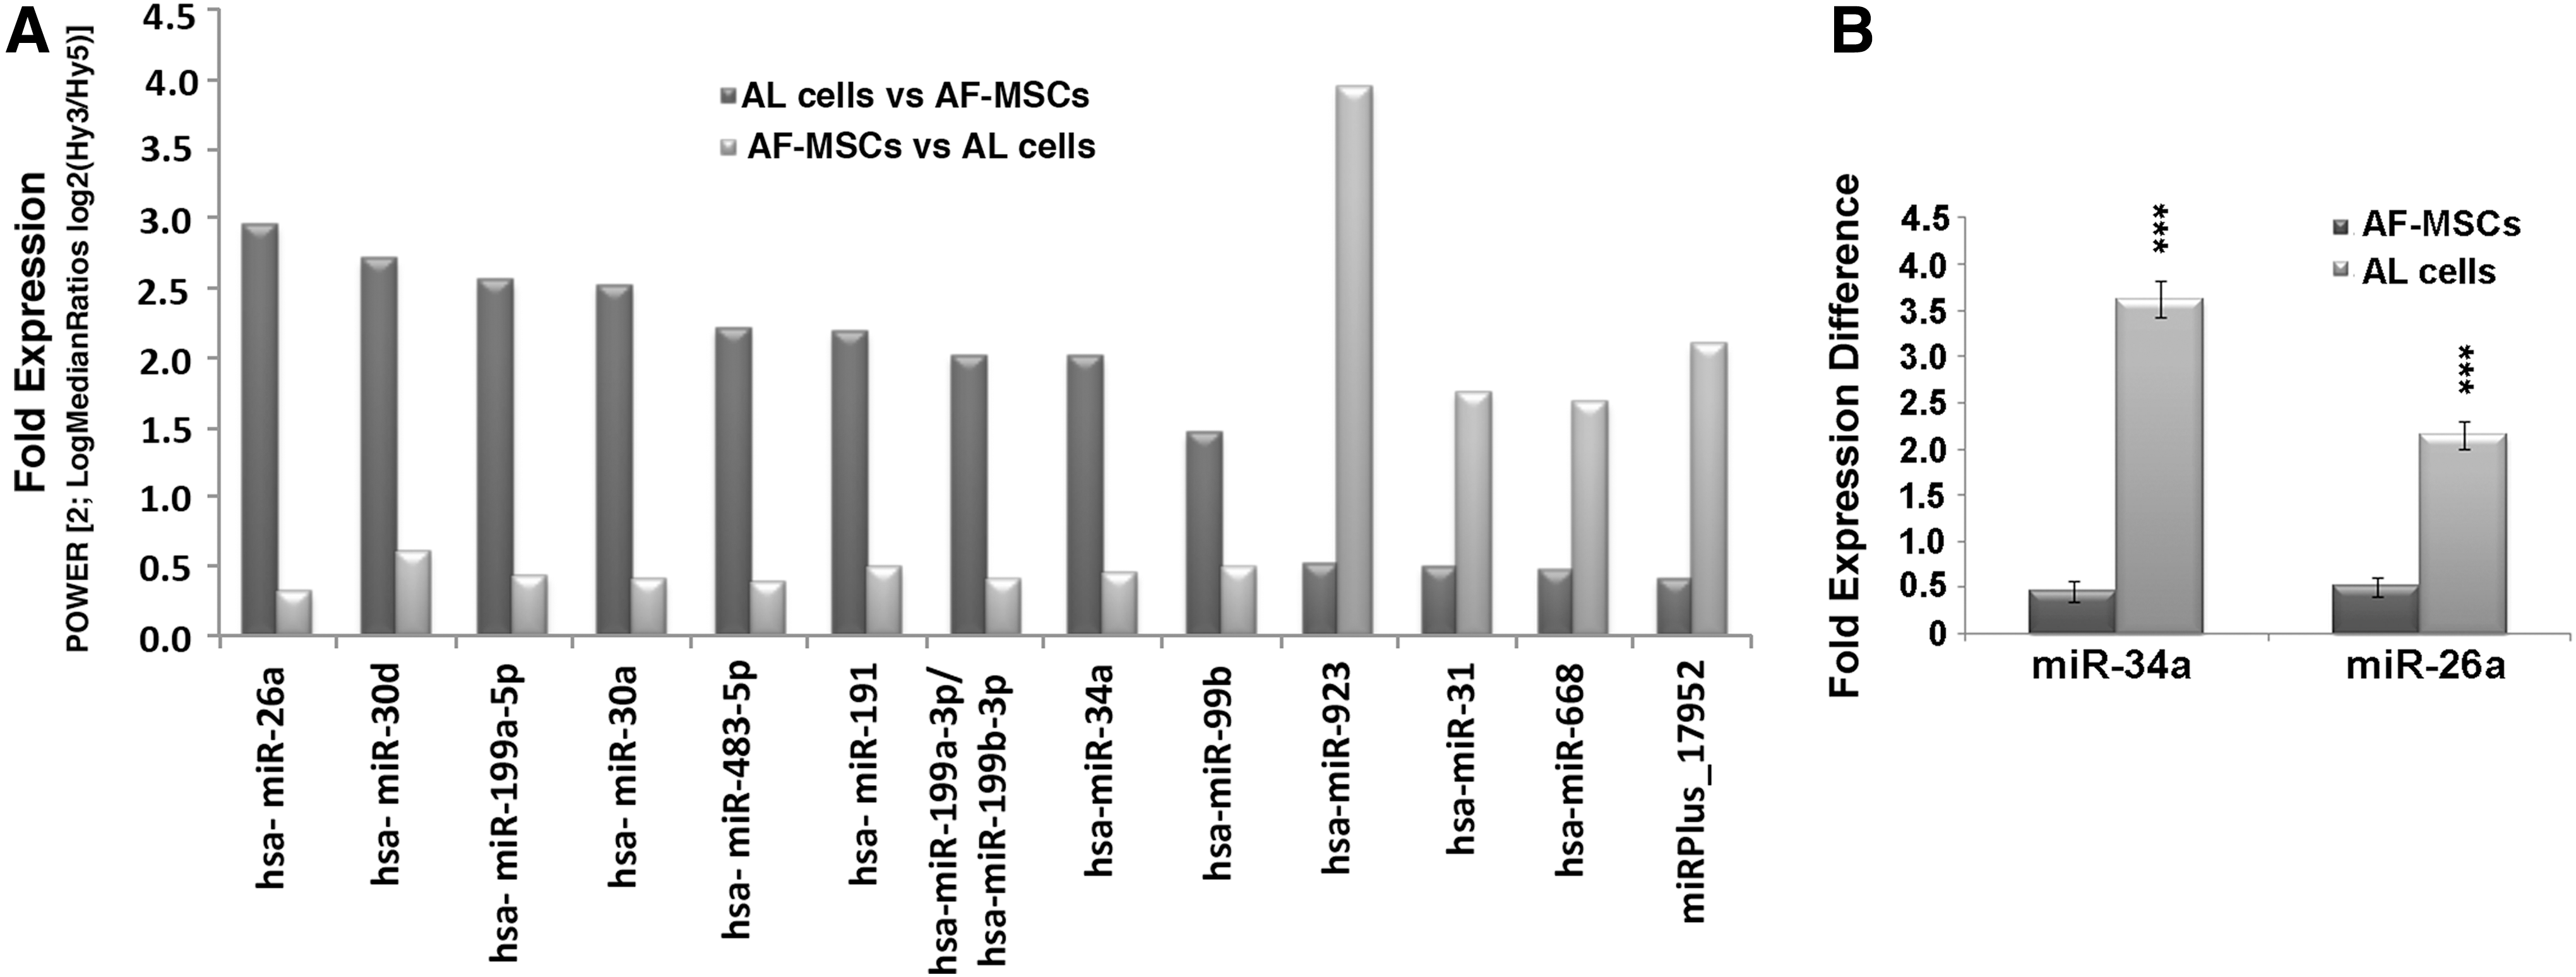
The miRNA profile revealed 13 differentially expressed miRNAs between AF-MSCs and AL cells (Fig. 1A). The expression matrix contains the normalized Hy3/Hy5 ratios (log2 transformed) from all of the hybridizations (Supplementary Table S2). Specifically, 4 miRNAs were expressed in higher levels in AF-MSCs, whereas 9 miRNAs in AL cells, respectively. To validate the microarray results, we performed real-time PCR analysis for selected differentially expressed miRNAs, such as hsa-miR-26a, which was found to be the most highly expressed miRNA in AL cells, and hsa-miR-34a, which has been previously reported to be implicated in adipogenesis [22] (Fig. 1B).
miRNA profile of AF-MSCs and AL cells.
miR-26a induction promotes adipogenesis
Based on these findings, we focused on miR-26a, which was the most highly expressed microRNA (7.7-fold expression) in AL cells compared with AF-MSCs (Fig. 1A). To determine the role of miR-26a in adipogenesis of AF-MSCs, we overexpressed miR-26a in AF-MSCs by using a lentiviral system and induced adipogenesis using the appropriate differentiation media.
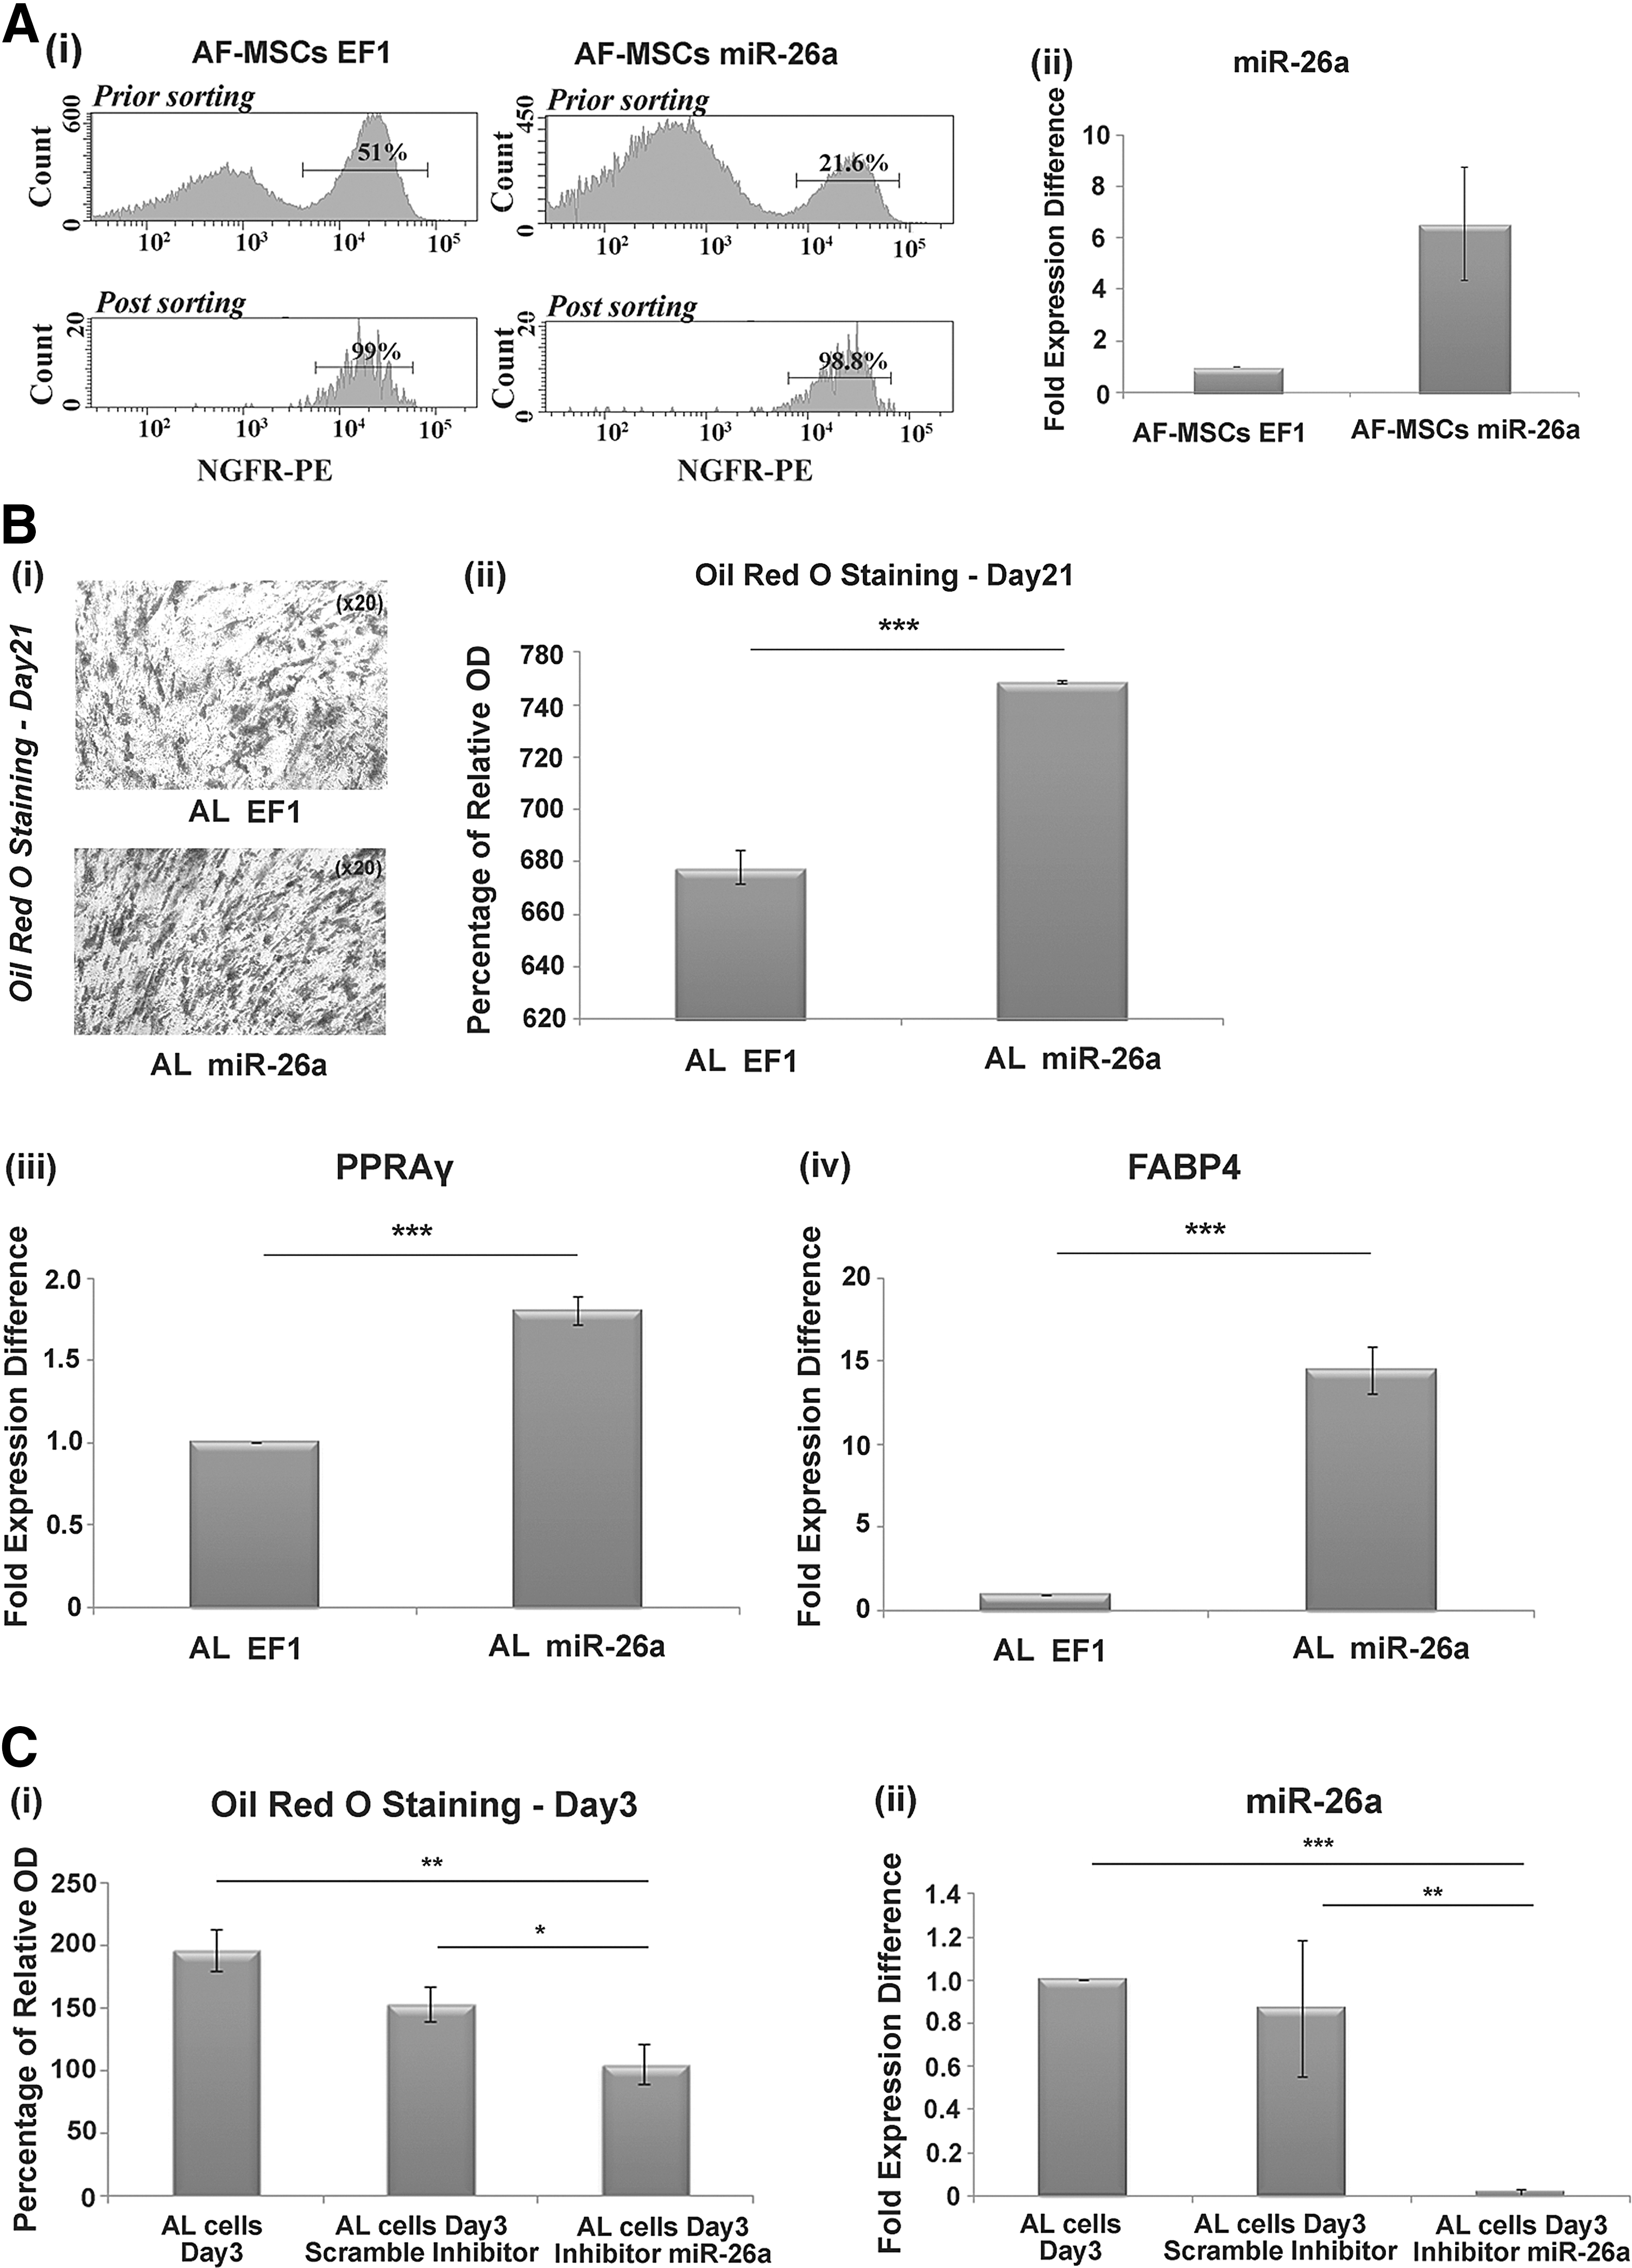
In more detail, AF-MSCs were transduced with miR-26a lentivirus at MOI of four and sorted for NGFR (98% efficiency) (Fig. 2A i). The miR-26a expression levels in the transduced AF-MSCs (AF-MSCs-miR26a) were 4.1–8.7-folds higher than in the control cells (AF-MSCs-EF1) (Fig. 2A ii). An increased number of oil droplets were observed in AL cells overexpressing miR-26a (AL-miR-26a cells) compared with EF1-transduced cells (AL-EF1 cells), after 21 days in adipogenic inducing media (Fig. 2B i). Consistently, the relative expression of adipogenic differentiation markers such as PPARg (1.9 ± 0.1-fold expression difference) and FABP4 (14.4 ± 1.4-fold expression difference) was increased in AL-miR-26a compared with AL-EF1 cells during differentiation, as determined by real-time PCR (Fig. 2A iii, iv).
miR-26a induction in AL cells increases adipogenesis.
In addition, we transfected AF-MSCs with miR-26a inhibitor in adipogenic media, to further explore the regulatory role of miR-26a in adipogenesis. A decreased percentage of Oil Red O staining was observed in AL cells (Day 3) transfected with miR-26a inhibitor (104 ± 15 percentage of relative difference) compared with cells transfected with a scrambled sequence (153 ± 14 percentage of relative difference) and with untransfected AL cells (195 ± 17 percentage of relative difference) (Fig. 2C i). miR-26a expression was decreased in AL cells transfected with the inhibitor (0.02 ± 0.01-fold expression difference) compared with cells transfected with a scrambled sequence of the miR-26a inhibitor (0.86 ± 0.1-fold expression difference) (Fig. 2C ii). These findings clearly indicate that miR-26a accelerates adipogenesis in AF-MSCs.
miR-26a induction in adipogenesis altered the expression levels of PTEN and the phosphorylation of Akt
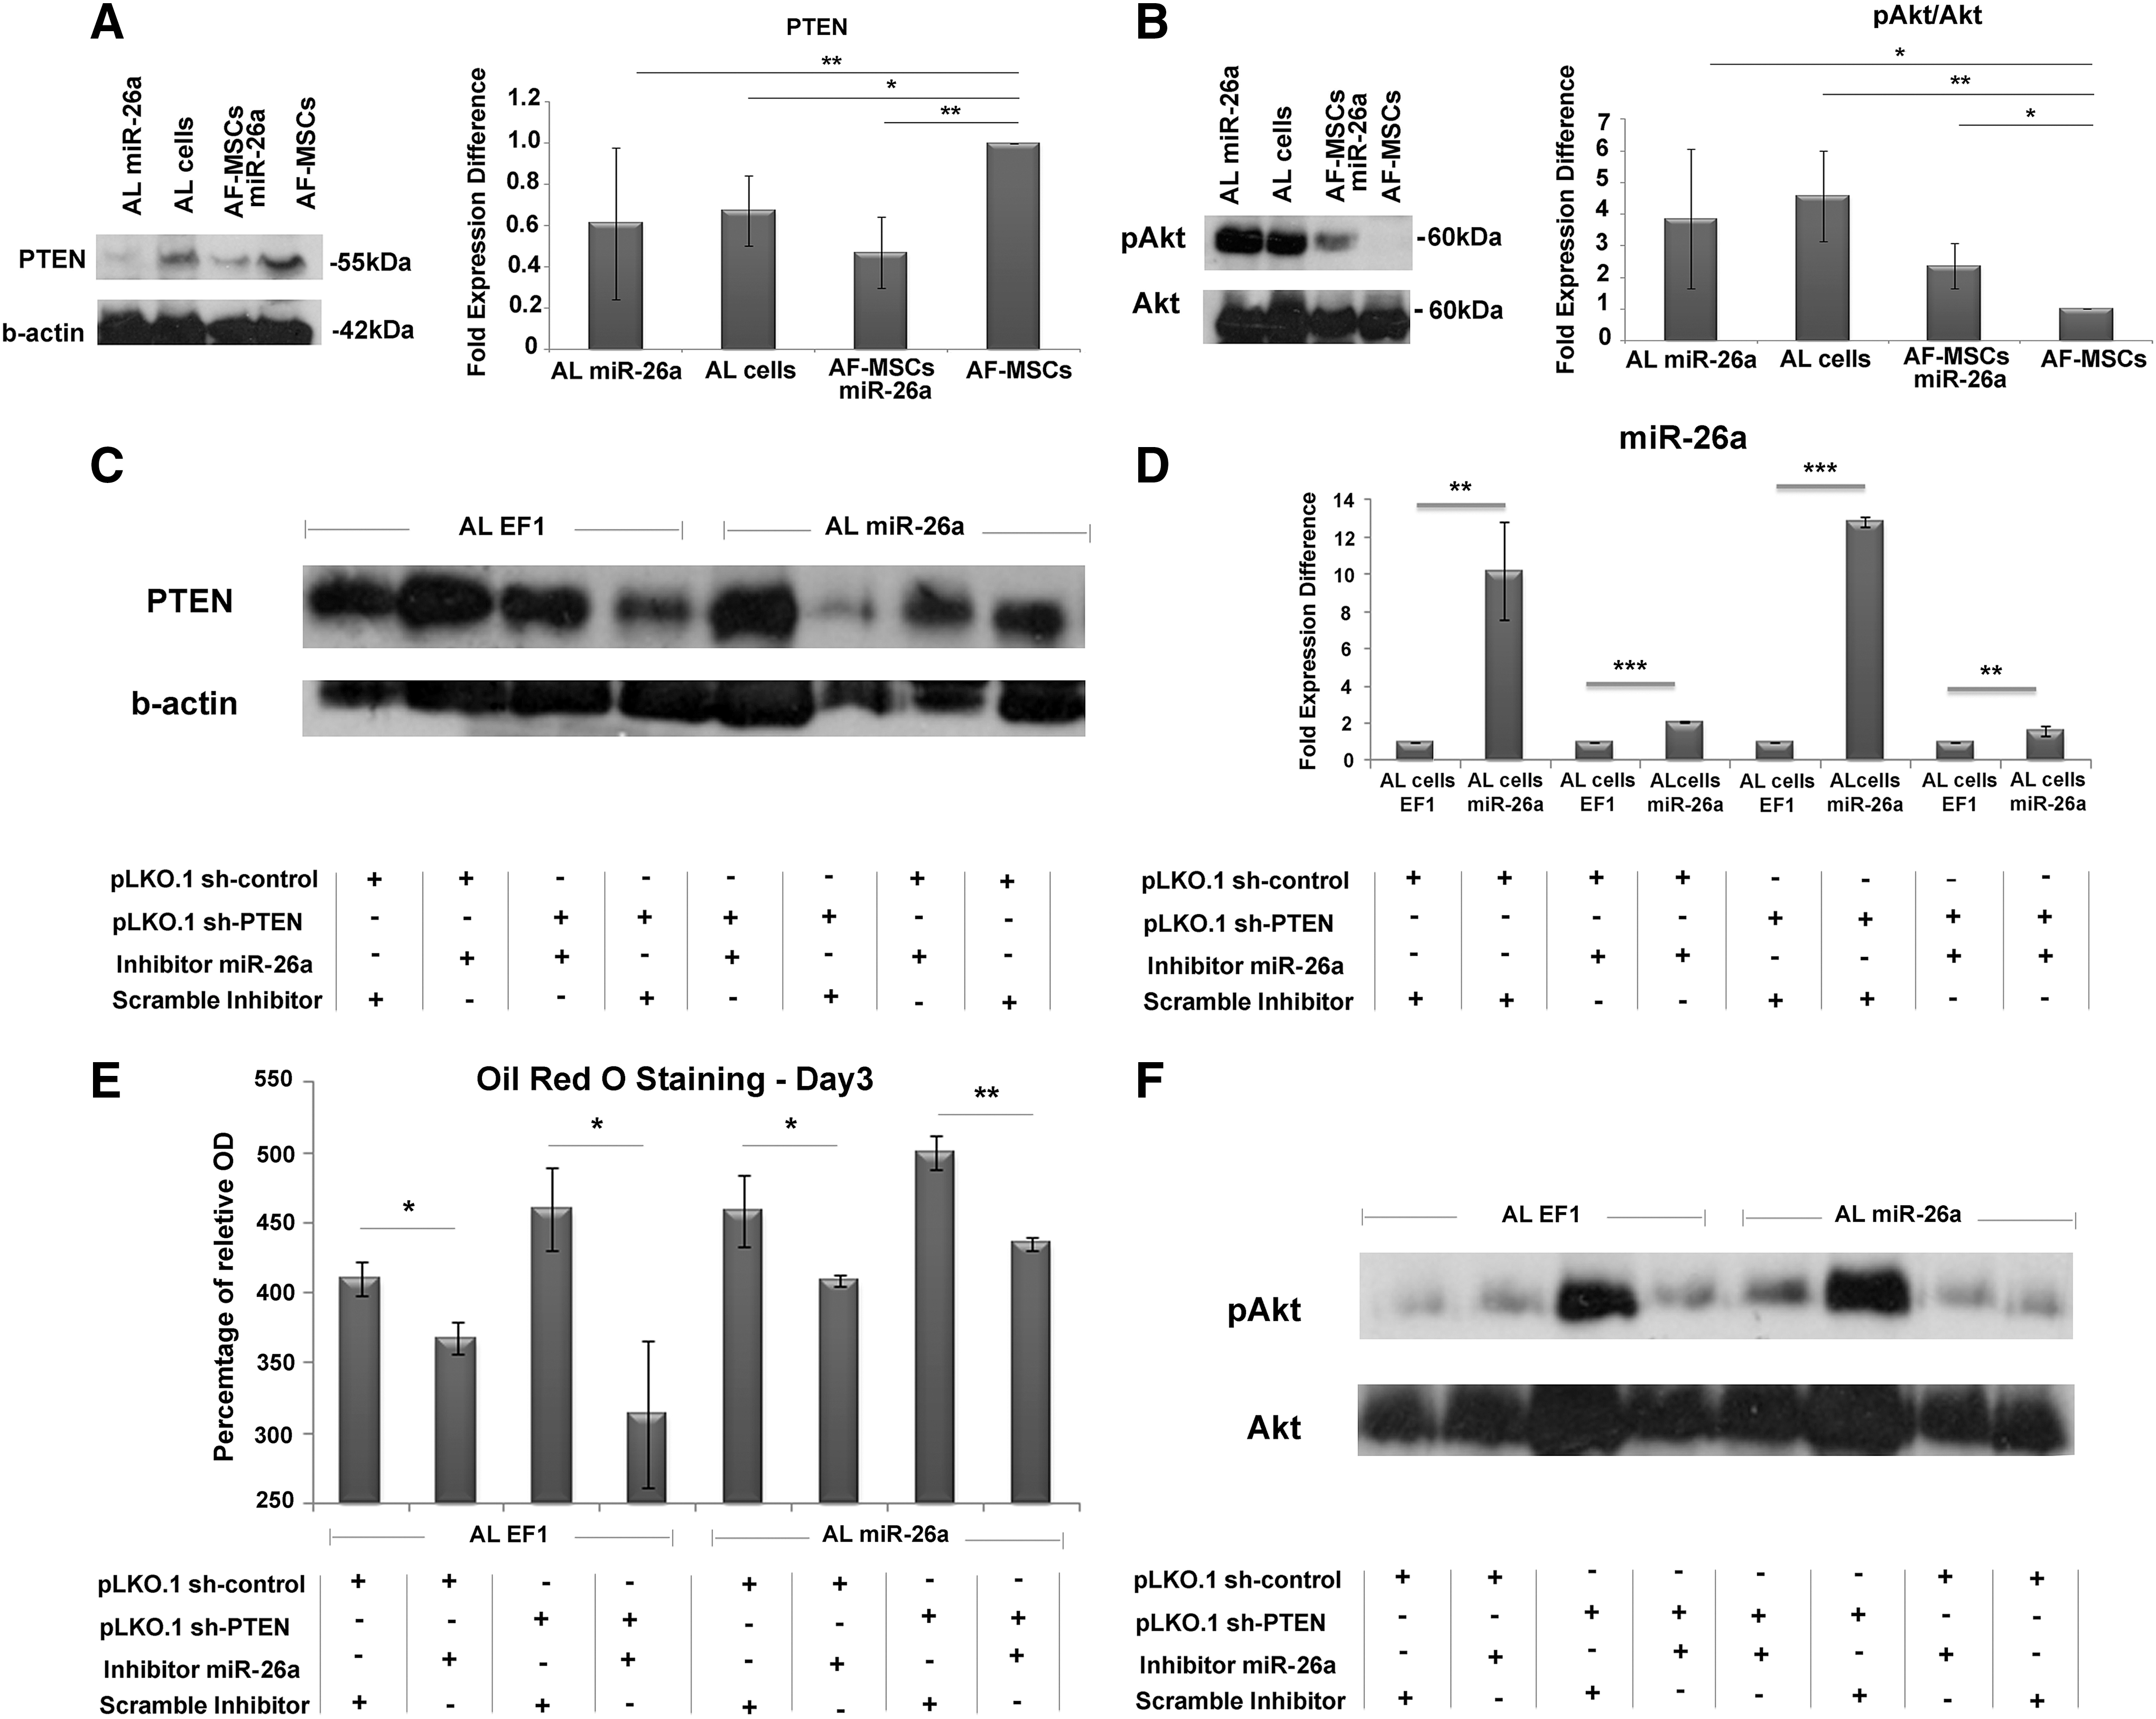
An extensive bioinformatics analysis of miR-26a using miRTarBase (Release 6.0) indicated a list of experimentally validated target genes (Supplementary Table S3). PTEN is the most well-known validated target gene of miR-26a [23]. To determine PTEN expression on miR-26a induction in our system, we performed western blot analysis for PTEN in AF-MSCs, AF-MSCs-miR-26a, and AL and AL-miR-26a cells. A statistically significant decrease in PTEN expression was observed in AL cells (0.67 ± 0.17-fold expression difference), in AL-miR-26a cells (0.61 ± 0.34-fold expression difference), and in AF-MSCs-miR-26a (0.47 ± 0.17-fold expression difference) compared with AF-MSCs (Fig. 3A).
miR-26a induction in adipogenesis altered the expression levels of PTEN and pAkt.
PTEN is known to be a negative regulator of the Akt pathway and it has been shown to play a crucial role during the adipocyte differentiation of hBM-MSCs [24,25]. Recently, studies have shown that the levels of the components of the Akt pathway and its downstream molecules are exhibiting increased expression during differentiation of MSCs into adipocytes [25].
Similarly, we observed a significant increase in the phosphorylation of Akt in AL cells (4.56 ± 1.5-fold expression difference) and AL-miR-26a cells (2.36 ± 0.7-fold expression difference) compared with AF-MSCs (Fig. 3B).
To test whether adipogenesis was mediated through direct inhibition of PTEN by miR-26a, we performed rescue experiments. AL-EF1 cells and AL-miR-26a cells were transfected with miR-26a inhibitor and pLKO.1-shPTEN in the presence of adipogenic inducing media. As expected, the expression levels of PTEN were rescued in the presence of miR-26a inhibitor and pLKO.1-shPTEN in AL-EF1 and AL-miR-26a cells (Fig. 3C).
Next, we performed real-time PCR for determining the miR-26a expression levels in the presence of pLKO.1-shPTEN and/or miR-26a inhibitor. A significant decrease in miR-26a expression levels was detected in the presence of miR-26a inhibitor only, whereas PTEN silencing had no effect on miR-26a expression levels (Fig. 3D). In addition, an increased percentage of Oil Red O staining was observed in AL-EF1 and AL-miR-26a cells (Day 3) transfected with pLKO.1-shPTEN and scramble inhibitor (Fig. 3E). Finally, a significant increase in the phosphorylation of Akt was exhibited in AL-EF1 and AL-miR26a cells following simultaneous transfection of pLKO.1-shPTEN and scramble inhibitor (Fig. 3F).
c-MYC interaction with miR-26a during adipogenesis
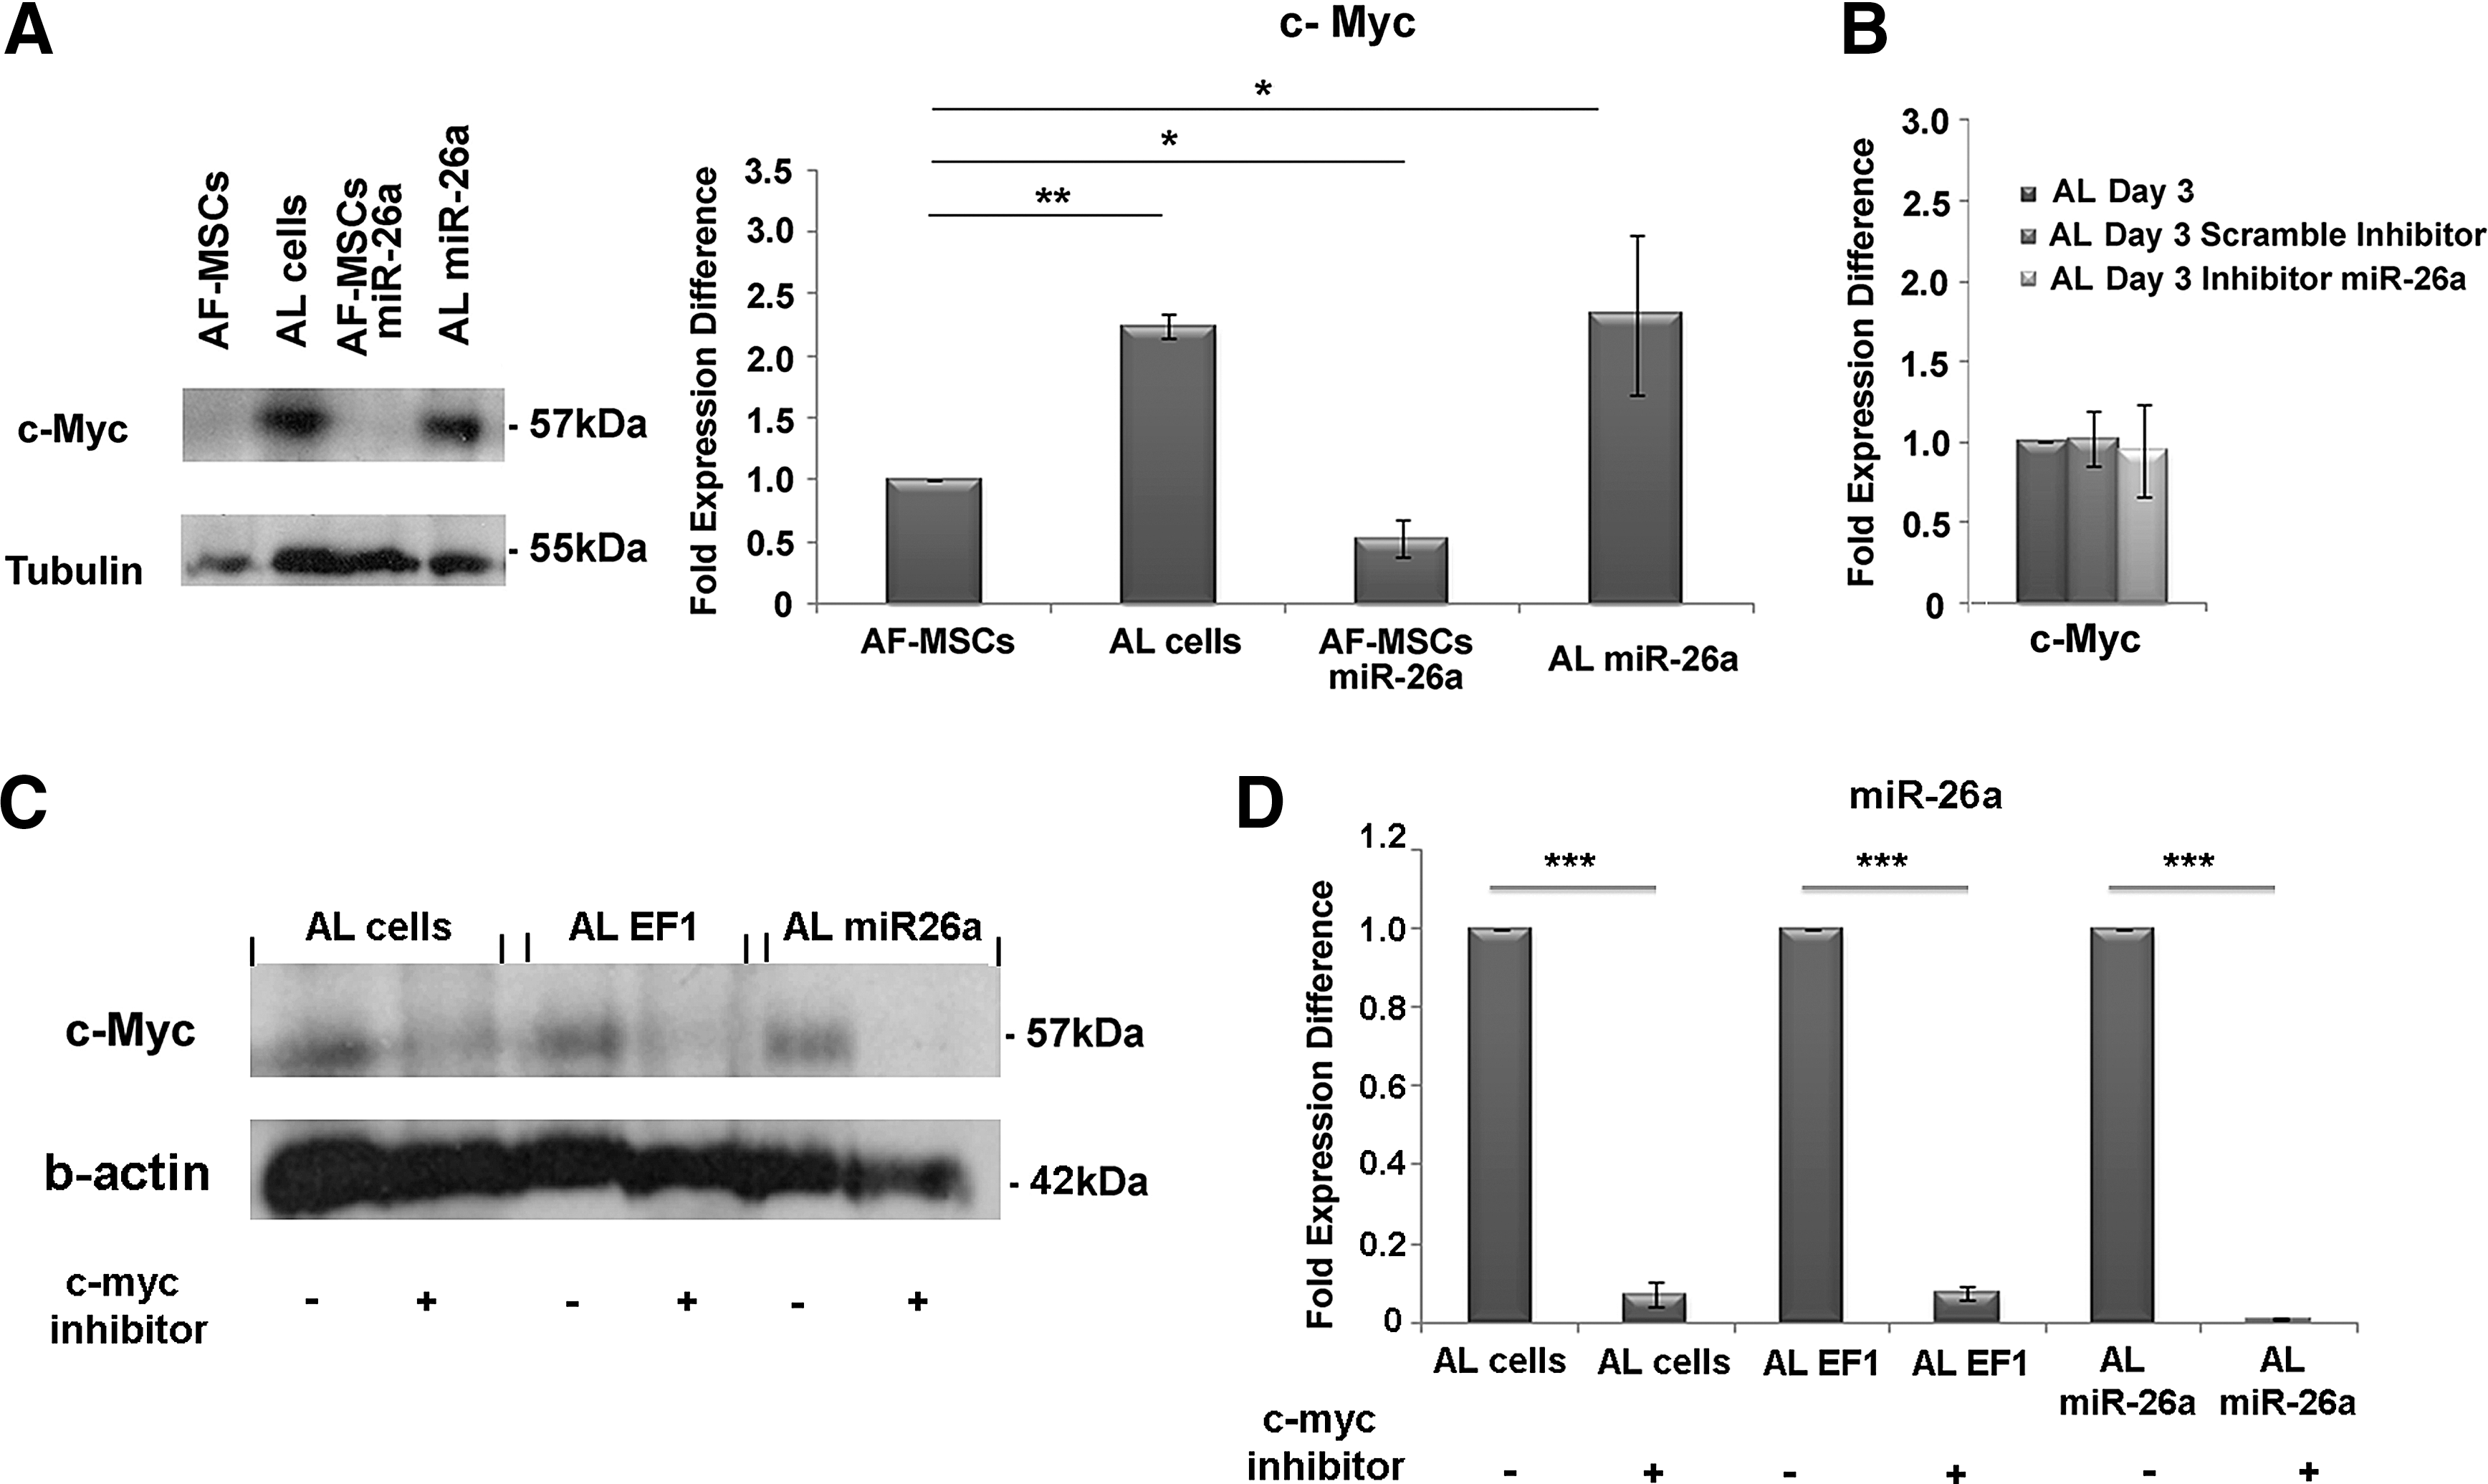
Recent studies have demonstrated that c-MYC reprograms miRNA expression, affecting several cellular functions [26], and more importantly that c-MYC transcriptionally activates PTEN [27]. For this reason, western blot analysis was performed for c-MYC in AF-MSCs, AF-MSCs-miR-26a, and AL and AL-miR-26a cells. A statistically significant increase in c-MYC expression was observed in AL cells (2.23 ± 0.1-fold expression difference) and AL-miR-26a cells (2.33 ± 0.6-fold expression difference) compared with AF-MSCs (Fig. 4A). It was evident that no alteration in the expression levels of c-MYC was observed after miR-26a inhibition (0.94 ± 0.3-fold expression difference) (Fig. 4B).
c-MYC expression in AL cells.
To study the effect of c-MYC in the miR-26a expression during adipogenesis, treatment of AF-MSCs with a c-MYC inhibitor was performed. After 21 days, a significant decrease in the expression levels of c-MYC was observed in AL, AL-EF1, and AL-miR26a cells cultured in the presence of the c-MYC inhibitor (Fig. 4C). Notably, the expression levels of miR-26a were significant reduced in AL, AL-EF1, and AL-miR26a cells (Fig. 4D).
Analysis of cell cycle-related genes in adipogenesis
MSCs undergo terminal differentiation into adipocytes in response to insulin and dexamethasone [28]. During the adipogenic differentiation process, cell cycle arrest [29] and induction of the expression of specific genes (PPARg and CCAAT/enhancer blinding protein α- C/EBPα) result in accumulation of fat droplets in cytosol [30]. Activated PPARg during differentiation is tightly inherent with exit from the cell cycle and expression of adipogenic-specific genes [30,31]. Notably, cell cycle arrest is as important as the induction of transcription factors and adipogenic genes in adipocyte differentiation, but it is not sufficient to induce adipogenesis [30].
Among the experimentally validated targets of miR-26a identified by using miRTarBase (Release 6.0), Cyclin E1 and CDK6 represent two direct target genes of miR-26a [32] (Supplementary Table S3). It is well known that Cyclin D/CDK4 and CDK6 complexes appear to be crucial for the progression through early G1 phase, while Cyclin E/CDK2 and Cyclin A/CDK2 complexes are critical for the late G1 phase and S-phase entry [31]. Real-time PCR analysis was performed for Cyclin D1 (CCND1), Cyclin E1 (CCNE1), Cyclin E2 (CCNE2), Cyclin A2 (CCNA2), and Cyclin B2 (CCNB2) in AF-MSCs and AL cells. A significant reduction in the expression levels of these cyclins was observed in AL cells (CCND1: 0.3 ± 0.03, CCNE1: 0.5 ± 0.1, CCNE2: 0.2 ± 0.01, CCNA2: 0.03 ± 0.004, CCNB2: 0.04 ± 0.01-fold expression difference) compared with AF-MSCs (Fig. 5A i).
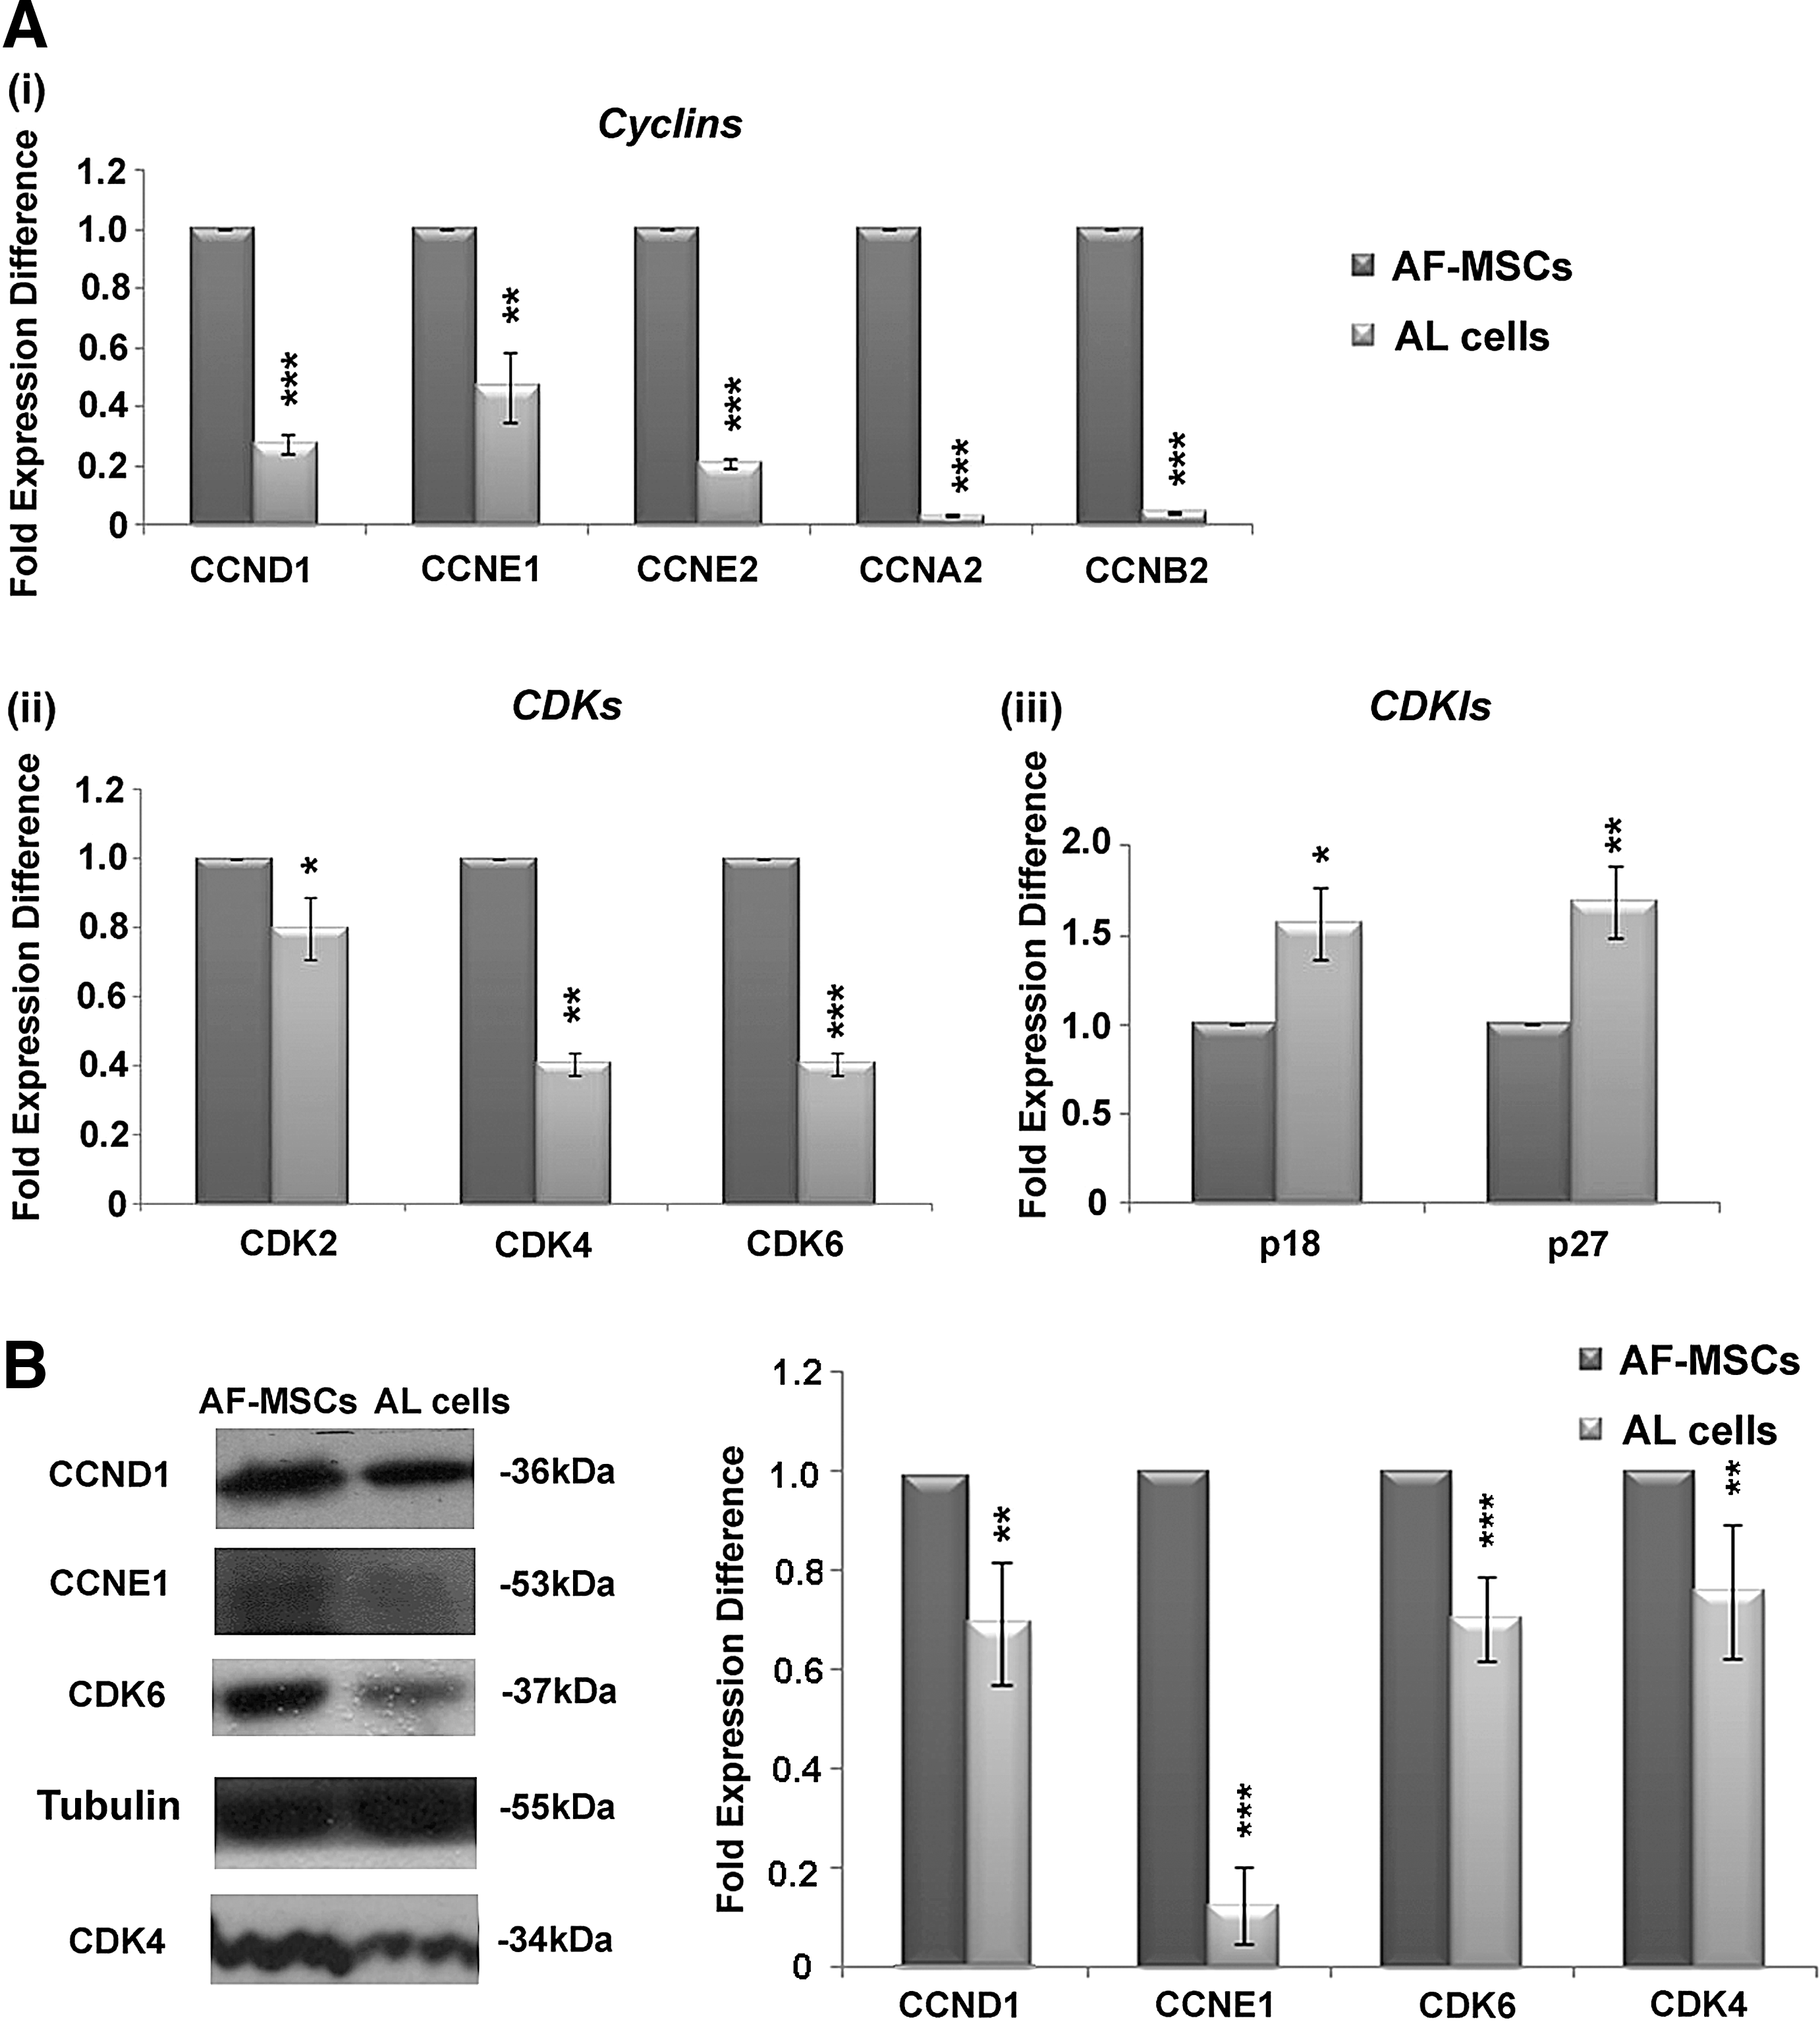
Cyclin, CDK, and CDKI expression levels in AL cells.
In addition, the expression levels of CDK2 (0.79 ± 0.08-fold expression difference), CDK4 (0.4 ± 0.03-fold expression difference), and CDK6 (0.44 ± 0.03-fold expression difference) exhibited a significant decrease in AL cells compared with AF-MSCs (Fig. 5A ii). Accordingly, an increase in the expression of cyclin-dependent kinase inhibitors (CDKIs), such as p27 (CDKN1B) (1.57 ± 0.2-fold expression difference) and p18 (CDKN2C) (1.69 ± 0.19-fold expression difference), was also evident in AL cells compared with AF-MSCs (Fig. 5A iii). Moreover, western blot analysis for Cyclin D1 (0.69 ± 0.12-fold expression difference), Cyclin E1 (0.12 ± 0.07-fold expression difference), CDK4 (0.75 ± 0.13-fold expression difference), and CDK6 (0.7 ± 0.08-fold expression difference) in AL cells exhibited similar reduction in protein expression levels compared with AF-MSCs (Fig. 5B).
miR-26a inhibits G1/S transition in AF-MSCs
To analyze the role of miR-26a in the proliferation of AF-MSCs, MTS assay was performed on days 3, 7, and 10. MiR-26a induction in AF-MSCs caused a significant decrease in the proliferation rate compared with AF-MSCs-EF1 (Fig. 6A). In addition, a statistically significant decrease in Sox2 (0.8 ± 0.001-fold expression difference), Oct4 (0.58 ± 0.1-fold expression difference), and Nanog (0.4 ± 0.01-fold expression difference) expression at mRNA level was observed in AF-MSCs-miR-26a compared with AF-MSCs-EF1 (Fig. 6B).
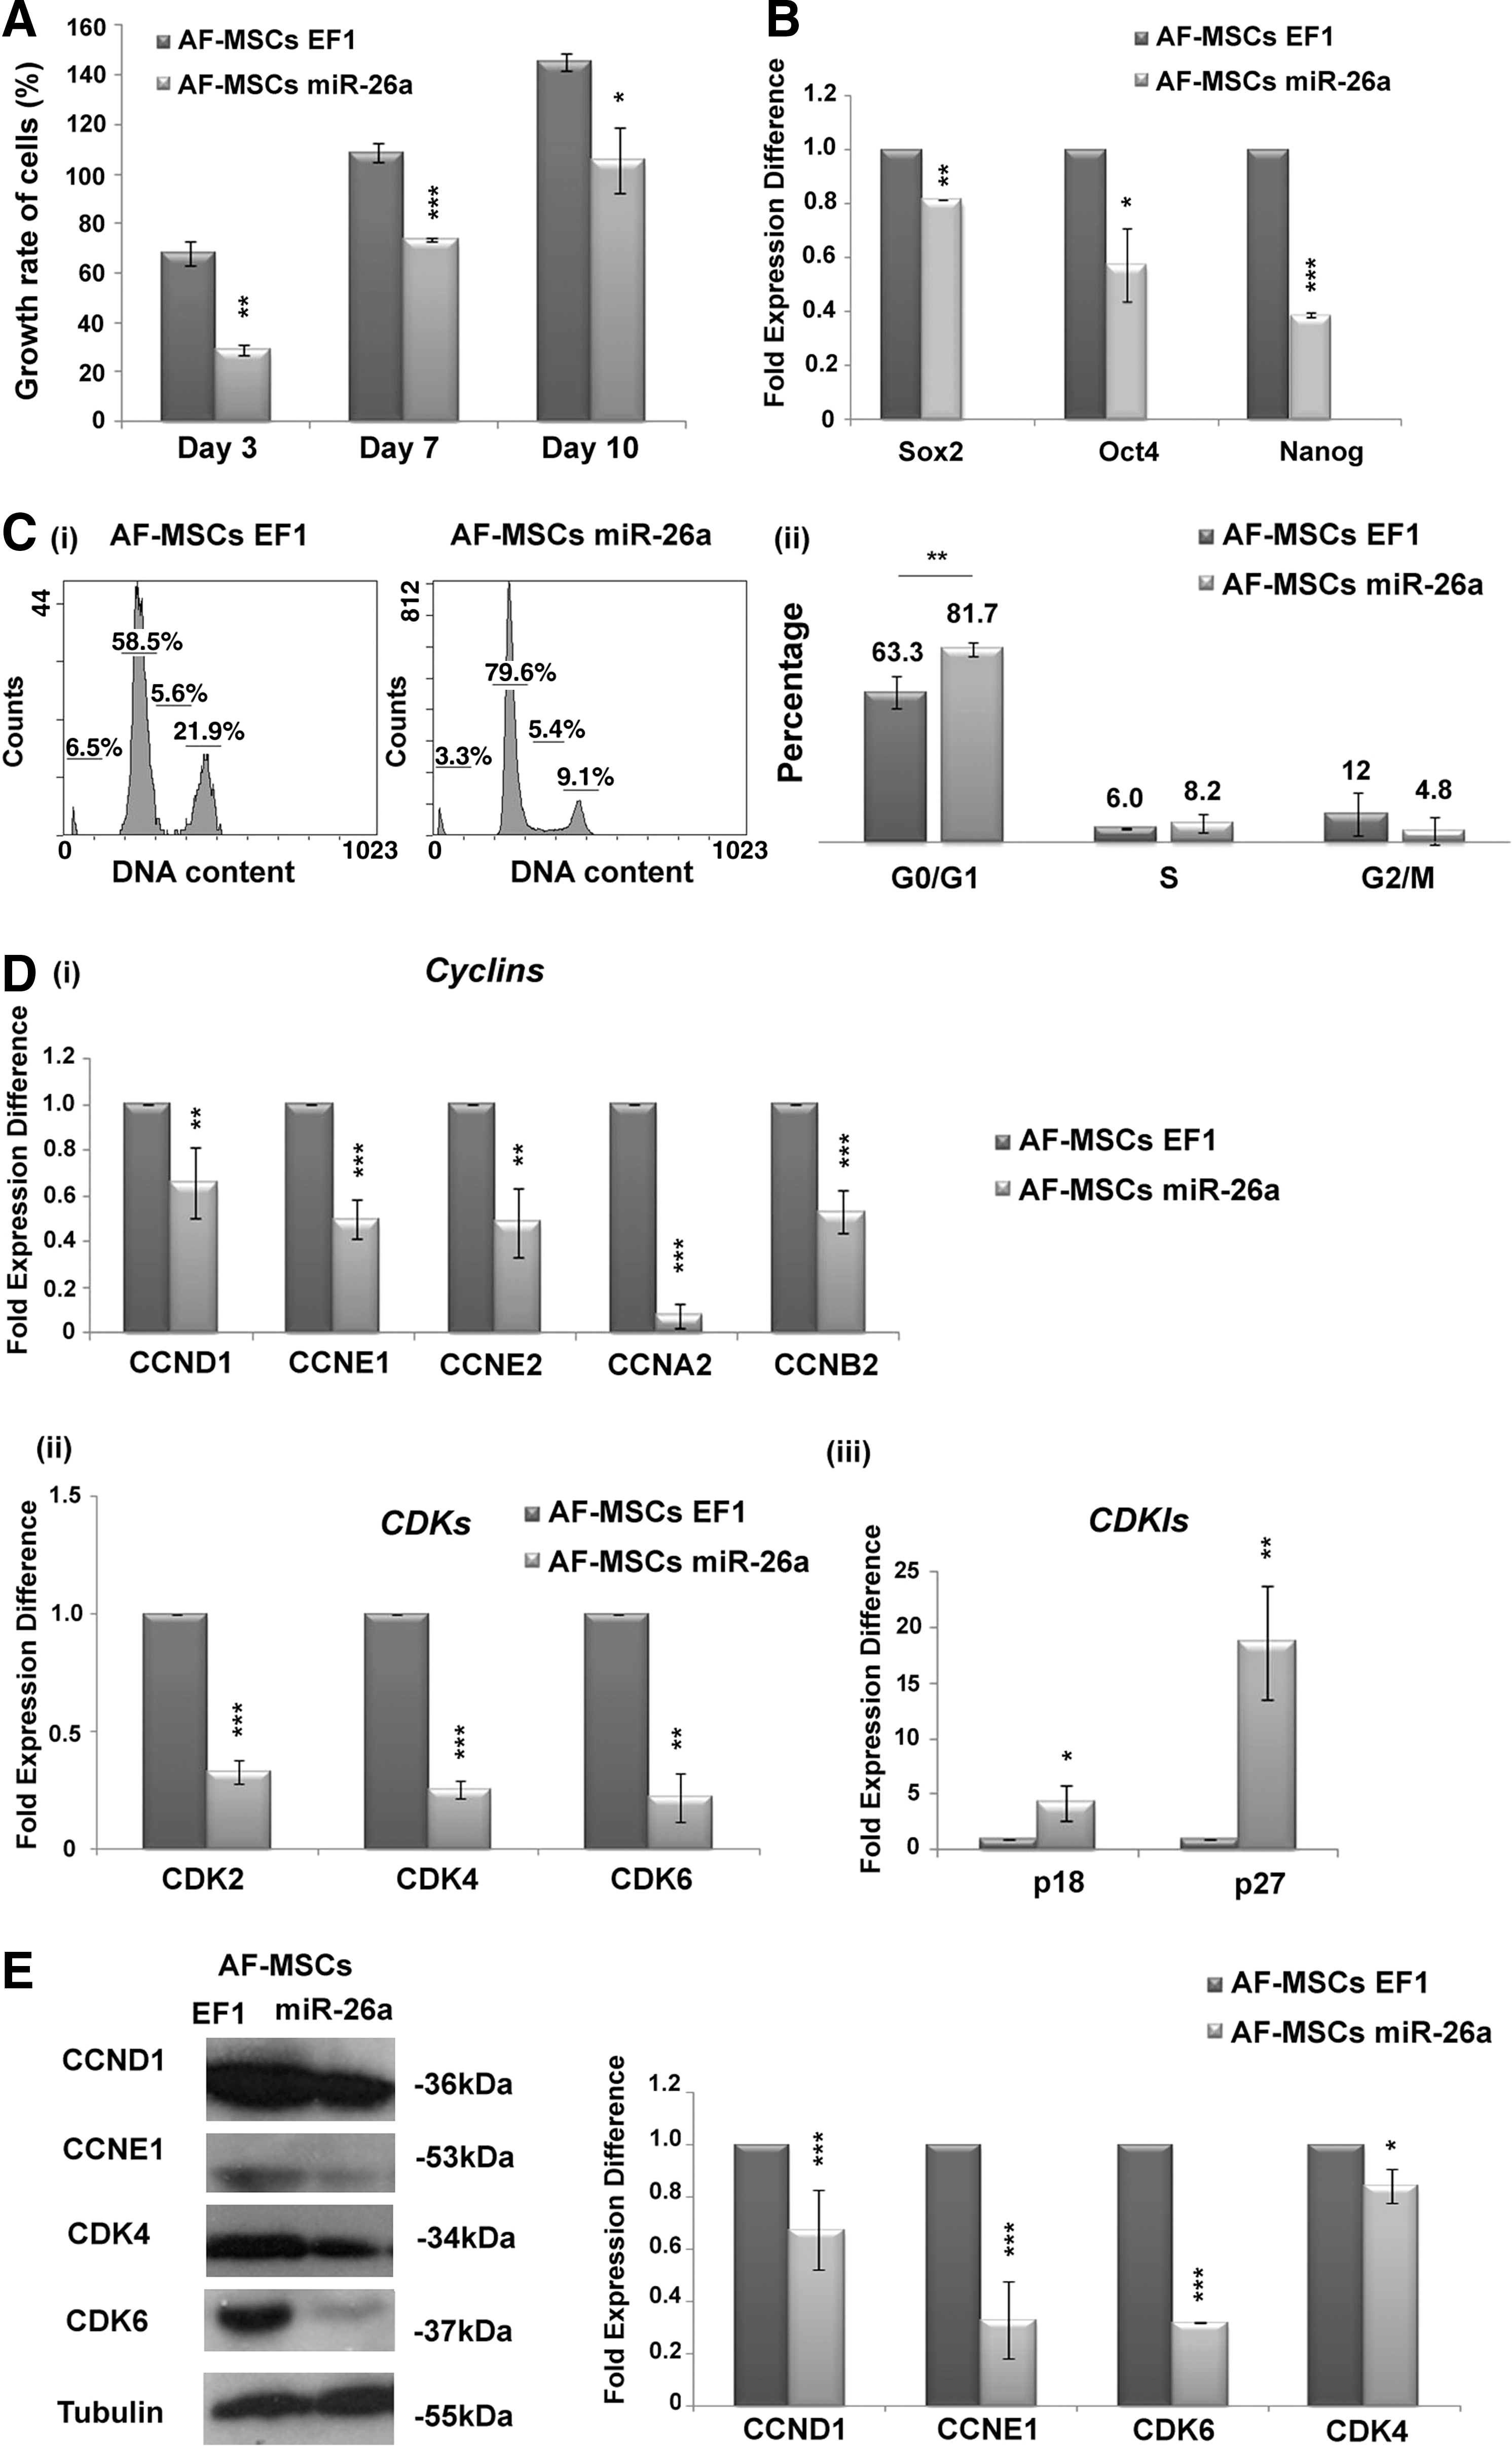
miR-26a induction altered the growth and the cell cycle of AF-MSCs.
To gain further insight into the mechanisms underlying the altered proliferation rate of AF-MSCs on adipogenesis, cell cycle analysis was performed by propidium iodide staining (Fig. 6C i). The proportion of cells in G0/G1 phase increased (81.7% ± 2.9%) in AF-MSCs after miR-26a induction compared with AF-MSCs-EF1 (63.3% ± 6.8%) (Fig. 6C ii). A statistically significant decrease was observed in the expression levels of Cyclin D1, E1, E2, A2, and B2 at mRNA level (Fig. 6D i) in AF-MSCs-miR-26a, as well as the expression levels of CDK2 (0.33 ± 0.05-fold expression difference), CDK4 (0.25 ± 0.03-fold expression difference), and CDK6 (0.22 ± 0.1-fold expression difference) were decreased after miR-26a induction compared with AF-MSCs-EF1 (Fig. 6D ii). An increase in p18 (19.1 ± 5.2-fold expression difference) and p27 (4.8 ± 0.8-fold expression difference) expression levels was also detected in AF-MSCs-miR-26a (Fig. 6D iii).
Finally, western blot analysis was performed in AF-MSCs-miR-26a for Cyclin D1 (0.67 ± 0.15-fold expression difference), Cyclin E1 (0.33 ± 0.14-fold expression difference), CDK4 (0.85 ± 0.06-fold expression difference), and CDK6 (0.32 ± 0.002-fold expression difference) compared with AF-MSCs-EF1, showing a significant reduction in their expression (Fig. 6E).
miR-26a overexpression in AL cells alters cell cycle
Previously, AL cells that express miR-26a in high levels (microarray analysis, Fig. 1) exhibit reduced expression levels of several cyclins and CDKs with more important Cyclin E1 and CDK6 that are experimentally validated targets of miR-26a (Supplementary Table S3). To further explore the regulatory role of miR-26a, real-time PCR expression analysis was performed for Cyclin D1, E1, E2, A2, and B2 in AL-miR26a cells compared with AL-EF1 cells. A significant reduction in the expression of these proteins was observed in AL-miR-26a compared with AL-EF1 cells (Fig. 7A i).
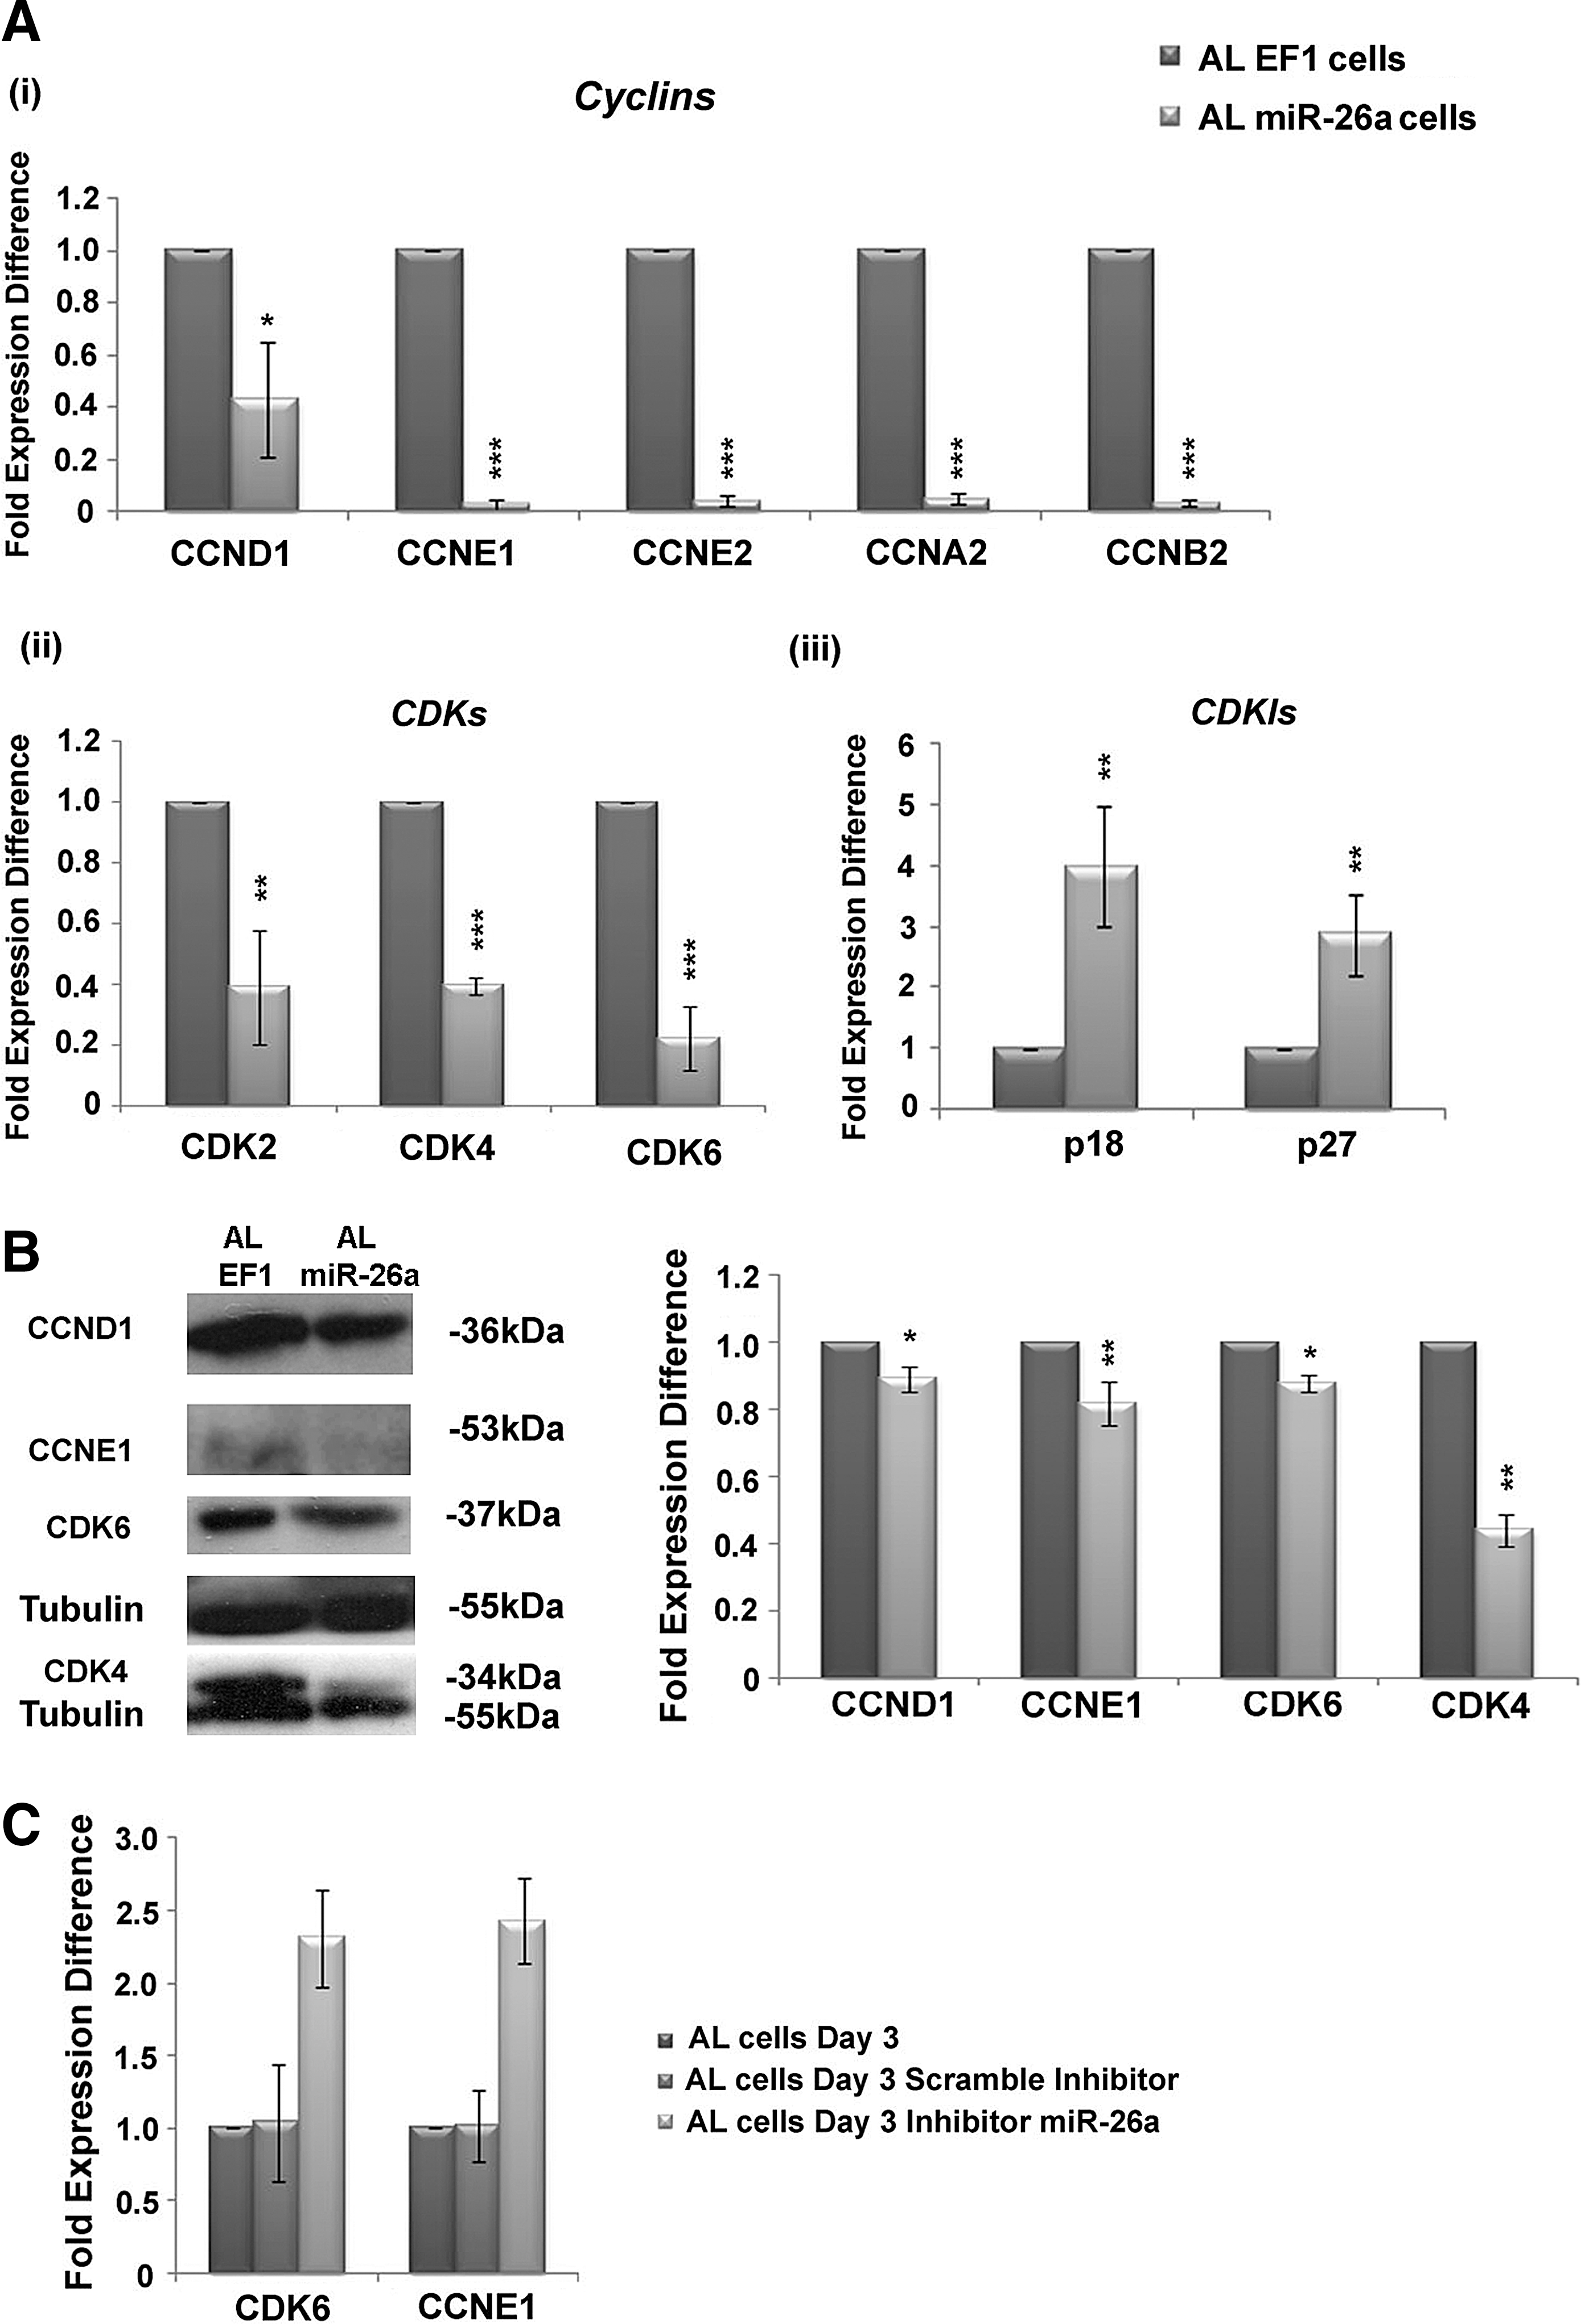
Cyclin, CDK, and CDKI expression levels in AL cells expressing miR-26a.
Similarly, after miR-26a induction in AL cells, the expression levels of CDK2 (0.39 ± 0.2-fold expression difference), CDK4 (0.4 ± 0.02-fold expression difference), and CDK6 (0.2 ± 0.1-fold expression difference) were decreased compared with AL-EF1 cells (Fig. 7A ii). Likewise, increased expression levels of p27 (3.98 ± 0.98-fold expression difference) and p18 (2.87 ± 0.65-fold expression difference) were also evident in AL-miR-26a compared with AL-EF1 cells (Fig. 7A iii). Western blot analysis for Cyclin D1 (0.89 ± 0.04-fold expression difference), Cyclin E1 (0.81 ± 0.06-fold expression difference), CDK4 (0.44 ± 0.05-fold expression difference), and CDK6 (0.87 ± 0.02-fold expression difference) in AL-miR-26a compared with AL-EF1 cells exhibited reduced expression of the above proteins (Fig. 7B).
Finally, inhibition of miR-26a in AL cells exhibited a significant increase of CDK6 expression (2.3 ± 0.33-fold expression difference) and cyclin E1 (2.4 ± 0.29-fold expression difference) at mRNA level compared with untransfected AL cells (Fig. 7E).
Discussion
Recent studies have been focused on determining the role of miRNAs in adipogenic differentiation, fat cell development, and obesity [33]. A number of miRNAs are able to decelerate adipocyte differentiation, while others appear to be positive regulators of adipogenesis [34,35]. Immense interest has been also observed in studying MSCs and utilizing their unique differentiation properties for regenerative medicine applications. The first miRNA reported to regulate adipogenic differentiation in human adipocytes was miR-143, targeting various genes that were involved in self-renewal and differentiation [36]. Since then, several miRNAs have been identified to control adipogenesis in adult hMSCs derived from BM and/or adipose tissue [37], but few miRNAs have been revealed for fetal hMSCs [38]. Recently, our group demonstrated for the first time a direct interaction between miR-21 and the pluripotency marker SOX2, resulting in reduced clonogenic and proliferative potential and cell cycle arrest, as well as in enhanced osteogenic and in impaired adipogenic and chondrogenic properties in AF-MSCs [18]. Herein, further studies are required to better understand the role of miRNAs and the mechanism by which they regulate AF-MSC differentiation potential in the context of regenerative medicine and metabolic disorders.
In this study, we defined for the first time the miRNA profile of AF-MSCs compared with the profile of differentiated AF-MSCs into AL cells. Based on the detailed analysis, miR-26a was found to be highly expressed in AL cells, indicating a critical role in the process of adipogenesis. In view of reports, miR-26a/b is considered to be a proadipogenic microRNA, thus is required for the formation of brown adipocytes in human adipose-derived stem cells [19] and its knockdown in preadipocyte cell line downregulates the key adipogenic transcription factors PPARg and C/EBPα, inhibiting adipogenesis [39,40]. PPARg gain and/or loss of function studies confirmed that this member of nuclear receptor is necessary and sufficient for fat formation in adipocytes [41].
Our work reveals that expressing miR-26a in AF-MSCs using a lentiviral system increases their ability to differentiate into AL cells under appropriate culture conditions, while inhibition of miR-26a resulted in decreased formation of oil droplets in AL cells. We demonstrated that in the presence of miR-26a in AF-MSCs and in AL cells, a significant reduction in the expression levels of PTEN has occurred, which has been rescued using an miR-26a inhibitor. MiR-26a interacted directly with PTEN, promoting the phosphorylation of Akt, which in turn activates the Akt pathway.
It has been reported in previous studies that the Akt pathway is activated as a downstream effector of insulin cascade during differentiation of MSCs into adipocytes, mainly by regulating a large number of substrates such as mTOR [42 –46]. Accordingly, several studies showed a defect in the initiation of adipogenic signaling, caused by interception of induction of PPARg expression due to lack of Akt in preadipocytes [47,48].
Another critical regulator of adipogenesis was identified to be c-MYC transcription factor, thus loss of function of c-MYC resulted in reduced lipid accumulation and reduced expression of adipogenic markers in hASCs [49]. Notably, miR-26a has been significantly increased in the presence of c-MYC in AL cells, supporting previous findings demonstrating that c-MYC inhibits PTEN by upregulating miR-26a in glioblastoma [50]. In light of these studies and the findings presented herein, miR-26a by inhibiting PTEN, may in turn activate Akt pathway and promote adipogenesis (Fig. 8A).
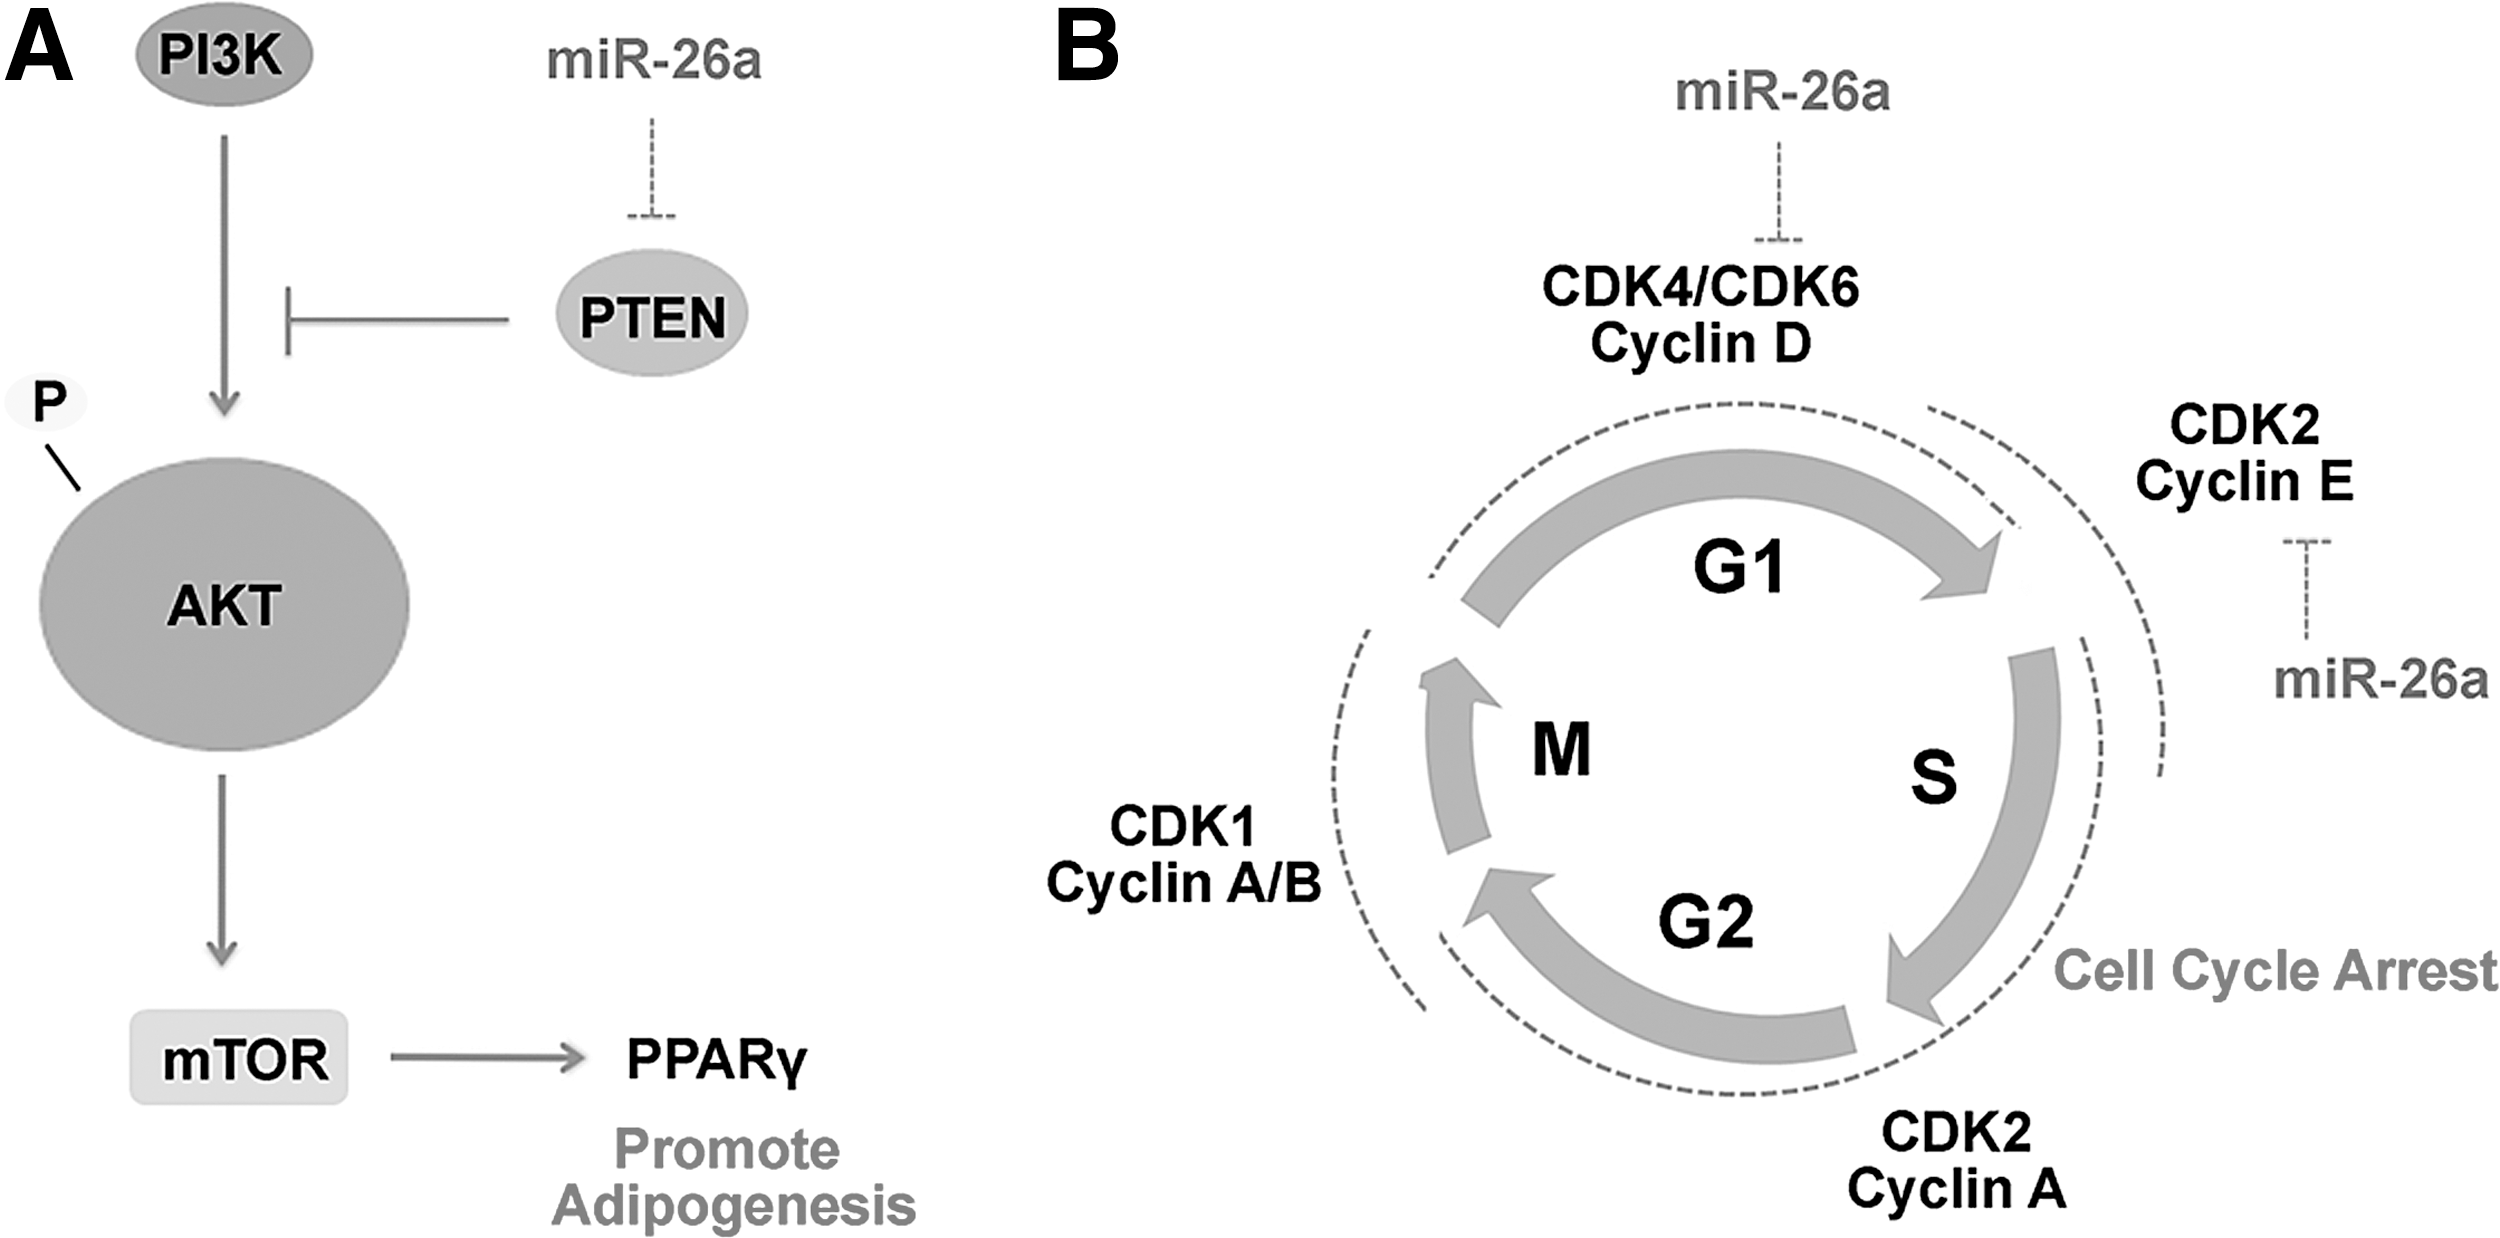
The role of miR-26a in adipogenesis and cell cycle.
More importantly, G0/G1 cell cycle arrest was observed after terminal adipogenic induction of AF-MSCs in AL cells, which was demonstrated through decreased expression levels of Cyclin D1, Cyclin E1, CDK4, and CDK6 and increased expression levels of the cell cycle inhibitors p27 and p18, which bind to cyclin-CDK complexes suppressing G1 phase [51,52]. Furthermore, miR-26a lentiviral transduction of AF-MSCs resulted in significant decrease in the proportion of cells in S phase, leading to G0/G1 cell cycle arrest. Similarly, a decrease in the expression levels of Cyclin D1, Cyclin E1, CDK4, and CDK6 and an increase in p27 and p18 were observed. In addition, G0/G1 cell cycle arrest was observed after miR-26a induction in AL cells, accompanied by similar reduction of Cyclin D1, Cyclin E1, CDK4, and CDK6 and an increase of p27 and p18.
Interestingly, miR-26a inhibition in AL cells led to a significant increase of CDK6 and Cyclin E1. In previous studies, miR-26a/b has been shown to inhibit the G1/S transition in cancer cell lines by direct targeting of CDK6 and Cyclin E1 [32]. Our findings also support the involvement of CDK6 and Cyclin E1 in miR-26-mediated G1 arrest (Fig. 8B).
In conclusion, the present study provides evidence that miR-26a may play a role in human MSC differentiation into adipocytes by direct interacting with PTEN and activating the Akt pathway and simultaneously by targeting Cyclin E1 and CDK6 preventing G1/S transition. Considering that miRNA mimics have entered the clinical trials for several diseases [53 –55], miR-26a inhibitors could potentially be used in cell-based therapies for obesity in metabolically important organs, to impede adipocyte differentiation and consequent lipid droplet formation.
Footnotes
Acknowledgments
This research has been funded by Postdoctoral Fellowships of Excellence—Siemens, IKY Foundation to O.T. the Fondation Santé research grant (no 70/3/13455) to M.R. and by the European Union (European Social Fund–ESF) and Greek national funds through the Operational Program “Education and Lifelong Learning” of the National Strategic Reference Framework (NSRF) - Research Funding Program: Heracleitus II (no 70/3/11019) to O.T. and N.A. We are grateful to Prof. L. Naldini for kindly providing pCCLsin.cPPT.hEF1a.deltaLNGFR.Wpre plasmid, Dr E. Siapati for primer provision, and Dr. Gavriil Ariana for FACS sorting technical assistance.
Author Disclosure Statement
The authors indicate no potential conflicts of interest.
References
Supplementary Material
Please find the following supplemental material available below.
For Open Access articles published under a Creative Commons License, all supplemental material carries the same license as the article it is associated with.
For non-Open Access articles published, all supplemental material carries a non-exclusive license, and permission requests for re-use of supplemental material or any part of supplemental material shall be sent directly to the copyright owner as specified in the copyright notice associated with the article.