




Abstract
Drugs targeting β-cells have provided new options in the management of T2DM; however, their role in β-cell regeneration remains elusive. The recent emergence of cell-based therapies such as autologous bone marrow-derived mesenchymal stem cells (ABM-MSCs) and mononuclear cells (ABM-MNCs) seems to offer a pragmatic approach to augment β-cell function/mass. This study aims to examine the efficacy and safety of ABM-MSC and ABM-MNC transplantation in T2DM and explores alterations in glucose–insulin homeostasis by metabolic studies. Thirty patients of T2DM with duration of disease ≥5 years, receiving triple oral antidiabetic drugs along with insulin (≥0.4 IU/Kg/day) with HbA1c ≤7.5%(≤58.0 mmol/mol), were randomized to receive ABM-MSCs or ABM-MNCs through targeted approach and a sham procedure (n = 10 each). The primary endpoint was a reduction in insulin requirement by ≥50% from baseline, while maintaining HbA1c <7.0% (<53.0 mmol/mol) during 1-year follow-up. Six of 10 (60%) patients in both the ABM-MSC and ABM-MNC groups, but none in the control group, achieved the primary endpoint. At 12 months, there was a significant reduction in insulin requirement in ABM-MSC (P < 0.05) and ABM-MNC groups (P < 0.05), but not in controls (P = 0.447). There was a significant increase in second-phase C-peptide response during hyperglycemic clamp in the ABM-MNC (P < 0.05) group, whereas a significant improvement in insulin sensitivity index (P < 0.05) accompanied with an increase in insulin receptor substrate-1 gene expression was observed in the ABM-MSC group. In conclusion, both ABM-MSCs and ABM-MNCs result in sustained reduction in insulin doses in T2DM. Improvement in insulin sensitivity with MSCs and increase in C-peptide response with MNCs provide newer insights in cell-based therapies.
Introduction
D
β-cell failure is progressive and inexorable with advancing duration of diabetes. Therefore, targeting β-cells through pancreatic/islet transplantation and novel β-cell regenerative therapies such as stem cells seems to be a pragmatic approach [6,7]. Limitations of pancreatic/islet transplantation include restricted availability of cadaveric pancreata, progressive decline in insulin independence, graft rejection, and immunosuppression-associated complications [8]. Therefore, interest is growing in stem cells that possess homing-in, differentiation, and transdifferentiation properties.
Bone marrow is enriched with mononuclear cells (MNCs), hematopoietic stem cells (HSCs), and a few mesenchymal stem cells (MSCs) [9,10]. Several studies have demonstrated that use of bone marrow-derived MNC transplantation in patients with T2DM resulted in significant decrease in insulin requirement, although C-peptide response was variable [11,12]. MSCs are multipotent stem cells that have the ability to differentiate into variety of cell types, thereby making these cells an attractive therapeutic tool for cell transplantation. Jiang et al. studied the efficacy of placenta-derived MSCs in patients with long-standing T2DM and showed a significant increase in C-peptide by 40% with achievement of ≥50% reduction in insulin requirement. However, the heterogeneity in glycemic control at inclusion, lack of a placebo arm, and short follow-up were limitations of this study [13]. Recently, a study demonstrated the dose–response relationship of allogeneic bone marrow-derived mesenchymal precursor cells in patients with T2DM. The higher the dose of MSCs, greater was the reduction in HbA1c level at all time points compared with placebo. However, this study had a follow-up of only 3 months [14].
Although a study in alloxan-induced diabetes in rats compared the efficacy of MNC and MSC transplantation and showed that MNC transplantation was associated with a significant decrease in fasting plasma glucose (FPG) and greater number of differentiated insulin-producing cells compared with MSCs [15], no human studies have compared the efficacy and safety of these different autologous bone marrow-derived (ABM) stem cells in patients with T2DM. Furthermore, while homeostatic model assessment (HOMA)-based measures are used to assess the efficacy of therapeutic interventions in patients with diabetes, these tools are recognized to have limitations as longitudinal measures of insulin sensitivity/β-cell function in response to treatment modalities [16], and until now, metabolic studies have not been performed to elucidate the mechanism of reduction in insulin doses with these cell-based therapies.
This prospective, randomized, single-blinded placebo-controlled study was designed to compare the efficacy and safety of ABM-MSCs and ABM-MNCs in patients with T2DM and examines the alterations in glucose–insulin indices by metabolic studies.
Materials and Methods
Study design
Seventy patients were screened at outpatient department of the Postgraduate Institute of Medical Education and Research, Chandigarh, India. Informed consent was obtained from study subjects, the Stem Cell Ethics Committee of the institute approved the study, and the trial was registered at
Baseline evaluation
All subjects underwent clinical and biochemical assessment regarding glycemic control and for micro- and macrovascular complications.
Efficacy studies
Hyperglycemic clamp study
Subjects were requested to refrain from vigorous exercise, and antidiabetic medications were omitted 24 h before the procedure. Patients reported at 0630 h after an overnight fast of 10 h for hyperglycemic clamp study [17]. Dextrose solution (20%) was rapidly infused intravenously to increase the plasma glucose level to the target level (15.5 mmol/L) for 180 min. Blood samples for glucose and C-peptide were drawn at −5, 2, 4, 6, 8, 10, 30, 60, 120, 140, 160, and 180 min relative to the beginning of dextrose infusion. First-phase C-peptide (nmol/L) response was calculated as the area under the curve from 2 to 10 min and second-phase C-peptide response as the AUC from 120 to 180 min during the hyperglycemic clamp. An insulin sensitivity index (ISI) was calculated by dividing the steady state (140–180 min) of average glucose infusion rate (μmoles/Kg body weight/minutes) by the average insulin concentration (pmol/L) [18 –20]. C-peptide and plasma insulin were estimated by electrochemiluminescence immunoassay (Elecsys 2010, Roche, Mannheim, Germany) and HbA1c (Bio-Rad D-10 system, Hercules, CA).
Glucagon-stimulated C-peptide
The test was performed in fasting state after intravenous (IV) administration of 1 mg glucagon, and blood samples were drawn at −15, 0, and 6 min after injection. The HOMA of insulin resistance (HOMA-IR), β cell function (HOMA-β), and insulin sensitivity (HOMA-S) were used to assess these indices [21].
Gene expression analysis of glucose transporter type 4 and insulin receptor substrate-1
Skeletal muscle biopsy tissue sample was obtained from vastus lateralis under local anesthesia from the study patients. Total cellular RNA was extracted from the cryopreserved skeletal muscle tissue by TRIZOL method (Invitrogen) and cDNA was synthesized using the RevertAid First-strand cDNA Synthesis Kit (Fermentas Life Sciences) according to the manufacturer's instructions. Real-time polymerase chain reaction (PCR) was performed by 7,500 Real-Time PCR System SYBR Green I master detection (Applied Biosystems) method to analyze the gene expression of glucose transporter type 4 (GLUT-4) and insulin receptor substrate-1 (IRS-1) in skeletal muscle tissue; 18S ribosomal RNA was used as an endogenous control. The primer sequences of IRS-1 were (from 5′ to 3′) CTTCTGTCAGGTGTCCATCC and CTCTGCAGCAATGCCTGTTC; for GLUT-4, CCTGCCAGAAAGAGTCTGAAGC and ATCCTTCAGCTCAGCCAGCA; and for 18S rRNA, AACGGCTACCACATCCAAG and CGTCCCAAGATCCAACTAC. The analysis of the relative gene expression data was done by the 2−ΔCT method to produce the data as fold change up- or downregulation [22].
Preparation of ABM-MSCs
Approximately 100 mL of autologous bone marrow was aspirated from the posterior superior iliac spine under local anesthesia following aseptic precautions from the patients in Group I. MNCs were suspended in α-minimum essential medium (Sigma-Aldrich, St. Louis, MO) supplemented with 10% pooled human platelet lysate. After attaining 80% confluency, cells were trypsinized and expanded in T-225 flasks. These cells were expanded up to 4–5 passages to obtain targeted cell numbers (1 million cells/Kg body weight) for infusion. Cultured media were aspirated and tested for aerobic and anaerobic (Bactec, BD Bioscience), fungal, and mycoplasma infection before the infusion. Cell viability was tested by using trypan blue (Sigma Aldrich). Cells were stained with antibodies conjugated with fluorescent markers for characterization of MSCs such as anti-CD 73-PE, CD90-PE, CD105-FITC, CD34-PE, and CD45-FITC and analyzed by 4-color flow cytometer (FACSCalibur, BD Bioscience) [23].
Preparation of ABM-MNCs
Approximately 200–250 mL of autologous bone marrow was aspirated from the posterior superior iliac spine under local anesthesia following aseptic precautions. The MNCs were separated by centrifugation after layering on density-gradient medium (Ficoll-Hypaque, Sigma- Aldrich, St. Louis, MO), washed using phosphate-buffered saline (Himedia Laboratories Private Limited, Mumbai, India), and resuspended in normal saline with a final product volume of 8–10 mL. Aliquots (1 mL) were taken for MNC count, viability testing by trypan blue (Sigma-Aldrich) dye exclusion test, and for phenotyping: cells were stained with antibodies conjugated with fluorescent markers such as anti-CD34-PE and CD45-FITC and acquired and analyzed onto 4-color flow cytometer (FACSCalibur, BD Bioscience). Five milliliters of final wash supernatant was used for sterility testing (aerobic and anaerobic culture, Bactec, BD Bioscience) [11,24].
Stem cell transplantation
The procedure of stem cell transplantation has been published earlier [11,24]. Briefly, a 5F catheter (Sim1, Beacon®) was selectively navigated through transfemoral route into the celiac trunk. Within the Sim1 catheter, another caliber catheter (Progreat microcatheter, Terumo, Japan) was selectively advanced into superior pancreaticoduodenal (SPD) artery and cells were injected accordingly unless anatomical variations in vasculature were noted. MSCs were infused at a dose of 1 million cells/Kg body weight [13], whereas MNCs were infused at a dose of ∼1 billion cells per patient [11,24] as reported in our previous studies.
Control group (Group III)
Patients in Group III underwent a sham procedure, which has been described previously [11]. Approximately 20 mL of bone marrow was aspirated and after 5 h of marrow aspiration, 10 mL of diluted vitamin B complex was injected through the transfemoral route into the femoral artery under sterile precautions in the same ambience. An acellular vehicle was preferred as a control to eliminate the placebo-like effect, if any, of these cell-based therapies.
Follow-up
All patients were followed up every 2 weeks for the first month, monthly for the next 3 months, and at 3-month intervals thereafter. Lifestyle modification advice was reinforced during each visit to all the patients. Self-monitoring of blood glucose was advised at least five points/week and at the time of suspected hypoglycemia. FPG levels were targeted between 5.0 and 7.2 mmol/L, postmeal glucose levels <9.9 mmol/L, and HbA1c <7.0% (<53.0 mmol/mol). Insulin doses were tapered whenever the patient reported hypoglycemic episodes or when the FPG was <3.8 mmol/L and postmeal glucose <6.6 mmol/L, without any alterations in oral antidiabetic drugs. Hyperglycemic clamp study and muscle biopsy were repeated after 6 months and glucagon-stimulated C-peptide test was performed at 3, 6, and 12 months. All patients were followed for a period of 12 months.
Outcomes
The primary endpoint was a reduction in insulin requirement by ≥50%, while maintaining HbA1c <7.0% (<53.0 mmol/mol) [11], and the secondary endpoints included change in weight, HbA1c, metabolic indices, including C-peptide and insulin sensitivity, compared with the baseline.
Safety study
All patients underwent whole-body fluorine 18-fluorodeoxyglucose positron emission tomography–computed tomography (18F-FDG PET-CT) examination after completion of the study to look for any untoward event.
Statistical analysis
All the data are expressed as median and interquartile range. Baseline and post-treatment data within the groups were compared using Friedman's test with post hoc Wilcoxon's signed rank test (P value corrected using Bonferroni procedure). Data between the groups were analyzed using the Kruskal–Wallis test for continuous variables and Fisher exact tests for categorical variables. Spearman's rank correlation test was used to identify an association between two variables. Generalized linear model was applied for adjustment of baseline variables. The P value <0.05 was considered significant. Statistical analysis was carried out using SPSS, version 22 for window (SPSS, Inc., Chicago).
Results
All recruited patients completed the study except one in the ABM-MSC group who was lost to follow-up after 6 months of stem cell transplantation (Fig. 1).
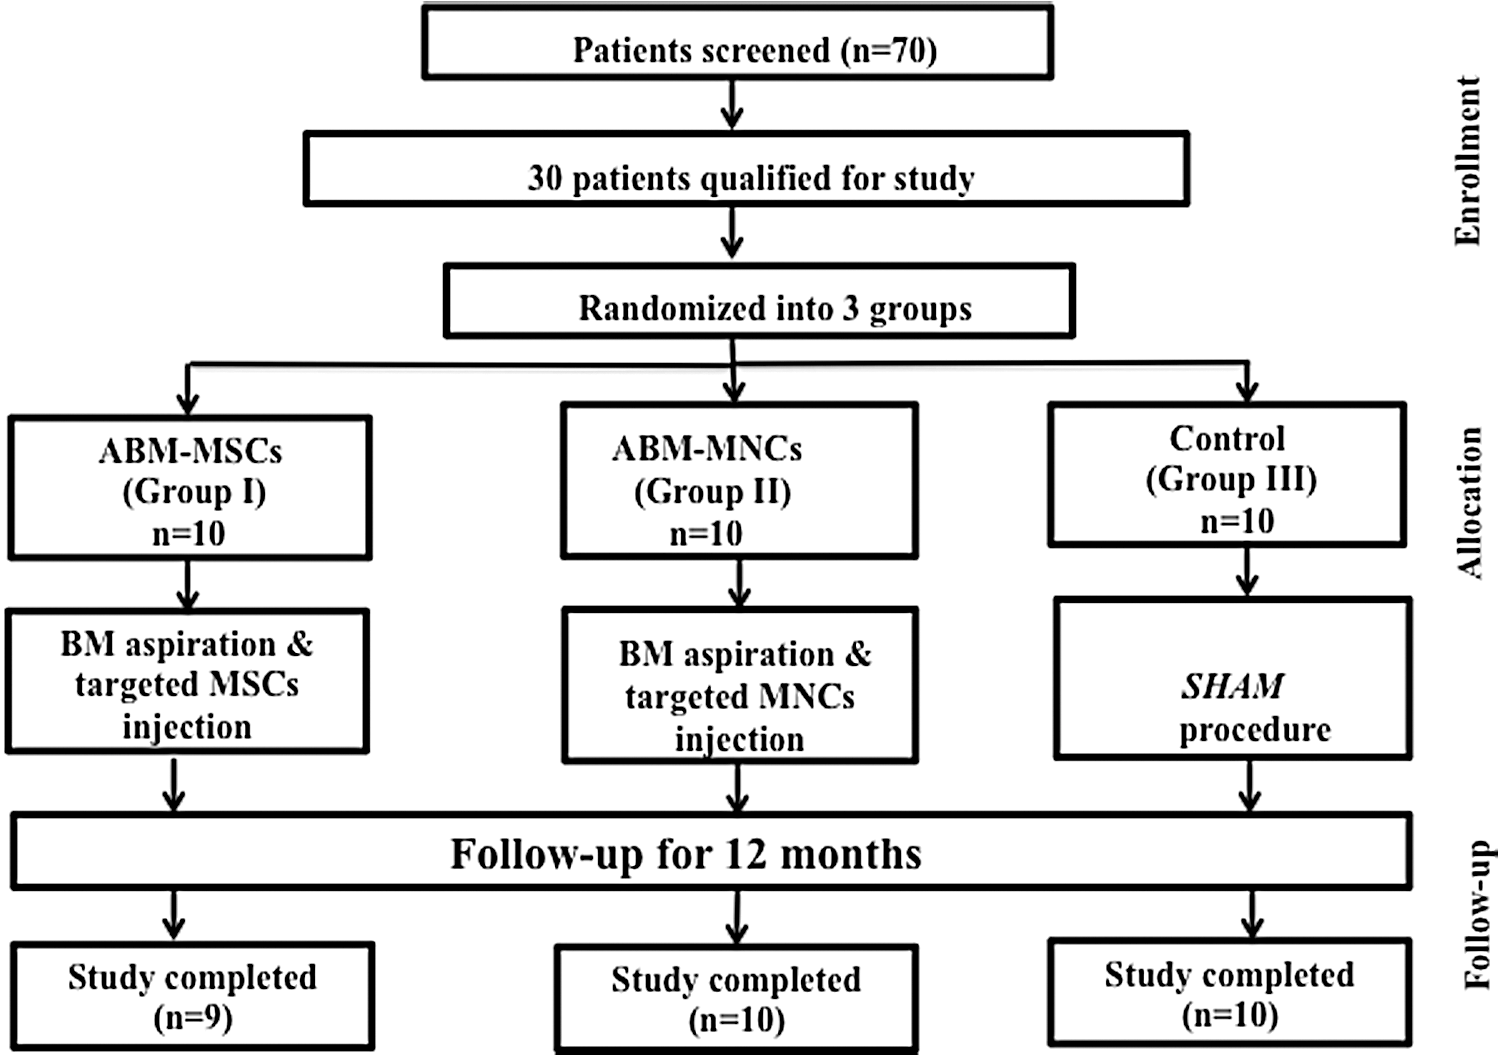
Schema of the study. Seventy patients were screened, 30 eligible patients were randomized, and were divided into 3 groups. All patients underwent complete follow-up and analysis, excluding one patient lost to follow-up in Group I after 6 months.
ABM-MSC group (Group I)
Baseline clinical and biochemical characteristics of the study patients are summarized in Table 1. All patients had neuropathy, four had nonproliferative diabetic retinopathy (NPDR), two had PDR, and three had microproteinuria. All patients had hypertension, and one had coronary artery disease. The median volume of the bone marrow harvested for culturing of MSCs was 110.0 (92.5–137.3) mL, which yielded 83.5 (72.0–91.5) × 106 MSCs (Supplementary Table S1; Supplementary Data are available online at
All values are expressed as median and interquartile range.
ABM-MSCs, autologous bone marrow-derived mesenchymal stem cells; BMI, body–mass index; FPG, fasting plasma glucose; HOMA-IR, homeostatic model assessment-insulin resistance; MNCs, mononuclear cells.
In 9 of 10 patients (90%), MSCs were injected into SPD artery, except in one in whom MSCs were injected into the splenic artery due to anatomical malformation. Postprocedure and follow-up study period was uneventful.
A total of six (60%) patients achieved the primary endpoint (responders) over a mean duration of 5.5 (2.8–6.0) months, while maintaining HbA1c <7.0% (<53.0 mmol/mol) till the end of the study. There was a 52% reduction in insulin dose in the first 6 months of stem cell transplantation (SCT) (P < 0.05), followed by a 58% reduction in the next 3 months (P < 0.05), and finally by 54% at 12 months (P < 0.05) (Table 2). There was a nonsignificant decrease in HbA1c from 6.9% (52.0 mmol/mol) to 6.4% (46.0 mmol/mol) at 12 months (Table 2). The glucagon-stimulated C-peptide modestly increased from 0.7 to 0.8 nmol/L at 12 months; however, there was no significant change in HOMA-IR, HOMA-β, and HOMA-S at the end of the study (Table 2).
All values are expressed as median and interquartile range.
Significant difference from baseline.
ISI, insulin sensitivity index.
Hyperglycemic clamp, a measure to assess β-cell function, showed that C-peptide response at baseline and AUC of first phase were insignificant before and after SCT, whereas AUC of second-phase C-peptide response was significantly lower after SCT compared with baseline (P < 0.05) (Table 2). Furthermore, generalized linear model analysis showed significant improvement in the ISI at the end of the study (P < 0.05) (Table 2).
On subgroup analysis, patients in the responder group (n = 6) had a significant weight loss −2.8Kg (−5.1 to −2.4) (P < 0.05) at the achievement of the primary endpoint and they continued to maintain the weight deficit −5.4Kg (−6.0 to −4.0) (P < 0.05) even at 1 year. However, weight loss neither correlated with reduction in insulin requirement (r = 0.530, P = 0.280) nor improvement in the ISI (r = 0.771, P = 0.072) in these patients.
Skeletal muscle biopsy was performed in seven patients. GLUT4 and IRS1 mRNA expression in the skeletal muscle was higher, but insignificant, after SCT compared with baseline [0.0 (0.0–1.1) to 0.4 (0.0–1.0) (P = 0.866) and 0.0 (0.0–2.3) to 1.3 (0.4–3.7) (P = 0.128), respectively].
ABM-MNC group (Group II)
Baseline clinical and biochemical characteristics of the study patients are summarized in Table 1. All patients had neuropathy, two had NPDR, and four had microproteinuria. Seven patients had hypertension, and one had coronary artery disease. The median volume of the bone marrow harvested for transplantation was 223.5 (209.3–227.0) mL, which yielded 1.1 (1.0–1.4) × 109 MNCs (Supplementary Table S1) and 1.8 (1.4–2.2) × 107 of these MNCs expressed CD34+.
In 9 of 10 patients (90%), MNCs were injected into SPD artery, except in one in whom stem cells were injected into the splenic artery due to nonvisualization of SPD artery.
After SCT, 6 patients (60%) achieved the primary endpoint (responders) over a mean duration of 3.5 (3.0–4.8) months, while maintaining HbA1c <7.0% (<53.0 mmol/mol) till the end of the study period. There was a decrease in the total daily insulin requirement by 51% at 6 months (P < 0.05) and maintained at the same dose at 9 (P < 0.05) and at 12 months (P < 0.05) (Table 3). There was an insignificant increase in HbA1c from 6.7% (50.0 mmol/mol) to 7.0% (53.0 mmol/mol) at 12 months (Table 3). The glucagon-stimulated C-peptide significantly increased from 0.7 to 1.1 nmol/L at 12 months (P < 0.05) (Table 3). In a subgroup analysis, patients in the responder group (n = 6) had insignificant weight loss −0.7Kg (−2.7 to 1.3) (P = 0.463) at the achievement of the primary endpoint and it remained insignificant even at 1 year −2.4Kg (−3.3 to −0.8) (P = 0.173) and did not correlate with reduction in insulin requirement (r = 0.551, P = 0.257). There was no significant alteration in HOMA-IR, HOMA-β, and HOMA-S at the end of the study (Table 3).
All values are expressed as median and interquartile range.
Significant difference from baseline.
The β-cell function by hyperglycemic clamp study at baseline and AUC of first-phase C-peptide response were insignificant before and after SCT, whereas AUC of second-phase C-peptide response was significantly increased after MNC transplantation compared with baseline (P < 0.05) (Table 3). Furthermore, generalized linear model analysis showed a nonsignificant decrease in ISI at the end of the study (P = 0.066) (Table 3).
Five patients underwent muscle biopsy. GLUT4 and IRS1 mRNA expression in the skeletal muscle was lower, but insignificant, after stem cell treatment compared with baseline [0.5 (0.2–2.1) to 0.2 (0.2–4.5) (P = 0.892) and 0.1 (0.1–2.4) to 0.0 (0.0–1.1) (P = 0.066)].
Control group (Group III)
Baseline clinical and biochemical characteristics of the study patients are summarized in the Table 1. All patients had neuropathy, five subjects had microproteinuria, two had NPDR, and one had macroproteinuria. Nine patients had hypertension.
After the sham procedure, insulin requirement decreased by 10% at the end of the study. However, none of the patients could achieve ≥50% reduction in insulin requirement while maintaining HbA1c <7% (nonresponders). The decrease in insulin doses was significant at 6 months (P < 0.05); however, it could not be sustained at 9 and 12 months (Table 4). There was a modest, but nonsignificant, weight gain at 9 and 12 months compared with the baseline (Table 4). HbA1c decreased from 6.5% (47.5 mmol/mol) to 6.2% (43.0 mmol/mol) without any significant alterations in HOMA-IR, HOMA-β, HOMA-S, and stimulated C-peptide at 12 months (Table 4).
All values are expressed as median and interquartile range.
Significant difference from baseline.
The β-cell function as assessed by hyperglycemic clamp study displayed insignificant alterations in basal, AUC first-phase and second-phase C-peptide response, and ISI at the end of the study (Table 4).
Seven patients underwent muscle biopsy. GLUT4 mRNA expression in the skeletal muscle was lower, but insignificant [0.6 (0.2–1.6) to 0.2 (0.0–2.5) (P = 0.866)], after sham treatment compared with baseline. Furthermore, IRS1 mRNA expression in skeletal muscle was significantly lower after sham treatment compared with baseline [0.6 (0.3–1.5) to 0.1 (0.0–0.4) (P < 0.05)].
Comparison among the groups
All the groups were comparable at baseline with respect to clinical and biochemical parameters (Table 1). On comparing between the groups at 6 and 12 months, the changes in clinical parameters were not statistically significant. The Δ change in insulin dose was significantly more in the ABM-MNC group compared with the controls at 6 months (P < 0.05) as well as at 12 months (P < 0.05). However, there was no significant Δ change in insulin dose in ABM-MSC group compared with ABM-MNCs and control group at 6 and at 12 months. The Δ change in HbA1c was not significantly different between the groups (Table 5). In hyperglycemic clamp, the increase in Δ change in AUC of second-phase C-peptide response in the ABM-MNC group was significantly higher compared with ABM-MSCs (P < 0.05), while Δ change in ISI significantly improved in ABM-MSCs compared with ABM-MNCs (P < 0.05) and control groups (P < 0.05) (Supplementary Table S2). On gene expression analysis at 6 months, change in GLUT4 gene expression showed a rising trend, but not statistically significant, in the ABM-MSC group compared with others. However, change in IRS1 gene expression was statistically significant in ABM-MSCs compared with control (P < 0.05) group.
All values are expressed as median and interquartile range. −, decrease from baseline.
Significant difference among the groups.
Adverse events
Two patients had nausea and vomiting following glucagon administration, which was used for the assessment of β-cell reserve. One patient had local extravasation of blood following the targeted approached through the transfemoral route for the administration of stem cells, which subsided after a week's time. None of the patients developed major hypoglycemia; however, average incidence of minor hypoglycemic episodes was 19, 15, and 9 in ABM-MSCs, ABM-MNCs, and control groups, respectively, throughout the study period (Tables 2 –4). Furthermore, whole-body 18F-FDG PET-CT did not reveal any abnormality till the end of the study.
Discussion
This study demonstrates that both ABM-MSC and ABM-MNC transplantation resulted in reduction in exogenous insulin requirement by ≥50%, while maintaining HbA1c <7.0% (<53.0 mmol/mol) in almost two-thirds of the patients. This was accompanied by significant improvement in C-peptide response in the MNC group and insulin sensitivity in MSC group on hyperglycemic clamp study. No adverse events were noted during 1-year follow-up. To our knowledge, this is the first study to compare the efficacy and safety of ABM-MSC and ABM-MNC transplantation in patients with T2DM and explores the alterations in glucose–insulin homeostasis by metabolic studies.
Very few studies have examined the utility of ABM-SCT for the treatment of T2DM in humans. Estrada et al. [12] and Wang et al. [25] showed that combined use of ABM-SCT and hyperbaric oxygen therapy into the dorsal pancreatic artery resulted in reduction in FPG and insulin doses and an increase in C-peptide levels. However, these studies had certain limitations, including lack of placebo arm, heterogeneity in study population at inclusion regarding antidiabetic medication, and the majority of patients were lost to follow-up. A recent study showed that the ABM-MNC treatment could achieve significant reduction in HbA1c with a decrease in oral hypoglycemic drugs and insulin doses compared with IIT [26]. In our previous study, we showed ≥50% reduction in the insulin requirement in 75% of patients with a significant reduction in HbA1c and increase in stimulated C-peptide level after ABM-MNC therapy, which could be maintained for at least 15 months in almost two-thirds of the patients [24,27]. Another study from our center and the present study also confirm the previous results with the use of ABM-MNCs [11].
There are animal studies showing beneficial effects of MSCs on glucose–insulin homeostasis. Streptozotocin-induced diabetic rats showed a reduction in blood glucose after allogeneic MSC transplantation and transdifferentiation/fusion of MSCs into insulin-producing cells [28,29]. Other studies have shown this effect to be short-lived [15]. A recent study demonstrated that MSC transplantation in early phase of diabetes in a rat model resulted in enhanced insulin secretion, increase in islets number with higher number of insulin-positive cells, and improved insulin sensitivity, whereas administration in late phase of disease only improved insulin sensitivity by upregulation of GLUT-4 and IRS-1 expression in insulin target tissues [30]. Although there are a few studies that have explored the usefulness of MSCs in patients with T2DM showing a significant decrease in insulin requirement and increase in C-peptide [13,14], these were limited by lack of placebo arm and short duration of follow-up. The present study showed reduction in insulin doses in 60% of patients with the use of ABM-MSCs and these results could be sustained up to 1 year.
Our study was intentionally designed to enroll patients with HbA1c ≤7.5% (≤58.0 mmol/mol) to mitigate the effect of glucotoxicity on β-cell function and insulin sensitivity, thereby providing an exclusive opportunity to examine the effect of stem cells on these indices. Furthermore, hyperglycemia per se has been shown to have detrimental effect on functionality and survival of stem cells [31]. Although there were no differences in terms of reduction in insulin requirement and achievement of primary endpoint between MSC and MNC groups, our study provides newer insights into their action. We showed that administration of MSCs was associated with improvement in ISI, thereby resulting in reduction in insulin doses. Furthermore, the adaptive decrease in AUC of second-phase C-peptide response is a surrogate evidence of improvement in insulin sensitivity. In addition, enhancement of IRS-1 expression in patients treated with MSCs suggests that insulin sensitivity may improve through IRS-1-dependent mechanism. On the contrary, ABM-MNC administration was associated with augmented C-peptide response on clamp study and this was further supported by significant increase in glucagon-stimulated C-peptide response. Reduction in insulin doses in the early phases in the control group can be attributed to placebo-like effect as weight loss of 1.0–3.0 Kg and regular insistence on lifestyle modification were uniformly observed in all the groups. However, the decrease in insulin requirement could not be sustained during the later half of the study and none of the patients could achieve the primary endpoint. These observations, although a small sample size, suggest that cocktail therapy by combining MNCs and MSCs together may be useful in targeting both the defects and could translate into better outcome in terms of reduction in insulin doses and glycemic durability.
Various investigators, including us, have used variable doses of stem cells in their clinical studies and it was shown that response was greater with higher doses [11,13,14,24,27,32] going up to 200–400 mL [12,26,33]. However, the cell count was not mentioned in these studies. One study used MSCs in dosage varying from 0.3 × 10⁶ to 2 × 10⁶/Kg body weight and showed better response with higher doses [14]. We have used higher doses for MNCs compared with MSCs because bone marrow-derived MNCs consist of heterogeneous mixtures of cells, including HSCs (CD34+,1%), MSCs, and endothelial progenitor cells, whereas MSCs were expanded in vitro and it consisted of >90% of purified cellular mass. Both these dose schedules in our study elicited favorable clinical response that was sustained up to 1 year.
Approximately 5%–10% of weight loss has been shown to be associated with improvement in glycemic profile, lipids, and effective control of blood pressure [34]. There was a significant weight loss (−7.0%) in patients who achieved the primary endpoint after ABM-MSC transplantation and it was accompanied with a reduction in insulin doses. This can be attributed to improvement in insulin sensitivity as demonstrated by increase in ISI. However, weight loss did not correlate with decline in the insulin doses as well as with ISI in these patients. Therefore, reduction in insulin doses may be a direct effect of ABM-MSCs on ISI rather than mediated by weight loss. On the contrary, patients in the ABM-MNC group also had a weight loss (−2.9%), but it was insignificant; however, there was a significant reduction in insulin requirement in the responders group, which can be attributed to beneficial effects of ABM-MNCs on β-cell function as evidenced by significant improvement in C-peptide response on hyperglycemic clamp. There was also a significant reduction in insulin requirement for a short duration in the control group without any significant weight loss and this may be attributed to placebo-like effect and initial enthusiasm to adapt lifestyle modification.
The proposed mechanisms for improvement in β-cell function/mass following stem cell transplantation have been examined in animal studies as it is difficult to perform morphometric studies in human subjects. These include (i) regeneration of endothelial progenitor cells and promotion of angiogenesis in the damaged islets by the bone marrow-derived HSC, (ii) pancreatic and duodenal homeobox 1 upregulation, thereby enhancing islet differentiation, (iii) direct differentiation of MSCs into pancreatic endocrine cells, (iv) improvement in insulin signaling transduction by upregulation of GLUT4 expression and IRS-1 in insulin target tissues, and (v) rarely, transdifferentiation into β-cells [11,30,35]. However, these mechanisms are to be further explored for better understanding of stem cell action.
The strengths of our study include the presence of a placebo arm, head-to-head comparison between ABM-MSCs and ABM-MNCs, and use of metabolic clamp studies to assess the β-cell function. The limitations include small sample size (given the intensive nature of the study), short duration of follow-up, and limited skeletal muscle tissue samples for western blot to validate our data at protein levels.
In conclusion, both ABM-MSC and ABM-MNC therapies in T2DM result in significant decreases in insulin dose requirement accompanied with improvement in insulin sensitivity and β-cell function, respectively. Larger numbers of patients with a longer duration of follow-up are required to determine the place of cell-based therapies as standard of care for the management of T2DM.
Footnotes
Acknowledgments
This study was financially supported by the Endocrine Society of India. Part of the work was conducted in the Department of Translational and Regenerative Medicine, supported by the Department of Biotechnology, Ministry of Science and Technology, Government of India.
Author Disclosure Statement
No competing financial interests exist.
References
Supplementary Material
Please find the following supplemental material available below.
For Open Access articles published under a Creative Commons License, all supplemental material carries the same license as the article it is associated with.
For non-Open Access articles published, all supplemental material carries a non-exclusive license, and permission requests for re-use of supplemental material or any part of supplemental material shall be sent directly to the copyright owner as specified in the copyright notice associated with the article.
