
Abstract
During ontogeny, fetal liver (FL) acts as a major site for hematopoietic stem cell (HSC) maturation and expansion, whereas HSCs in the adult bone marrow (ABM) are largely quiescent. HSCs in the FL possess faster repopulation capacity as compared with ABM HSCs. However, the molecular mechanism regulating the greater self-renewal potential of FL HSCs has not yet extensively been assessed. Recently, we published RNA sequencing-based gene expression analysis on FL HSCs from 14.5-day mouse embryo (E14.5) in comparison to the ABM HSCs. We reanalyzed these data to identify key transcriptional regulators that play important roles in the expansion of HSCs during development. The comparison of FL E14.5 with ABM HSCs identified more than 1,400 differentially expressed genes. More than 200 genes were shortlisted based on the gene ontology (GO) annotation term “transcription.” By morpholino-based knockdown studies in zebrafish, we assessed the function of 18 of these regulators, previously not associated with HSC proliferation. Our studies identified a previously unknown role for tdg, uhrf1, uchl5, and ncoa1 in the emergence of definitive hematopoiesis in zebrafish. In conclusion, we demonstrate that identification of genes involved in transcriptional regulation differentially expressed between expanding FL HSCs and quiescent ABM HSCs, uncovers novel regulators of HSC function.
Introduction
L
Although it is well accepted that significant differences exist between the ability of FL and ABM HSCs to undergo symmetrical, self-renewing cell divisions without stem cell exhaustion, only few studies have addressed molecular pathways underlying these differences. For instance, the higher expansion potential of FL-derived HSCs has been at least in part ascribed to Lin28b-let-7-Hmga2-mediated signaling, even if Lin28b cannot reactivate the FL HSC-like self-renewal properties in ABM HSCs [9]. By contrast, Sox17, which is required for the maintenance of FL HSC function, can also reintroduce the FL proliferative phenotype in ABM HSCs [10,11]. Interestingly, conditional deletion of Lis1 in FL hematopoietic cells using Vav-cre was shown to cause defects in HSC expansion and embryonic lethality, and a similar phenotype was observed after the deletion of Lis1 in adult HSC which caused decreased HSC self-renewal and differentiation in competitive repopulation assays [12,13].
Gaining further insights into the molecular regulators that support symmetrical self-renewal is of significant clinical relevance in the setting of bone marrow failure syndromes, ex vivo HSC expansion methods, and in the field of leukemogenesis. To uncover candidate molecular regulators for FL HSC self-renewal, we performed RNA sequencing analysis to define the differences in the genome-wide transcriptome of HSCs from FL and ABM.
To investigate the functional role of differentially expressed genes for their importance in definitive hematopoiesis, we used zebrafish, Danio Rerio, as the model organism. In zebrafish, definitive HSCs that support multilineage engraftment appear along the ventral wall of the dorsal aorta, which is an equivalent of the AGM region and express c-myb and runx1 [14,15]. Several signaling pathways have been identified that regulate specification and development of HSCs in zebrafish, including Notch, Runx1, fibroblast growth factor, vascular endothelial growth factor, bone morphogenetic protein, and Hedgehog [16 –19]. These cellular and molecular mechanisms underlying the emergence or specification of these multipotent hematopoietic stem and progenitor cells are largely conserved between mammals and zebrafish [16,20 –22]. Hence, the easy accessibility to manipulate and visualize early stage embryos and the relatively high homology in the genetic regulation of hematopoiesis makes genetic screens in zebrafish a very useful method to interrogate, in a semi high-throughput manner, the role of specific genes in hematopoiesis.
We used our earlier published RNASeq [23] data to identify 18 differentially expressed genes between E14.5 FL and ABM HSC that could be important regulators for HSC expansion. Morpholino antisense oligonucleotide (MO) knockdown technology was used to address their possible role in hematopoiesis. Our study identified four differentially expressed genes, with previously unknown function in HSC biology, to affect emergence of definitive hematopoiesis in zebrafish larvae.
Materials and Methods
Animals
Six to ten weeks old C57BL/6J-CD45.2 (Centre d'Elevage R. Janvier, Le Genest-St Isle, France,
Isolation of LT-HSC from bone marrow and FL
The isolation and purification of LT-HSC from murine FL E14.5 and ABM has been described in our pervious study [23].
RNA sequencing and bioinformatics analysis
RNA-seq data obtained from E14.5 FL and BM HSCs described in [23] were reanalyzed in a similar manner as previously described [23]. Unlike in our previous publication [23], the high-quality reads were aligned to the mouse reference genome mm9 using SOAPaligner/SOAP2. Quality was checked for the alignment and later downstream analysis, including gene annotation, gene expression, alternative splicing, and novel transcript prediction was performed. The differential expression analysis of genes was performed using the R package DESeq [24] and differentially expressed genes were identified using the following thresholds: false discovery rate (FDR) ≤0.05 and log2-fold change ≥1.0. The Gene Set Enrichment Test was then carried out to detect significantly enriched gene sets using Genecodis [25]. Sequencing data related to FL and BM HSC can be accessed through ArrayExpress database (
Quantitative reverse transcription-polymerase chain reaction
For each replicate, we used three times six embryos that had been injected with MOs as well as uninjected controls 48 h postfertilization. Four to six replicates were collected and RNA was extracted using the GenElute Mammalian Total RNA Miniprep Kit (Sigma-Aldrich) following the manufacturer's instructions. A DNase treatment was performed while the RNA was bound to the column using an On-Column DNaseI Digestion Set (Sigma-Aldrich). Complementary DNA was synthetized using the SuperScript III First-Strand Synthesis SuperMix for quantitative reverse transcription-polymerase chain reaction (qRT-PCR) (Invitrogen) according to the manufacturer's protocol. qRT-PCR was performed in a FrameStar 384 plate (4titude) using the Platinum SYBR Green qRT-PCR SuperMix-UDG (Invitrogen). Rox Reference Dye was added to the Platinum SYBR Green qPCR SuperMix-UDG in a concentration of 50 nM. A list of primers used for the qRT-PCR can be found in Supplementary Table S1 (Supplementary Data are available online at
For some genes, differentially expressed gene identified between ABM and E14.5 FL was analyzed by qRT-PCR to confirm differential gene expression. RNA isolation and qRT-PCR was performed as previously described and list of primers used for the qRT-PCR can be found in Supplementary Table S1. Gene expression for different transcripts was calculated relative to β-actin as a housekeeping gene.
Morpholino injection
Zebrafish (D. rerio) were bred, raised, and maintained according to Animal Handling Guidelines at KU Leuven. Embryos were incubated at 28.5°C and staged according to hours postfertilization (hpf) and morphological features as published [26]. For high-throughput screening, double transgenic zebrafish with a DsRed reporter under the control of the gata1 promoter (Tg(gata1:DsRed)) and EGFP reporter under the control of the flk1 promoter (Tg(flk1:EGFP)) were used. MOs, targeting the translational initiation (starting codon) of candidate genes (Supplementary Table S2), preventing protein translation, were obtained from Gene Tools, LLC (Philomath, OR). For some genes, we designed second MOs targeting the splice junction (Supplementary Table S2).
MOs were injected at the 1- to 2-cell stage (70–100 embryos) with a starting concentration of 4 ng per embryo. The concentration was increased to 5, 6, 7 ng if there was no defect on blood flow [increase or decrease in DsRed (gata1) signal] and the concentration was decreased to 3, 2, 1.5 ng if there was a defect in blood to identify the lowest concentration possible. Embryos were screened under fluorescence microscope at 48 h postmicroinjection and imaged using Zeiss Axio Imager microscope.
Whole-mount in situ hybridization
Whole-mount in situ hybridization (WISH) for c-myb and runx1 expression was performed on uninjected and MO-injected embryos at 36hpf as described previously [27]. In brief, in situ hybridization using DIG-labeled antisense riboprobes runx1 and c-myb that were transcribed from linearized plasmid using T7 RNA polymerase (Roche). 36hpf embryos were fixed with 4% PFA overnight and permeabilized using Proteinase K (1 mg/mL) for 20 min. Embryos were hybridized overnight in water bath at 68°C. After hybridization, embryos were washed several times as previously described [27] and rinsed in MABT (Maleic Acid buffer +0.1% TWEEN-20). Next, incubate embryos in blocking solution (1 part 10% Boehringer Mannheim Blocking Reagent, 1 part lamb serum, 8 parts MAB) at RT for 2 to 3 h. Hybridization was detected using anti-DIG antibody (Roche) coupled to alkaline phosphatase (AP). Embryos were washed by MABT (6 × 15 min) to remove excess of antibody. DIG antibody-AP conjugate was detected using NBT/BCIP (Sigma). Stained embryos were mounted in 70% glycerol and imaged on an Olympus compound microscope with a camera.
Statistical analysis
The significance of difference was estimated by two-tailed Student's t-test. P ≤ 0.05 was considered statistically significant.
Results
Genome-wide transcriptome analysis of FL and ABM LT-HSCs
To define developmentally regulated differences in the transcriptome of extensively self-renewing FL HSCs and quiescent ABM HSCs, we reanalyzed RNA-seq obtained from HSCs derived from mouse FL and ABM as previously described [23]. LT-HSCs were isolated from E14.5 FL as Lin−Sca-1+Mac-1+CD150+CD48− cells, and from ABM HSCs as Lin−Sca-1+c-kit+ CD150+CD48− cells using fluorescence-activated cell sorting (FACS). RNA from all samples was amplified and subjected to 91 bp-end sequencing at the Beijing Genomics Institute (BGI, Shenzhen). Raw sequencing reads that had been filtered into clean reads, were aligned to the reference genome sequence mm9 using SOAPaligner/SOAP2. Alignment data were then used to calculate the distribution of reads on reference genes/genome (Supplementary Fig. S1A, B), and to obtain normalized expression values by calculating Reads Per Kilobase of transcript per Million mapped reads (Supplementary Table S3). Pearson correlation between the biological replicates demonstrated that samples at each stage were highly correlated (Supplementary Fig. S1C). Principal component analysis showed that the FL HSC populations were distinct from ABM HSCs (Fig. 1A).
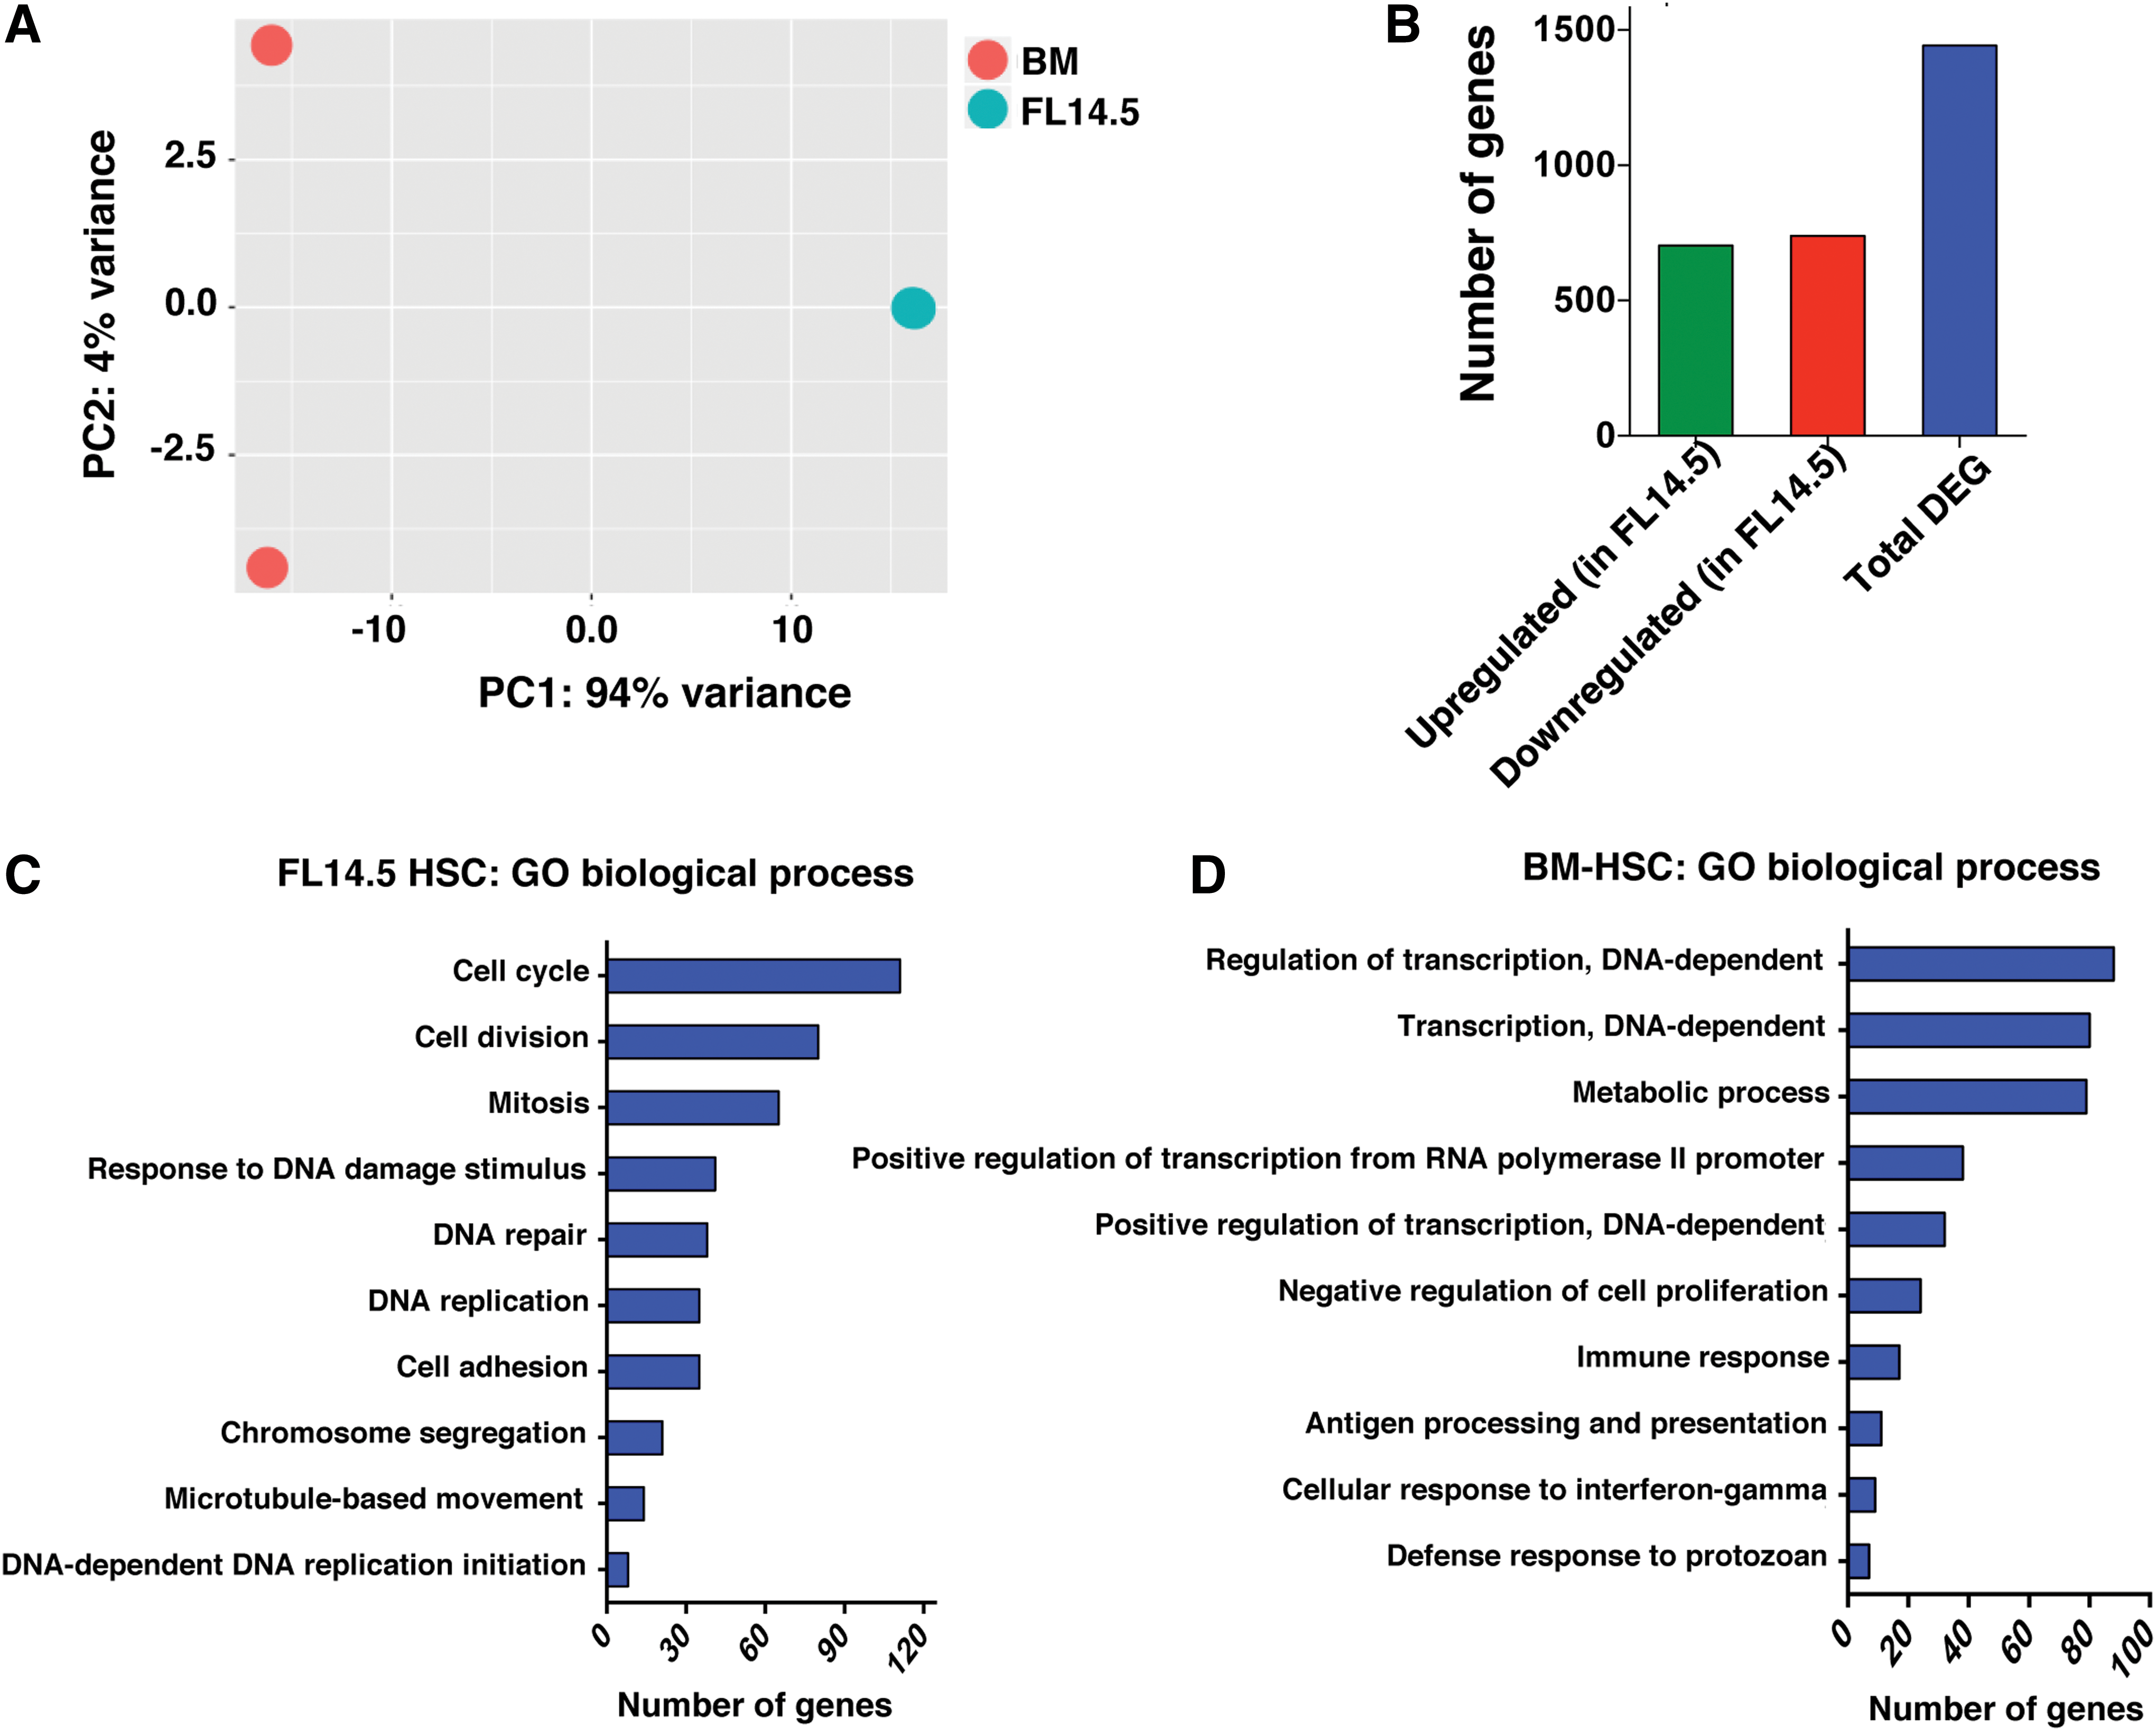
Genome-scale transcriptional profiling between murine FL and ABM LT-HSC.
Next, we performed a pair-wise comparison between both FL E14.5 and ABM HSCs to obtain differentially expressed genes using the DESeq method (Fig. 1B; Supplementary Table S4) [28]. Because HSCs expand most abundantly at around E14.5, we compared the transcriptome of E14.5 FL HSCs with the transcriptome of ABM HSCs obtained from 8-week-old mice, at which time HSCs are quiescent. We identified 1,442 genes differentially expressed between E14.5 FL HSCs and the ABM-derived HSCs (Log2FC ≥1 and FDR ≤0.05) (703 genes were more highly expressed and 739 genes less expressed in FL HSCs compared with ABM HSCs) (Fig. 1B; Supplementary Table S4).
We performed the Gene Set Enrichment Analysis for biological processes on genes differentially expressed between E14.5 FL and ABM (from our data published earlier [23]) using the web-based application, GeneCodis3 [25]. As expected, genes more highly expressed in FL E14.5 HSCs were enriched for biological processes related to cell proliferation, such as cell cycle, cell division, mitosis, DNA replication, and DNA repair (Fig. 1C). By contrast, genes more highly expressed in quiescent BM HSCs were enriched for biological processes related to the regulation of transcription, negative regulation of cell proliferation and antigen processing and presentation (Fig. 1D).
Shortlisting candidate genes from differentially expressed gene list for functional screen
To identify novel regulators of LT-HSC expansion, we selected genes annotated as “involved in transcription” (which include genes directly or indirectly involved in transcription) based on GO analysis, from the list of genes differentially expressed between murine FL E14.5 and ABM HSCs [29]. This yielded 269 differentially regulated genes, of which, 126 were more highly expressed in FL HSCs and 143 in ABM HSCs (Supplementary Table S5). Based on literature mining of this gene list, we identified 88 genes with known role in different aspects of hematopoiesis, such as self-renewal and differentiation of HSC, leukemia, etc. (Fig. 2A; Supplementary Table S6). Following removal of genes with known function in hematopoiesis, we identified a list of zebrafish orthologs for 123 of the genes differentially expressed between E14.5 FL and ABM HSCs (Fig. 2B; Supplementary Table S7). We designed MOs against 18 of these genes, 9 of which were more highly expressed in E14.5 FL HSCs, and 9 in ABM HSCs (Fig. 2B; Table 1). To confirm the differential expression observed by RNA-seq, we performed qRT-PCR on 8 of the genes that were selected for functional validation, and demonstrated consistent increased/decreased gene expression in 3–5 separately isolated FL or ABM HSC populations (Fig. 2C).

Shortlisting of genes differentially regulated between murine E14.5 FL and ABM.
BM, bone marrow; FL, fetal liver; MO, morpholino antisense oligonucleotide.
In vivo functional screen in zebrafish identified novel genes with role in hematopoiesis
The MOs were injected at different concentrations in 1- to 2-cell stage, double transgenic (Tg:gata1;DsRed/flk1;EGFP) zebrafish embryos, wherein endothelial cells express EGFP under the flk1 promoter and erythrocytes express dsRed under the gata1 promoter. A similar approach was previously used by our group to identify hematopoietic regulators from a gene list created by comparing the global gene expression of primitive HSCs with hematopoietic progenitors from human umbilical cord blood and ABM [30].
We assessed the presence and circulation of dsRed+ red blood cells and GFP+ endothelial cells at 48hpf by fluorescence microscopy. Five MOs (against tdg, uhrf1, uchl5, nfix, and ncoa1), caused a blood defect with either disruption in blood flow or reduction in gata1:Dsred expressing cells in more than 60% of embryos (Fig. 3A; Table 1). In addition to blood defects, several other phenotypes, including defects in neural development, abnormalities in vasculature, and remodeling of vessels in caudal vein plexus were also seen (Supplementary Table S8). Injection of 4 MOs (against taf6l, zbtb20, tle2, and pura) caused early embryonic lethality even when low doses of MOs were injected (Table 1). Injection of the other 9 MOs did not cause any specific hematopoietic defects, while embryos developed normally.
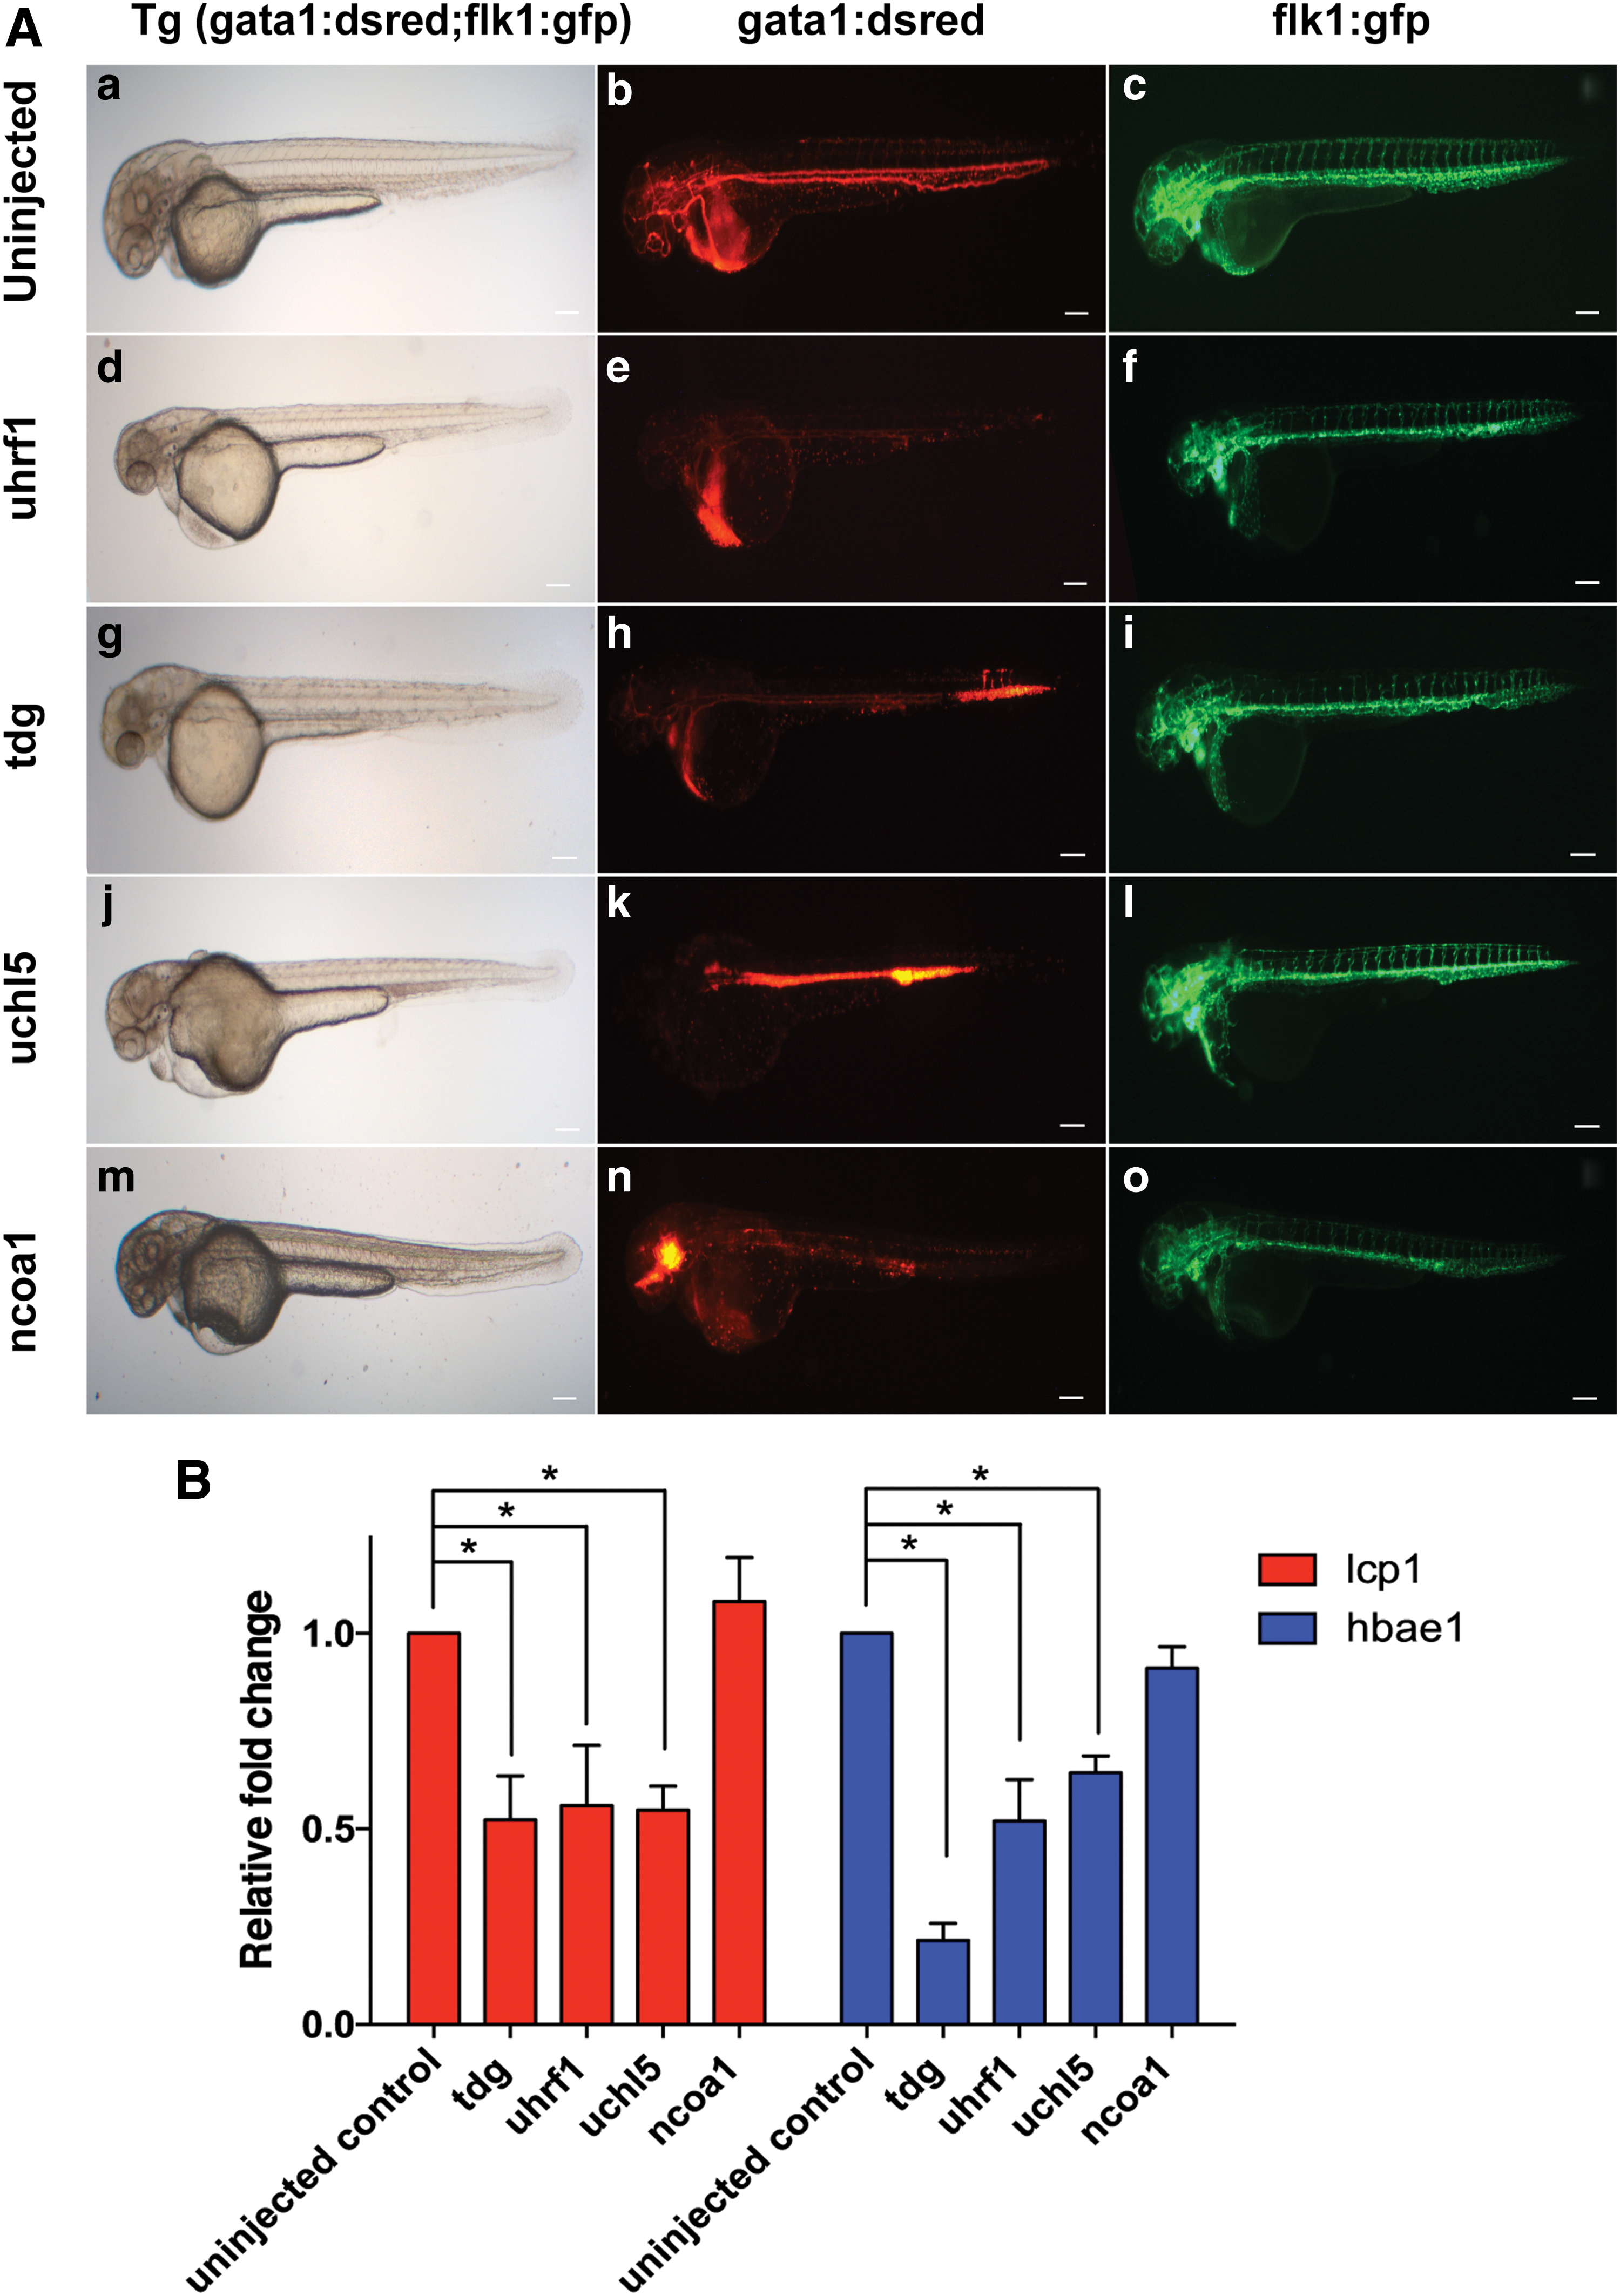
Morpholino knockdown of target genes in Tg:gata1;DsRed/flk1;EGFP zebrafish.
To evaluate the specificity of the MO knockdown, we used a 5-bp mismatch control against uhrf1, tdg, and uchl5 as well as a splice-blocking MO against tdg and uchl5. In embryos targeted with mismatch control MOs, we observed no difference in blood and endothelial formation relative to uninjected embryos at 48hpf (Supplementary Fig. S2A). Knockdown of tdg with a splice-blocking MO caused a similar phenotype as observed following injection of the translation-blocking MO (Supplementary Fig. S2B). By contrast, knockdown of uchl5 with a splice-blocking MO did not fully recapitulate the decrease in gata1+ cells or blood flow seen with the translation-blocking MO, even if the embryos were curled or bend from the trunk region (Supplementary Fig. S2B).
To further confirm the effect of the MOs against tdg, uhrf1, uchl5, and ncoa1 on hematopoiesis, we analyzed the expression levels of transcripts for lcp1 and hbae1 specific for erythroid and myeloid lineage, respectively, in the MO-treated 48hpf embryos by qRT-PCR (Fig. 3B). These studies demonstrated that MO-based knockdown of tdg, uhrf1, and uchl5 resulted in a significant reduction of transcripts specific for erythroid and myeloid (Fig. 3B). Knockdown of ncoa1 by contrast, caused no significant change in mature blood cell transcripts.
Knockdown of tdg, uhrf1, and ncoa1 inhibit definitive hematopoiesis
We next examined the expression of the definitive hematopoiesis markers runx1 and c-myb, to assess the effect of the MOs on the emergence of definitive hematopoiesis. Lineage tracing of HSCs during early hematopoietic development demonstrated that expression of runx1 and c-myb appear in the AGM between 28 and 48 h [31,32]. We, therefore, analyzed the expression of c-myb and runx1 in tdg, uhrf1, uchl5, and ncoa1 morphants at 36hpf by WISH. Based on transcript levels of c-myb and runx1 in different morphants, they were classified as normal, severely decreased, and absent expression.
In 80%–90% of tdg, uhrf1, or ncoa1 morphant embryos, the c-myb signal was severely reduced or absent, with loss of c-myb signal in 50% of tdg and uhrf1 and 40% of ncoa1 morphant embryos (Fig. 4A, B). In addition, a severe reduction or absent runx1 signal was seen in ∼80% of tdg, uhrf1, and ncoa1 morphant fish (Fig. 5A, B). However, we found fewer morphant fish with complete loss of runx1 signal compared with c-myb signal (Fig. 4A, B). In uchl5 morphants, we only detected a severe loss of runx1 signal in 8% of the embryos (Fig. 4A, B). Likewise, reduction of the c-myb signal was less pronounced in uchl5 morphants, where no c-myb signal was detected in 20% of the embryos and a severely decreased signal in 30% of embryos (Fig. 4A, B). Noteworthy, when we carefully examined c-myb expression in the uchl5 morphant fish, we detected an accumulation of c-myb signal in the posterior blood island (PBI) region (Fig. 4A, B). Thus, these MO knockdown studies demonstrate a role of tdg, uhrf1, and ncoa1 in the development of definitive hematopoiesis in the AGM region of zebrafish, whereas loss of uchl5 caused a less pronounced defect in emergence of definitive hematopoiesis.
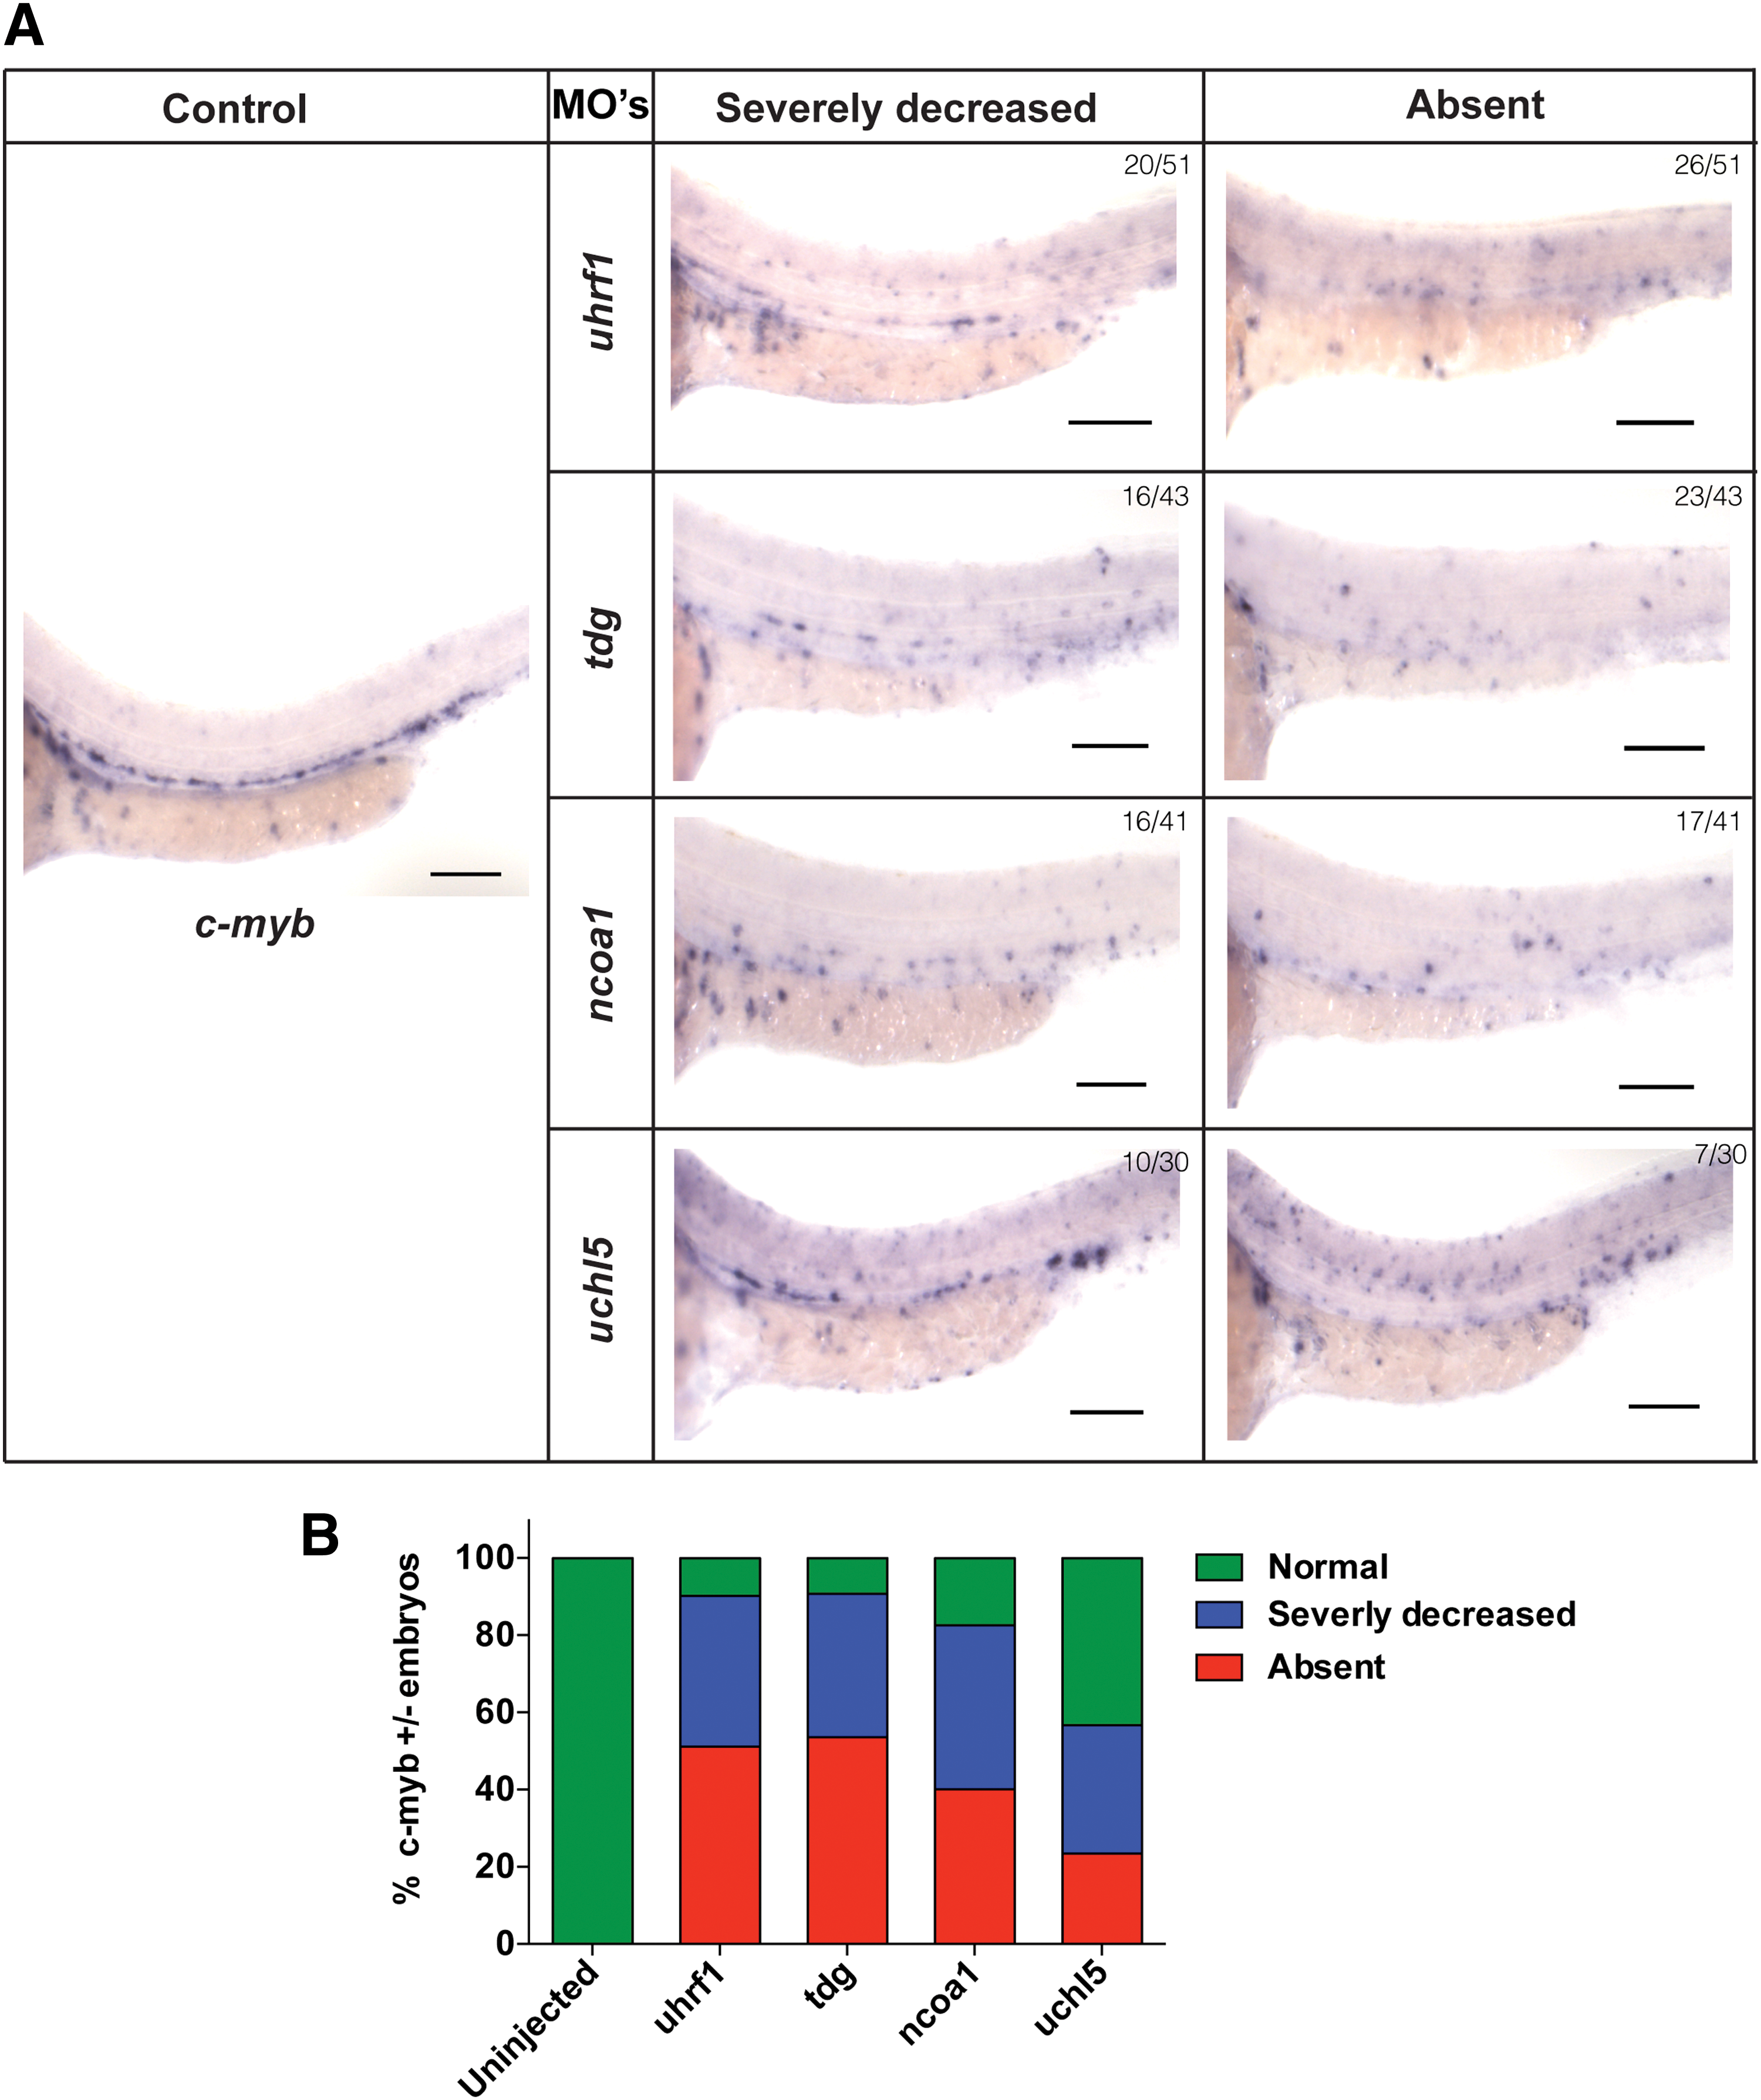
Expression of c-myb in control and morpholino-targeted embryos by WISH.
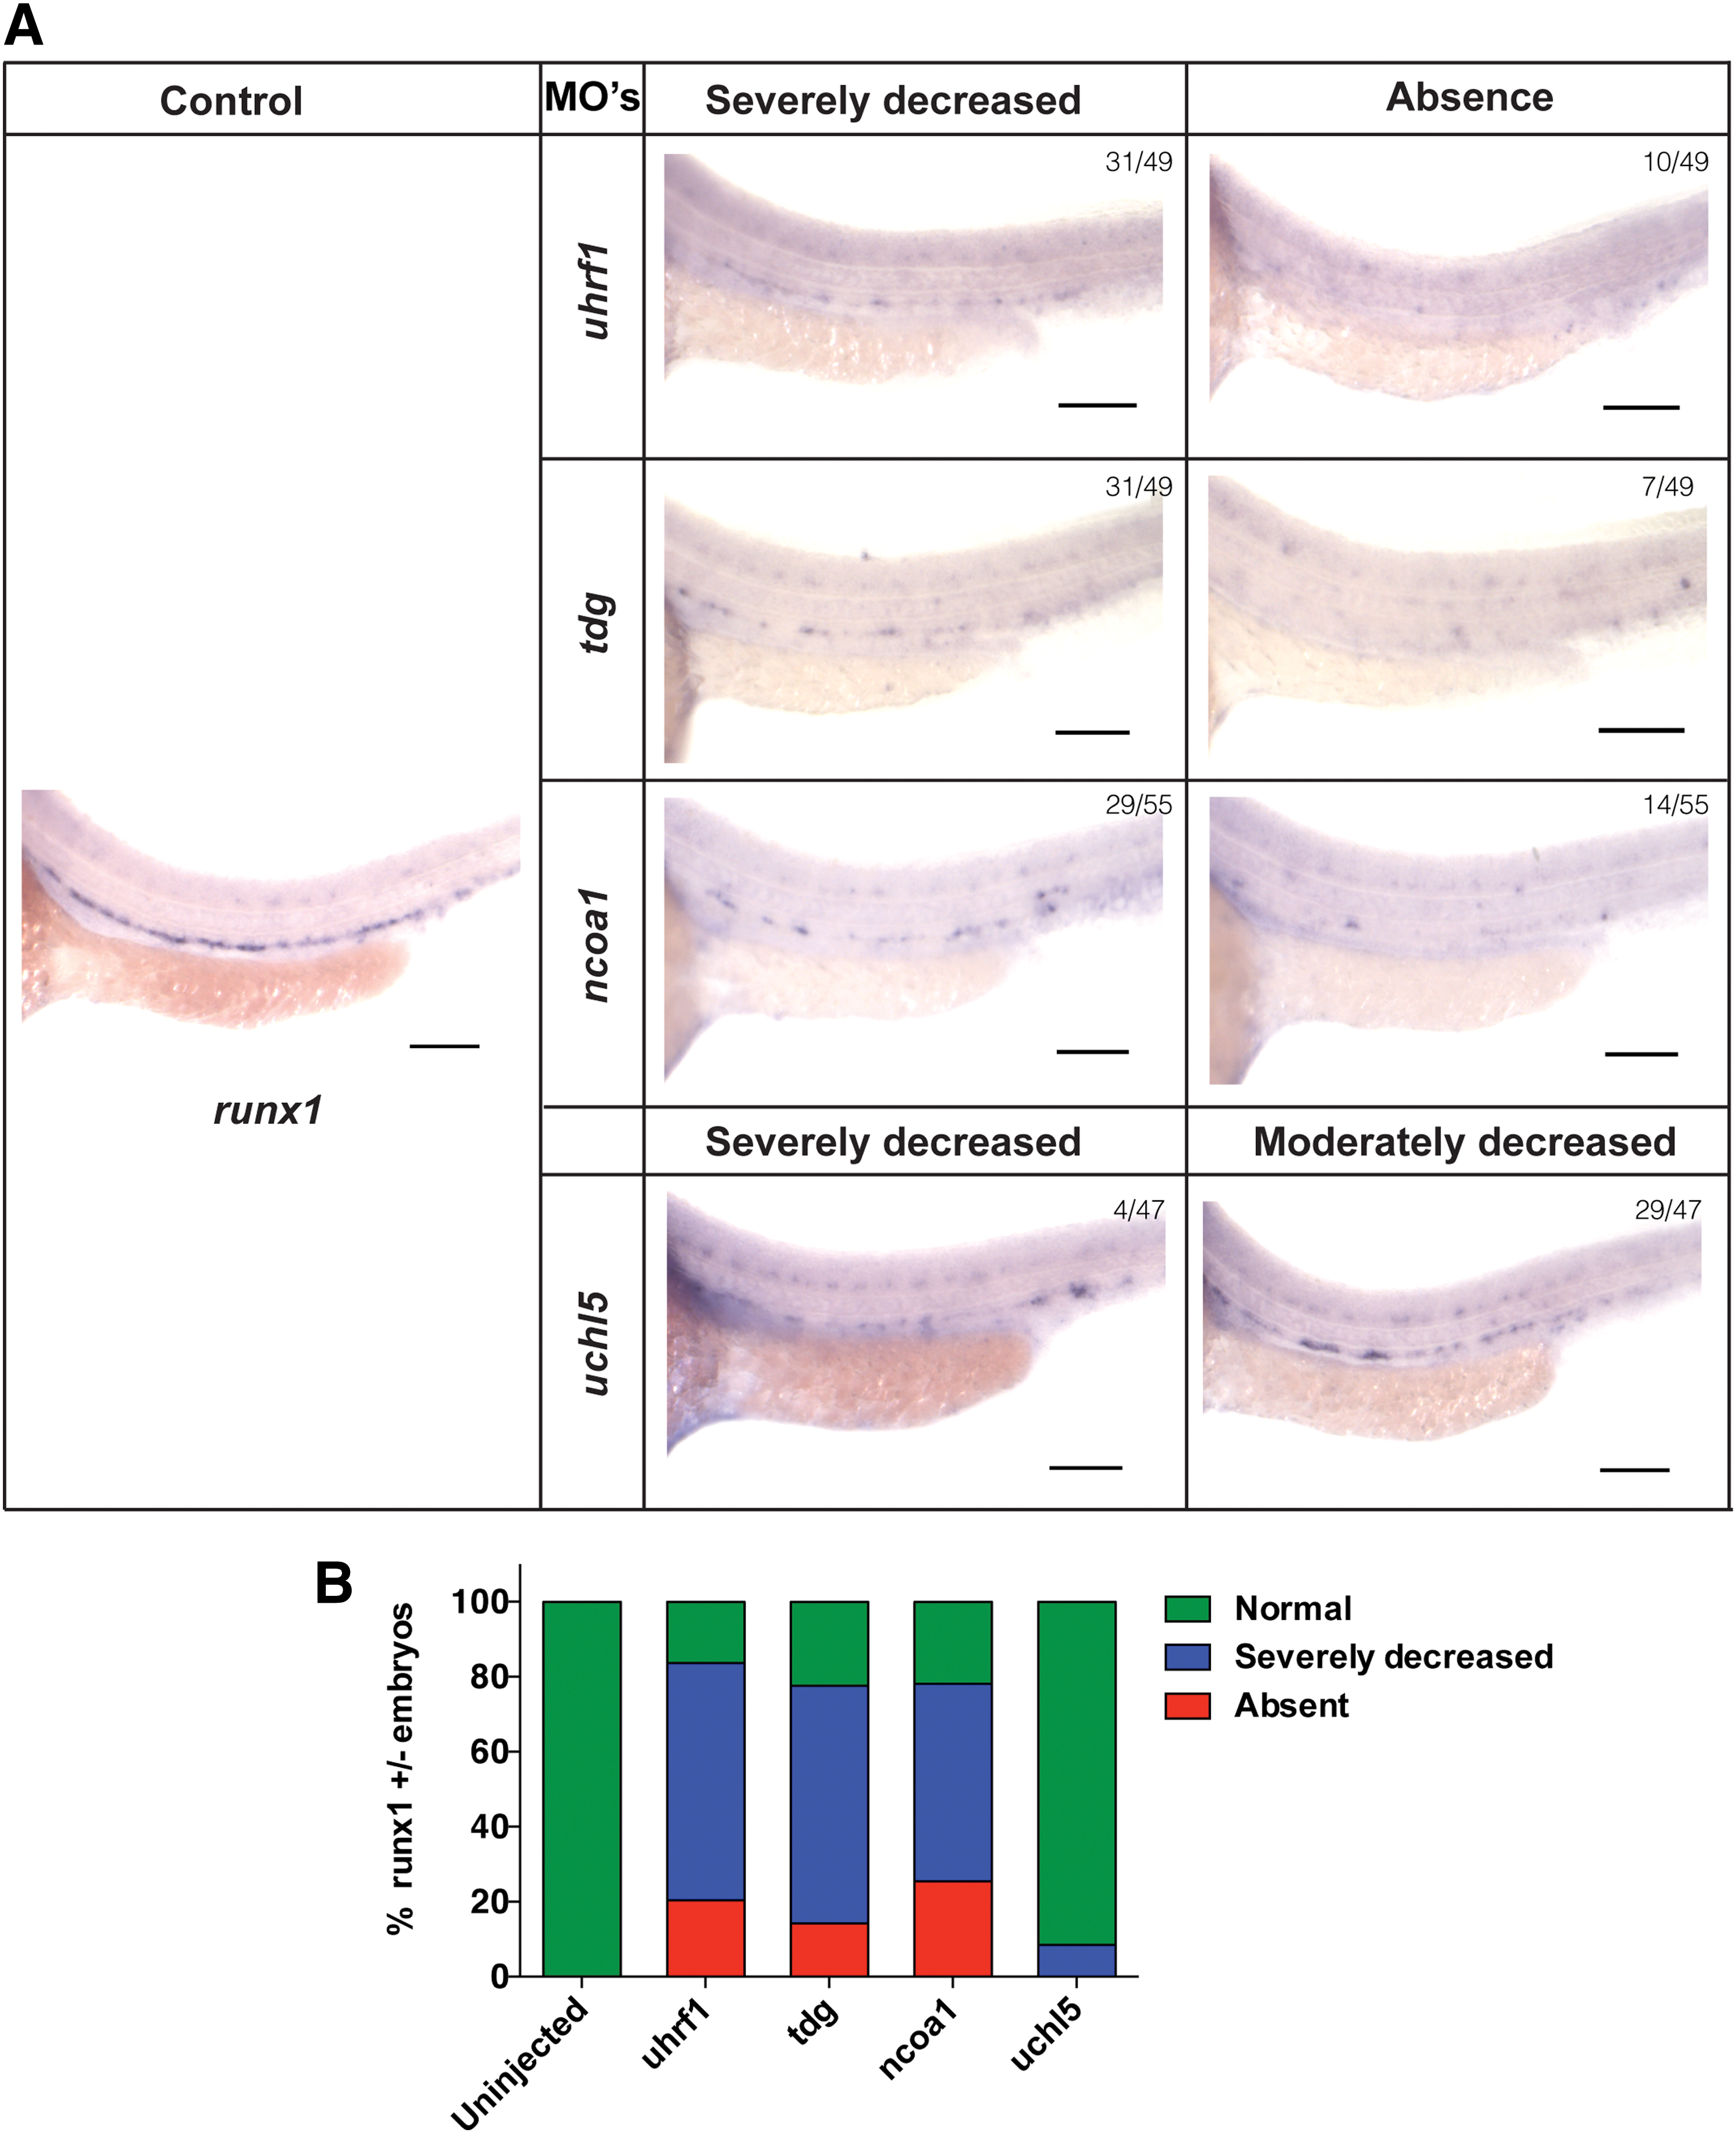
Expression of runx1 in control and morpholino-targeted embryos by WISH.
Discussion
The function of LTR-HSCs in ABM differs significantly from those in FL. During development, HSCs populate the FL at around E12.5, following which they expand extensively through symmetrical self-renewing cell divisions between E12.5 and 16.5, whereas from E16.5 onward, FL HSCs migrate to the developing BM through the blood circulation. In the fetal BM, expansion of the HSCs continues, although at a decreased rate, and LT-HSCs ABM loose the fetal HSC characteristics from 4 to 5 weeks after birth onward. In the ABM, LT-HSCs are largely quiescent and divide asymmetrically to generate short-term repopulating HSCs, which then repopulate the mature cell populations. As the molecular regulators for symmetrical stem cell divisions are yet to be identified, we compared the gene expression profile of LTR-HSCs derived from different FL stages and ABM. We used an RNA-Seq-based approach that allows identification of unknown transcripts involved in the processes. As RNA-Seq provides absolute quantification of the levels of expression with significantly lower background noise, identification of subtle transcriptional differences can be captured.
This was clearly the case in this study, as we did not only identify most of the known important hematopoietic regulators, but also several novel regulators. Studies to identify unknown transcripts, noncoding genetic elements, as well as alternatively spliced transcripts involved in the regulation of hematopoietic processes are ongoing. We also observed that differences in the transcriptome of HSCs isolated from FL tissues from different gestational stages were significantly less pronounced, compared with differences observed between the expressed transcriptome of FL and ABM HSCs (data not shown). Further analysis of these subtle differences between the different stages of FL HSC development might identify additional regulators involved in hematopoietic development or HSC function within the FL tissue.
In this study, we focused on differential gene expression between FL14.5 and BM HSCs, stages where HSCs are actively proliferating and remain quiescent, respectively. Two recent studies have used microarray-based gene expression analysis to compare the transcriptome of LT-HSCs in FL E14.5 and ABM [6,33]. McKinney-Freeman et al., who isolated FL HSCs as Lin−Sca-1+c-kit+CD150+CD48− cells and ABM HSCs as Lin−Sca-1+c-kit+CD150+CD34− cells, identified 128 differentially expressed genes between FL E14.5 and BM HSC (threshold; log2FC ≥2, FDR ≤0.05) [6]. Among these, 128 differentially expressed genes, 83 genes (∼60%) were also found in our list of 576 differentially regulated genes (Supplementary Fig. S3). In a second study, Beerman et al., who isolated FL HSCs Lin−Sca-1+c-kit+CD150+CD48− cells and ABM HSCs as Lin−Sca-1+c-kit+CD34-Flk2−Il7ra− cells, identified 403 genes differentially expressed between FL and ABM HSCs, among which 147 genes (∼35%) were also identified in our dataset (Supplementary Fig. S3A–C) [33]. Whether the differences in markers used for HSC isolation might explain the decreased overlap between genes found differentially expressed in our study and the Beerman et al. [33] study is not clear. Nevertheless, significant concordance exists between the three studies.
In this study we focused on the role of transcription regulators, that is, genes that are directly or indirectly involved in transcription, as these may be major players in the different proliferative behaviors of FL and ABM HSCs. Following removal of genes with known function in hematopoiesis, and defining for which transcripts a putative zebrafish ortholog exists, we shortlisted 123 differentially expressed E14.5 FL and ABM HSCs. For 18 genes from this list, MOs were designed to assess the effect on the emergence of HSCs in double transgenic (Tg:gata1;DsRed/flk1;EGFP) D. rerio embryos. Injection of nine of these MOs caused defects in zebrafish larvae.
Embryonic lethality was observed following injection of MOs against taf6l, Zbtb20, tle2, and pura. Whether they would affect HSC emergence cannot thus be defined using this approach. Currently no taf6l and tle2 knockout mice have been described. However, in X. tropicalis, the Groucho/TLE family member, Tle2, together with FoxG1 is involved in specification of the ventral telencephalon [34]. Loss of Zbtb20 in mouse results in severe growth retardation, aberrant glucose metabolism, and postnatal lethality [35]. Zbtb20 acts as a transcriptional repressor of alpha-fetoprotein and is involved in specification of the CA1 field in developing hippocampus [36,37]. Finally, loss of Pura in mouse leads to death postnatally between d18-28 days, and the mice show significantly decreased numbers of neurons in the hippocampus and cerebellum, indicating its role in brain development [38].
We also demonstrated that MOs against tdg, uchl5, ncoa1, nfix, and uchl5 affected the gata-1+ cell number or circulation at 48hpf. For most MOs, we also identified abnormalities in neural development and vasculature. Combined defects in HSC emergence and vasculature might be due to the fact that hematopoietic and vascular cells originate from a common progenitor, that is, the hemogenic endothelium. The effects of MOs targeting tdg and nfix on brain development are consistent with the known roles of these transcriptional regulators in brain development [39,40].
Aside from assessing the effects of the MOs against tdg, uchl5, ncoa1, and uchl5 on gata-1 + cells in the zebrafish circulation, we also assessed the emergence of runx1 + and c-myb + HSCs by WISH on 36hpf, at which time the definitive HSCs emerge in the AGM. These studies revealed that MOs against tdg, uchl5, ncoa1, and to a lesser extent uchl5, resulted in a significantly lower numbers of HSCs appearing in the ICM. Among these genes, tdg, uchl5, and uhrf1 are more highly expressed in FL HSCs, whereas ncoa1 is more highly expressed in ABM HSCs.
Although myeloid- and erythroid-specific gene expression, as well as the number of gata-1 + cells were significantly decreased in uchl5 morphants, we did not observe significant changes in HSC numbers in the AGM. However, we found an accumulation of c-myb + hematopoietic precursors in the PBI, which represents a region where bipotent erythromyeloid progenitors (EMP) reside temporarily between 24 and 36hpf, and marks a transient definitive wave of hematopoiesis that exists between primitive and definitive hematopoiesis [41]. This suggests that uchl5 may be important for the differentiation of EMPs, causing their accumulation with concomitant loss of mature blood cells. UCHL5 is a deubiquitinating enzyme, which can reverse Smurf-mediated ubiquitination of Smad transcription factors [42], known to play important roles in hematopoietic development, as well as in postnatal HSCs. Uchl5 knockout mice die prenatally, because of severe defects in brain development [43].
The ncoa1 morphants were the only ones wherein mature blood cell marker expression was not affected, even if HSCs in the AGM were decreased. Ncoa1 is known to play a role in chromatin remodeling through the recruitment of other coactivators. Ncoa1 knockout mice show a partial resistance to sex steroid hormones, affecting the reproductive system, the skeleton, glucose production [44], and has a role in the development of Purkinje cells in the brain, resulting in moderate motor dysfunction [45]. Why loss of ncoa1 expression decreases the number of c-myb/runx1 + HSCs in the AGM of zebrafish larvae, even though it is more highly expressed in the ABM, will need to be further investigated.
Knockdown of tdg and uhrf1 had profound effects on the development of the hematopoietic system at 48hpf (as demonstrated by lack of circulating blood, and severely decreased expression of runx1 and c-myb messenger RNA). TDG and UHRF1 play important roles in DNA methylation, as well as in DNA repair. Tdg is one of the enzymes that starts base excision repair, which corrects, among others, damage to the DNA by oxidation; whereas Uhrf1 plays a role in DSBR [46 –48]. We recently reported significantly higher expression in the expression of OxPhos genes in FL compared with BM HSCs, which was accompanied with the presence of significantly more and more active mitochondria, increased oxygen consumption rate, and increased reactive oxygen species (ROS) levels in FL HSCs compared with BM HSCs [23]. KEGG pathway analysis also demonstrated that all DNA repair pathways were significantly more enriched in FL compared with BM HSCs. We speculate that this may be required for FL HSCs to be capable to deal with the significantly higher ROS levels, known to cause DNA damage, and HSC exhaustion. In line with this hypothesis, we found that MO knockdown of two genes involved in DNA repair, namely Tdg and Uhrf1, caused significant hematopoietic toxicity in the zebrafish model. Knockout of Tdg and Uhrf1 in mice is associated with embryonic lethality [49]/early gestational death [50]; therefore, their effect on mammalian hematopoiesis remains unevaluated. Lineage-specific knockout studies or shRNA-mediated inhibition of both genes in HSCs will be required to address if Tdg and Uhrf1 affect HSC in mammals.
In conclusion, we identified three new hematopoietic regulators that affect the emergence and/or proliferation of definitive HSCs in zebrafish. It will obviously be of interest to demonstrate in future studies that knockdown or overexpression of these regulators in mammalian HSCs can increase HSC expansion.
Footnotes
Acknowledgments
This work was supported by Fonds Wetenschappelijk Onderzoek (FWO) funding (G085111N and 1.2.665.11.N.00) to S.K., FWO grants (G085111N10 and G0D1715N), Odysseus funding, CoE-SCIL, PF03, and GOA/11/012 funding from KU Leuven, and the Balcaen fund, Steverlynck fund, and Vanwayenberghe fund to C.M. Verfaillie. The authors wish to thank Prof. Stein Aerts for help with resources and reviewing the article. The authors also thank Pier Andree Pentilla and Rob Van Rossom for assistance with fluorescence-activated cell sorting and analysis and Thomas Vanwelden and Sarah Schouteden for technical support.
Author Disclosure Statement
Authors do not make any disclosure, as there is no actual or potential conflict of interest.
References
Supplementary Material
Please find the following supplemental material available below.
For Open Access articles published under a Creative Commons License, all supplemental material carries the same license as the article it is associated with.
For non-Open Access articles published, all supplemental material carries a non-exclusive license, and permission requests for re-use of supplemental material or any part of supplemental material shall be sent directly to the copyright owner as specified in the copyright notice associated with the article.