
Abstract
Bone marrow (BM)-derived mesenchymal stromal cells (MSCs) frequently display alterations in several hematologic disorders, such as acute lymphoid leukemia, acute myeloid leukemia (AML), and myelodysplastic syndromes. In acute leukemias, it is not clear whether MSC alterations contribute to the development of the malignant clone or whether they are simply the effect of tumor expansion on the microenvironment. We extensively investigated the characteristics of MSCs isolated from the BM of patients with de novo AML at diagnosis (L-MSCs) in terms of phenotype (gene and protein expression, apoptosis and senescence levels, DNA double-strand break formation) and functions (proliferation and clonogenic potentials, normal and leukemic hematopoiesis-supporting activity). We found that L-MSCs show reduced proliferation capacity and increased apoptosis levels compared with MSCs from healthy controls. Longer population doubling time in L-MSCs was not related to the AML characteristics at diagnosis (French–American–British type, cytogenetics, or tumor burden), but was related to patient age and independently associated with poorer patient outcome, as was cytogenetic prognostic feature. Analyzing, among others, the expression of 93 genes, we found that proliferative deficiency of L-MSCs was associated with a perivascular feature at the expense of the osteo-chondroblastic lineage with lower expression of several niche factors, such as KITLG, THPO, and ANGPT1 genes, the cell adhesion molecule VCAM1, and the developmental/embryonic genes, BMI1 and DICER1. L-MSC proliferative capacity was correlated positively with CXCL12, THPO, and ANGPT1 expression and negatively with JAG1 expression. Anyway, these changes did not affect their in vitro capacity to support normal hematopoiesis and to modify leukemic cell behavior (protection from apoptosis and quiescence induction). Our findings indicate that BM-derived MSCs from patients with newly diagnosed AML display phenotypic and functional alterations such as proliferative deficiency that could be attributed to tumor progression, but does not seem to play a special role in the leukemic process.
Introduction
D
Mesenchymal stromal cells (MSCs) are the main cellular component of the hematopoietic niche [6 –8] in the BM, a specialized microenvironment site that controls self-renewal and quiescence of HSCs. MSCs are multipotent cells that give rise to vascular smooth muscle cells, adipocytes, osteoblasts of the BM, and also chondroblasts. Alterations of the BM stromal cell compartment have been shown in de novo AML, including a reduction in the number of fibroblasts and adipocytes and a decreased growth capacity [9 –14]. However, it is not yet evident if MSC long-term hematopoietic-supporting activity in AML at diagnosis is intrinsically impaired [12] or not [10]. Otherwise, several recent reports have highlighted the abnormal MSC function in chronic preleukemic diseases such as myelodysplastic syndromes (MDSs) [15 –17] in contrast to chronic myelogenous leukemia (CML) [18,19].
In primary AML, it remains to be clarified whether the observed microenvironmental alterations contribute to the development of the malignant clone or are simply the consequence of cancer cell proliferation at the onset of the disease. Some reports have shown that leukemic cells alter the hematopoietic function of the BM microenvironment by disrupting the hematopoietic niches [20] and by inducing sympathetic neuropathy that increases BM leukemic infiltration [21]. In addition, the microenvironment contribution to leukemia progression has been suggested by the occurrence of hematopoietic malignancies derived from donor cells in recipients of allogeneic HSC transplants [22,23] and was demonstrated in animal models [24 –26].
The present study investigated the relationship between the phenotype (extensively analyzed) and function of MSCs isolated from the BM of patients with newly diagnosed de novo AML (L-MSCs). As in previous reports, we found that L-MSCs often display a proliferative deficiency. In this study, we show that this abnormality, correlated with the patient's age, is not related to AML characteristics at diagnosis [French–American–British (FAB) type, cytogenetics, or tumor burden] and is independently associated with poorer patient outcome. Analyzing, among others, the expression of 93 genes, we found that proliferative deficiency of L-MSCs was associated with a perivascular feature at the expense of the osteo-chondroblastic lineage with lower expression of several niche factors, such as KITLG, THPO, and ANGPT1, the cell adhesion molecule VCAM1, and the developmental/embryonic genes, BMI1 and DICER1. L-MSC proliferative capacity correlated positively with CXCL12, THPO, and ANGPT1 expression and negatively with JAG1 expression. Nevertheless, these changes, probably induced by tumor expansion, did not affect the in vitro capacity of MSCs to support normal hematopoiesis and to modify the leukemic cell biology (protection from apoptosis and quiescence induction).
Materials and Methods
Patients and normal controls
All patients included in this study (12 males and 7 females) had de novo AML followed at the Department of Clinical Hematology, University Hospital, Tours, France, and gave their informed consent for cell banking according to the Declaration of Helsinki, and the study was approved by the French Ministry of Higher Education and Research (authorization number No. DC-2008-308). BM samples were collected at diagnosis for MSCs and contained 87% of blast cells (median value), while peripheral blood (PB) leukocyte count was in median 57 g/L. Patients had a median age of 48 years at the time of BM aspiration. According to the FAB classification, AMLs were classified as AML-M0/1 (n = 10 patients), AML-M3 (n = 3), and AML-M4/5 (n = 6). The patients' clinical data are reported in Supplementary Table S1 (Supplementary Data are available online at
BM-derived MSC expansion and clonogenic capacity
BM cells obtained by iliac crest or sternal aspiration were centrifuged and propagated in expansion medium.
Proliferation capacity
To measure MSC proliferation capacity, the population doubling time (PDT) was estimated at each passage and by flow cytometry using the carboxyfluorescein succinimidyl ester (CFSE).
Colony-forming unit-fibroblast assay
MSC clonogenic capacity was assessed by seeding 10–40/cm2 adherent cells in T-25 flasks. At day 10, cell clusters containing more than 50 cells were scored as colony-forming unit-fibroblast (CFU-F) colonies using an inverted microscope. Details are provided in the Supplementary Methods section in Supplementary Data.
BM-derived MSC differentiation potential
Multipotency of adherent MSCs was evaluated by inducing differentiation toward the adipogenic, osteogenic, and chondrogenic lineages. Detailed information is available in the Supplementary Methods section in Supplementary Data.
MSC cycle analysis
The percentage of detached MSCs in the G0, G1, or S/G2/M phase of the cell cycle was determined by flow cytometry after staining with 7-AAD and an anti-human KI67-Alexa Fluor 488-conjugated antibody, as previously described [27]. Additionally, expression of the cell cycle proteins, cyclin D1, p21, p27, and p53, in MSCs was investigated by western blotting. Details are provided in the Supplementary Methods section in Supplementary Data.
MSC damage evaluation
MSC apoptosis
Cell apoptosis rate was assessed by flow cytometry using the Annexin V-fluorescein isothiocyanate (FITC)/7-AAD Kit (Beckman Coulter) [28]. Late apoptosis was assessed in ethanol-permeabilized cells after 7-AAD staining to detect hypoploid nuclei (sub-G1 peak).
Cell senescence
Senescence rates were assessed on adherent layers of MSCs at 70% confluence, using the Senescence Cells Histochemical Staining Kit (Sigma Aldrich).
MSC telomere length
DNA from MSCs was extracted with the Genomic DNA from Tissue kit (Macherey-Nagel Dueren). MSC telomere length was measured by Southern blot analysis of terminal restriction fragments as previously described [29].
Reactive oxygen species production
The amount of intracellular reactive oxygen species (ROS) was evaluated in trypsin/ethylenediaminetetraacetic acid (EDTA)-harvested MSCs by CM-H2DCFDA staining (Molecular Probes).
DNA double-strand break formation
The presence of DNA double-strand breaks (DSBs) was assessed in detached MSCs by staining with an FITC-conjugated antibody against phospho-histone H2AX (Ser139) (γH2AX) (clone JBW301, IgG1; EMD Millipore) after ethanol permeabilization. Details are provided in the Supplementary Methods section in Supplementary Data.
MSC gene and protein expression related to niche function
Reverse transcriptase–quantitative polymerase chain reaction analysis
We evaluated 93 genes (Supplementary Table S2) by TaqMan reverse transcriptase–quantitative polymerase chain reaction analysis (RT-qPCR).
Cytokine concentration in MSC supernatants
Cytokine levels were measured in supernatants of subconfluent MSCs at P2 by enzyme-linked immunosorbent assay (ELISA) using the Quantikine Human Immunoassays (R&D Systems) for stromal cell-derived factor-1 alpha (SDF-1α), angiopoietin-1 (ANG-1), thrombopoietin (TPO), and stem cell factor (SCF), according to the manufacturer's recommendations.
Immunophenotype analysis
Membrane antigen expression was assessed by flow cytometry after direct (for CD45, CD14, CD34, CD309, CD73, CD90, CD105, CD49e, and CD146) or indirect (for CD106) staining of trypsin/EDTA-detached subconfluent MSCs at P2.
Immunofluorescence
The MSC expression of fibronectin, alpha smooth muscle actin (ASMA), and nestin was observed by immunofluorescence staining. Details are provided in the Supplementary Methods section in Supplementary Data.
MSC hematopoietic-supporting activity assessed by Dexter-type long-term cultures
Confluent MSCs cultured in T-25 flasks were irradiated and recharged with normal peripheral CD34pos cells in hydrocortisone-supplemented Myelocult® medium (H5100; StemCell Technologies) as described in the Supplementary Methods section in Supplementary Data. Hematopoietic progenitor cell (HPC) production was assessed weekly for 5 weeks.
MSC leukemic cell supporting activity
MSC influence on leukemic cell behavior was evaluated by coculturing MSCs from patients with AML-M0/1 (L-MSC) or from controls (N-MSC) with KG1a cells for 3 days (n = 6/each group) or with primary blast cells (AML-M0/1) in heterologous or autologous settings for 2 days (n = 4 for each group and each setting). Controls were KG1a cells (n = 3) and primary blast cells (n = 4) grown without MSCs. Apoptosis rate [28], cell cycle distribution [27], and DNA DSBs in leukemic cells (CD45pos cell fraction) grown with or without MSCs were assessed by flow cytometry. Detailed information is available in the Supplementary Methods section in Supplementary Data.
Statistical analyses
N-MSCs and L-MSCs were compared using the nonparametric Mann–Whitney test in all experiments, except for cocultures of MSCs with leukemic cells where paired values were analyzed with the nonparametric Wilcoxon test. Correlations between quantitative values were evaluated by the Spearman rank test. Multivariate analysis was performed using the multiple stepwise regression test. Differences were considered significant when P < 0.05.
Results
Adherent cells from BM of patients with AML exhibit characteristics of multipotent MSCs
To characterize the adherent BM cells isolated from patients with newly diagnosed AML and from controls, the expression of hematopoietic (CD14, CD34, and CD45) and endothelial (CD31 and CD309) markers was assessed at P2 and found to range between <1% and 5%. CD45neg cells from patients and controls expressed classical MSC markers (CD73, CD90, and CD105) (Fig. 1A) and could differentiate into adipogenic, osteogenic, and chondrogenic lineages (Fig. 1B). These results indicate that BM-derived adherent cells from both patients with AML (L-MSCs) and normal controls (N-MSCs) meet all the criteria to be considered MSCs [30] and show no obvious different characteristics.

Adherent cells from bone marrow of AML patients and normal controls display typical mesenchymal characteristics.
The proliferation capacity of MSCs isolated from patients with AML is decreased and is independently related to patient outcome
MSC proliferation capacity was assessed by calculating the PDT, which was significantly longer in L-MSC than in N-MSC samples (P < 0.01; Fig. 2A) with wide interindividual variation. Conversely, the clonogenic potential, evaluated with the CFU-F assay in MSC samples at P2, tended to be lower in L-MSC than in N-MSC samples (P = 0.16; Fig. 2B), while an inverse correlation was found between CFU-F and PDT values (ρ = 0.79, P < 0.001). Interestingly, L-MSCs isolated at diagnosis from patients who experienced treatment failure or early relapse (Supplementary Table S1) had significantly higher PDT values at P2 than L-MSCs from patients remaining in complete remission (Fig. 2C; P < 0.01). No significant correlation was found between PDT and sex, FAB type, PB leukoblast count, BM leukoblast percentage, and cytogenetic prognostic feature at diagnosis. However, PDT correlated with patient age, as expected (ρ = 0.57; P < 0.05). The lower L-MSC proliferation capacity was confirmed by the decreased difference between the mean fluorescent intensity values of CFSE staining at 24 and 96 h in L-MSC cultures compared with controls (P < 0.05; Fig. 2D). However, no difference in the cell cycle distribution between N-MSC and L-MSC samples was detected by flow cytometry analysis after 7-AAD and KI-67 staining (Supplementary Fig. S1A). Accordingly, cell cycle regulatory proteins (cyclin D1, p21, p27, and p53) were expressed at comparable levels in L-MSC and N-MSC cultures (Supplementary Fig. S1B, C).

MSCs from AML patients (L-MSCs) have lower proliferative potential than MSCs from normal individuals (N-MSCs).
Flow cytometry analysis after Annexin V/7-AAD staining revealed higher rates of early apoptotic cells (7-AADneg/Annexin Vpos) (P < 0.05; Fig. 3A) and also necrotic cells (7-AADpos/Annexin Vpos) (P < 0.05; data not shown) in L-MSC than in N-MSC cultures at P2. Likewise, when only late apoptosis was investigated, after 7-AAD staining, L-MSCs showed an increase in the percentage of hypoploid cells (sub-G1 phase) (P < 0.05; Fig. 3B). Similar results were obtained when the death rate was measured with trypan blue exclusion staining (P < 0.05). However, increased levels of DNA DSBs, cell senescence, telomere length changes, and intracellular ROS levels could not be detected in L-MSCs when evaluated at the end of the second passage (Supplementary Fig. S2A–D). It should be noted that senescence values in L-MSCs were particularly dispersed (Supplementary Fig. S2B).

L-MSCs show higher apoptosis rates than N-MSCs.
To investigate whether L-MSC characteristics (PDT, clonogenic potential, senescence levels) might independently influence patient outcome (complete remission or disease progression), a multivariate stepwise regression analysis was carried out by integrating these variables with patient and disease characteristics (sex, age, PB leukoblast count, BM leukoblast percentage, FAB type, and cytogenetic prognostic feature at diagnosis). The only two independent prognostic factors found for patient outcome (P < 0.01) were cytogenetic prognostic value (F = 6.11) and especially PDT (F = 13.63).
The expression of niche factors is downregulated in MSCs from AML patients
To further characterize L-MSCs, the expression of 95 genes (including the control genes B2M and EIF2B1; Supplementary Table S2) was evaluated in L-MSCs and N-MSCs by RT-qPCR. Although 11 genes could not be amplified (CCL19, COL2A1, CXCL9, GPX2, GPX5, IHH, LPL, PROM1, SHH, TERT, and WNT3A), the transcriptional profile of the other genes, including 22 niche-related genes, showed decreased expression (P < 0.05) of genes encoding secreted cytokines, such as ANG-1 (ANGPT1), SCF (KITLG), and TPO (THPO), in L-MSCs compared with N-MSCs (Fig. 4A), while the expression of the genes encoding SDF-1α (CXCL12), FLT3-Ligand (FLT3LG), and Jagged 1 (JAG1) was similar between groups. Conversely, the expression of genes encoding the adhesion molecules, integrin alpha 5 (CD49e/ITGA5) (P < 0.01) and melanoma cell adhesion molecule (CD146/MCAM) (P < 0.05), was increased in L-MSCs compared with N-MSCs, whereas the genes encoding VCAM-1 (CD106/VCAM1) and integrin alpha 6 (CD49F/ITGA6) were downregulated (P < 0.05). Gene expression of MSC markers, such as ASMA (ACTA2), nestin (NES), and NGF receptor (CD271/NGFR), and of extracellular matrix molecules, such as fibronectin 1 (FN1), collagen 1A1 (COL1A1), 4A1 (COL4A1), and osteopontin (OPN/SPP1), was not significantly different between groups. Among the other 60 genes (Supplementary Fig. S3A, B), genes involved in the osteogenic lineage, such as osteocalcin (OCN/BGLAP) and RUNX2, or in the chondrogenic lineage (COL10A1) were downregulated in L-MSCs compared with N-MSCs (P < 0.05), whereas BMP1 was upregulated (P < 0.05) and no change was observed in PPARG, an adipogenic lineage gene. RUNX2 and BMP1 expression was inversely correlated (ρ = −0.61; P < 0.05). The expression of developmental/embryonic genes, such as OCT4/POU5F1, SOX2, and NANOG, was unchanged, but for BMI1 that was downregulated in L-MSCs (P < 0.05) as found for DICER1, a gene encoding a ribonuclease involved in the RNA interference pathway. However, the reduction of KITLG, ANGPT1, and THPO gene expression was not confirmed by ELISA analysis of secreted niche factors in L-MSC and N-MSC supernatants (Fig. 4B–E). Likewise, increased CD49e and CD146 gene expression in L-MSCs was only associated with a tendency to increased membrane protein expression quantified by flow cytometry (Fig. 4F). Nevertheless, CD146 gene expression positively correlated with CD49e protein expression (ρ = 0.74; P < 0.01). It is noteworthy that CD146 protein expression level also positively correlated with BM leukoblast percentage in L-MSCs (ρ = 0.80; P < 0.001) and inversely correlated with the patient age considering MSCs from leukemic patients, normal controls, or both (ρ = 0.63; P < 0.001). CD106 protein (VCAM-1) expression was meanwhile significantly decreased in L-MSCs compared with N-MSCs (P < 0.05; Fig. 4G), in accordance with the mRNA findings (Fig. 4A). No qualitative or quantitative differences between L-MSCs and N-MSCs in the extracellular matrix deposition of fibronectin and the intracellular expression of the cytoskeleton proteins ASMA and nestin were observed by immunofluorescence analysis (Fig. 5), according to the gene expression data (Fig. 4A).
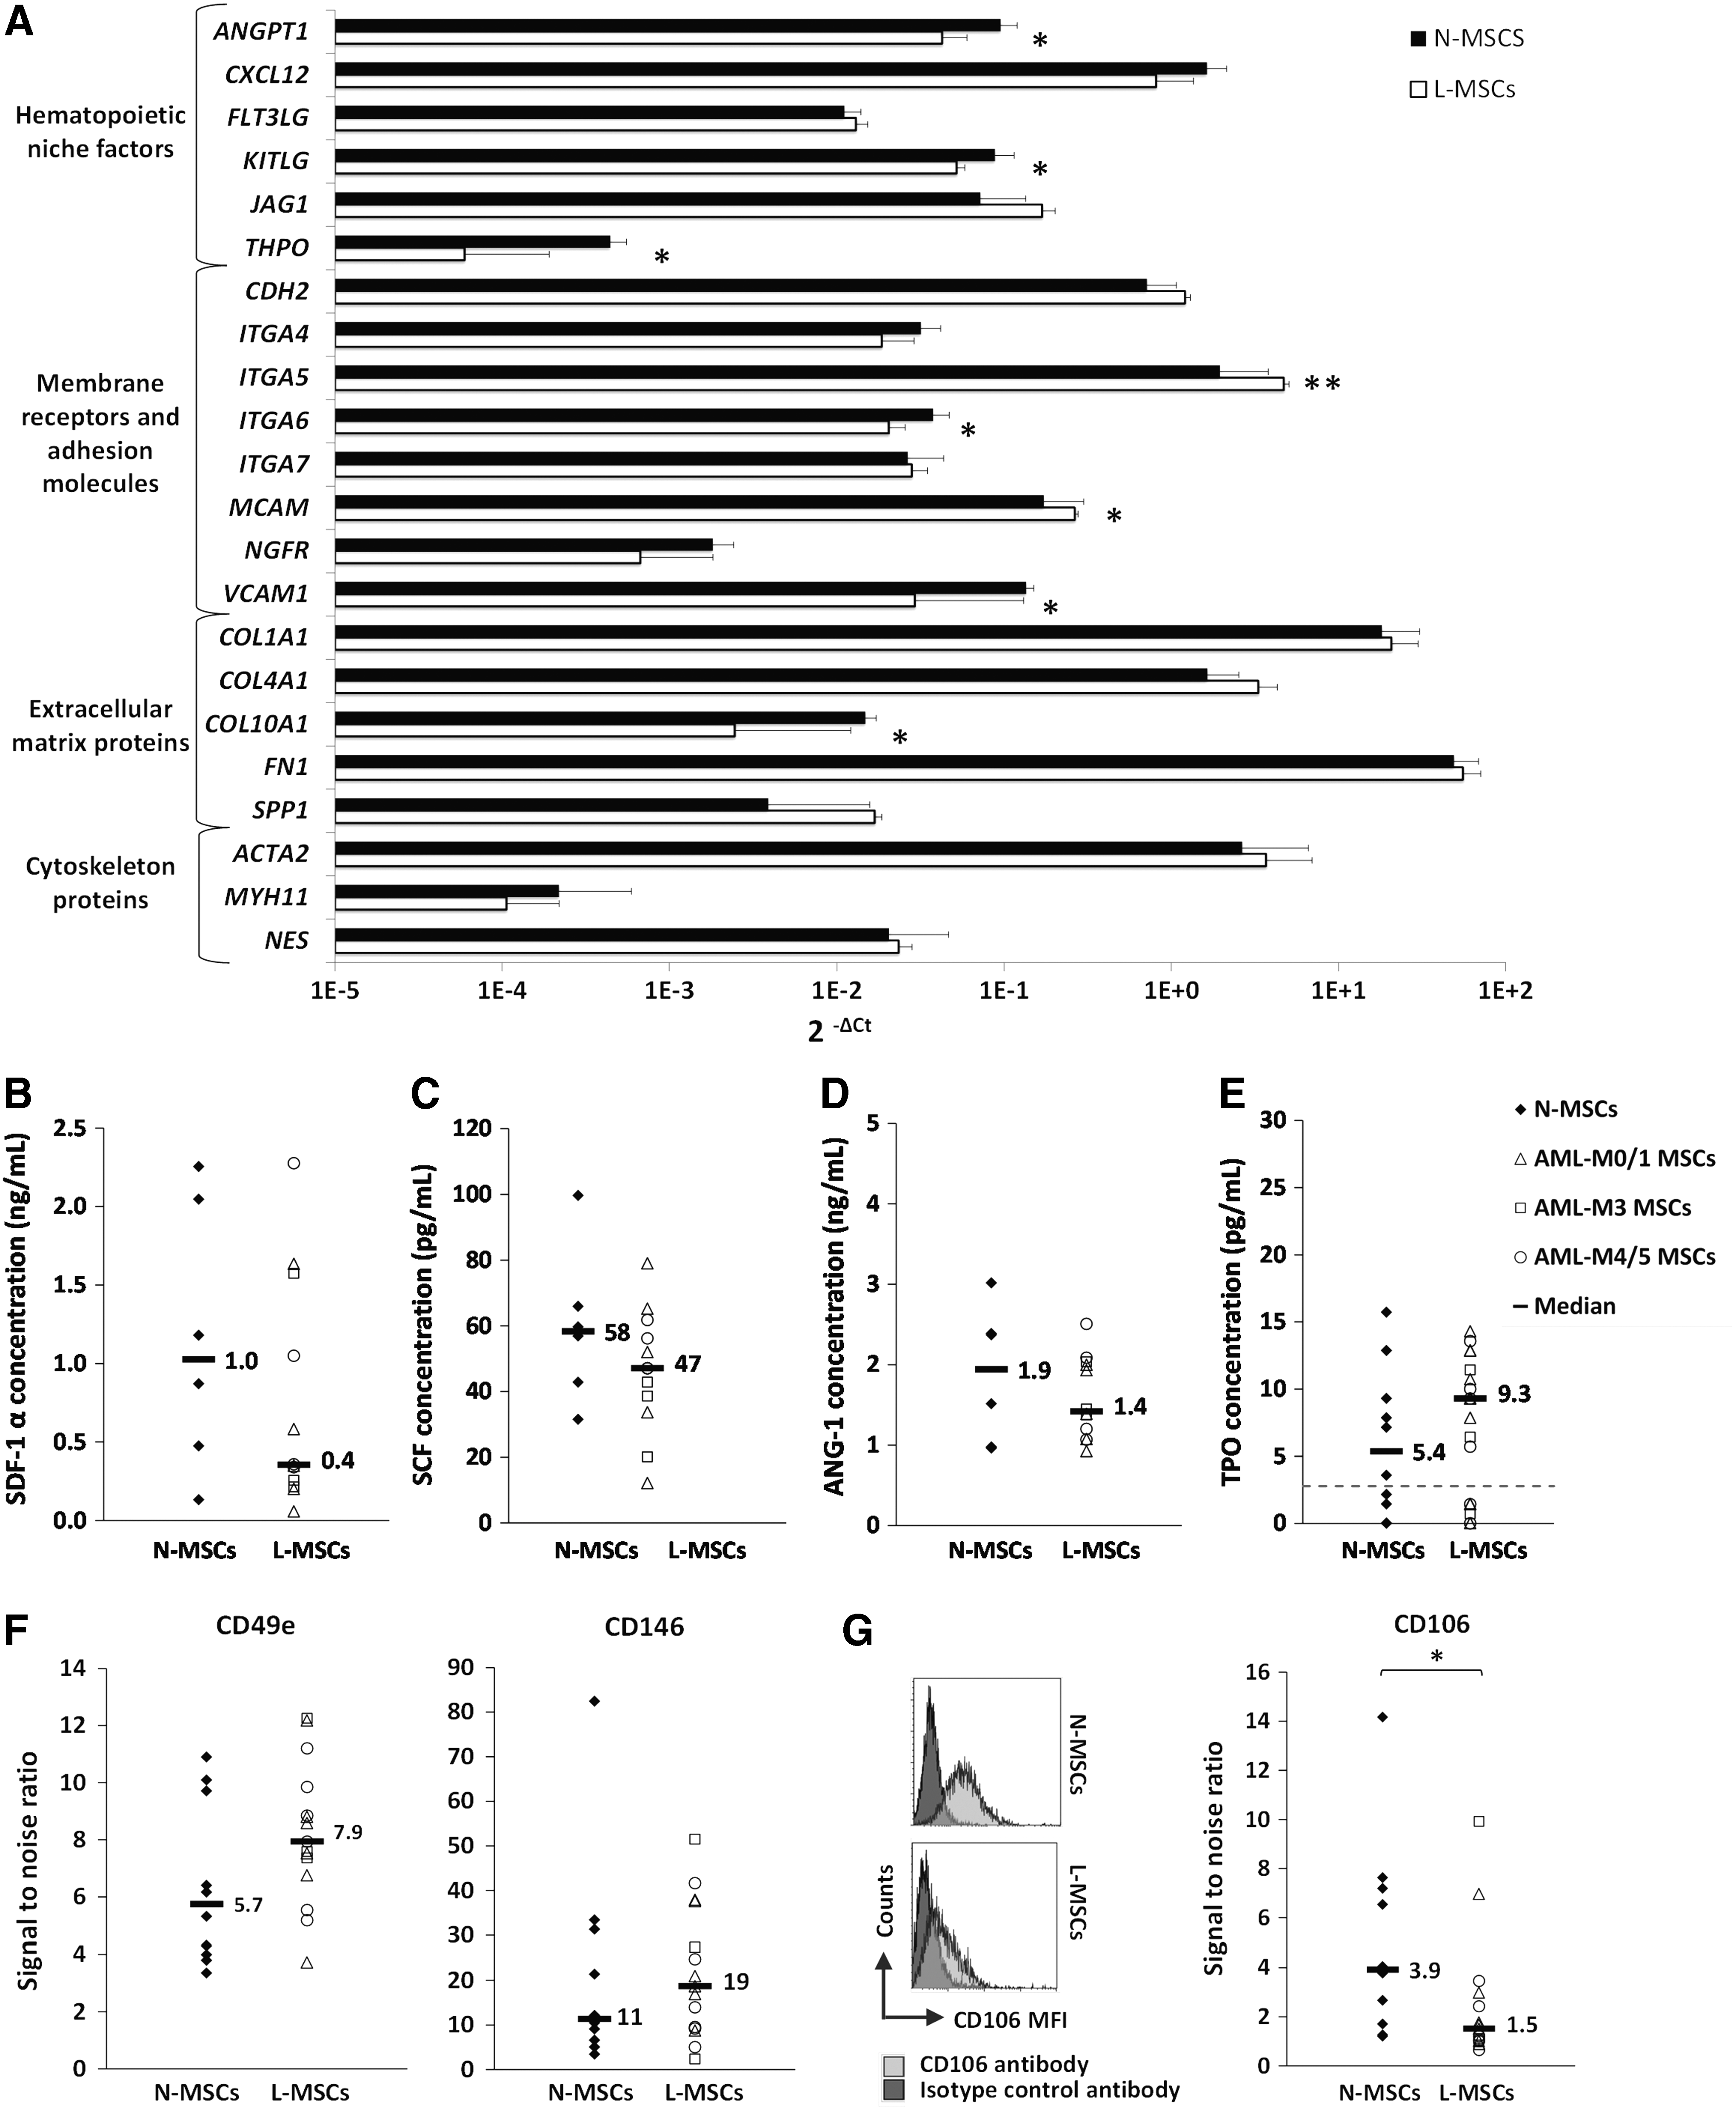
The expression of niche factors is altered in L-MSCs.
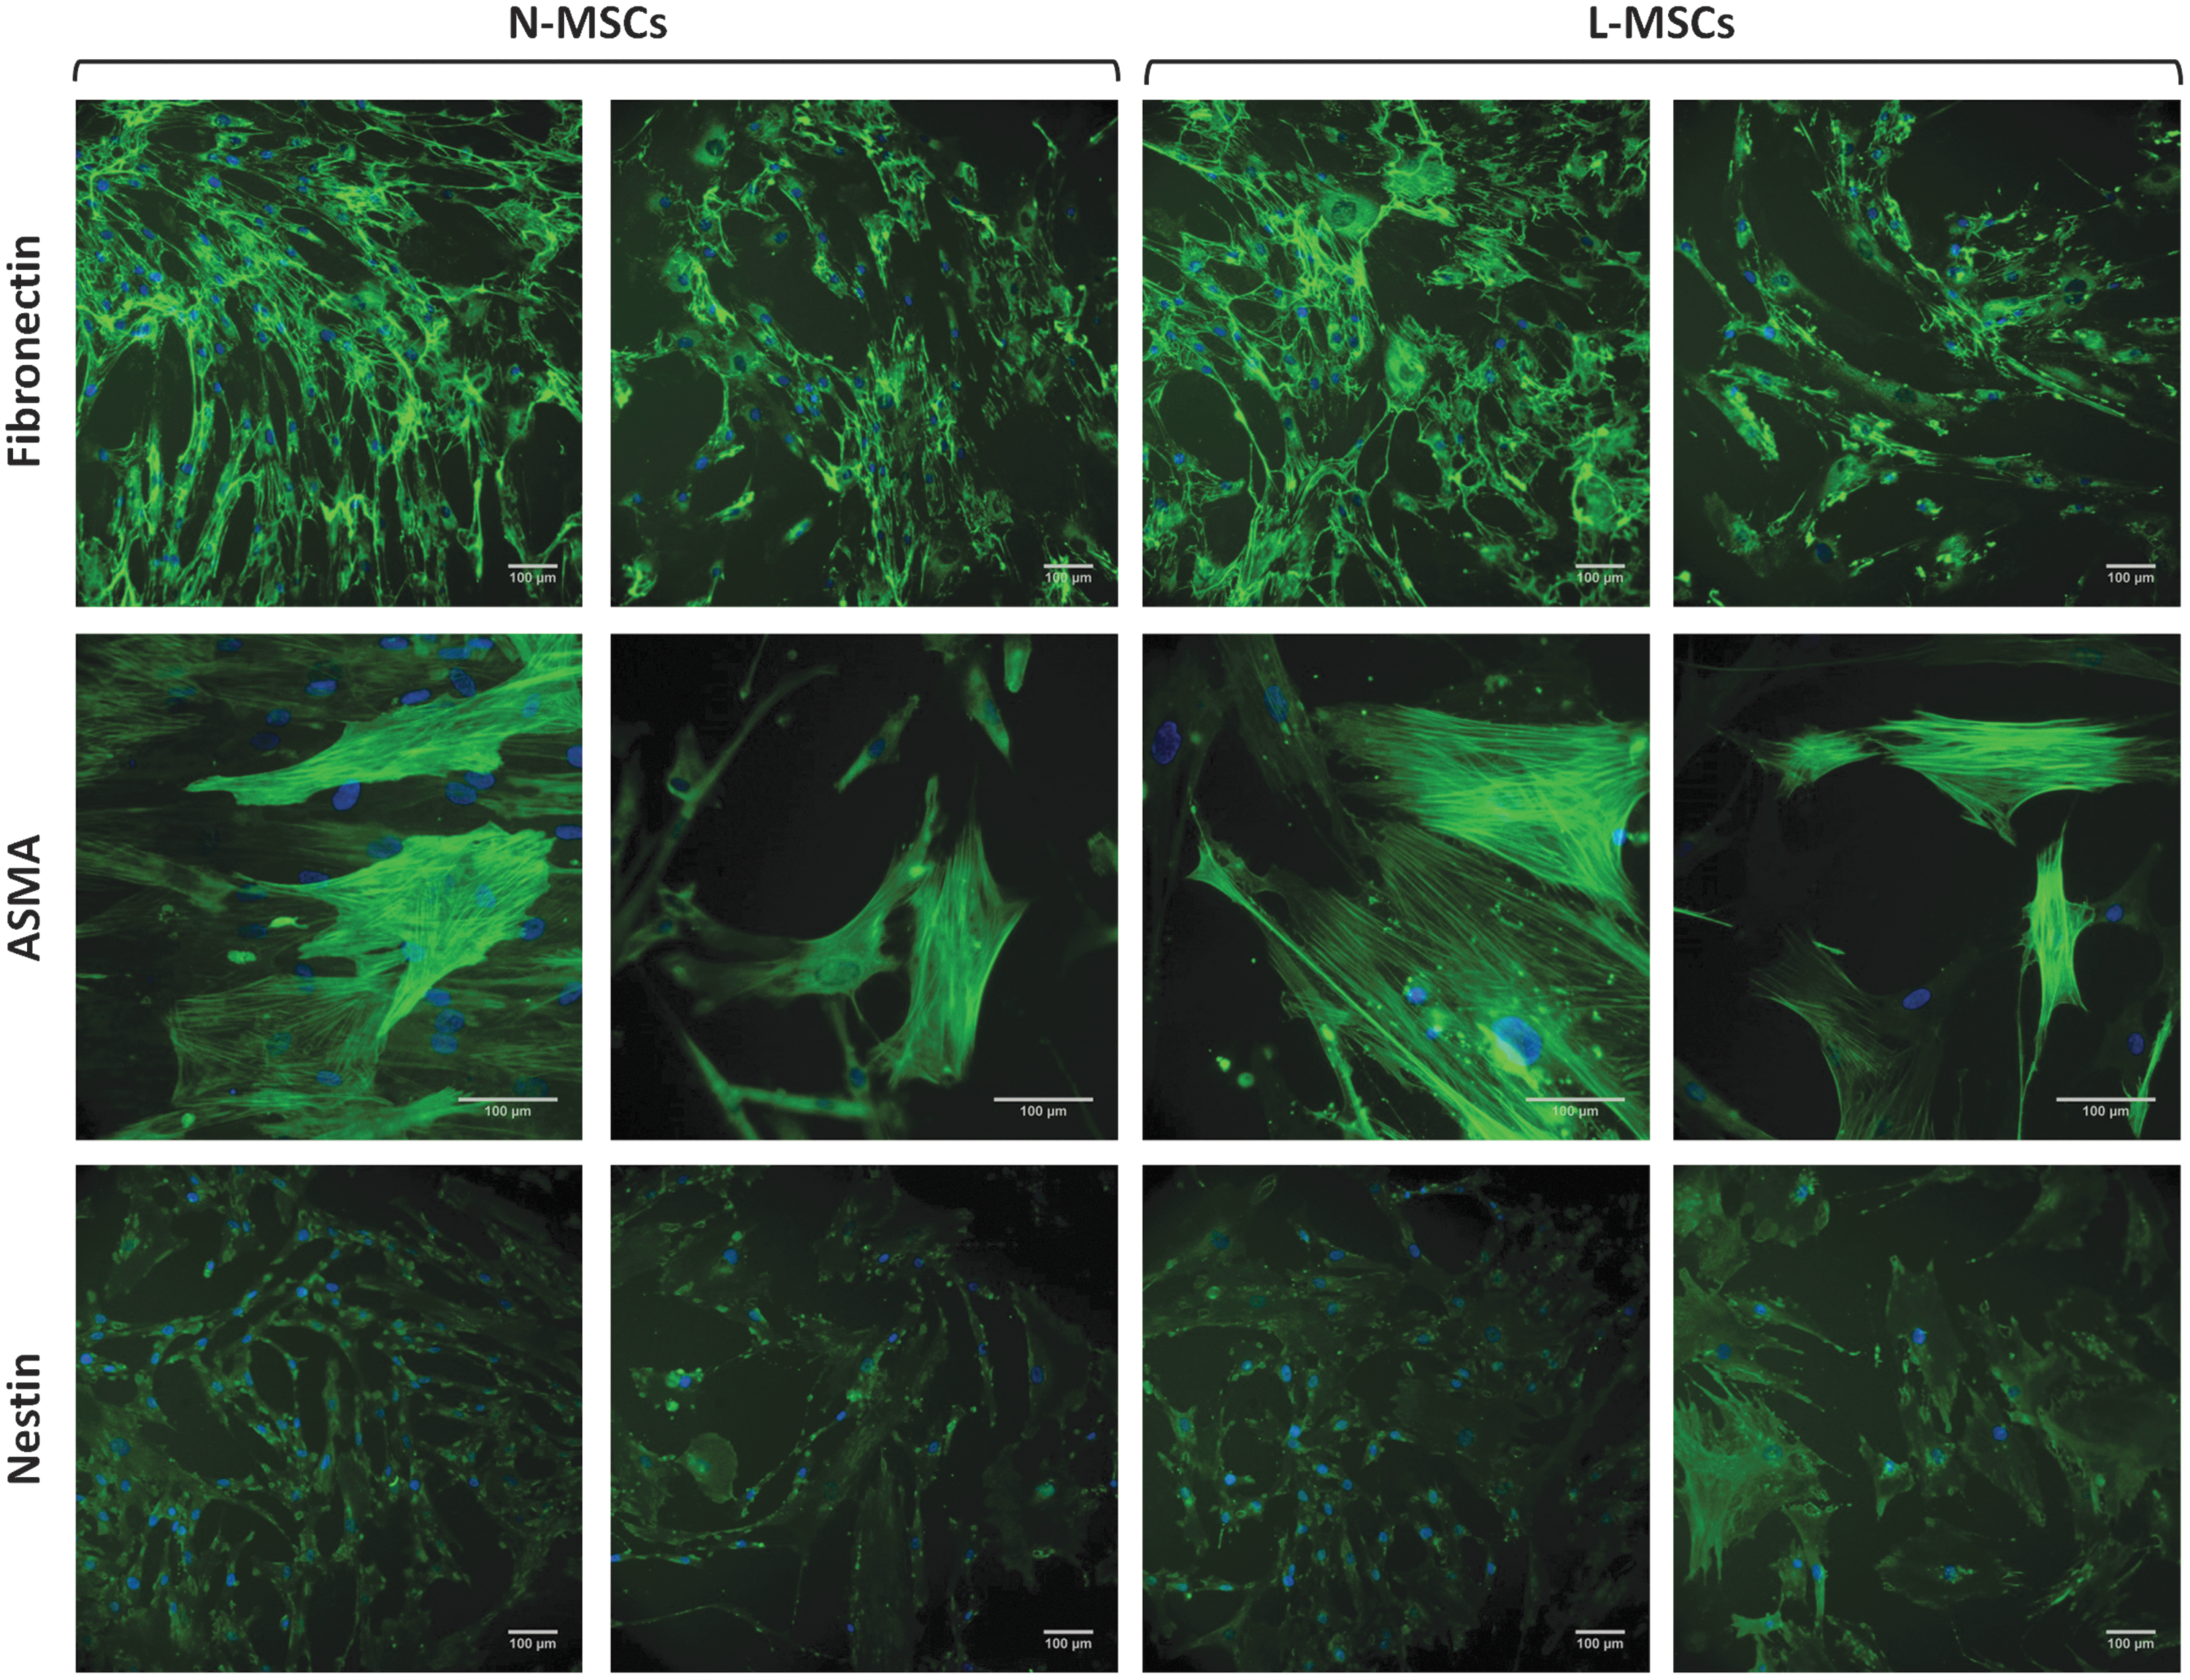
The expression of fibronectin, ASMA, and nestin is comparable in L-MSC and N-MSC cultures. Representative microphotographs of N-MSC and L-MSC cultures after indirect immunofluorescence staining (green) with anti-fibronectin (L-MSCs, n = 10; N-MSCs, n = 9), ASMA (L-MSCs = 10; N MSCs = 5), and -nestin antibodies (L-MSCs = 6; N-MSCs = 6). Cell nuclei were stained with DAPI (blue). Scale bars = 100 μm. ASMA, alpha smooth muscle actin.
Considering the wide variations found in L-MSC growth capacity, a relationship between this capacity and L-MSC phenotype was investigated. Thus, longer PDT was associated with lower expression of RUNX2 (ρ = −0.64; P < 0.05), COL10A1 (ρ = −0.64; P < 0.05), THPO (ρ = −0.69; P < 0.05), less secreted CXCL12 (ρ = −0.69; P < 0.05), and with higher expression of BMP1 (ρ = 0.75; P < 0.01), ITGA5 (ρ = 0.90; P < 0.001), and JAG1 (ρ = 0.69; P < 0.05). Same correlations were also found for lower clonogenicity (CFU-F) with lower expression not only of RUNX2 (ρ = 0.67; P < 0.05), COL10A1 (ρ = 0.80; P < 0.01), THPO (ρ = 0.63; P < 0.05), and CXCL12 (ρ = 0.62; P < 0.05) [as for secreted CXCL12 (ρ = 0.64; P < 0.05)] but also ANGPT1 (ρ = 0.64; P < 0.05) and with higher expression of BMP1 (ρ = −0.57; P = 0.05), ITGA5 (ρ = −0.65; P < 0.05), and JAG1 (ρ = −0.72; P < 0.01). Moreover, increased level of senescence was associated with lower expression of RUNX2 (ρ = −0.81; P < 0.01), COL10A1 (ρ = −0.82; P < 0.01), ITGA4 (ρ = −0.75; P < 0.01), DICER1 (ρ = −0.72; P < 0.05), BMI1 (ρ = −0.70; P < 0.05), and especially ANGPT1 (ρ = −0.88; P < 0.001). Senescence entry also correlated with lower clonogenicity of L-MSCs (ρ = −0.80; P < 0.01). The existence of a strong positive relationship between gene expression of DICER1 and BMI1 (ρ = 0.97; P < 0.00001) is noteworthy.
MSCs from patients with AML retain normal hematopoietic supportive function
The hematopoiesis-supporting capacity of confluent L-MSCs and N-MSCs was tested by using Dexter-type long-term cocultures recharged with normal CD34pos cells for 5 weeks. To limit patient heterogeneity, we focused this study on L-MSCs from patients with AML-M0/1 (L-MSCs a, b, c, d). Weekly assessment of the HPC number in supernatants was not significantly different in L-MSC and N-MSC cocultures (Fig. 6A). Similar findings were obtained when the total HPC production from adherent and nonadherent cell fractions was evaluated at the end of week 5 (Fig. 6B). The microscopic visualization of cobblestone areas in both L-MSC and N-MSC cocultures at week 5 also supported these results (Fig. 6C). The normal hematopoietic supportive function of L-MSCs cannot be explained only by biased selection of normal cell layers. Indeed, L-MSC d showed one of the best supporting activities while having one of the longest PDT.
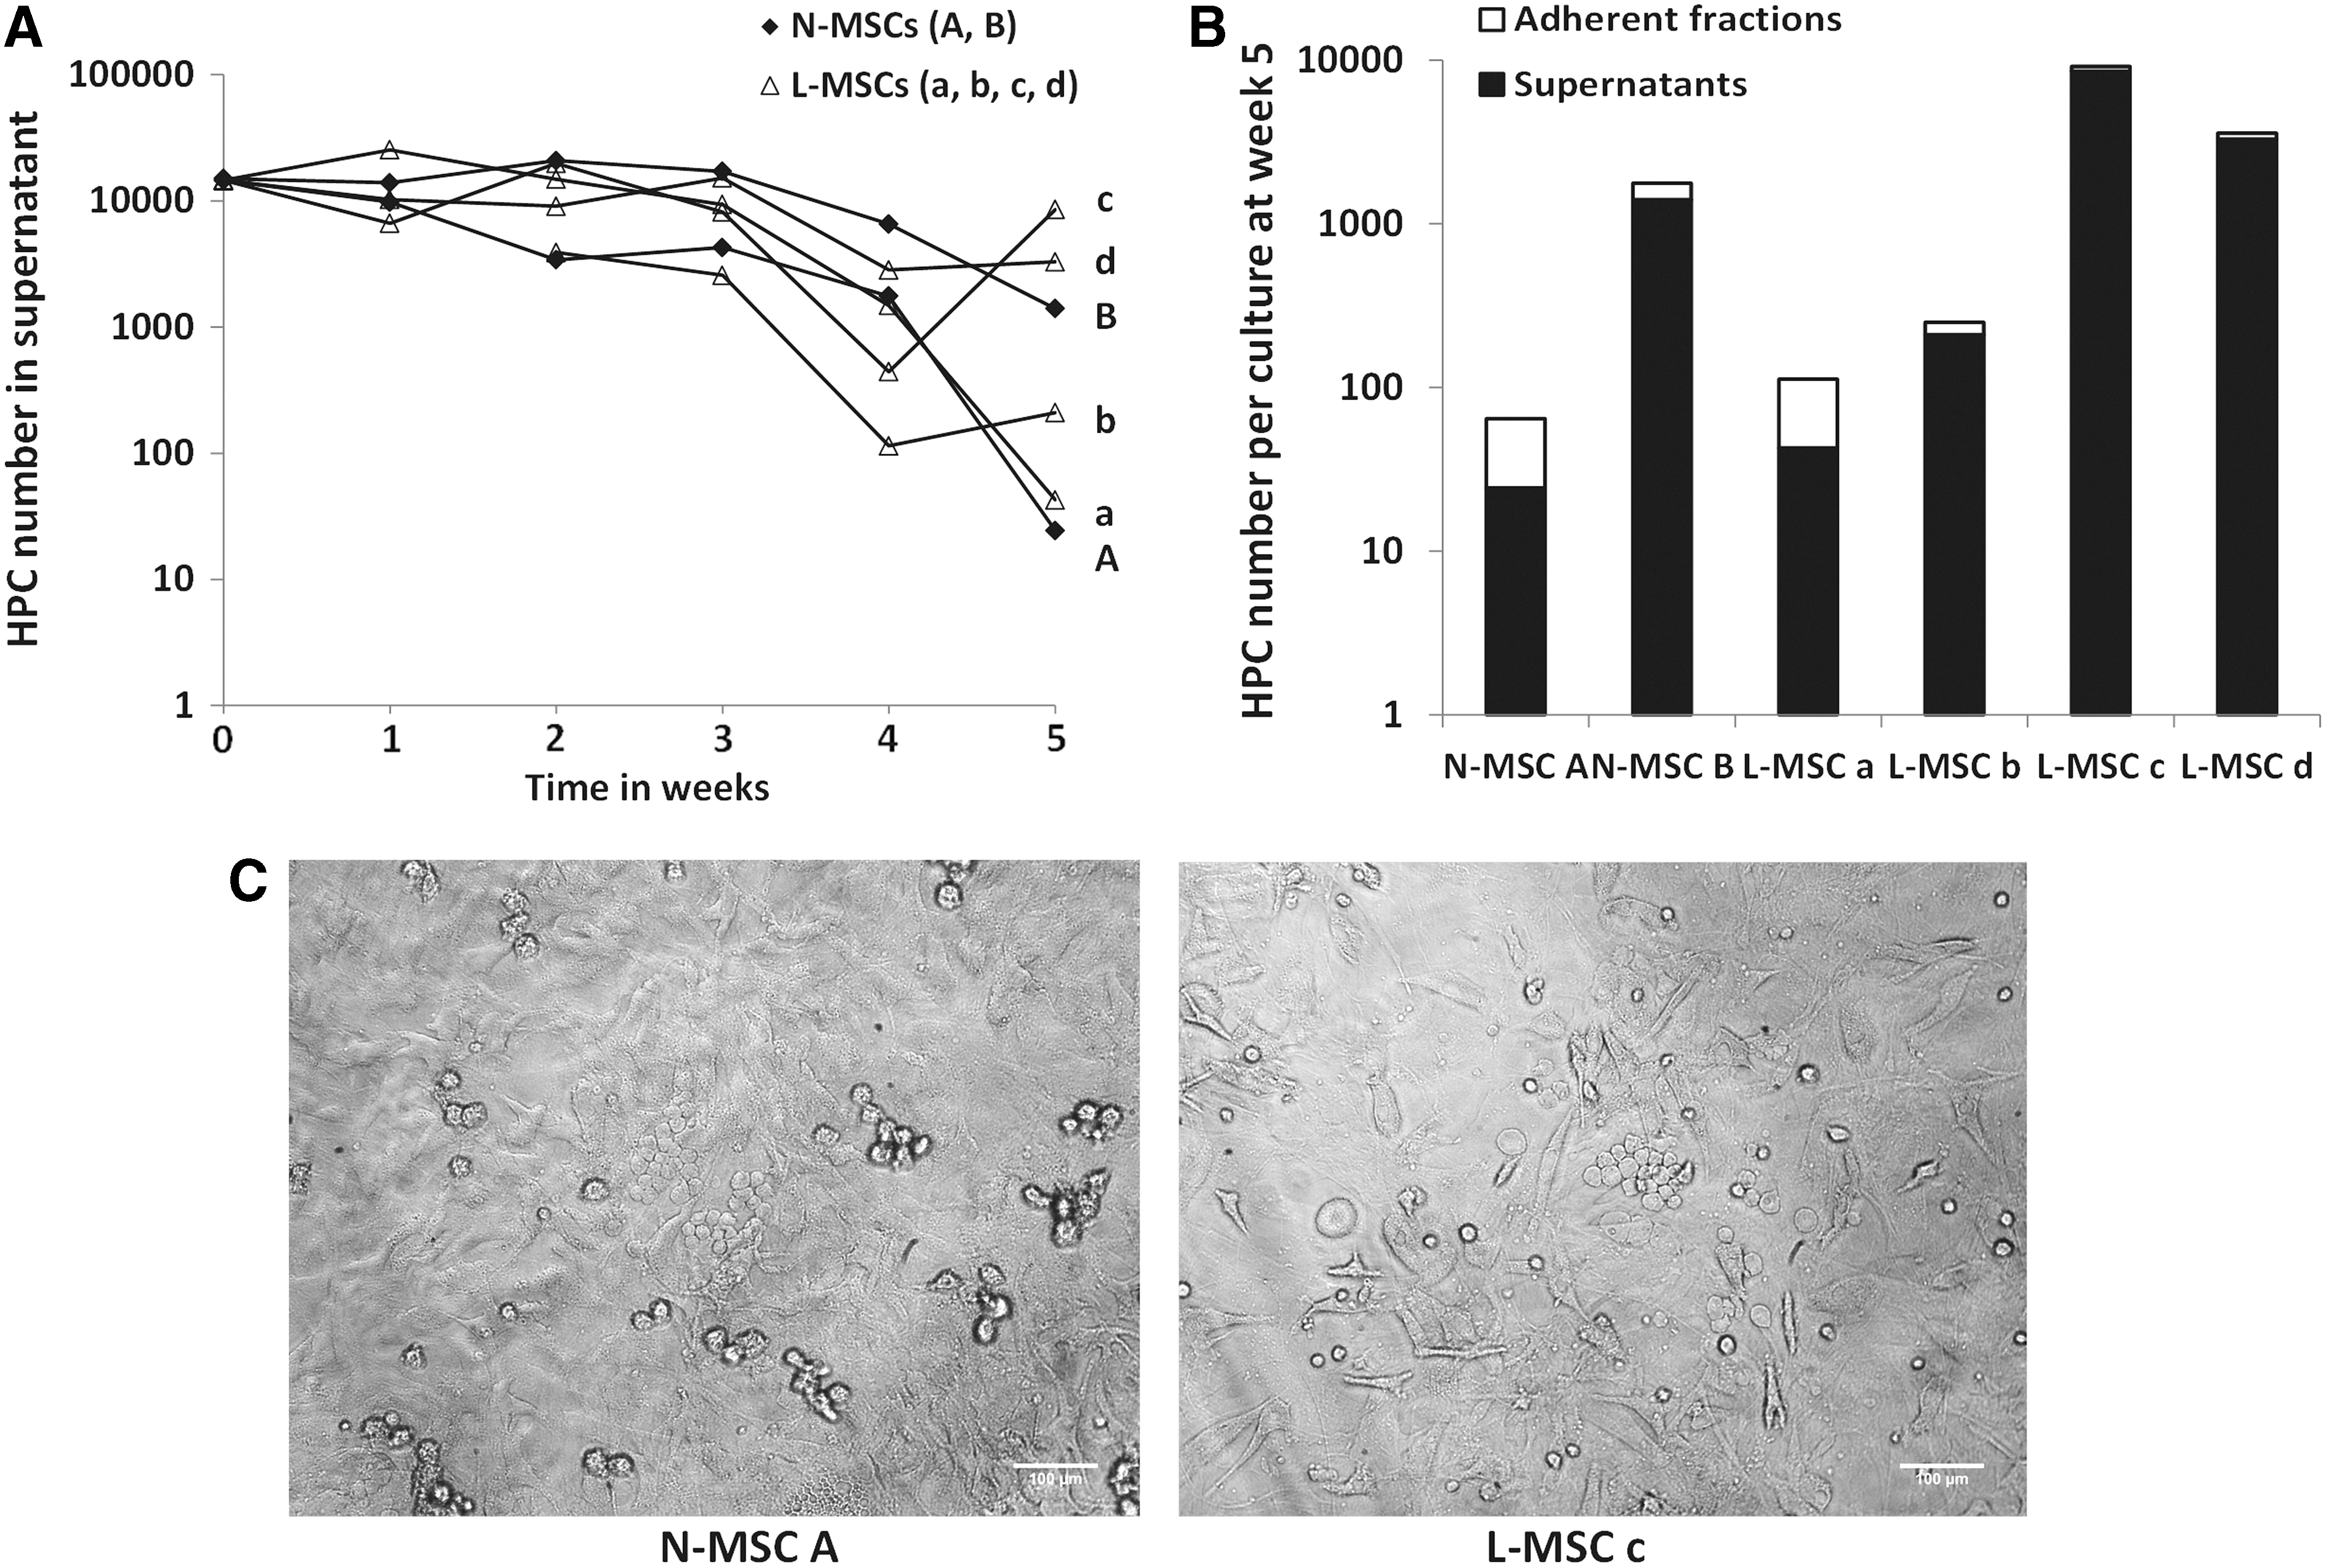
L-MSCs show normal hematopoietic supportive functions.
MSCs from patients with AML directly influence the behavior of leukemic cells as observed with normal MSCs
The capacity of L-MSCs and N-MSCs to modify leukemic cell behavior was compared by coculturing MSCs with KG1a cells and primary blast cells (AML-M0/1) in heterologous (hetero) and autologous (auto) settings for 2–3 days. The fraction of adherent leukemic cells was not significantly different in cultures of KG1a or primary blast cells with L-MSCs and N-MSCs, as well as in auto and hetero settings (data not shown). The elevated early apoptosis rate of primary blast cells (7-AADneg/Annexin Vpos) observed in MSC-free cultures was significantly and similarly reduced (p < 0.05) when they were cocultured with L-MSCs or N-MSCs (Fig. 7A, B). Similar results were obtained when late apoptosis (cells in sub-G1) was analyzed (data not shown). Again, results were comparable when using auto and hetero L-MSCs. Moreover, cell cycle analysis indicated that the fraction of KG1a cells in G0 (7-AADlow/Ki-67neg) was clearly increased in the presence of both L-MSCs and N-MSCs (Fig. 7C) in the whole KG1a population (P < 0.01) and particularly in adherent cells (P < 0.01) (Supplementary Fig. S4). Similar results were observed using primary blast cells (P < 0.05; Fig. 7D). MSC effect on cell cycle exit of primary blast cells was comparable when cocultured with auto or hetero L-MSCs. Moreover, quiescence of blast cells by direct contact with MSCs (N-MSCs or auto and hetero L-MSCs) was associated with a slight decrease in anti-γH2AX staining (a marker of DNA DSBs) compared with MSC-free cultures (P < 0.01) (Fig. 7E), consistent with the previously reported relationship between DNA damage level and cell cycle entry [29].
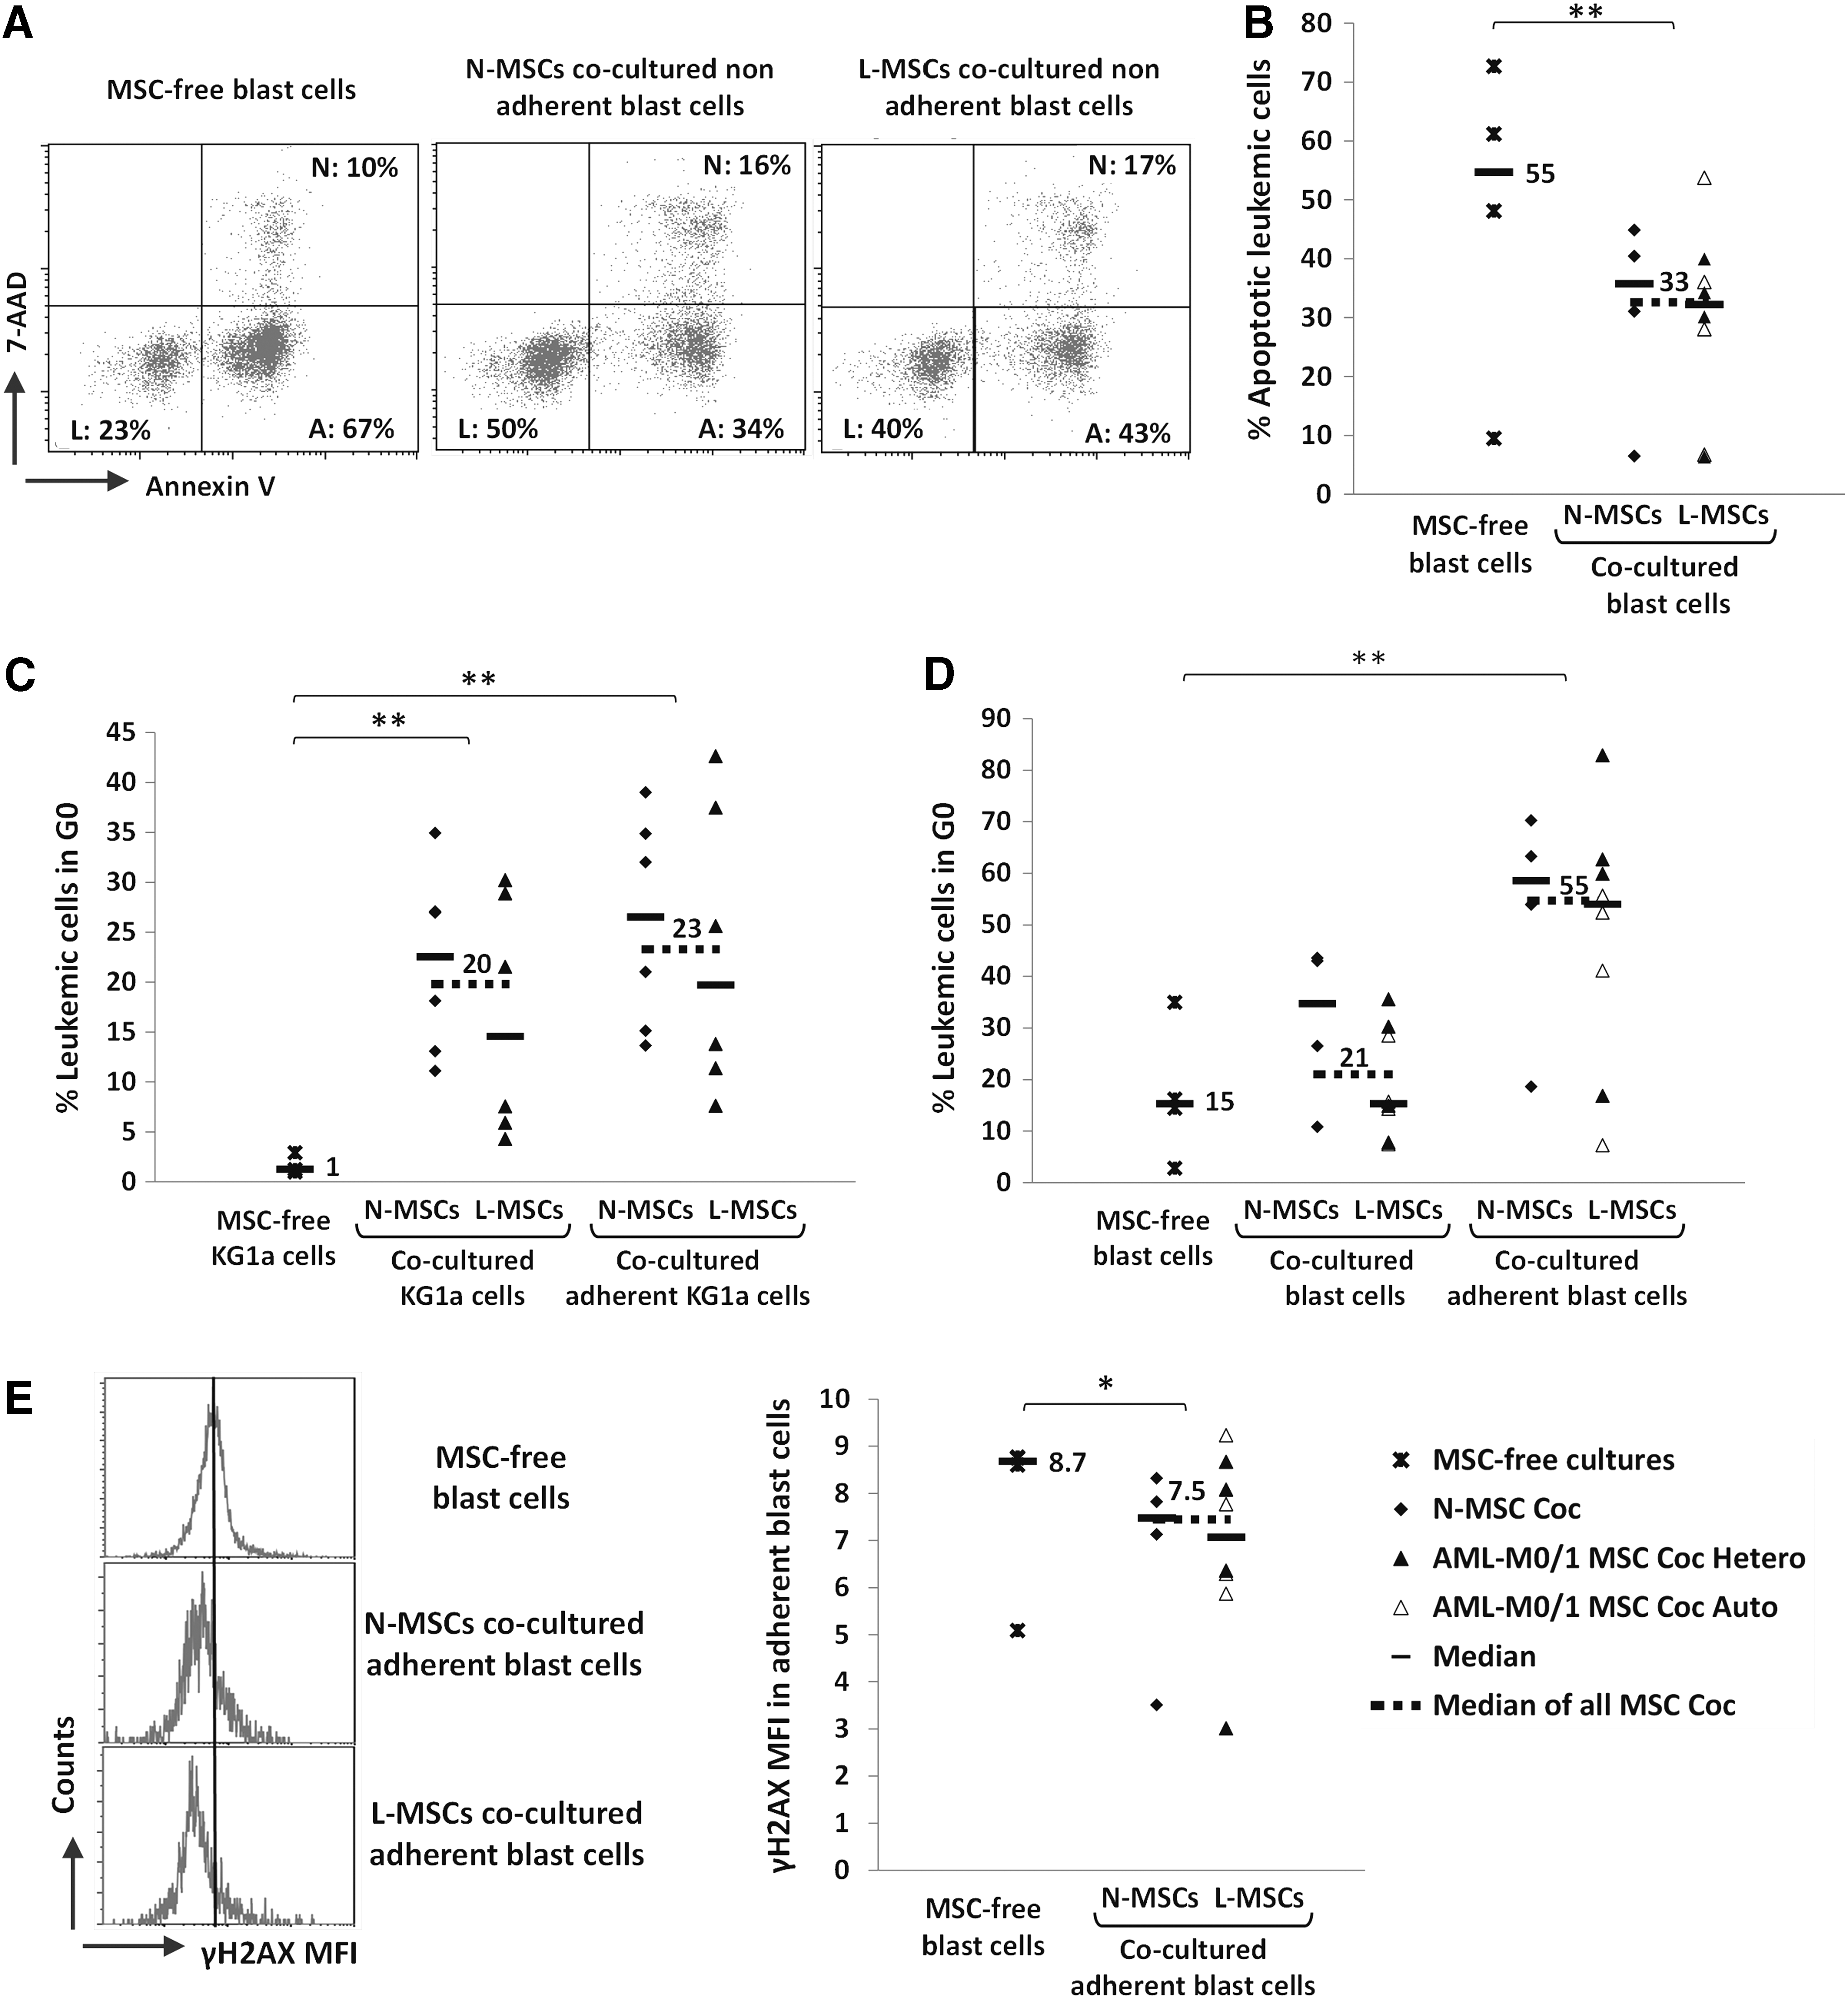
L-MSCs and N-MSCs protect leukemic cells from apoptosis and promote their quiescence in a similar manner. Cocultures of KG1a cells or primary blast cells (AML-M0/1) with L-MSCs (AML-M0/1) or N-MSCs for 2–3 days. Blast cells were cocultured either with heterologous (Coc Hetero) or autologous (Coc Auto) L-MSCs. Leukemic cells (CD45pos cell fraction) were analyzed by flow cytometry. For each experiment, one L-MSC coculture with KG1a cells (n = 6) or primary blast cells (n = 8) was matched with one N-MSC coculture with KG1a cells (n = 6) or primary blast cells (n = 4) and both compared with KG1a cells (n = 3) and primary blast cells (n = 4) cultured without MSCs.
Discussion
This study shows that MSCs isolated from the BM of patients with newly diagnosed de novo AML display some alterations, including reduced proliferation capacity, increased apoptosis, and decreased expression of several niche-related factors, such as SCF, TPO, ANG-1, and VCAM-1, compared with MSCs from controls. Proliferation deficiency of L-MSCs was not related to AML characteristics at diagnosis (FAB type, cytogenetics, or tumor burden), but was independently associated with poorer patient outcome, as was cytogenetic prognostic feature. This defect was correlated with an MSC perivascular feature at the expense of the osteo-chondroblastic lineage and with lower niche factor and higher JAG1 expression. However, these changes are not sufficient to modify L-MSC in vitro capacity to support normal hematopoiesis and to influence the behavior of leukemic cells in vitro.
The main abnormality detected in L-MSCs was a clear decrease in their proliferative potential, as recently reported in AML [9,10,12 –14]. Such proliferation defects have also been described in MSCs from several other hematopoietic disorders, such as acute lymphoblastic leukemia (ALL) [31,32], chronic lymphocytic leukemia (CLL) [33,34], and especially MDS [16,17,35,36]. A slight decrease of their clonogenic potential (CFU-F) was also observed that was inversely correlated with the PDT values. The mechanisms of MSC proliferation impairment at the onset of leukemia are still unclear. The role of leukemic cells on BM-derived MSC proliferation appears undeniable, as demonstrated by in vitro studies with cell supernatants [12,37] that also are able to inhibit osteoblastic differentiation [12]. A recent report showed a specific influence of leukemic CD34+ cells (compared with normal CD34+ cells) cocultured on N-MSCs by a transcriptomic approach, including downregulation of cell cycle and related function genes [13]. In vivo studies clearly showed that AML development in mice disrupts the BM microenvironment, resulting in fewer endosteal osteoblasts and more osteoclasts [38], and that osteoblast ablation accelerates CML development [39]. Such changes have been described also in preleukemic disease models [24 –26].
Moreover, L-MSC growth impairment can be restored with the repetition of chemotherapy cycles [32] or at diagnosis when most leukemic cells are eliminated by immunoselection of CD105pos MSCs [10]. It has been shown that fragmented DNA released by AML cells may enter MSC nuclei and induce DNA DSBs and cell death [40]. Accordingly, we found increased early and late apoptosis rates in L-MSCs (as reported in CLL [33]), while DNA DSB presence, cell senescence, intracellular ROS production, and telomere length were unchanged. The lack of relationship between decreased MSC proliferative capacity and telomere length has already been reported [41] and is probably due to the use of MSCs after limited passages (P2).
An original data item of our study is the identification of L-MSC proliferative capacity (based on PDT evaluation) as a strong independent prognostic factor for patient outcome (besides cytogenetic prognostic feature, as expected), which was not found for leukemia FAB type or tumor burden. Thus, a longer PDT might highlight the presence of a leukemic clone with a particular toxicity and aggressiveness toward the BM stromal compartment.
L-MSC proliferative deficiency was associated with other abnormal phenotypic features. Particularly, expression of the genes encoding the cytokines ANG-1, SCF, and TPO, as well the adhesion molecule VCAM-1, was downregulated in L-MSCs. This decrease was confirmed for VCAM-1 protein membrane expression. Such results are consistent with a recent report showing that sorted BM stromal cells from a mouse model of AML express lower levels of Vcam1, Cxcl12, Angpt1, and Scf transcripts [21]. Downregulation of SCF and/or ANG-1 expression has also been described in MSCs from patients with AML [12] and MDS [16,17].
Furthermore, both CD146/MCAM (a perivascular marker of MSCs) and CD49e/ITGA5 (the main ligand for fibronectin) were upregulated in L-MSCs, as reported in patients with MDS [16] and primary myelofibrosis [42] and in mice with chemically induced leukemia [43]. Despite ITG5A upregulation in L-MSCs, extracellular deposition of fibronectin (its ligand) was comparable in L- and N-MSCs. An over-representation of the CD146pos MSC subpopulation in leukemic BM may reflect changes in MSC distribution in favor of perisinusoidal sites [44] where reticular cells coexpress CD271 and CD146 antigens [45]. The positive correlation between CD146 and CD49e expression levels is consistent with this hypothesis since increased alpha5 integrin expression has been associated with pericyte differentiation [46]. In accordance with a report showing that leukemic proliferation in a mouse model can induce deficiency of osteoblastic cells [38], our study shows a concomitant lower expression of osteogenic (OCN, RUNX2) differentiation genes in L-MSCs, as reported in humans with MDS [17,47] and more recently in AML [12]. In addition to these data, our finding that CD146 levels in L-MSCs correlated with the degree of BM leukoblast infiltration argues for leukemia-induced changes in BM MSC distribution in favor of perisinusoidal sites at the expense of endosteal sites. The inverse correlation we observed between CD146 protein expression levels and age is consistent with a report showing in elderly people a decrease of the BM CD146pos cell population in favor of CD146neg MSCs [48].
Considering the phenotypic changes observed in L-MSCs, we investigated whether they were related to their growth capacities and senescence levels. Thus, prolonged PDT and decreased clonogenic potential were associated with a particular MSC phenotype, including lower expression of osteogenic (RUNX2) and chondrogenic (COL10A1) markers, as well as of the niche factors, THPO, CXCL12, and ANGPT1, and higher expression of BMP1, ITGA5, and JAG1. The latter gene (which encodes the protein Jagged 1) has been shown to be associated with breast cancer development [49] and involved in BM stroma-dependent AML induction [50] and chemoresistance [51]. In these conditions, the independent prognostic value of MSC PDT found in our study, which was negatively correlated with JAG1 gene expression, appears of particular interest. This must be compared with the higher Jagged 1 expression on L-MSCs than on N-MSCs, as previously reported [12,49]. Anyway, the direct involvement of Jagged 1 in L-MSC proliferation needs to be elucidated.
Likewise, senescence levels of L-MSCs (that increased with lower clonogenic potential) were associated with lower gene expression of RUNX2, COL10A1, and ANGPT1 and particularly of DICER1 and BMI1 whose expression levels were strongly correlated with each other. Our study extends to AML patients' DICER1 downregulation previously reported in MSCs from MDS patients [52]. Additionally, the inverse relationship between DICER1 or BMI1 expression and senescence levels in L-MSCs is consistent with the role of both factors recently shown to protect MSCs from senescence [53,54].
Finally, we evaluated whether L-MSC abnormalities had an effect on their supportive function on normal and leukemic hematopoiesis. The capacity to support normal hematopoiesis, assessed by Dexter-type long-term cultures, was comparable in L-MSCs (only from patients with AML-M0/1 for better homogeneity) and N-MSCs. These results were confirmed by the observation of HPC production by adherent layers and cobblestone area formation at week 5. Of note, L-MSC hematopoiesis-supporting activity was normal regardless of their proliferative capacity and despite lower VCAM-1 expression. Normal HPC production has also been reported in a previous study using immunoselected AML-MSCs [10], in contrast to other studies where different (sometimes suboptimal) culture conditions of MSCs were used [9,12,55]. Our findings are consistent with a very recent study in a murine model of AML indicating that BM microenvironment retains in vivo supporting activity of normal hematopoiesis [56]. Normal supporting activity of MSCs from patients with hematological malignancies was also shown in CML [18], myeloma [57], and lymphoma [9], whereas impaired function has been reported in ALL [31,32], CLL [34], and particularly MDS [15 –17,35,36,58].
N-MSCs are also known to protect leukemic cells (particularly in AML) from apoptosis, favor their chemoresistance, and induce their quiescence [3,4,59,60]. In this study, we show that L-MSCs and N-MSCs similarly decrease the levels of early and late apoptotic leukemic cells and increase the proportion of leukemic cells in G0 associated with a slight decrease in DNA DSB levels. Moreover, when comparing the results of matched autologous and heterologous cocultures of L-MSCs and primary blast cells, we did not find any significant difference. Our data are in accordance with a very recent study in which rates of in vivo engraftment of primary blast cells were not different when previously cocultured on L-MSCs and N-MSCs [13].
To explain the normal supportive function of L-MSCs found in our work, the selection of MSC subsets is not totally excluded, possibly favored by our culture conditions, in which the use of FGF2-supplemented MSC medium is certainly not negligible. On another side, it is conceivable that properties of MSCs from de novo AML patients at the onset of their disease are quite different than those from patients with other chronic hematological disorders, such as MDS. In these diseases, the well-known, long-term, and stronger impairment of the stromal cell compartment in a chronic inflammatory context could even promote the leukemia emergence [61].
In conclusion, our study highlights some changes of the stromal cell compartment during AML cell expansion. They include proliferation deficiency, increased apoptosis, downregulation of several niche-related factors, and a tendency to exhibit a perivascular feature at the expense of the osteo-chondroblastic lineage. However, all these changes were not associated with altered MSC supporting function on normal and leukemic hematopoiesis in vitro. Finally, these findings suggest that the impairment of BM-derived MSCs observed at the onset of de novo AML does not play a special role in the leukemic process.
Footnotes
Acknowledgments
This work was supported by the French “Conseil Régional du Centre”, the French Ministry of Research, the National Center of Scientific Research (CNRS), the “Cancéropôle Grand-Ouest” network (NICHEMOPATH Project), and the charities “Les Sapins de l'Espoir Contre le Cancer”, “CANCEN,” and Rotary International (club of Blois). The authors would particularly like to thank Prof. Philippe Rosset for having provided the bone marrow samples as well as Marion Thévenot, Sophie Lagrange, Audrey Gauthier, Sophie Hamard, Emmanuel Pecnard, and Marie-Christine Bernard from the LNOx team (CNRS UMR 7292) for their help in culturing and analyzing human BM-derived MSCs and Christophe Arnoult, from the antibodies, Fc receptors and clinical responses team (CNRS UMR 7292), for his expert assistance on flow cytometry analyses.
Author Disclosure Statement
No competing financial interests exist.
References
Supplementary Material
Please find the following supplemental material available below.
For Open Access articles published under a Creative Commons License, all supplemental material carries the same license as the article it is associated with.
For non-Open Access articles published, all supplemental material carries a non-exclusive license, and permission requests for re-use of supplemental material or any part of supplemental material shall be sent directly to the copyright owner as specified in the copyright notice associated with the article.