
Abstract
Acquisition of proper metabolomic fate is required to convert somatic cells toward fully reprogrammed pluripotent stem cells. The majority of induced pluripotent stem cells (iPSCs) are partially reprogrammed and have a transcriptome different from that of the pluripotent stem cells. The metabolomic profile and mitochondrial metabolic functions required to achieve full reprogramming of somatic cells to iPSC status have not yet been elucidated. Clarification of the metabolites underlying reprogramming mechanisms should enable further optimization to enhance the efficiency of obtaining fully reprogrammed iPSCs. In this study, we characterized the metabolites of human fully reprogrammed iPSCs, partially reprogrammed iPSCs, and embryonic stem cells (ESCs). Using capillary electrophoresis time-of-flight mass spectrometry-based metabolomics, we found that 89% of analyzed metabolites were similarly expressed in fully reprogrammed iPSCs and human ESCs (hESCs), whereas partially reprogrammed iPSCs shared only 74% similarly expressed metabolites with hESCs. Metabolomic profiling analysis suggested that converting mitochondrial respiration to glycolytic flux is critical for reprogramming of somatic cells into fully reprogrammed iPSCs. This characterization of metabolic reprogramming in iPSCs may enable the development of new reprogramming parameters for enhancing the generation of fully reprogrammed human iPSCs.
Introduction
R
We recently identified partially reprogrammed cells by monitoring cell surface expression of TRA1-60 [3], a bonafide marker of fully reprogrammed cells [4]. Twelve days after human somatic cells were transduced with Yamanaka factors, ∼5% of total colonies expressed TRA1-60 and showed silenced expression of exogenous Yamanaka factors [3]. These colonies represented fully reprogrammed cells. However, the majority of colonies were TRA1-60-negative cells retaining exogenous Yamanaka factor expression as assessed by continued green fluorescent protein (GFP) expression. TRA1-60-negative colonies, while similar to human ESCs (hESCs) in morphology, represented partially reprogrammed cells [3,4]. The partially reprogrammed cells were apparently trapped in an incompletely reprogrammed, yet stable, state that was not sufficient for conversion to fully reprogrammed cells.
The genes involved in the reprogramming process have been identified by examining the global gene-expression patterns of iPSCs and ESCs [2 –5]. While studies have revealed the protein expression patterns uniquely associated with stem cells, the molecular framework directing human somatic cells during reprogramming into fully reprogrammed iPSCs is still not fully understood. This may, in part, be because of the challenge of correlating gene and protein expression data with functional activity, and the acquisition of a new cellular fate is determined through reprogramming. We use a complementary approach that explores the metabolomics of different reprogramming phenotypes [somatic cell and somatic cell-derived partially and fully reprogrammed human iPSCs (hiPSCs)] to identify metabolomic determinants of iPSC reprogramming [6,7].
When a relatively slow-growing somatic cell undergoes reprogramming into a very highly proliferating pluripotent state, the metabolic status must change to sustain this new highly proliferative pluripotent state. Because shifts in mitochondrial metabolic pathways may be central to the early stages of reprogramming before full pluripotency induction, evaluating and profiling the metabolomics of these cells should enable more complete characterization of endogenous small molecules produced by biochemical reactions, as well as increase the understanding of the complete iPSC reprogramming process [8 –11]. However, there is currently no comparative metabolomic profiling information available for partially and fully reprogrammed hiPSCs, somatic cells, and hESCs. In this study, we examined the metabolomics of fully reprogrammed hiPSCs and intermediate partially reprogrammed hiPSCs using an untargeted metabolomics approach involving capillary electrophoresis time-of-flight mass spectrometry (CE-TOFMS) performed with an Agilent Capillary Electrophoresis System (Santa Clara, CA) [12]. CE-TOFMS is advantageous for such analysis because of its high resolution and ability to simultaneously quantify all charged small molecules in a sample. Hence, CE-TOFMS can be used to analyze low-molecular weight biomarkers and to provide insight into metabolic pathways on a large scale [13,14].
Materials and Methods
Derivation and maintenance of hiPSCs
Based on our previously reported methods [4,15], iPSCs were established from human fibroblasts using the concentrated lentiviral vectors SOX2-OCT4-EGFP and cMYC-KLF4-Cerulean (pcDNA-HIV-CS-CGW, provided by Dr. Phil Zoltick, Children's Hospital, Philadelphia) in media containing 8 μg/mL polyberen (Sigma-Aldrich, St. Louis, MO) [3,15]. To generate iPSCs, we used MRC-5 obtained from ATCC (CCL-171; Manassas, VA) and cultured the cells in Dulbecco's modified Eagle's medium supplemented with 10% fetal bovine serum and 1% penicillin–streptomycin. After infection of MRC-5 with lentiviral Yamanaka factors, the medium was replaced with fresh media for another 2 days. At the end of day 4, cells were transferred to mitotically inactivated mouse embryonic fibroblasts, and the media were replaced with Dulbecco's modified Eagle's medium/F12 containing 20% serum replacement, 1 mM glutamine, 0.1% nonessential amino acids, 0.1% penicillin/streptomycin, 0.1 mM beta-mercaptoethanol, and 10 ng/mL recombinant human FGF-2 (Invitrogen, Carlsbad, CA). Colonies of iPSCs appeared 12 days after transduction and were transferred mechanically with glass capillaries to fresh mouse embryonic fibroblasts for further expansion and characterization. To maintain the pluripotent stem cell lines, including human ESC-H9 (purchased from WiCell, Madison, WI), we followed the conventional research protocol of the WiCell research Institute. For passaging, these colonies were mechanically detached with a glass pipette during transfer. Passages were made at a 1:2 or 1:3 split ratio.
Measurement of mitochondrial membrane potential
Mitochondrial membrane potential (MMP) was measured using JC-1 (Molecular Probes, Eugene, OR). Briefly, the colonies were cultured on gelatin-coated glass bottom dish (Nunc, Rochester, NY) for 3 days and then incubated with 1.0 μg/mL JC-1 for 30 min at 37°C. Then colonies were washed twice in phosphate-buffered saline, and fluorescence was measured by fluorescence microscopy.
Metabolomic analysis
In accordance with previous studies [12,16 –18], CE-TOFMS metabolome measurements were performed using an Agilent CE Capillary Electrophoresis System equipped with an Agilent 6210 Time-of-Flight mass spectrometer (Agilent Technologies) at Human Metabolome Technology, Inc. (Tsuruoka, Japan). Cells cultured in mTeSR1 medium were immersed in 1,800 μL of 5% mannitol/Milli-Q water containing internal standard solutions. For metabolite extraction, appropriate amounts of methanol and internal standard solution (H3304-1002; Human Metabolome Technology, Inc.) were added to the cultures. Next, 350 μL of extracted solution was centrifugally filtered using a Millipore 5-kDa cutoff filter (Millipore, Billerica, MA) at 9,100 × g at 4°C for 180 min. The metabolites identified from the metabolome library were assigned to the Kyoto Encyclopedia of Genes and Genomes to facilitate the search for involved metabolic pathways [12,19].
Respirometry
Respirometry analysis was conducted to determine cellular oxygen consumption with a Seahorse XF96 extracellular flux analyzer (Seahorse Bioscience, North Billerica, MA) as described by us [5] and others [20].
Results
Partially reprogrammed cells are distinct from fully reprogrammed cells
When iPSCs were generated from human primary somatic cells using lentiviruses expressing Yamanaka's factors, two different types of colonies were observed. We recently defined these colonies as partially (Fig. 1: right panels) and fully reprogrammed iPSCs (Fig. 1: left panels) by monitoring the cell surface expression of TRA1-60, a bonafide marker of completely reprogrammed cells and by examining the expression of exogenous Yamanaka factors [indicated by enhanced GFP (EGFP) expression] [3
–5]. Cells in fully reprogrammed hiPSC colonies expressed TRA1-60, but showed completely silenced expression of exogenous Yamanaka factors (as assessed by the lack of EGFP). In contrast, cells in partially reprogrammed colonies exhibited a complete lack of TRA1-60 expression, but displayed persistant expression of exogenous Yamanaka factors (as assessed by continued EGFP expression). These two phenotypically distinct colonies were recovered, cultured separately, and examined for mRNA levels of endogenous OCT4 and NANOG (Supplementary Fig. S1; Supplementary Data are available online at
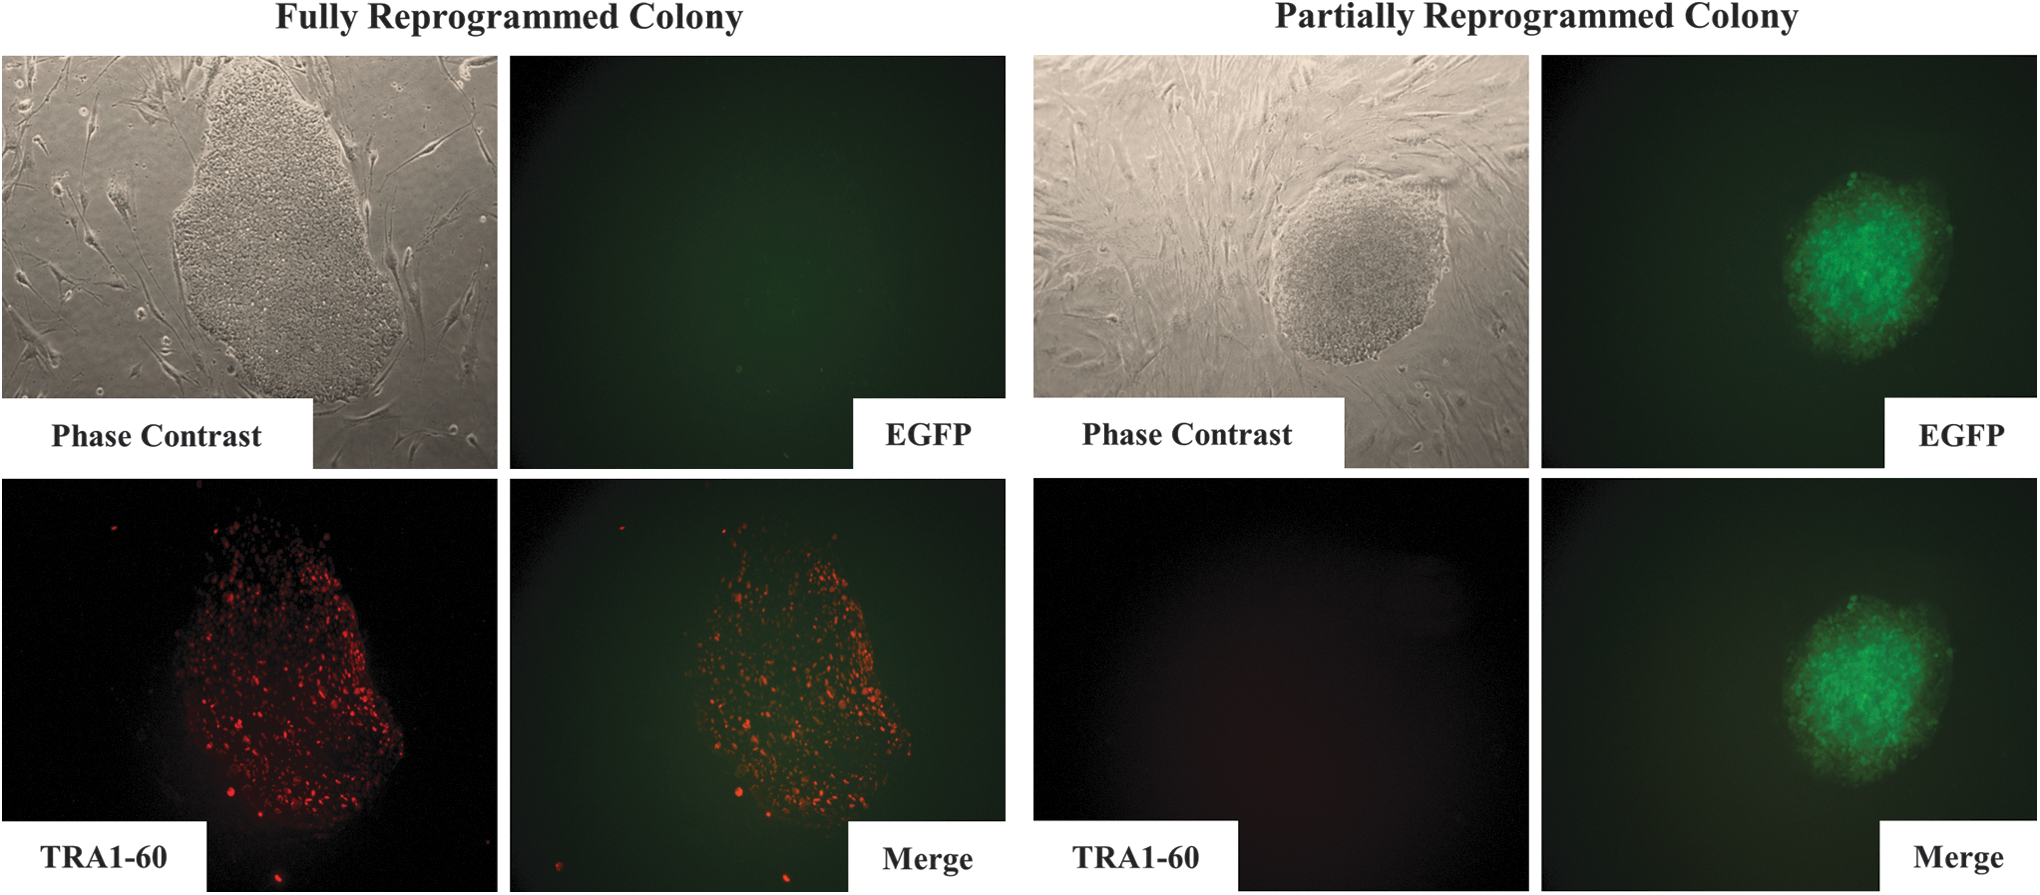
Characterization of two distinct iPSC colony types. Live cell staining and imaging were used to follow the generation of iPSCs in real time. Expression of GFP (green) and hESC-specific TRA1-60 (red) in partially reprogrammed colonies (right panel) and fully reprogrammed colonies (left panel) were observed by immunocytochemical analysis. Nuclei were counterstained with DAPI (blue). Fully reprogrammed colonies expressed TRA1-60, but exogenous Yamanaka factors were silenced as demonstrated by the lack of EGFP. Partially reprogrammed colonies exhibited a complete lack of TRA1-60 expression, but displayed persistent expression of exogenous Yamanaka factors as assessed by continued EGFP expression. EGFP, enhanced green fluorescent protein; GFP, green fluorescent protein; hESC, human embryonic stem cell; iPSC, induced pluripotent stem cell.
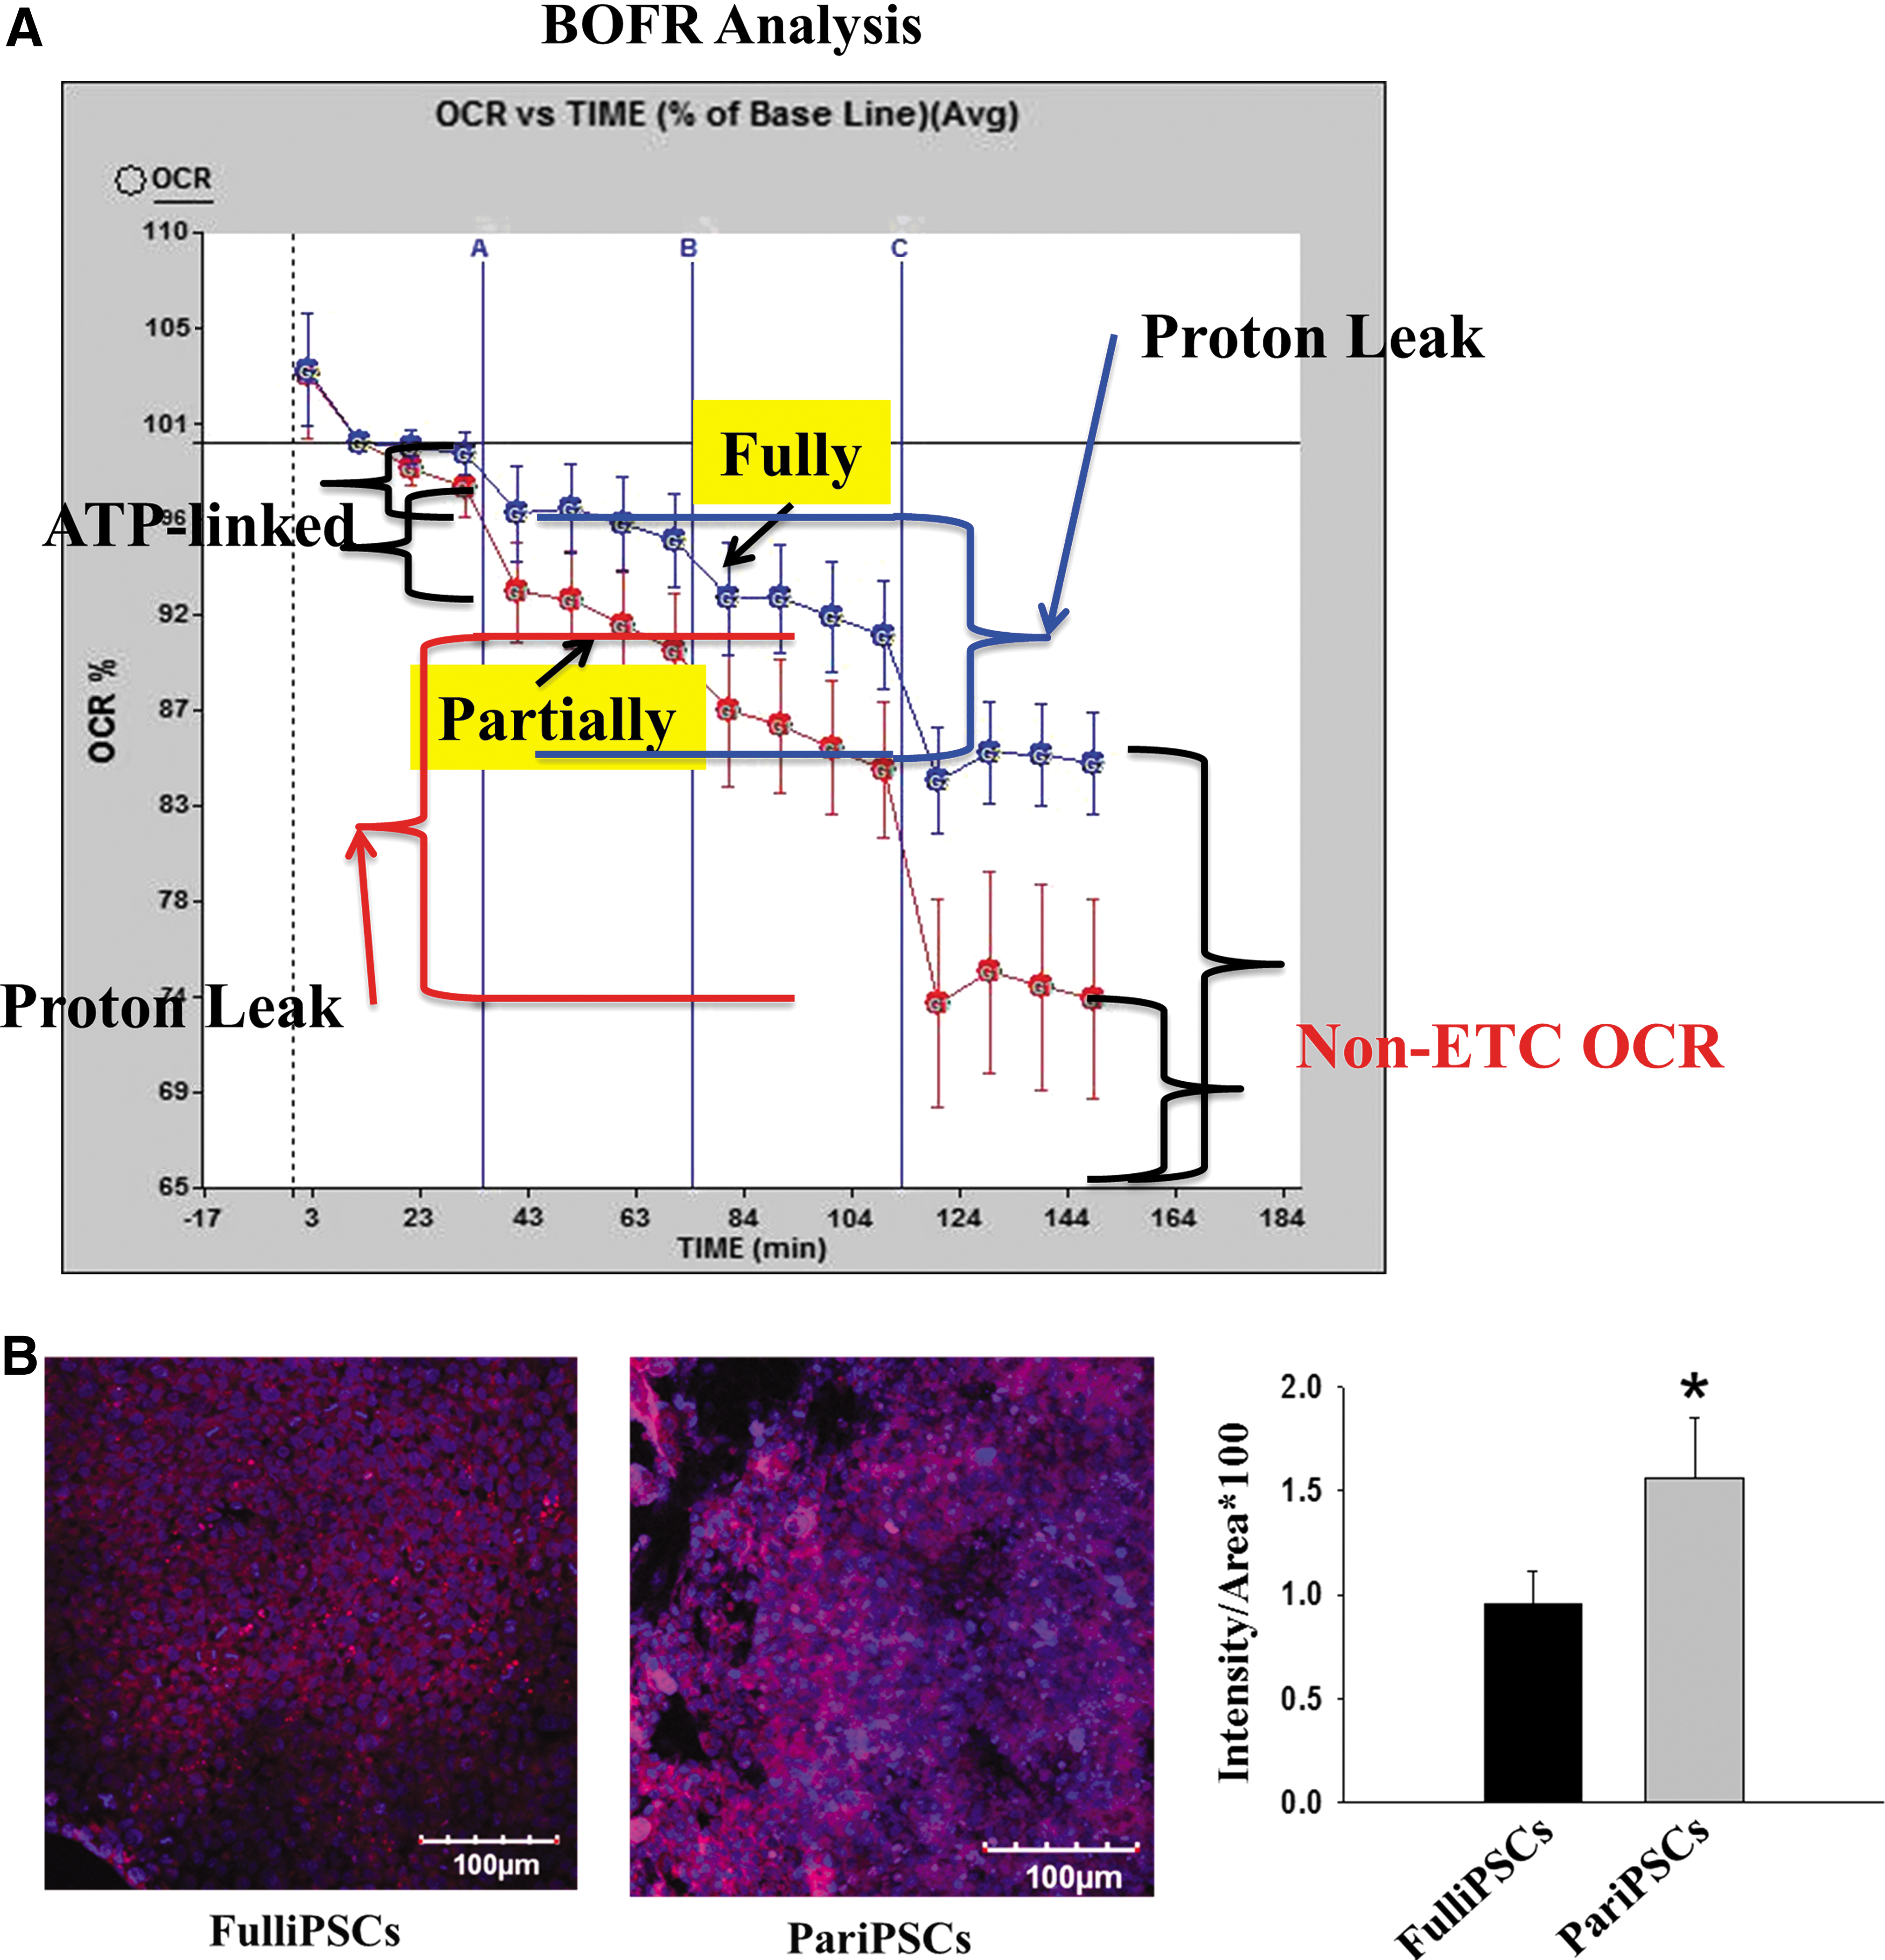
Differential metabolic characteristics in partially and fully reprogrammed iPSCs.
A lower OCR in the fully reprogrammed cells indicates lower mitochondrial respiration, which may reflect a reversion to developmental immaturity of the mitochondria in fully reprogrammed cells. To assess this, we compared MMP, using a mitochondrion-specific dye (Fig. 2B). Higher levels of MMP indicate the presence of more mature mitochondria in the cells. Fully reprogrammed hiPSCs exhibited significantly lower levels of MMP than partially reprogrammed cells, in agreement with the results of a previous study [10], suggesting that fully reprogrammed hiPSCs possess developmentally immature mitochondria compared with partially reprogrammed iPSCs. These results indicate differences in both mitochondrial respiration rate and mitochondrial developmental maturity between partially and fully reprogrammed hiPSCs.
Partially reprogrammed cells fail to fully acquire metabolome signatures of pluripotent stem cells
Because partially and fully reprogrammed iPSCs displayed different mitochondrial respiration rates and mitochondrial developmental maturity levels, we evaluated the expression levels of metabolites in these cell populations. To investigate the metabolic changes between somatic cells (fibroblasts), partially reprogrammed cells, and pluripotent stem cells (hESCs and fully reprogrammed iPSCs), and metabolic profiles associated with induced pluripotency, we compared the metabolic profile of each cell type using CE-TOFMS. Importantly, because culture conditions can influence the metabolite composition within each cell population and variations can occur between cell lines, we maintained all cells in chemically defined medium (ie, mTeSR1) [21]. This enabled us to focus on metabolites that are more intrinsically distinct between cell types, rather than those that are culture condition induced [9].
Our CE-TOFMS based platform enabled observation of 236 metabolomic features (131 cationic metabolites were analyzed with a commercial cation electrophoresis buffer and 105 anionic metabolites). The relative abundance of metabolites for each cell population was then quantified by comparing the integrated area of each feature. While the global metabolic signature of fully reprogrammed iPSCs was relatively close to that of the hESC control (89% similarity), the metabolome signatures of partially reprogrammed iPSCs in the same defined conditions were significantly different from those of hESCs (74% similarity) (Supplementary Tables S1 and S2).
We performed principal component analysis (PCA) to develop a visual plot for evaluating differences and consistencies in the metabolite profiles of fibroblasts, partially and fully reprogrammed iPSCs, and hESCs (Fig. 3A). PCA was conducted to compare metabolic composition with two principal components explaining 66.8% of the overall variance of the metabolite profiles: 47.6% and 19.2% for PC1 and PC2, respectively. PCA revealed an obvious separation in metabolite profiles in these cell types. Similar metabolite profiles between cell types indicate that they have closely related metabolic properties and thus cell fate. The principal component (PC) score used for PCA plotting increased for completely different cell types. Our PCA plot indicates that pluripotent stem cells (hESCs and fully reprogrammed hiPSCs) have similar metabolic profiles and cluster in a similar position in the PC1 score plot with a 47.6% proportion of variance. However, their metabolic profiles were distinctively different and clearly separated from partially reprogrammed iPSCs and somatic (fibroblast) cells in the PCA plot. Partially reprogrammed cells were clustered in the PC2 score plot with a variance of 19.2%. Moreover, partially reprogrammed cells display an intermediate metabolic profile that was between the metabolic profiles of pluripotent stem cells and fibroblasts. Urea cycle relating metabolism (GABA and putrescine) and central carbon metabolism (lactic acid and succinic acid) were major contributors to PC1, while the metabolites contributing to PC2 included Gln, creatinine, creatine, citric acid, and nicotinic acid (Fig. 3B). These data demonstrate that different cell types have different metabolomic profiles.

PCA of metabolomic datasets of hESCs, fibroblasts, and partially and fully reprogrammed iPSCs.
Metabolic differences observed between partially and fully reprogrammed iPSCs suggest novel pathways important in somatic cell reprogramming
Our findings demonstrate that the global metabolomic profiles of partially and fully reprogrammed iPSCs are very different. As metabolite differences between these iPSCs may have significant phenotypic consequences or obstacles to the conversion of partial to fully reprogrammed iPSCs, we identified the metabolites that differed between these different developmental cell types. To obtain comprehensive metabolite patterns in our experimental cell groups, 276 metabolites were organized by hierarchical clustering analysis (HCA) (Fig. 4A). HCA revealed four major clusters and an out-group. The four clusters were created based on distinctively expressed metabolites in each cell type, and nonspecific groups of metabolites were clustered as an out-group. Cluster 1 contained metabolites such as citric acid and 4-acetamidobutanoic acid with relatively higher accumulation in partially reprogrammed cells (all metabolites are shown in Supplementary Table S3). Because Cluster 1 contained metabolites involved in the glycolysis pathway (2-phosphoglyceric acid, 3-phosphoglyceric acid, fructose 1,6-diphosphate, 2,3-diphosphoglyceric acid, and glucose 6-phosphate), partially reprogrammed iPSCs may generate energy through oxidative phosphorylation. Cluster 2 was specifically expressed in hESCs, which includes glutathione and pyridoxine (Supplementary Table S4). Cluster 3 includes metabolites such as nicotinamide, gamma-aminobutyric acid (GABA), and lactic acid, which are specifically expressed in fully reprogrammed iPSCs and hESCs and are typical metabolites of pluripotent stem cells (Supplementary Table S5). Metabolites such as spermidine and piperidine from Cluster 4 were specifically expressed in human fibroblasts (Supplementary Table S6). The out-group contained metabolites with undefined accumulation patterns among all subjected samples. In addition, HCA also grouped these samples separately into metabolic status, suggesting that differences in cell metabolite characteristics between partially and fully reprogrammed iPSCs reflect a conversion in metabolic systems during reprogramming.

Hierarchical clustering showing patterns of metabolites from indicated cells.
Discussion
Changes in cell metabolism in somatic cells undergoing iPSC reprogramming and acquisition of new metabolic fates in fully reprogrammed iPSC are likely critical for somatic cell reprogramming (Fig. 4B). Our study used an untargeted approach to globally analyze and directly compare the metabolome of partially and fully reprogrammed hiPSCs. Our results provide potential mechanistic insight into the critical metabolic regulators of cellular reprogramming that may be useful for overcoming iPSC reprogramming barriers.
Our data demonstrate that metabolites involved in cellular respiration and energy production must all first functionally change to acquire a fully reprogrammed hiPSC status resembling the hESC metabolic fate. This suggests an overall correlation between the bioenergetic state of cells and their reprogramming status; partially reprogrammed cells exhibit differences in oxidative:glycolytic energy production ratios compared with fully reprogrammed cells and pluripotent ESCs. Thus, changes in metabolism appear to play a critical role in enabling the reprogramming process to occur and are not simply a consequence of acquiring a pluripotent state [9]. Future studies examining the function of individual metabolites identified in this study to attain a fully reprogrammed iPSC state should help distinguish between these possibilities.
Changes in cell metabolism are important for obtaining pluripotency during the somatic cell reprogramming process [8 –11,22,23]. The transition in metabolism at early stages of the reprogramming process may be necessary to lower the threshold of such barriers to improve reprogramming efficiency, before the cell begins remodeling of epigenetic markers. Control of metabolic transition may be a new method for increasing reprogramming efficiency at early reprogramming stages to obtain high-quality fully reprogrammed cells. For example, our metabolomic analysis revealed that GABA expression was higher in pluripotent stem cells than in partially reprogrammed cells. Although GABA is well known as a neurotransmitter, the specialized role of GABA in pluripotent stem cells is controversial. The GABA-A receptor was shown to regulate ESC proliferation [24]. Activation of GABA-A receptors leads to accumulation of stem cells in S-phase, causing a decrease in cell proliferation. However, it was suggested that H2AX activated by the GABA-A receptor may increase the proliferation of ESCs [25]. GABA may be a useful parameter for distinguishing fully from partially reprogrammed iPSCs. Some metabolic features of pluripotent stem cells are similar to those of cancer cells. This may be because these cells must proliferate rapidly and, thus, require adenosine triphosphate (ATP)/energy to sustain the newly acquired pluripotent state.
Recently, metabolic transitions have been closely linked to cell fate determination, and several studies have shown that a switch from oxidative phosphorylation back to glycolysis is necessary to convert somatic cells to pluripotent cells. Folmes et al. [8] demonstrated that upregulation of glycolytic genes (Glut1, Hxke, and Ldha) precedes the expression of pluripotency markers (Nanog, Oct4, and Sox2) in mouse somatic cell reprogramming, indicating that the switch of metabolism to glycolysis is an early event in mouse somatic cell reprogramming. Panopoulos et al. [9] reported the global metabolite profiles of hiPSCs, ESCs, and fibroblasts and suggested that unsaturated fatty acids and S-adenosyl methionine are necessary for human cell reprogramming. Prigione et al. demonstrated that organelle morphology, mitochondrial biogenesis, mitochondrial DNA content, lactate generation, and the total cellular ATP level in iPSCs were equal to that in hESCs, although mitochondria in iPSC and ESCs exhibiting analogous maturation were different [10]. In contrast to previous studies, we conducted metabolite profiling during human somatic cell reprogramming using separated partially reprogrammed cells. Clarifying the metabolites underlying the reprogramming mechanism may facilitate the generation of fully reprogrammed hiPSCs and development of new reprogramming parameters, as well as improve the understanding of metabolic status during the development process.
Interestingly, Yamanaka factors alone were not sufficient to achieve highly efficient somatic cell reprogramming and resulted in the generation of many partially reprogrammed cells/colonies as side products. Although some inhibitors reportedly enhance somatic cell reprogramming efficiency [11], the partially reprogrammed cells used in this study were TRA1-60-negative and GFP-negative and did not significantly convert to fully reprogrammed cells upon small molecule treatment, even after several passages. Most populations undergoing stochastic reprogramming events remain in a stable intermediary reprogrammed state with similar genetic and epigenetic features to somatic cells [3,26]. Only a small fraction of these cells become completely reprogrammed iPSCs with a unique metabolomic profile that is more similar to that of hESCs. Further investigation of the intermediate partially reprogrammed cell state, as well as metabolomic profile, will clarify the reprogramming process.
Footnotes
Acknowledgments
These studies were supported by the Basic Science Research Program through the National Research Foundation of Korea (NRF-2015R1A6A1A03032522 and 2016R1D1A1B03931605) and Global Research Development Center (NRF-2016K1A4A3914725) funded by the Ministry of Education and were supported by the Functional Districts of the Science Belt support program, Ministry of Science, ICT and Future Planning (grant no.: 2015K000278), and grant (715003071HD120) from the Research Center for Production Management and Technical Development for High Quality Livestock Products through Agriculture, Ministry of Agriculture, Food and Rural Affairs. Special thanks to STEMOPIA.
Author Disclosure Statement
No competing financial interests exist.
References
Supplementary Material
Please find the following supplemental material available below.
For Open Access articles published under a Creative Commons License, all supplemental material carries the same license as the article it is associated with.
For non-Open Access articles published, all supplemental material carries a non-exclusive license, and permission requests for re-use of supplemental material or any part of supplemental material shall be sent directly to the copyright owner as specified in the copyright notice associated with the article.