
Abstract
Tumorigenic cells can be redirected to adopt a normal phenotype when transplanted into cleared mammary fat pads of juvenile female mice in specific ratios with normal epithelial cells. The redirected tumorigenic cells enter stem cell niches and provide progeny that differentiate into all mammary epithelial subtypes. We have developed an in vitro model that mimics the in vivo phenomenon. The shift in phenotype to redirection should be accomplished through a return to a normal gene expression state. To measure this shift, we interrogated the transcriptome of various in vitro model states in search for casual genes. For this study, expression of growth factors, cytokines, and their associated receptors was examined. In all, we queried 251 growth factor and cytokine-related genes. We found numerous growth factor and cytokine genes whose expression levels switched from expression levels seen in cancer cells to expression levels observed in normal cells. The comparisons of gene expression between normal mammary epithelial cells, tumor-derived cells, and redirected cancer cells have revealed insight into active and inactive growth factors and cytokines in cancer cell redirection.
Introduction
N
During cancer cell transformation, the genetic profiles of the transforming cells change [10]. In many cases, tumor progression is accompanied by epithelial-to-mesenchymal transition (EMT) [11]. Breast cancers are classified into six main groups based on genetic profiles with additional subgroups being added upon discovery of new genetic profiles. The six main groups are (1) luminal A, (2) luminal B, (3) HER2-enriched, (4) claudin-low, (5) normal-like, and (6) basal-like [12] cancer.
We have developed an in vitro system of cancer cell redirection that employs the 1:50 ratio of cancer cells to normal cells [13]. This in vitro system has been validated as an alternative to the in vivo model. Using our in vitro system of cancer cell redirection, we investigated the genetic profiles of erbB2-overexpressing mammary tumor-derived cells as they undergo the redirection phenomenon. Intracellular signal transduction pathways are pivotal to normal and pathogenic cellular responses. Multiple pathways are involved in such cell responses as proliferation, differentiation, EMT, and apoptosis. We assembled a list of growth factors and cytokines, their respective receptors, and significant downstream signaling mediators involved in normal and tumorigenic processes in the mouse mammary gland. These include the epidermal growth factor (EGF), fibroblast growth factor (FGF), Hedgehog, Notch, transforming growth factor (TGF)-β, and Wnt families of growth factors, as well as select cytokines and chemokines. In this study, we document the changes in gene expression between normal, cancer, and redirected mammary cells in regard to expression of growth factors, cytokines, and their respective receptors.
Materials and Methods
Cell culture
Establishment of MMTV-neu cell lines and lentiviral transfections are described elsewhere [13]. MMTV-neu cells were maintained in DMEM (ATCC; Manassas, VA) supplemented with 10% FBS (Atlanta Biologics, Atlanta, GA) and 1% antibiotic/antimycotic (Life Technology, Grand Island, NY). COMMA-D cells were grown in DMEM/F12 (ATCC) with 2% FBS, 0.1 M HEPES (Sigma-Aldrich, St. Louis, MO), 1% antibiotic/antimycotic, 10 μg/mL insulin (Life Technologies), 5 ng/mL EGF (Life Technologies), and 4 μg/mL gentamicin (Life Technologies) added. Cocultures of MMTV-neu and COMMA-D cells were grown in COMMA-D medium. All cultures were grown at 37
Magnetic sorting
The protocol used for magnetic sorting is described elsewhere [6]. Cells were detached by trypsin, washed once with PBS and resuspended in 100 μL of diluent containing primary antibody (1:50; anti-erbB2, Miltenyi Biotec, San Diego, CA), and incubated for 30 min at 4°C. The cells were then washed 2 × 10 min and resuspended in 100 μL of diluent containing biotinylated secondary antibody (1:100) and incubated for 15 min at 4°C. The cells were then washed 2 × 10 min and resuspended in 80:20 μL mix of diluent and antibiotin magnetic beads (Miltenyi Biotec) and incubated for 15 min at 4°C. The cells were then washed 2 × 10 min and resuspended in 500 μL of running buffer and separated through an LS column (Miltenyi Biotec). The positive and depleted fractions were collected. RNA was isolated from the sorted cells.
RNA isolation
Total RNA was isolated from the sorted samples using an RNAqueous Micro kit (Ambion, Austin, TX) that utilizes glass fiber filter column purification. Isolated total RNA was then treated with DNase (Qiagen, Valencia, CA) to remove any DNA contamination. The concentration of RNA was determined using a NanoDrop and the RNA integrity was analyzed with an RNA nanochip on a Bioanalyzer (Agilent Technologies, Santa Clara, CA).
Microarray
A total of eighteen samples (six groups in triplicate) were analyzed with Mouse Gene 1.0 ST Arrays from Affymetrix (Santa Clara, CA). Samples were RMA normalized and log2 gene expression matrices processed using R v3.1.2 and the following Bioconductor [14] v3.1 packages: affy [15], limma [16,17], and oligo [18] according to standard procedures described by Smyth et al. [19]. The experimental design for differential gene expression with limma was CN = c(0,0,0,1,1,1), TR = c(1,1,1,0,0,0). Unless otherwise noted, the significance threshold for differential gene expression was P < 0.001 after Benjamini and Hochberg adjustments for multiple hypothesis testing. The microarray CEL files were deposited in the NCBI GEO database under accession # GSE89963.
qRT-PCR validation
To validate microarray results, we selected three genes: AREG, ERBB2, and THBS1 for qRT-PCR analysis. The housekeeping gene GAPDH was used as a reference gene to normalize the expression of each test gene. Primers used for each gene are listed in Supplementary Table S1(Supplementary Data are available online at
Results
Cells representing normal MECs and cancer cells were cultured in our in vitro model of cancer cell redirection. The COMMA-D cell line was used as normal MECs. The line was established from the mammary epithelium of a mid-pregnant Balb/c female mouse [20]. We also used cell lines established from spontaneously occurring mammary tumors harvested from MMTV-neu transgenic female mice [13]. The tumor-derived cells are referred to as MMTV-neu cells. The MMTV-neu transgenic mouse model has served as an accepted model of human HER2+ breast cancer as the mouse allele of HER2, erbB2, is under the control of the mammary-specific promoter MMTV [21,22]. The two cell lines were grown alone, in 1:1 cocultures, and 1:50 cocultures, where 1 MMTV-neu cancer cell for every 50 COMMA-D cells was seeded. The ratios have been previously established in both in vivo and in vitro models of cancer cell redirection [2 –9,13].
When erbB2/HER2+ cancer cells are used in both the in vivo and in vitro models, cancer cell redirection is determined by attenuation of erbB2/HER2 phosphorylation [6,13]. We have demonstrated that this occurs in the in vitro model within 4 days of coculture [13]. After 4–5 days in culture, the cocultures were sorted based on erbB2 expression and total RNA was collected. Sorting has been used previously to isolate redirected cancer cells from in vivo mammary outgrowths and the in vitro system [6,13]. Redirected erbB2/HER2+ cancer cells continue to overexpress the receptor while the activation is attenuated. Six groups or sorted cell populations were established (Table 1). Group A was MECs, Group B was MMTV-neu cells, Group C was the erbB2-negative fraction from 1:50 cocultures, Group D was the erbB2-negative fraction from 1:1 cocultures, Group E was the erbB2-positive fraction from 1:50 cocultures, and Group F was the erbB2-positive fraction from 1:1 cocultures (Table 1).
RNA samples from each group were analyzed using mouse gene 1.0 ST arrays from Affymetrix in triplicate for a total of 18 transcriptome profiles. All samples in a pairwise comparison were normalized and all genes were analyzed for differential expression (DE) using standard bioconductor methods. Table 2 presents our findings when the different groups were compared with each group individually. When normal epithelial cells and cancer cells were compared directly, comparison AB, we found 9112 genes differentially expressed (P < 0.0001). When the normal cells, Group A, were compared with the other fractions assumed to represent normal cells, Groups C and D, only one gene was found to be differentially expressed (P < 0.0001) in the AC comparison and zero genes differentially expressed in the AD comparison. When the genetic profile of the tumor-derived cells, Group B, was compared with the other group representing cancer cells, Group F, we found 18 genes differentially expressed (DE). When Group B was compared with the redirected cancer cells, Group E, we found 1378 genes DE. Figure 1 illustrates the differences in gene expression between normal and cancer cells (Groups A vs. B) (Fig. 1A) and between normal and redirected cells (Groups A vs. E) (Fig. 1B).
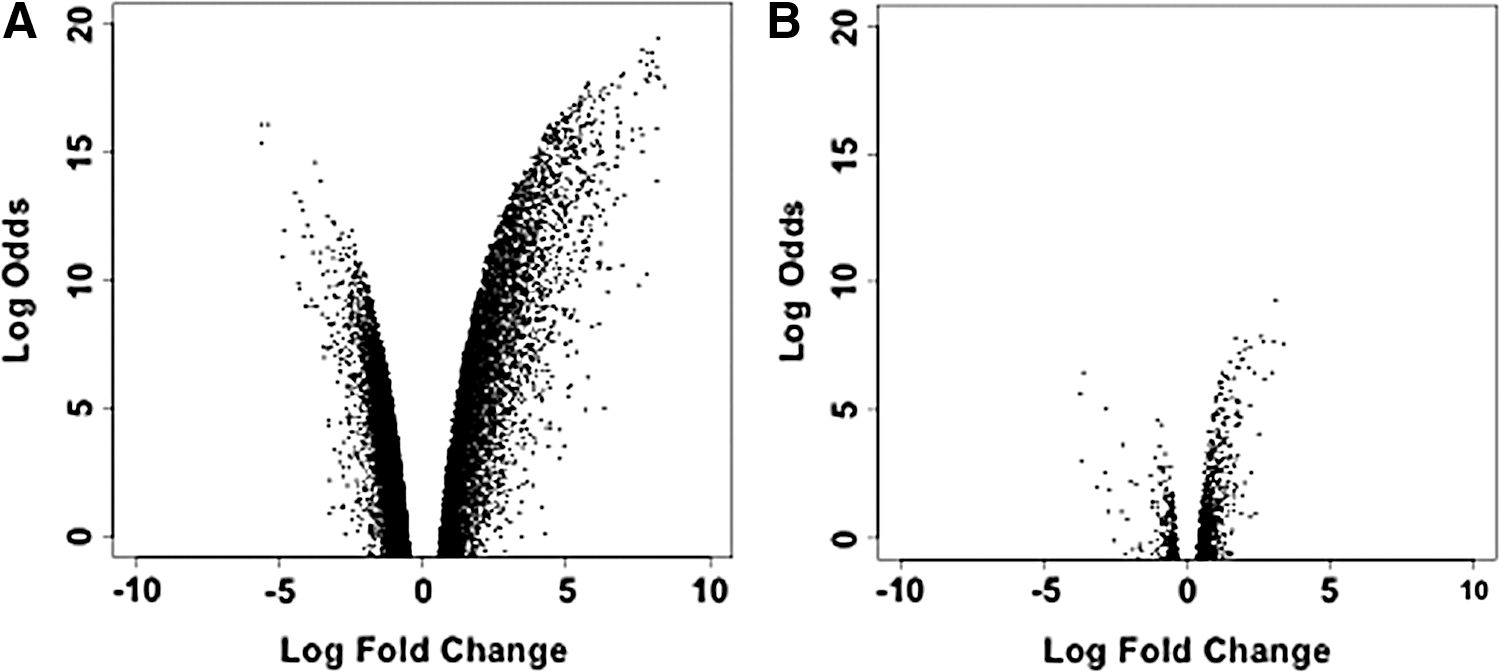
Gene expression volcano plots between tumor, normal, and redirected cell groups. Fold change in expression versus limma-derived significance is shown of
P < 0.0001.
We compiled a list consisting of six growth factor superfamilies and cytokines comprising ligands and respective receptors. The superfamilies were chosen based on functions of the family members during mammary gland development, breast cancer initiation, and breast tumor progression. A total of 251 growth factor, cytokine, and receptor genes were investigated. The genes of the individual ligands and receptors we investigated are listed in Table 3. Of the 251 genes we investigated, we found 110 DE in the comparisons performed between the individual groups (43.8%).
The three profile comparisons we were most interested in were A versus B, A versus F, and B versus E. The first comparison, A versus B, represents normal MECs and cancer cells. The second comparison, A versus F, represents normal MECs and cancer that might be beginning to undergo redirection. The third comparison, B versus E, represents cancer cells and redirected cancer cells. We performed 15 intergroup direct comparisons, but found DE genes from our list in Table 3 in only 5 of the comparisons, A versus B, A versus F, B versus C, B versus E, and C versus F (Table 2).
In all tables, positive fold changes indicate higher expression in the group listed first in the comparison, while negative fold changes indicate higher expression in the group listed second in the comparison.
EGF family
Fifteen of the genes investigated were from the EGF family. The EGF family consists of four receptors and eleven ligands. Each receptor and growth factor has a role in normal mammary gland development and has been implicated in tumorigenesis [23 –25]. EGF family genes were DE in two of the comparisons, A versus B and A versus F (Table 4). In the Group A versus B comparison (normal vs. cancer), only three EGF family genes were found differentially expressed. In the normal group, only the growth factor, neuregulin-2 (NRG2), was found DE, while in the cancer cells, two receptors, EGFR and erbB3, were found to be DE.
Positive numbers indicate higher expression in the first group of the comparison. Negative values indicate higher expression in the second group of the comparison.
Cytokines
The list of cytokine-related genes investigated included 61 ligands and 76 receptors (Table 3). The cytokine group included interleukins (ILs), chemokine ligands (CXCLs), colony-stimulating factors (CSFs), tumor necrosis factors (TNFs), FAS ligand, and associated receptors.
Of the 137 cytokine genes queried, 47 cytokine genes were found DE among 5 comparison groups (Table 5). In the normal MEC versus cancer cell comparison (A vs. B), the chemokines, CXCL3 and CXCL17, and the interleukins, IL1β, IL17A, IL17C, IL19, and IL27, along with TNFSF15 were more highly expressed in Group A. The expression levels of the genes for receptors CSFR2α, IL3Rα, IL11Rα1, and IL20Rβ and the TNF receptors TNFRSF13B, TNFRSF13C, and TNFRSF14 were also higher in Group A. In Group B, CXCL12, CXCL16, CSF1, and IL6 were higher along with the receptors IL4Rα, IL13Rα1, IL17RC, TNFRSF1A, TNFRSF11B, TNFRSF21, and TNFRSF22.
Positive numbers indicate higher expression in the first group of the comparison. Negative values indicate higher expression in the second group of the comparison.
In the Group A versus Group F comparison, we found CSF3, IL13, IL17D, IL25, IL31, and TNFSF11 higher in Group A. Group F saw CXCL12, CXCL16, CSF1, IL6, and IL18 with greater expression. The receptors CSFR1, CSFRα, IL3Rα, IL12Rβ1, and TNFRSF25 were higher in Group A, while IL1R1, IL4Rα, IL13Rα1, IL17RA, IL17RC, TNFRSF1A, TNFRSF11B, TNFRSF21, and TNFRSF23 were expressed to a greater degree in Group F.
The B versus C comparison was similar to the A versus B comparison; both compared normal cells with cancer cells even though in C the normal cells were cultured 50:1 with cancer cells. Expression of the cytokine ligand genes CXCL3, CXCL11, IL1β, IL12, IL17A, IL17C, IL27, and TNFSF15 and receptor genes CSFR2α, IL3Rα, IL10Rα, IL11Rα1, IL11Rα2, IL20Rβ, TNFRSF13B, TNFRSF13C, and TNFRSF25 was higher in normal cell (Group C). The cancer cell (Group B) had higher expression of ligands CSF1, CXCL12, CXCL16, and IL6 and receptors IL10Rβ, IL13Rα1, TNFRSF1A, TNFRSF11B, and TNFRSF22.
When tumor-derived cells were compared with the redirected cancer cells, Group B versus Group E, we found CXCL12, IL6, IL13Rα1, and TNFRSF1A higher in the tumor-derived cells. No cytokine genes were found upregulated in the redirected cells.
The C versus F cytokine comparison also resembled the A versus B comparison. IL12A, IL13, IL17A, IL17F, IL31, IL9R, and IL20Rβ were higher in the normal fraction C, while CSF1, CXCL12, CXCL16, IL6, IL13Rα1, IL17RA, and IL17RC expression was higher in the cancer cell faction F. The striking difference between A versus B and C versus F is the lack of TNFSF genes DE in the C versus F comparison.
FGF family
The FGF family consists of 23 proteins and 4 receptors (FGFRs) and 1 FGF-like receptor (FGFRL1) [26,27] for a total of 28 FGF family genes investigated. In the A versus B evaluation, expression of three FGFs (FGF1, FGF9, and FGF15) was higher in A and expression of two receptors (FGFR1 and FGFRL1) was higher in B (Table 6). The A versus F comparison saw FGF3, FGF4, FGF15, and FGF22 higher in A with FGFR1, FGFR2, and FGFRL1 higher in F. The ligands FGF3, FGF4, FGF5, FGF8, FGF9, FGF12, FGF14, FGF15, FGF16, and FGF21 were DE in C in the B versus C set, while FGFR1 was higher in B. FGFR1 was the only DE gene in B versus E. In C versus F, FGF3, FGF5, FGF8, FGF12, and FGF22 were higher in C, while FGFR1, FGFR2, and FGFRL1 were higher in F. In the comparisons made, the growth factors had higher expression in the fractions comprising normal cells (A and F), while the receptors were expressed at higher levels in the cancer cell fractions (B and F).
Positive numbers indicate higher expression in the first group of the comparison. Negative values indicate higher expression in the second group of the comparison.
Hedgehog genes
We investigated six total genes of the Hedgehog (HH) family (three ligands and three receptors) (Table 7) [28]. Four of the six HH genes were found DE between groups. In A versus B, IHH, SHH, and PTCH2 were higher in A, while SMO was up in B. IHH and PTCH2 were higher in A with SMO up in F in the A versus F evaluation. B versus C was identical to A versus B where IHH, SHH, and PTCH2 are up in normal cells, while SMO is higher in the cancer cells. SMO had higher expression in cancer cell compared with the redirected cancer cells in B versus E. PTCH2 was the only HH gene found DE in C versus F.
Positive numbers indicate higher expression in the first group of the comparison. Negative values indicate higher expression in the second group of the comparison.
Notch-related genes
Nine genes associated with the Notch family (five ligands and four receptors) [29] were queried in our datasets and six were DE between groups. DLL3 and Notch4 had higher expression in Group A when compared with Group B, while DLL1, Jag1, and Notch2 were higher in B in the same query (Table 8). In A versus F, Notch4 was up in A with DLL1 and Notch2 elevated in F. In B versus C, we found DLL4 and Notch4 higher in the normal cells and Jag1 and Notch2 up in the cancer cells. Only Notch2 was DE in B versus E (higher in B). In C versus F, Jag1 and Notch2 were higher in F, while Notch4 was higher in C. Notch2 expression was consistently higher in cancer cell fractions in all comparisons.
Positive numbers indicate higher expression in the first group of the comparison. Negative values indicate higher expression in the second group of the comparison.
TGFβ family genes
Seventeen ligands and seven receptors from the TGFβ superfamily were included in our analysis [30]. In normal cells, BMP3, BMP7, BMP8B, and Nodal expression was higher, while in cancer cells, BMP1, TGFB2, TGFB3, TGFBR1, TGFBR2, and TGFBR3 expression was higher in A versus B (Table 9). In A versus F BMP3, BMP7, BMP8B, and Nodal were up in A, while BMP1, BMPRα1, BMPR2, and TGFBR1 were up in F. The B versus C query showed that no TGFβ genes were higher in C than B, although expression of BMP1, TGFβ2, TGFβ3, BMPR2, TGFβR2, and TGFβR3 was higher in C than B. Only BMP1 was DE in the B versus E comparison, up in B. In the C versus F data comparison, BMP3, BMP8B, and Nodal expression was up in C, while BMP1, BMPR2, TGFβR1, and TGFβR2 were elevated in F. BMP1 expression was elevated in cancer cells in all evaluations.
Positive numbers indicate higher expression in the first group of the comparison. Negative values indicate higher expression in the second group of the comparison.
Wnt-associated genes
Thirty-two Wnt ligands and receptors, plus β-catenin, were included in our queries [31]. The canonical Wnt pathway gene β-catenin gene CTNNB1 was found to have elevated expression levels in the cancer cells in all comparisons. In the A versus B comparison, FZD3, FZD10, Wnt1, Wnt3A, Wnt6, Wnt7A, Wnt9A, Wnt9B, and Wnt10B were higher in A, while FZD1, FZD6, and FZD7 were higher in B (Table 10). Similar expression pattern was found in A versus F where FZD3, FZD9, FZD10, Wnt3A, Wnt6, Wnt7A, Wnt8A, Wnt9A, Wnt9B, and Wnt16 were higher in A, while FZD1, FZD6, and FZD7 were higher in F. The cancer cells of Group B had higher expression of FXD6 and FZD7 in the B versus C evaluation, while the normal cells showed higher expression of FZD9, FZD10, Wnt1, Wnt3, Wnt3A, Wnt7A, Wnt8A, Wnt9B, and Wnt10B. In C versus F, FZD9, FZD10, Wnt3A, Wnt6, Wnt9A, and Wnt9B were higher in C, while FZD6 was up in F.
Positive numbers indicate higher expression in the first group of the comparison. Negative values indicate higher expression in the second group of the comparison.
Real-time validation
Three genes were selected for validation. The genes were ErbB2, the EGF family growth factor amphiregulin (AREG), and thrombospondin-1 (THBS1). GAPDH was used as a reference gene to normalize the expression of each test gene. ErbB2 was chosen based on the transgenic nature of the tumor-derived cells and that even during tumor cell redirection expression of the transgene is maintained [6]. AREG is the most common EGF family member expressed during mammary gland development in mice and has been implicated in breast cancer formation and progression [32,33]. THBS1 is an angiogenic factor associated with breast cancer progression that was not DE between any samples [34 –36]. As expected, erbB2 expression was higher in the cancer cell populations (B, E, and F) than the normal cell populations (A, C, and D). No change in THBS1 was noted by real-time PCR.
Discussion
The deterministic power of the normal mammary microenvironment has been demonstrated repeatedly [2 –9]. Normal stem cells originating from other tissues, regardless of sex, assume a mammary phenotype when placed in regenerating mammary microenvironments. Mouse and human cancer cells also assume normal mammary epithelial phenotypes when transplanted in specific ratios into reforming mammary glands. We have recapitulated cancer cell redirection phenomenon in vitro [13].
One advantage of the in vitro redirection model is that it eliminates signals from nonepithelial cell types and focuses only on tumor cell-MEC interactions. Evidence from the in vivo models of tumor cell redirection clearly indicates that it is the epithelial component responsible for cancer cell redirection since when tumor cells are transplanted alone, without any epithelial cells, mammary tumors form. This result demonstrates it is signals originating from epithelial cells and no other components of the mammary microenvironment that are responsible for tumor cell redirection. Adipocytes, fibroblasts, and endothelial cells are present in the mammary fat pad, yet these cells are unable to redirect cancer cells without epithelial cells.
Each of the gene families investigated here has been demonstrated to be involved in normal epithelial mammary development, epithelial homeostasis, and mammary tumor development originating in MECs.
EGF family
Five EGF family genes were DE in two comparisons (Table 4). Expression of four genes was higher in cancer cells compared with normal cells, including the receptors EGFR and erbB3 in both comparisons. EGFR and erbB3 are the preferred dimerization partners of erbB2. ErbB2 is overexpressed in the tumor cells used in these studies. EGFR/erbB2 dimer is a therapeutic target of breast cancer, Lapatinib [37], and the erbB2/erbB3 dimer is known to drive cancer progression [38,39]. The growth factors HB-EGF and EREG were DE in the cancer cells when seeded in equal numbers with MECs. EREG contributes to breast tumorigenesis through regulation of MMP1 [40]. Autocrine HB-EGF expression results in increased formation of invadapodia that is regulated by EGFR, MMP, and MMP9 [41]. NRG2 was the only EGF gene DE in the normal cells when compared directly with the cancer cells. NRG2 is expressed during early mammary gland development [42]. These results suggest that the cancer cells are using EGFR/erbB2 and erbB2/erbB3 heterodimers to drive tumor cell growth, while the normal cells are expressing higher levels of the developmental regulator NRG2. When the cells are mixed, the increasing numbers of normal cells are producing signals that regulate EGFR and erbB3 expression and the tumor cells are inducing reduced expression of NRG2.
Cytokine genes
The cancer cells, even the redirected cancer cells, expressed high levels of the CXCL12, IL6, and IL13Rα1 genes. Expression of IL-6 is elevated in breast tumors of epithelial origin [43] and correlates with poor patient outcomes [44]. Anti-IL-6 therapy is currently being explored [45]. CXCL12 induces EMT through activation of the canonical Wnt/β-catenin pathway [46]. β-catenin (CTNNB1) expression was also elevated in all erbB2+ cells regardless of redirection (Table 10). There are no published reports for a role of IL13Rα1 in breast cancer. IL13Rα1 is upregulated at the T1-T2 transition stage of bladder cancer [47]. IL-13Rα1 expression is higher in other epithelial cell pathologies, including asthma and COPD [48,49]. While individual cytokines of traditional inflammatory cascades are DE between the groups as a whole, the expression patterns do not match Th1, Th2, Th17, Treg, or Th0 expression patterns.
FGF family
Of the 28 FGF ligand and receptor genes on the microarray, 16 were found DE in various comparisons (Table 6). FGFR1 was highly expressed by erbB2+ cells across all comparisons. FGFR1 is a therapeutic target of metastatic breast cancer [50] and its expression correlates with adverse patient outcomes [51]. FGFR upregulation and accompanying signaling are common in many solid tumors [52]. FGFR1 is upregulated in ∼10% of breast cancers and FGFR2 is upregulated in ∼1% of breast cancers [53]. Both receptors are more highly expressed in erbB2+ cells compared with erbB2− cells in Table 6.
Hedgehog family
Six hedgehog family genes were investigated and we found four DE between the five comparisons. Expression of IHH, SHH, and PTCH2 was higher in normal erbB2− cells, while SMO was elevated in erbB2+ cancer cells. IHH, SHH, and DHH bind to PTCH1 and/or PTCH2 releasing SMO to interact with Gli proteins, resulting in nuclear localization of Gli proteins [54,55]. SMO inhibition leads to suppression of Gli-mediated cancer gene activation. IHH and SHH are present during normal mammary development [56], while elevated levels of SMO are associated with tumor progression [55]. The results presented in Table 7 fit this explanation.
Notch family
The Notch family of signaling proteins regulates normal development, and when expression of the proteins is modified, the Notch family contributes to tumor initiation and progression. Notch 1 and 2 regulate asymmetric division of mammary somatic stem cells [57] and Notch 3 and 4 are present during terminal end bud formation during mammary ductal morphogenesis [58]. Notch2 also regulates self-renewal in cancer stem cells [59]. High level of JAG1 is associated with poor outcomes in breast cancer patients [60]. Our date matches these observations.
TGFβ family
The TGFβ ligands TGFβ2 and 3 and the receptors TGFβR1, 2, and 3 were highly expressed in the cancer cells, but not in normal or redirected cells. Conversely, BMP3, BMP7, BMP8B, and NODAL are highly expressed in normal cells. BMP3 and NODAL regulate expression of embryonic genes and BMP7 and 8B are involved in calcium regulation [61]. TGFβ and BMP ligands and receptors are involved in EMT migration and invasion. Expression of the TGFβ family of genes is changed in the redirected erbB2+ cells to match the normal cell population, with the exception of BMP1. This suggests that the TGFβ pathway is a major force in MMTV-neu-induced cancer formation and progression. When TGFβ1 is overexpressed in parity-identified MECs (PI-MECs), their proliferation potential is reduced and the rate of senescence increases [62]. PI-MECs are mammary progenitor cells and the targets of MMTV-neu-induced transformation [6,63,64]. This suggests a dual role for TGFβ1, as an inducer of proliferation and as an inducer of senescence. This is a well-documented phenomenon of TGFβ1 [65].
Wnt family
The Wnt family of secreted factors and receptors regulates many mammalian cell and tissue functions, including normal development, stem cell function, homeostasis, and (when mutated) cancer initiation and progression [31]. No Wnt ligands or receptors were DE in the cancer cell versus redirected cell B versus E comparison (Table 10), while numerous proteins were DE in the other comparisons made. FZD1, FZD6, and FZD7 are upregulated in breast cancer cells compared with normal breast cells [66 –68]. FZD10 is undetectable in ER+ breast cancer cells, but FZD10 expression is induced in the same cells by estradiol. FZD10 is highly expressed in NT2 carcinoma cells [69]. NT2 cells exhibit differential capacity and are redirected to form mammary cells in our in vivo model [7]. Expression of FZD10 may be a marker for cell plasticity. In all cases of Wnt ligand DE, the normal cells had higher expression of the Wnt ligand. No Wnt ligands were found expressed at higher levels in the cancer cells. The upregulation of β-catenin and several FZD genes suggests that the canonical Wnt pathway is active in the MMTV-neu cancer cells.
No downstream mediators or regulators were included in these analyses with the exception of β-catenin (CTNNB1). To make the analysis manageable, we decided to include only ligands and receptors. Future queries will include genes of signal transduction proteins, transcription factors, and enzymes such as metalloproteinases.
FGFR1, CXCL12, IL6, IL13Rα1, NOTCH2, BMP1, and CTNNB1 (β-catenin) were the only genes DE in all five comparisons. In all cases, the six genes were expressed at higher levels in erbB2+ cells that were not redirected. At present, we have not found a pathway that is inclusive of the seven genes. As we perform more analyses, we hope to generate an inclusive pathway or pathways that will further enhance our understanding of cancer cell redirection.
The impetus of this research was to examine gene expression profiles of normal mammary cells, cancer cells, and redirecting cancer cells with the hope of finding a subset of genes whose expression changes during redirection. These genes could become therapeutic targets with the idea to differentiate the cancer cells, thus rendering them more susceptible to anticancer treatments. The large number of DE genes between normal, cancer, and redirecting cells rendered complexity without a straight path to the redirection genetic mechanisms. However, we have been able to discover genes DE in the cancer cell redirection process.
Not only are mouse mammary tumor-derived cells redirected but also human breast cancer and testicular carcinoma cells have been redirected. Normal nonmammary stem cells from a variety of tissues, including testis, the central nervous system, embryonic stem cells, and bone marrow, have undergone redirection, although in these instances, there is no loss of tumorigenicity, only the differentiation of progeny to mammary cell lineages. Therefore, the idea of redirecting cancer cells into differentiating cells should not be overlooked as merely a single-cell-type phenomenon. Historically, differentiation therapies have not been successful; however, differentiating retinoblastoma with retinoic acid is an example of successful cancer cell differentiation [70,71].
In summary, the comparisons presented here of gene expression between normal MECs, tumor-derived cells, and redirected cancer cells have revealed insight into active and inactive growth factors and cytokines in cancer cell redirection. Future pathway analyses will help define the multiple intracellular mechanisms involved in cancer cell redirection and how they are similar and dissimilar to normal developmental pathways and pathways involved in EMT and MET.
Footnotes
Acknowledgments
The Institute for Biological Interfaces of Engineering of Clemson University provided funding for this project to B.W.B. Research in the laboratory of M.B-A. is supported by the Novartis Research Foundation, the European Research Council, the Swiss National Science Foundation, the Krebsliga Beider Basel, the Swiss Cancer League, the Department of Surgery of the University Hospital of Basel, and the Swiss Initiative for Systems Biology (SystemsX.ch). MM-C is a Marie Curie fellow.
Author Disclosure Statement
All authors declare no competing interests.
References
Supplementary Material
Please find the following supplemental material available below.
For Open Access articles published under a Creative Commons License, all supplemental material carries the same license as the article it is associated with.
For non-Open Access articles published, all supplemental material carries a non-exclusive license, and permission requests for re-use of supplemental material or any part of supplemental material shall be sent directly to the copyright owner as specified in the copyright notice associated with the article.