
Abstract
Nonpluripotent neural progenitor cells (NPCs) derived from the human fetal central nervous system were found to express a number of messenger RNA (mRNA) species associated with pluripotency, such as NANOG, REX1, and OCT4. The expression was restricted to small subpopulations of NPCs. In contrast to pluripotent stem cells, there was no coexpression of the pluripotency-associated genes studied. Although the expression of these genes rapidly declined during the in vitro differentiation of NPCs, we found no evidence that the discrete expression was associated with the markers of multipotent neural stem cells (CD133+/CD24lo), the capacity of sphere formation, or high cell proliferation rates. The rate of cell death among NPCs expressing pluripotency-associated genes was also similar to that of other NPCs. Live cell imaging showed that NANOG- and REX1-expressing NPCs continuously changed morphology, as did the nonexpressing cells. Depletion experiments showed that after the complete removal of the subpopulations of NANOG- and REX1-expressing NPCs, the expression of these genes appeared in other NPCs within a few days. The percentage of NANOG- and REX1-expressing cells returned to that observed before depletion. Our results are best explained by a model in which there is stochastic transient expression of pluripotency-associated genes in proliferating NPCs.
Introduction
N
As a consequence, transplanted pluripotent cells give rise to teratomas containing tumor cells differentiated along ectodermal, endodermal, and mesodermal traits. We previously showed that human fetal spinal cord-derived neural progenitor cells (hscNPCs) that do not give rise to teratomas in any situation tested express messenger RNA (mRNA) of the pluripotency-associated genes NANOG and OCT4, which are otherwise characteristic of pluripotent stem cells [1].
Cultures of hscNPCs are heterogeneous with respect to various phenotypic features depending on the culture conditions. Neurosphere cultures contain small numbers of differentiated neurons and astrocytes in addition to the neural stem cells (NSCs) [2], while adherent cultures are less heterogeneous. Among the NSCs, subpopulations of quiescent cells and actively dividing cells can be identified in vitro, as well as in the adult brain [3].
While more differentiated neural cells can be identified with cell surface markers and sorted prospectively for transplantation studies, this has been more difficult for the most immature cells. NSCs from the fetal human brain have been claimed to display a distinct surface marker profile [4], CD133+/CD24−/lo/CD45−. Among the neural progeny of differentiated human ESCs (hESCs), the CD15+/CD24lo/CD29hi cells are believed to constitute the NSC population [5]. The membrane glycoprotein CD133 is involved in self-renewal, metabolism, differentiation, tumorigenesis, etc. (reviewed in Li [6]), and has been used by several groups as a marker to enrich for NSCs [7 –10]. Based on these findings, a phase II study of the transplantation of NSCs to patients with cervical spinal cord injuries was initiated, but was recently terminated for financial reasons [11].
In the transplantation setting, pluripotent cells are a major safety concern in that they can generate tumor growth as teratomas or even malignant teratocarcinomas [12]. If pluripotent cells are present among the cells intended for transplantation, their number may be too low to generate teratomas in experimental xenotransplantation [13] and other safety assessments, but could nevertheless create problems when applied clinically.
Since pluripotency is defined, in part, by the prospective outcome of a putative differentiation process, it is difficult to reliably visualize truly pluripotent cells. However, to identify pluripotent stem cells, the expression of pluripotency-associated genes, such as NANOG, OCT4, REX1, and SOX2, is commonly evaluated by analyzing the mRNA species [14 –16], reporter genes driven by specific promoters [17], the protein products of the genes with immunohistochemistry [18], or fluorescent transgene fusion proteins [19].
NANOG is widely believed to be the most stringent of all the pluripotency-associated markers [20]. Nevertheless, in the case of iPSCs, NANOG seems to be insufficient as a marker for fully reprogrammed cells [21]. In addition, in ESC cultures, NANOG protein levels undergo slow random fluctuations, giving rise to heterogeneous cell populations without losing pluripotency, but low NANOG expression corresponds to a higher propensity to differentiate. When depleted of NANOG-positive cells by fluorescence-activated cell sorting (FACS), NANOG-negative ESCs revert back to being NANOG positive after 1–2 weeks in culture [22,23]. Together, these results indicate that NANOG, although arguably the most reliable pluripotency marker, is neither specific to pluripotent cells nor sensitive enough to detect all pluripotent cells.
At present, the true potency state of a cell can only be determined retrospectively. Furthermore, some multipotent adult stem cells express pluripotency-associated markers, such as human mesenchymal stem cells that express OCT-4, NANOG, SOX-2, and SSEA-4 [24,25]. OCT-4 is also expressed by a subset of adult human [26,27] and murine [28] tissue-specific progenitor cell types and even on terminally differentiated peripheral blood mononuclear cells [29]. We do not know if nonpluripotent cells that express pluripotency-associated genes possess unique features or if this expression signifies a particularly immature subpopulation.
The identity of the most immature NSC subpopulation has been widely discussed in research on heterogeneous NPC cultures [4,30 –32]. If the expression of pluripotency-associated mRNA species in hscNPCs coincides with the phenotypic traits associated with stemness in NPCs, they could be part of a controlled signaling mechanism with an impact on the phenotype of the cells or just the remains of an already-terminated pluripotency signaling pathway. In either case, the expression of pluripotency-associated mRNA species may imply a cell state that is particularly immature yet not pluripotent.
To address these questions, we investigated the features of human NPCs expressing pluripotency-associated genes to determine if they are different from nonexpressing cells. We found that the low average expression of pluripotency-associated genes in cultures of human spinal cord-derived neural progenitor cells (hscNPCs) was due to the high expression of these genes that was restricted to small subpopulations of cells. The phenotype of pluripotency-associated gene-expressing hscNPCs was similar to nonexpressing hscNPCs. Morphologically, all hscNPCs constantly changed shape, extending and withdrawing cell processes. Cell sorting experiments showed that there were no subpopulations that stably expressed these genes. The expression of the pluripotency-associated genes was apparently the result of transient stochastic expression in human NPCs.
Materials and Methods
Tissue and cell culture
Human first trimester subcortical forebrain (fbr) and spinal cord (sc) tissue was obtained from elective routine abortions (gestational age 5.5–9 weeks) with the written informed consent of the pregnant women and in accordance with the ethical permit given by the Regional Ethics Vetting Board (Stockholm, Sweden) [33]. The tissue was carefully homogenized in NS medium [1 × Dulbecco's modified Eagle's medium (DMEM)/F12 (Life Technologies), 1 × N-2 supplement (R&D Systems), 5 mM HEPES (Invitrogen), 0.6% w/v glucose, and 2 μg/mL heparin (Sigma)] with a glass-Teflon homogenizer.
The single-cell suspensions were transferred to NSG medium (NS medium supplemented with 20 ng/mL EGF, 20 ng/mL bFGF, and 10 ng/mL CNTF, all from R&D Systems) at a concentration of 100–200 cells/μL and incubated at 37°C in a humidified atmosphere with 5% CO2 in culture flasks. Fresh medium was added twice a week. When passaged, the neurospheres were mechanically dissociated with TrypLE Express (Invitrogen), and single cells were reseeded in fresh medium every 7–21 days depending on growth rate and sphere size.
Adherent cultures were achieved by passaging neurospheres and seeding single cells on a polyornithine (PO)/laminin-treated surface at a concentration of 15,000–30,000 cells/cm2 and cultivated in NSG medium. The PO (Sigma) was diluted 1:6 in phosphate-buffered saline (PBS), applied for 1 h, removed and allowed to dry for 10 min, and subsequently rinsed 3 × with autoclaved dH2O. Then, 1 μg of laminin-111 (Sigma) per cm2 was added to the PO-treated surface in NSG medium and incubated at 37°C in a humidified atmosphere with 5% CO2 for 24 h before use. The adherent cells were passaged by a method similar to that described for the neurospheres, using TrypLE Express-mediated dissociation from the surface and gentle mechanical trituration.
hESCs were obtained from professor Outi Hovatta, Karolinska Institutet, Karolinska University Hospital (Huddinge, Sweden), in accordance with approval from the Regional Ethics Vetting Board in Stockholm. hESCs were grown on Laminin-521 (BioLamina) in NutriStem hESC XF (Biological Industries) medium and passaged with TrypLE Select (Gibco, Invitrogen) as described elsewhere [34]. All procedures were carried out according to the principles of the Helsinki Declaration.
In vitro differentiation
Cells were plated onto poly-
Lentiviral transduction
Reporter lentiviral constructs for Nanog, Rex-1, and Oct-4 and control viruses with a constitutively active promoter (EF1α; Allele Biotechnology, Inc.) were transduced into newly passaged adherent cell cultures. Polybrene was added at a concentration of 2 μg/mL. A multiplicity of infection (MOI) virus ratio >3 was used, which typically yielded >95% transduction efficiency in control experiments with control viruses without a detrimental effect on cell survival or proliferation. The viruses and polybrene were removed by extensive rinsing with NSG medium after 24 h and subsequent passaging.
Reverse transcriptase-PCR
RNA was extracted using the Qiagen RNeasy Mini Kit (Qiagen) according to the manufacturer's protocol. Cells were homogenized by passage through a 20-gauge needle in lysis buffer 10 times. Then, 100 ng of RNA was used for complementary DNA (cDNA) synthesis (SuperScript III First Strand Kit; Invitrogen) using target-specific reverse primers. The cDNA sequences were obtained from GenBank. The primers were designed using Vector NTI and Primer3 software to span exon–exon boundaries and were checked for sequence homologies using NCBI BLAST (Table 1).
The reverse transcription reactions were performed at 55°C (NANOG, OCT4, DNMT3B, CRIPTO), 50°C (GDF3, GAPDH), or 51°C (REX1). The polymerase chain reaction (PCR) was performed with Stratagene Paq5000 DNA polymerase. The products were run on agarose gels, and single bands were obtained, cut out, purified using the QIAquick Gel Extraction Kit (Qiagen), and sequenced to confirm the identity of the original mRNA. Negative controls included “no template” and “no reverse transcriptase” samples.
Quantitative PCR
For total RNA extraction, FACS cells were homogenized in TRIzol by repeated pipetting. Chloroform was added, the samples were centrifuged at 11,900g, and the aqueous phase was obtained. Isopropanol and glycogen were used to precipitate the RNA, which was subsequently washed twice with ice cold 95% EtOH and redissolved in water. Random hexamers were used in the cDNA synthesis step for CD133- and CD24-sorted cells, and oligo-dT primers were used for the sorted reporter cells (SuperScript III First Strand Kit; Invitrogen).
The primers for quantitative PCR (qPCR) were the same as those used for normal RT-PCR with the exception of NANOG, for which a TaqMan assay (Applied Biosystems) was used. The qPCR analysis was performed on a 7500 Fast Real-Time PCR System (Applied Biosystems). The PCR efficiency was evaluated by a dilution series of cDNA from pooled undifferentiated hESCs HS999 and HS980 and was >90% for all primer pairs. Negative controls included “no template” and “no reverse transcriptase” samples.
GAPDH, OCT4, and REX1 were analyzed with SYBR Green chemistry (Roche) with the following amplification profile: 1 cycle of 95°C for 10 min, 40 cycles of alternating 95°C for 15 s, an annealing step at 60°C for 30 s, and an elongation step at 72°C for 45 s followed by a melting curve analysis for specificity control. The TaqMan assay parameters (NANOG) were: 1 cycle of 95°C for 10 min, 40 cycles of alternating 95°C for 15 s, and a combined annealing and elongation step at 60°C for 1 min.
The quantification was performed using the Pfaffl method as described in Bookout et al. [35] using pooled undifferentiated hESCs HS999 and HS980 as a reference sample and GAPDH as a reference gene. Software-generated thresholds and Ct values for each gene were used (7500 Fast System version 2.0.3). The amplification efficiencies were obtained by running a dilution series of hESC mRNA and used to calculate relative fold induction with the formula:
where
Eampt = amplification efficiency for the target gene = PCR efficiency for the target gene +1
Eampr = amplification efficiency for the reference gene = PCR efficiency for the control gene +1
ΔCtt (control-sample) = cycle number at which the signal from the target gene in the control sample reaches the threshold minus the cycle number at which the signal from the target gene in the sample reaches the threshold
ΔCtr (control-sample) = cycle number at which the signal from the reference gene in the control sample reaches the threshold minus the cycle number at which the signal from the reference gene in the sample reaches the threshold. The data analysis was performed with Microsoft Excel. The statistical analysis was performed using the Ct values (in log2 scale).
Fluorescence-activated cell sorting
Cells were dissociated into single-cell suspensions with TrypLE Express as described above. DNase (StemCell Technologies) was added to the cell solution, which was then filtered through a 40-μm cell strainer (BD) to minimize the risk of clogging. The cells were made fluorescent by either the transduction of lentiviral particles or by staining with the following directly conjugated antibodies: mouse IgG1 anti-CD133-PE (Miltenyi Biotec, Bisley, Surrey, UK), mouse IgG2a anti-CD24-PerCP-Cy5.5 (BD), and mouse IgG1 anti-human-CD45-PE (BD). The isotype control antibodies were mouse IgG1-PE (Miltenyi) and mouse IgG2a-PerCP-Cy5.5 (BD). Immunostained cells were incubated for 30 min on ice and washed twice in DMEM (GIBCO) without phenol red supplemented with 2 mM EDTA.
A BD FACSDiva™ I was used for sorting the cells into 96-well plates or tubes depending on the downstream application. PBS was used as the sheath fluid, and a 100-μm nozzle with 20 PSI (pounds per square inch) sheath pressure was chosen for optimal cell survival. Typically, the acquisition rate was 500 cells per second, Purity sort mode was used for CD24/CD133 sorting, and Single Cell sort mode was used for acquisition of reporter-expressing cells. Dead cells and debris were excluded based on SYTOX® Blue (1 μL/mL; Invitrogen) uptake and the FSC-A signal. Doublets were excluded using an FSC-H versus FSC-A dot plot diagonal gate.
Further gates were set based on the analysis of cells stained with the appropriate combinations of directly conjugated isotype controls or untransduced cells. The postsort analysis yielded 85%–95% purity for immunostained cells and 100% purity for transduced, reporter-negative, cells. The positive events among transduced cells were not subjected to postsort analysis because of their low number.
Flow cytometry
Cell suspensions were obtained in a similar manner as for FACS. A BD FACSCalibur™ flow cytometer with CellQuest™ Pro software, version 5.2.1, was used for analysis. At least 1,000 events were analyzed from each sample. Single cells were gated based on forward and side scatter, and events with a relative fluorescence intensity half a logarithmic step higher compared with the untransduced negative control cells were considered positive. Distinguishing between negative and positive events was straightforward due to the mainly binary “on OR off” nature of the reporter gene expression, further discussed below. The spectral overlap between the FL1 (green) and FL2 (orange-red) channels prevented unambiguous detection of double-positive events, which was instead performed using an Olympus inverted fluorescence microscope with cellSens Dimension software.
Fluorescence microscopy
Live and fixed cells were investigated using an inverted Olympus fluorescence microscope with cellSens Dimension software. To evaluate the existence of cells that were double positive for Nanog/Rex-1 and Oct-4/Rex-1 reporters, more than 1,000 fluorescent double-transduced cells from 14 different hscNPC cultures were examined, all of which displayed a fluorescence intensity above background in only one channel. Fixed cells on glass slides were investigated using a Nikon fluorescence microscope with OpenLab software.
Cell observer
Time-lapse fluorescence and phase-contrast images of adherent hscNPCs transduced with Nanog and Rex-1 reporters were obtained with a Zeiss Cell Observer system with a 10 × objective, rendering photos with a 150 × 120 μm surface area ( = 1,388 × 1,040 pixels × 1.1 μm resolution/10 × magnification) containing between ∼10 and 100 cells each. Locations were chosen nonrandomly where live fluorescent cells were present. The image intervals were typically 7.5 min, and the cultures were monitored for 24 h. The image analysis was performed with ImageJ using the LSM Reader plugin and with Adobe Illustrator CC.
Sphere counting
To evaluate the sphere-forming ability of cells both positive and negative for the Nanog reporter, FACS cells that formed spheres in 96-well plates were analyzed with regards to sphere number formation and individual sphere size using an Olympus IMT-2 inverted phase-contrast microscope equipped with an Olympus CMOS camera. Photos were taken of the spheres in eight predetermined positions in each well 6 and 14 days after sorting and analyzed with ImageJ using a custom-written macro (Supplementary Data; Supplementary Data are available online at
Results
NANOG, OCT4, REX1, CRIPTO, GDF3, and DNMT3b mRNAs are all present in NPCs
In our previous study on the neural differentiation of hESCs [1], we reported that several pluripotency-associated genes were expressed at low levels in both differentiated hESCs and hNPCs derived from embryonic and fetal tissue, which by definition are not pluripotent. To investigate this more thoroughly, we first studied the expression of several genes associated with pluripotency, often used as markers of pluripotency in cells such as hESCs and iPSCs. Surprisingly, OCT4, REX1, CRIPTO, GDF3, and DNMT3b mRNAs were all present at levels detectable by RT-PCR in all four cases of hscNPCs (Fig. 1), as well as in the one case of cells derived from human fetal subcortical forebrain that was analyzed. Samples of all PCR products were extracted from gels and sequenced to confirm the specificity of the PCR reaction.
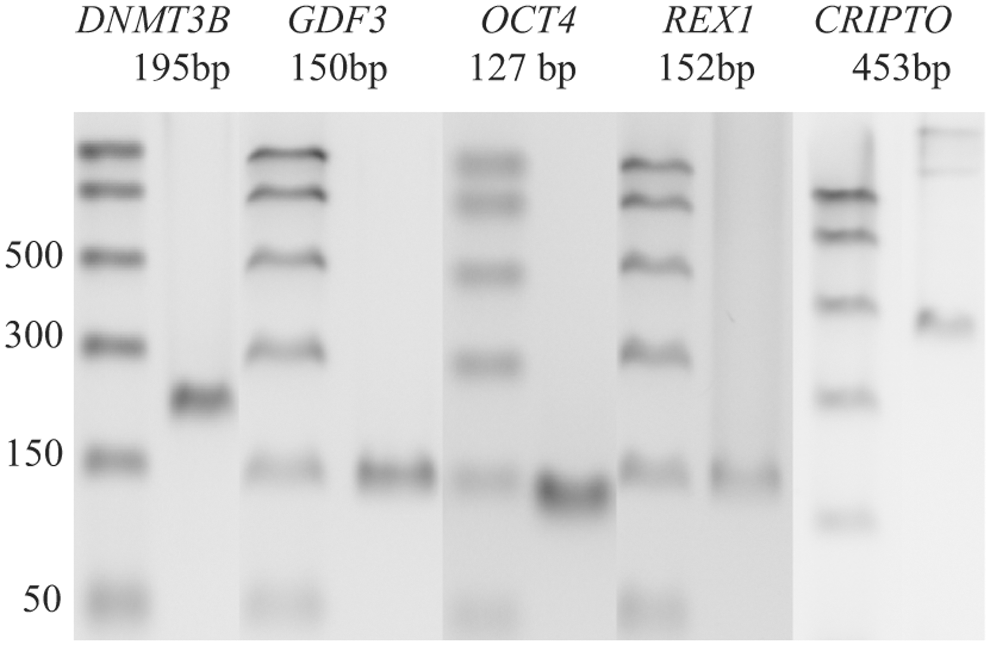
PCR blots of pluripotency-associated gene transcripts in one representative hscNPC case. Ladder on the left. hscNPC, human fetal spinal cord-derived neural progenitor cell; PCR, polymerase chain reaction.
Since NANOG mRNA could not be detected by RT-PCR in our NPCs or in the hESCs that served as a positive control, we decided to instead use a qPCR TaqMan assay. All assays were mRNA specific, spanning at least two exons, and all PCR products were sequenced and submitted to an NCBI BLAST search to confirm the specificity of the assays. Again, using undifferentiated hESCs as control cells and GAPDH as an internal reference gene, REX1, NANOG, and OCT4 mRNA could be detected in hscNPCs and human fetal subcortical forebrain-derived neural progenitor cells (hfbrNPCs), as well as in samples of embryonic-fetal subcortical forebrain.
The levels of all transcripts in the tissues were 20–100 times lower than in hESCs when analyzed with the Pfaffl method. With qPCR, NANOG mRNA was detected in 4/5 hscNPC, 3/3 hfbrNPC, and 6/6 fFbr cases; REX1 mRNA was detected in 3/3 hscNPC, 3/3 hfbrNPC, and 3/5 fFbr cases. OCT4 mRNA was analyzed and detected in 3/3 hscNPC cultures.
Thus, all six pluripotency-associated genes were expressed in human NPCs and in acutely isolated cells from the human fetal forebrain. While the quantification of REX1, NANOG, and OCT4 showed much lower levels of mRNA in tissue than in hESCs, the concentration per cell would be significant if the expression occurred in a small subpopulation of NPCs.
Small subsets of NPCs express but do not coexpress NANOG, OCT4, and REX1
To determine if there were subpopulations of NPCs expressing pluripotency-associated genes, we transduced hscNPCs with lentiviral reporter constructs for REX1, NANOG, and OCT4. Based on the transduction of parallel cultures with a constitutively active promoter and eGFP, the transduction efficiency in hscNPCs was found to be >98%. Our data showed that the three genes were indeed expressed in small subpopulations of hscNPCs. For all reporters, a small fraction (<0.5%) of the transduced cells were distinctly fluorescent. Thirteen out of 19 hscNPC cases contained identifiable NANOG reporter-positive cells. Fourteen of 18 cases contained REX1 reporter-positive cells, and 10/13 contained OCT4 reporter-positive cells.
We confirmed the imaging data with flow cytometry analysis (Fig. 2). Similar to the microscopy results, we found highly specific expression in small subpopulations of hscNPCs. The geometric means and ranges for the nonzero values were 0.06% (0.003%–0.5%) for Rex-1, 0.1% (0.002%–0.4%) for Nanog, and 0.03% (0.003%–0.5%) for Oct-4.
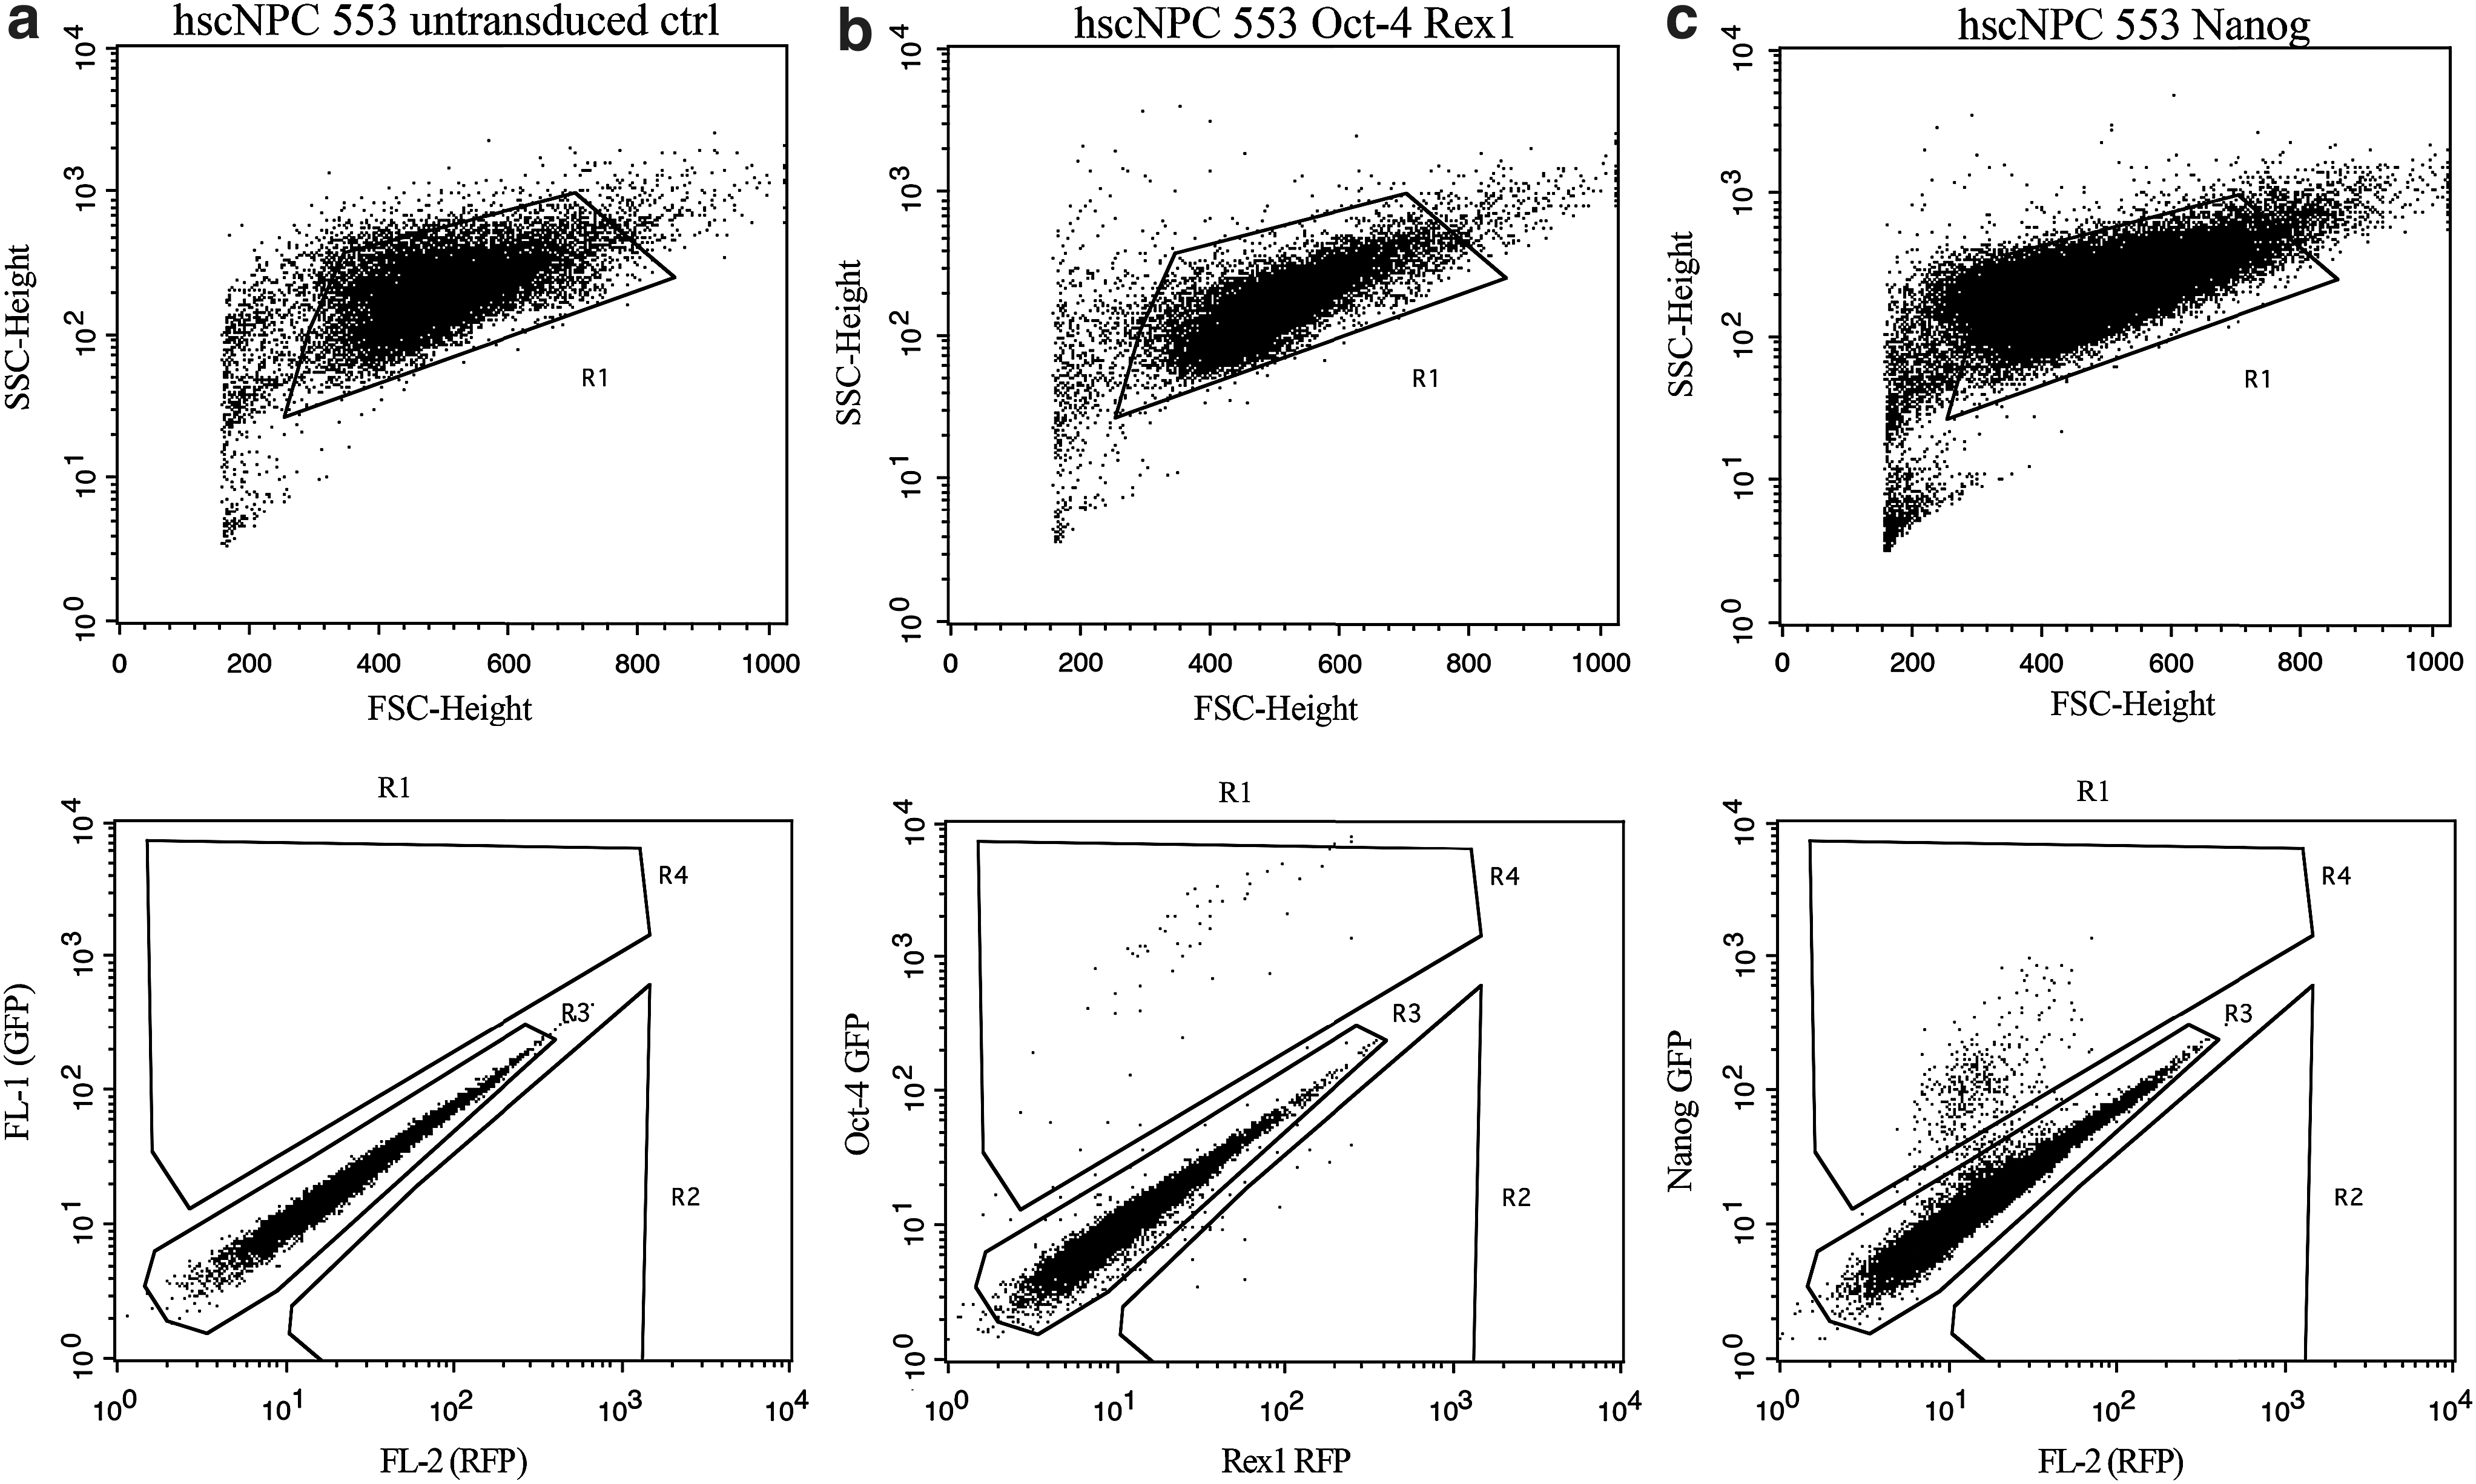
Representative flow cytometry dot plots of a hscNPC case.
To verify that the reporter gene activity accurately reflects gene transcription, we used qPCR to quantify the mRNA in cells both positive and negative for the reporter gene. The fluorescent subpopulations of Nanog, Rex-1, and Oct-4 reporter-transduced cells were isolated with FACS and subjected to qPCR analysis to confirm that the endogenous mRNA of the target genes was present in the fluorescent cells. Undifferentiated untransduced hESCs were used as control cells. The levels of NANOG, REX1, and OCT4 mRNA were two orders of magnitude higher in fluorescent cells than in nonfluorescent cells (n = 2). This confirmed that the reporter gene activity accurately reflected the expression of the corresponding pluripotency-associated genes.
When analyzing cells that were double transduced with combinations of reporter genes for Nanog-Rex-1 or Oct-4-Rex-1, we found that among more than 1,000 reporter-positive cells from eight different hscNPC cases, there were no cells positive for two reporter genes. This suggests that the expression of these pluripotency-associated genes does not indicate the presence of the full transcriptional loop of pluripotency.
In pluripotent cells, the expression of NANOG, REX1, and OCT4 rapidly declines and disappears during differentiation [36]. To determine if similar changes occur in hscNPCs, we differentiated reporter gene-transduced hscNPCs for 14 days in vitro and compared them to undifferentiated hscNPCs. The proportion of Nanog and Rex-1 reporter-positive cells showed a highly significant 70%–90% decrease (Fig. 3), and although we observed a similar decrease in Oct-4 reporter-positive cells, this change was not significant due to the large variation in undifferentiated hscNPCs.
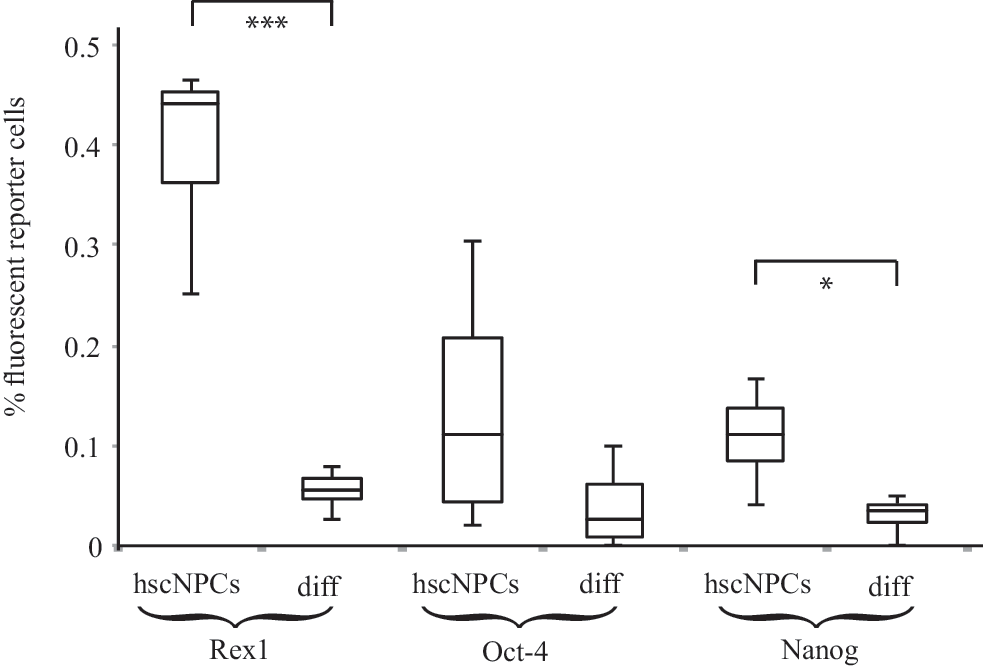
Box plot of flow cytometry data showing the proportion of cells expressing the Nanog, Rex-1, and Oct-4 reporter genes in hscNPC cultures before and after differentiation in vitro. *P < 0.05, ***P < 0.001 paired t-test with Holm-Bonferroni's correction for multiple comparisons. Error bars represent standard deviation. n = 4.
CD133+/CD24lo sphere-forming cells do not contain more NANOG or REX1 mRNA than CD133−/CD24hi cells
After establishing that the expression of pluripotency-associated genes occurred in small subpopulations of hscNPCs, we investigated if these subpopulations had features characteristic of multipotent NSCs. CD133+/CD24lo/−/CD45− cells from the human fetal forebrain constitute a sphere-forming and proliferating subpopulation in vitro, which is suggested to represent multipotent NSCs [4]. CD45 is expressed by leukocytes, which may contaminate the samples of fresh tissue, but are absent from in vitro cultures of hscNPCs at passage 1, so CD45 was omitted in our further analysis.
Using FACS, we first confirmed that CD133+ hscNPCs, as well as CD133+ cells, isolated acutely from human first trimester spinal cord and subcortical forebrain grew significantly faster than unsorted control cells (FACS flow-through), while CD133− cells from spinal cord and subcortical forebrain did not form spheres.
When we analyzed the sorted cells with qPCR, REX1 and NANOG mRNA were found in both CD133+/CD24lo and CD133−/CD24hi hscNPCs and fFbr cells (Fig. 4). The NANOG and REX1 mRNA quantities did not differ significantly between sorted populations, indicating that NANOG and REX1 signaling is not associated with the sphere-forming capacity of hscNPCs. Somewhat surprisingly, the mean NANOG mRNA concentration was actually lower in CD133+/CD24lo hscNPCs, although this difference did not reach statistical significance (P = 0.06) (Fig. 5).
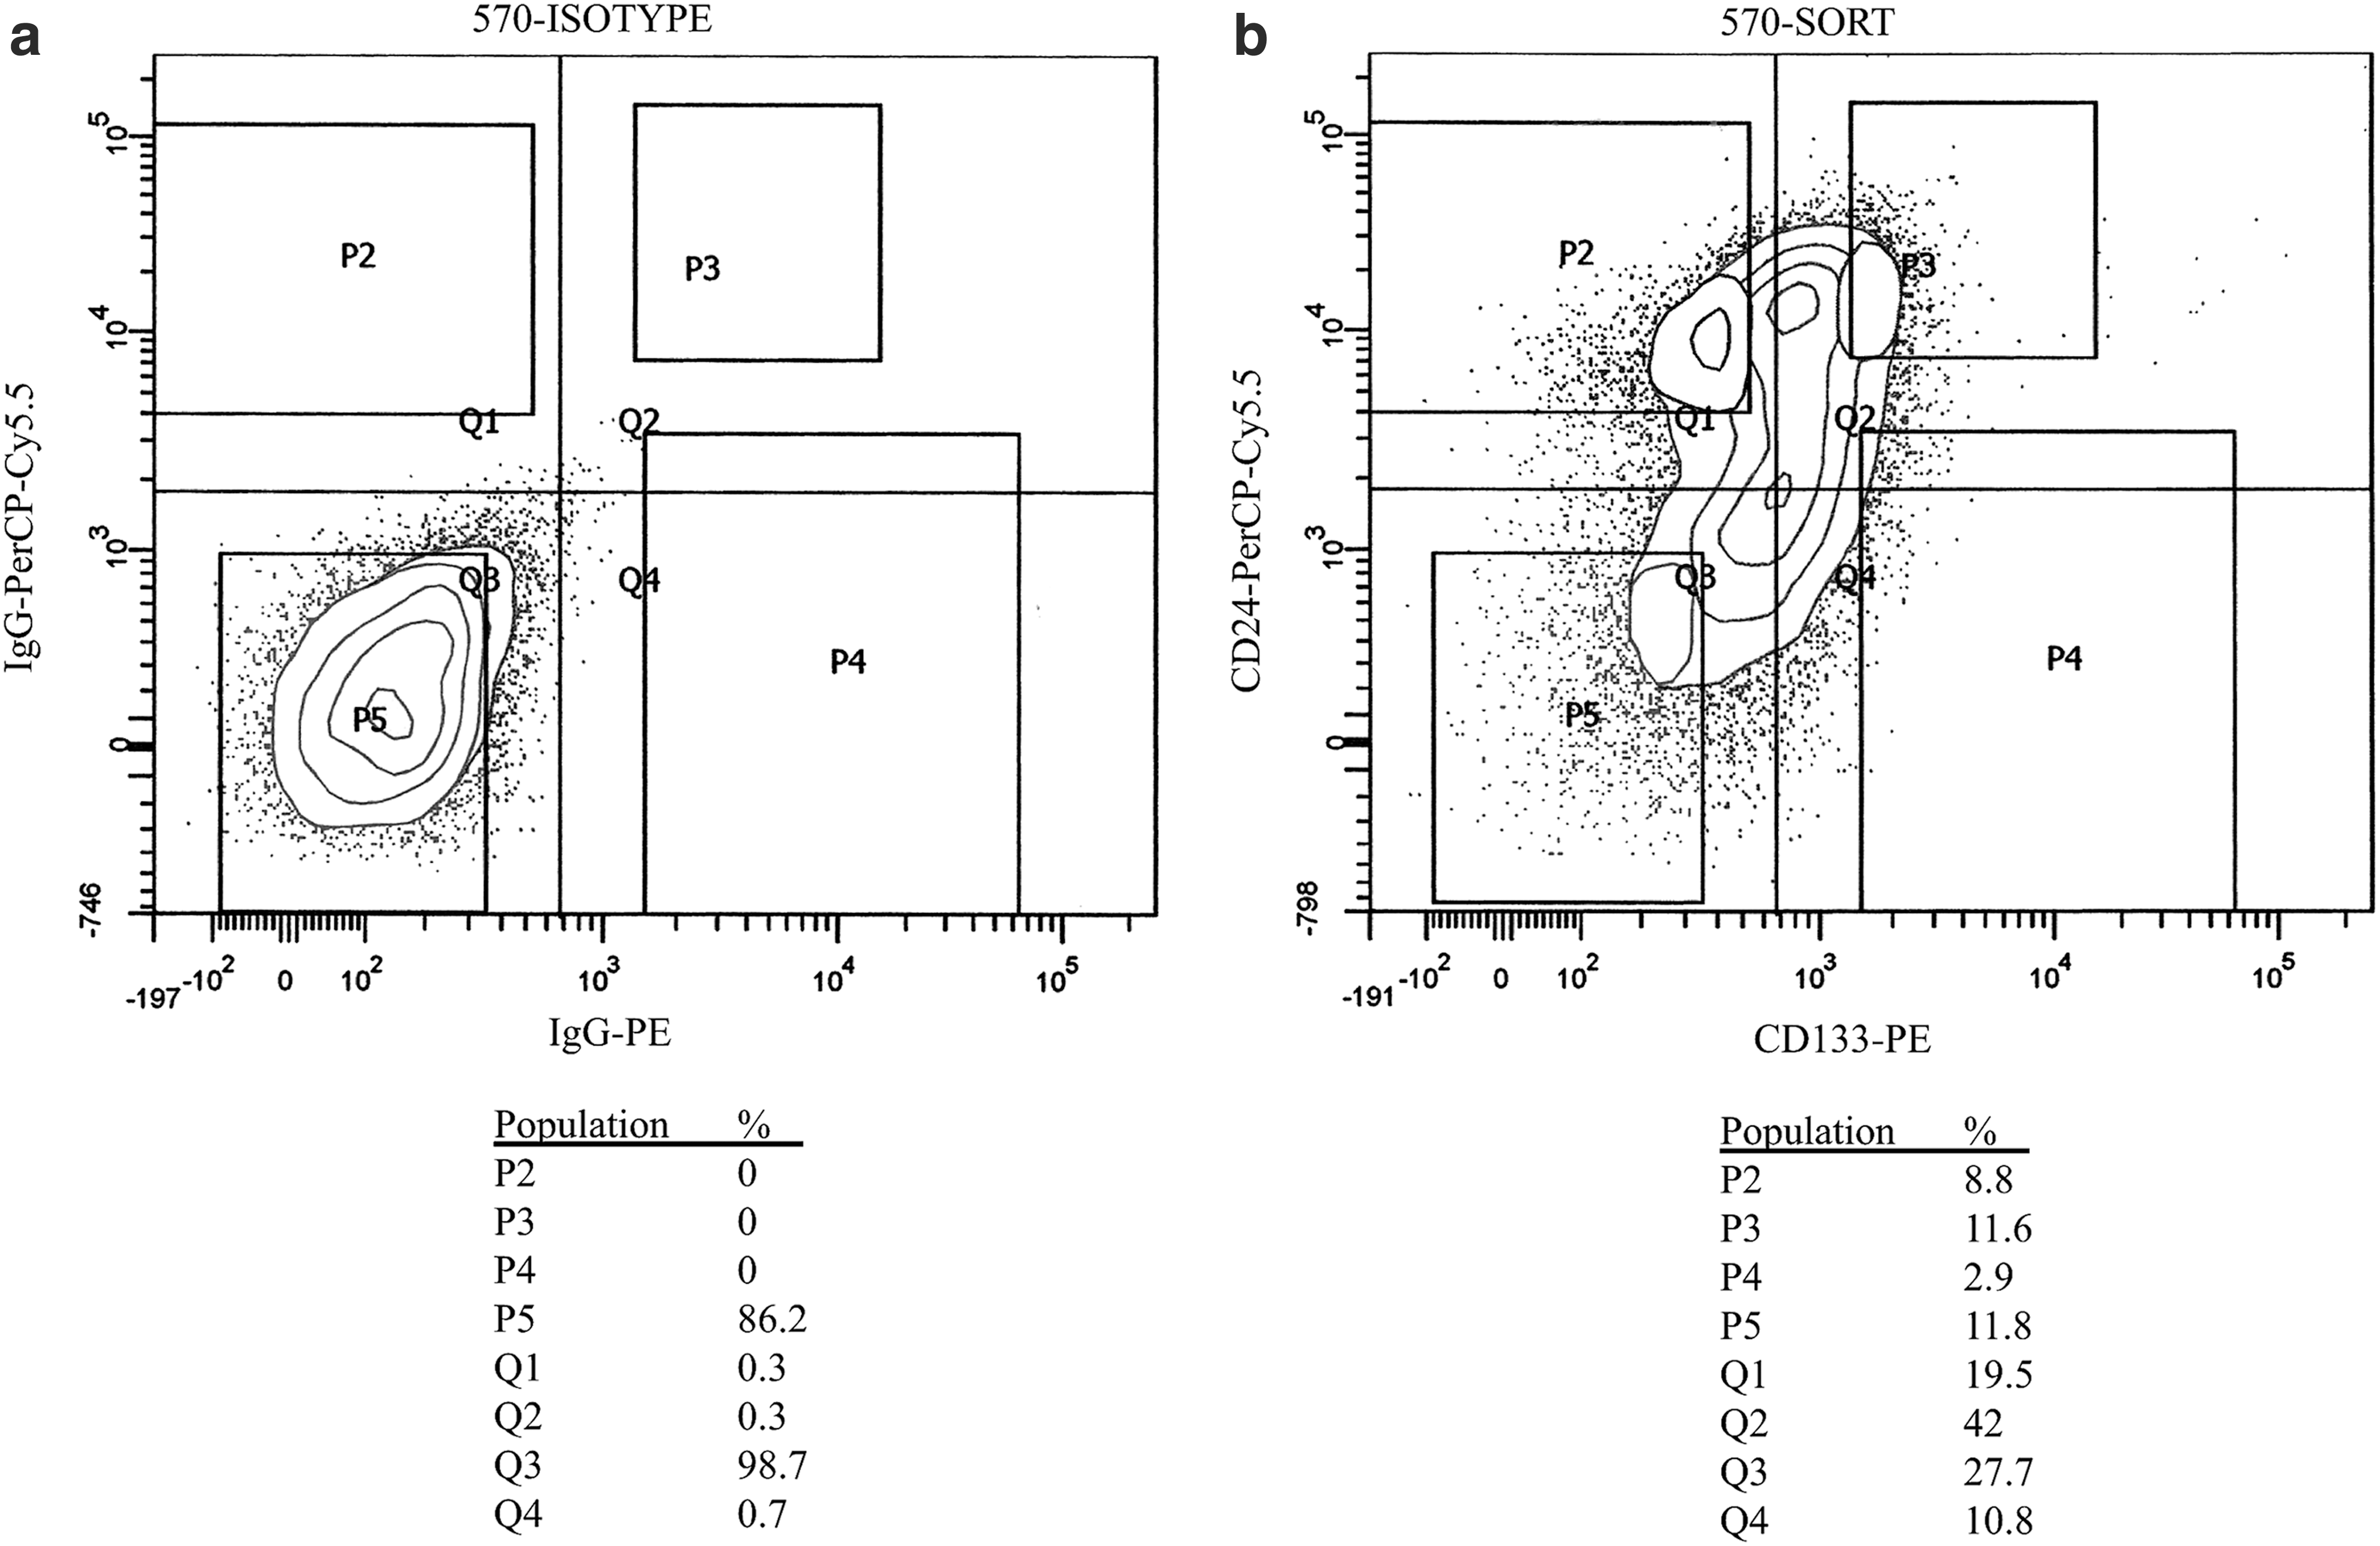
FACS dot plots of a representative hscNPC culture sorted for CD24 and CD133.
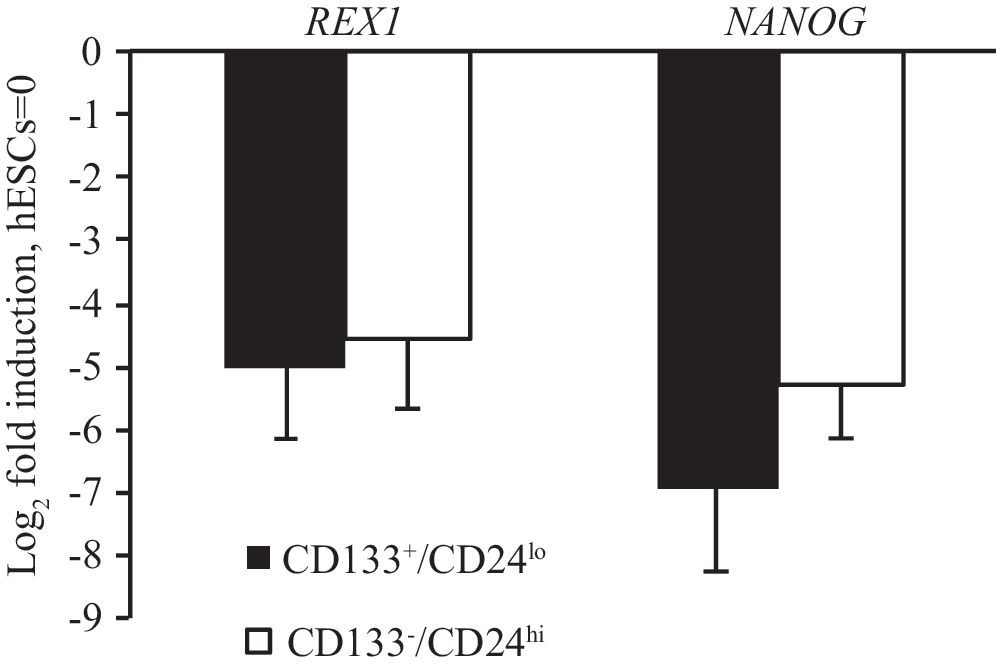
Expression of REX1 and NANOG mRNA in CD133+/CD24lo and CD133−/CD24hi hscNPCs, expressed as fold induction compared to a parallel analysis of hESCs. The P value for the difference between the mean NANOG mRNA concentrations (P = 0.06, pairwise t-test with Holm-Bonferroni's postcorrection for multiple comparisons) was slightly above the preset level for significance. Error bars represent standard deviation. n = 6. hESCs, human embryonic stem cells; mRNA, messenger RNA.
The Nanog or Rex-1 reporter-expressing cells are not required for sphere formation
If hscNPCs that express pluripotency-associated genes were the most immature multipotent NSCs, the selective removal of these cells should eliminate the sphere-forming capacity of the cell population [4,37]. In hscNPC cultures, 50–500 spheres were formed per 10,000 cells, which were similar to the proportion of cells expressing pluripotency markers. We therefore removed all the Nanog and Rex-1 reporter-positive cells from the dissociated hscNPCs using FACS. However, we found that Nanog-/Rex-1-negative hscNPCs gave rise to the same number of spheres as the FACS flow-through control cells (Fig. 6), with the same average sphere size, and the number of cells at passage 14 days later was the same. These data indicate that Nanog- and Rex-1-expressing hscNPCs do not constitute the sphere-forming stem cell population.
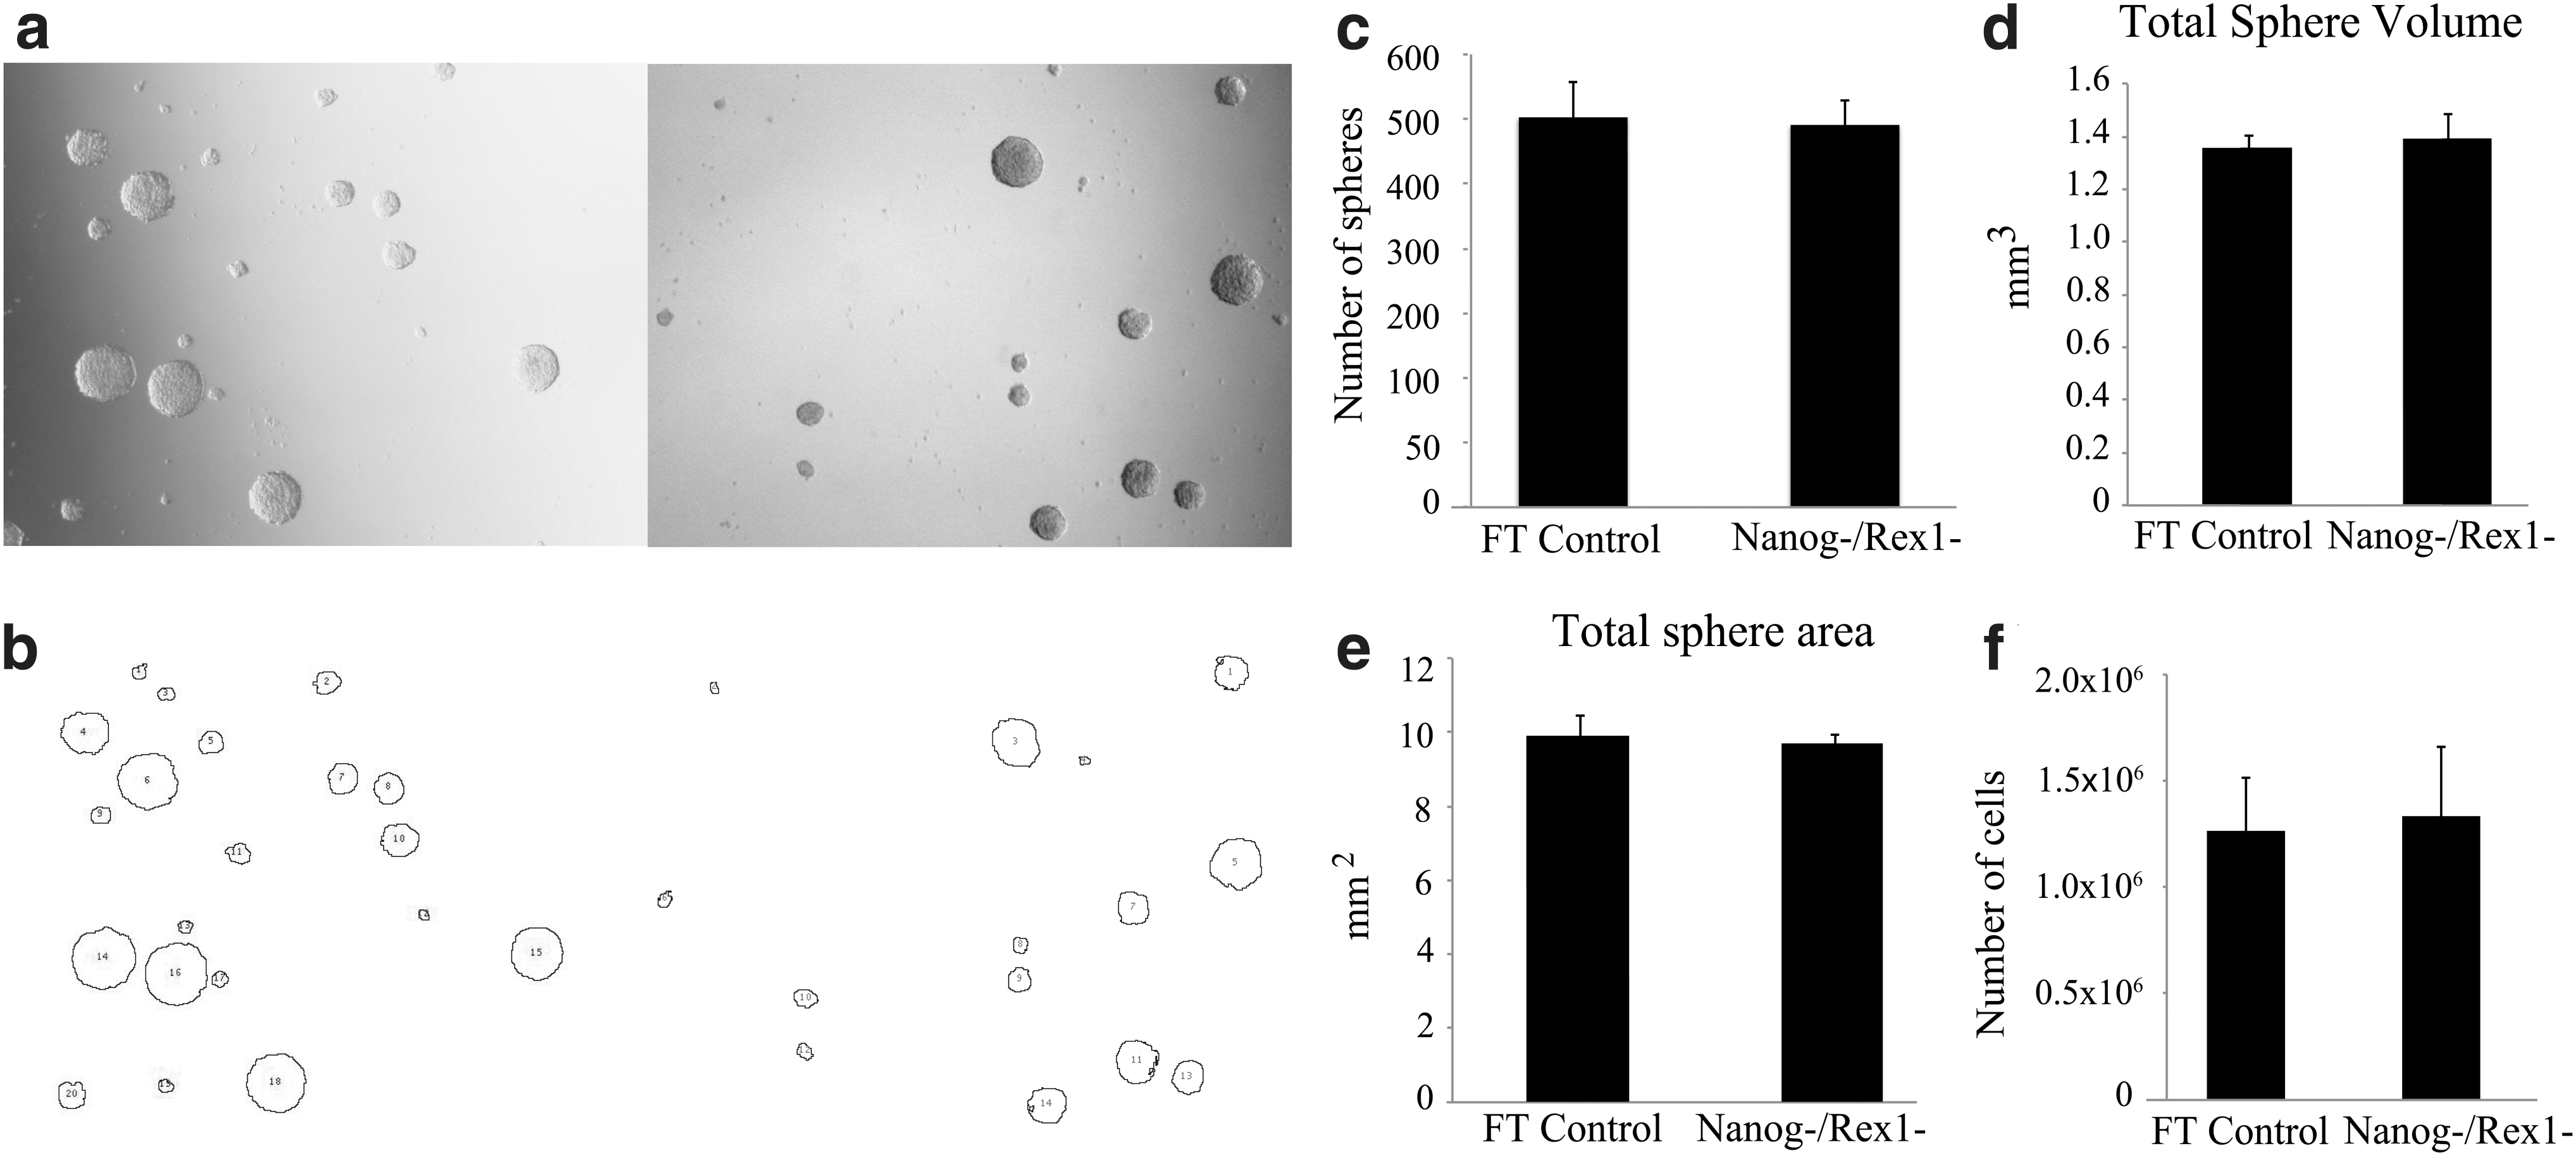
Sphere-forming capacity of hscNPCs with or without the depletion of Nanog and Rex-1 reporter-expressing cells, assessed using an automated image analysis of sphere formation.
A direct analysis of the sphere-forming capacity of isolated Nanog- and Rex-1-expressing hscNPCs was not possible since the plating density we could achieve with the relatively few sorted cells was too low for the survival of all NPCs tested, both as spheres and as adherent cultures. In control experiments titrating the minimum cell density for NPC cultures without reporter genes, ∼1,000 cells/well or more were required for survival after plating in 96-well culture plate. The very strict cell selection we used during cell sorting resulted in considerably lower cell densities.
We then decided to study hscNPC cultures depleted of Nanog- and Rex-1-expressing cells over a period of several weeks to rule out long-term effects on sphere formation. Unexpectedly, cultures of only Nanog-/Rex-1-negative hscNPCs could not be studied over time since Nanog- and Rex-1-positive cells always reappeared in these cultures within a week after these cells had been rigorously eliminated by FACS.
An immediate postsorting analysis confirmed that all Nanog- and Rex-1-positive cells had been removed, but 2–10 days later we found a partial reconstitution of the populations of Nanog- and Rex-1-expressing hscNPCs. After approximately 3 weeks, the percentage of reporter-expressing cells consistently stabilized at the same level as before sorting (and similar to flow-through controls). Thus, the expression of both reporter genes appeared in cells previously lacking the expression of these genes.
Nanog and Rex-1 reporter-expressing and nonexpressing hscNPCs are morphologically and mitotically indistinguishable
Finally, we analyzed the morphology of adherent hscNPCs expressing reporters for pluripotency-associated genes and compared them to nonexpressing hscNPCs in the same cultures. The hscNPCs were morphologically diverse, ranging from small bipolar cells with round soma and short processes to bigger, flat stellar cells with many short protrusions or slim elongated cells with multiple, extensively branched processes. Importantly, all cells continuously switched between these morphological states (Fig. 7 and Supplementary Video S1). We found no differences in the morphology between reporter-positive cells and adjacent reporter-negative cells for any of the reporters. Before the onset of mitosis, hscNPCs retracted their processes and the cell body condensed within 15–30 min to a small spherical cell.
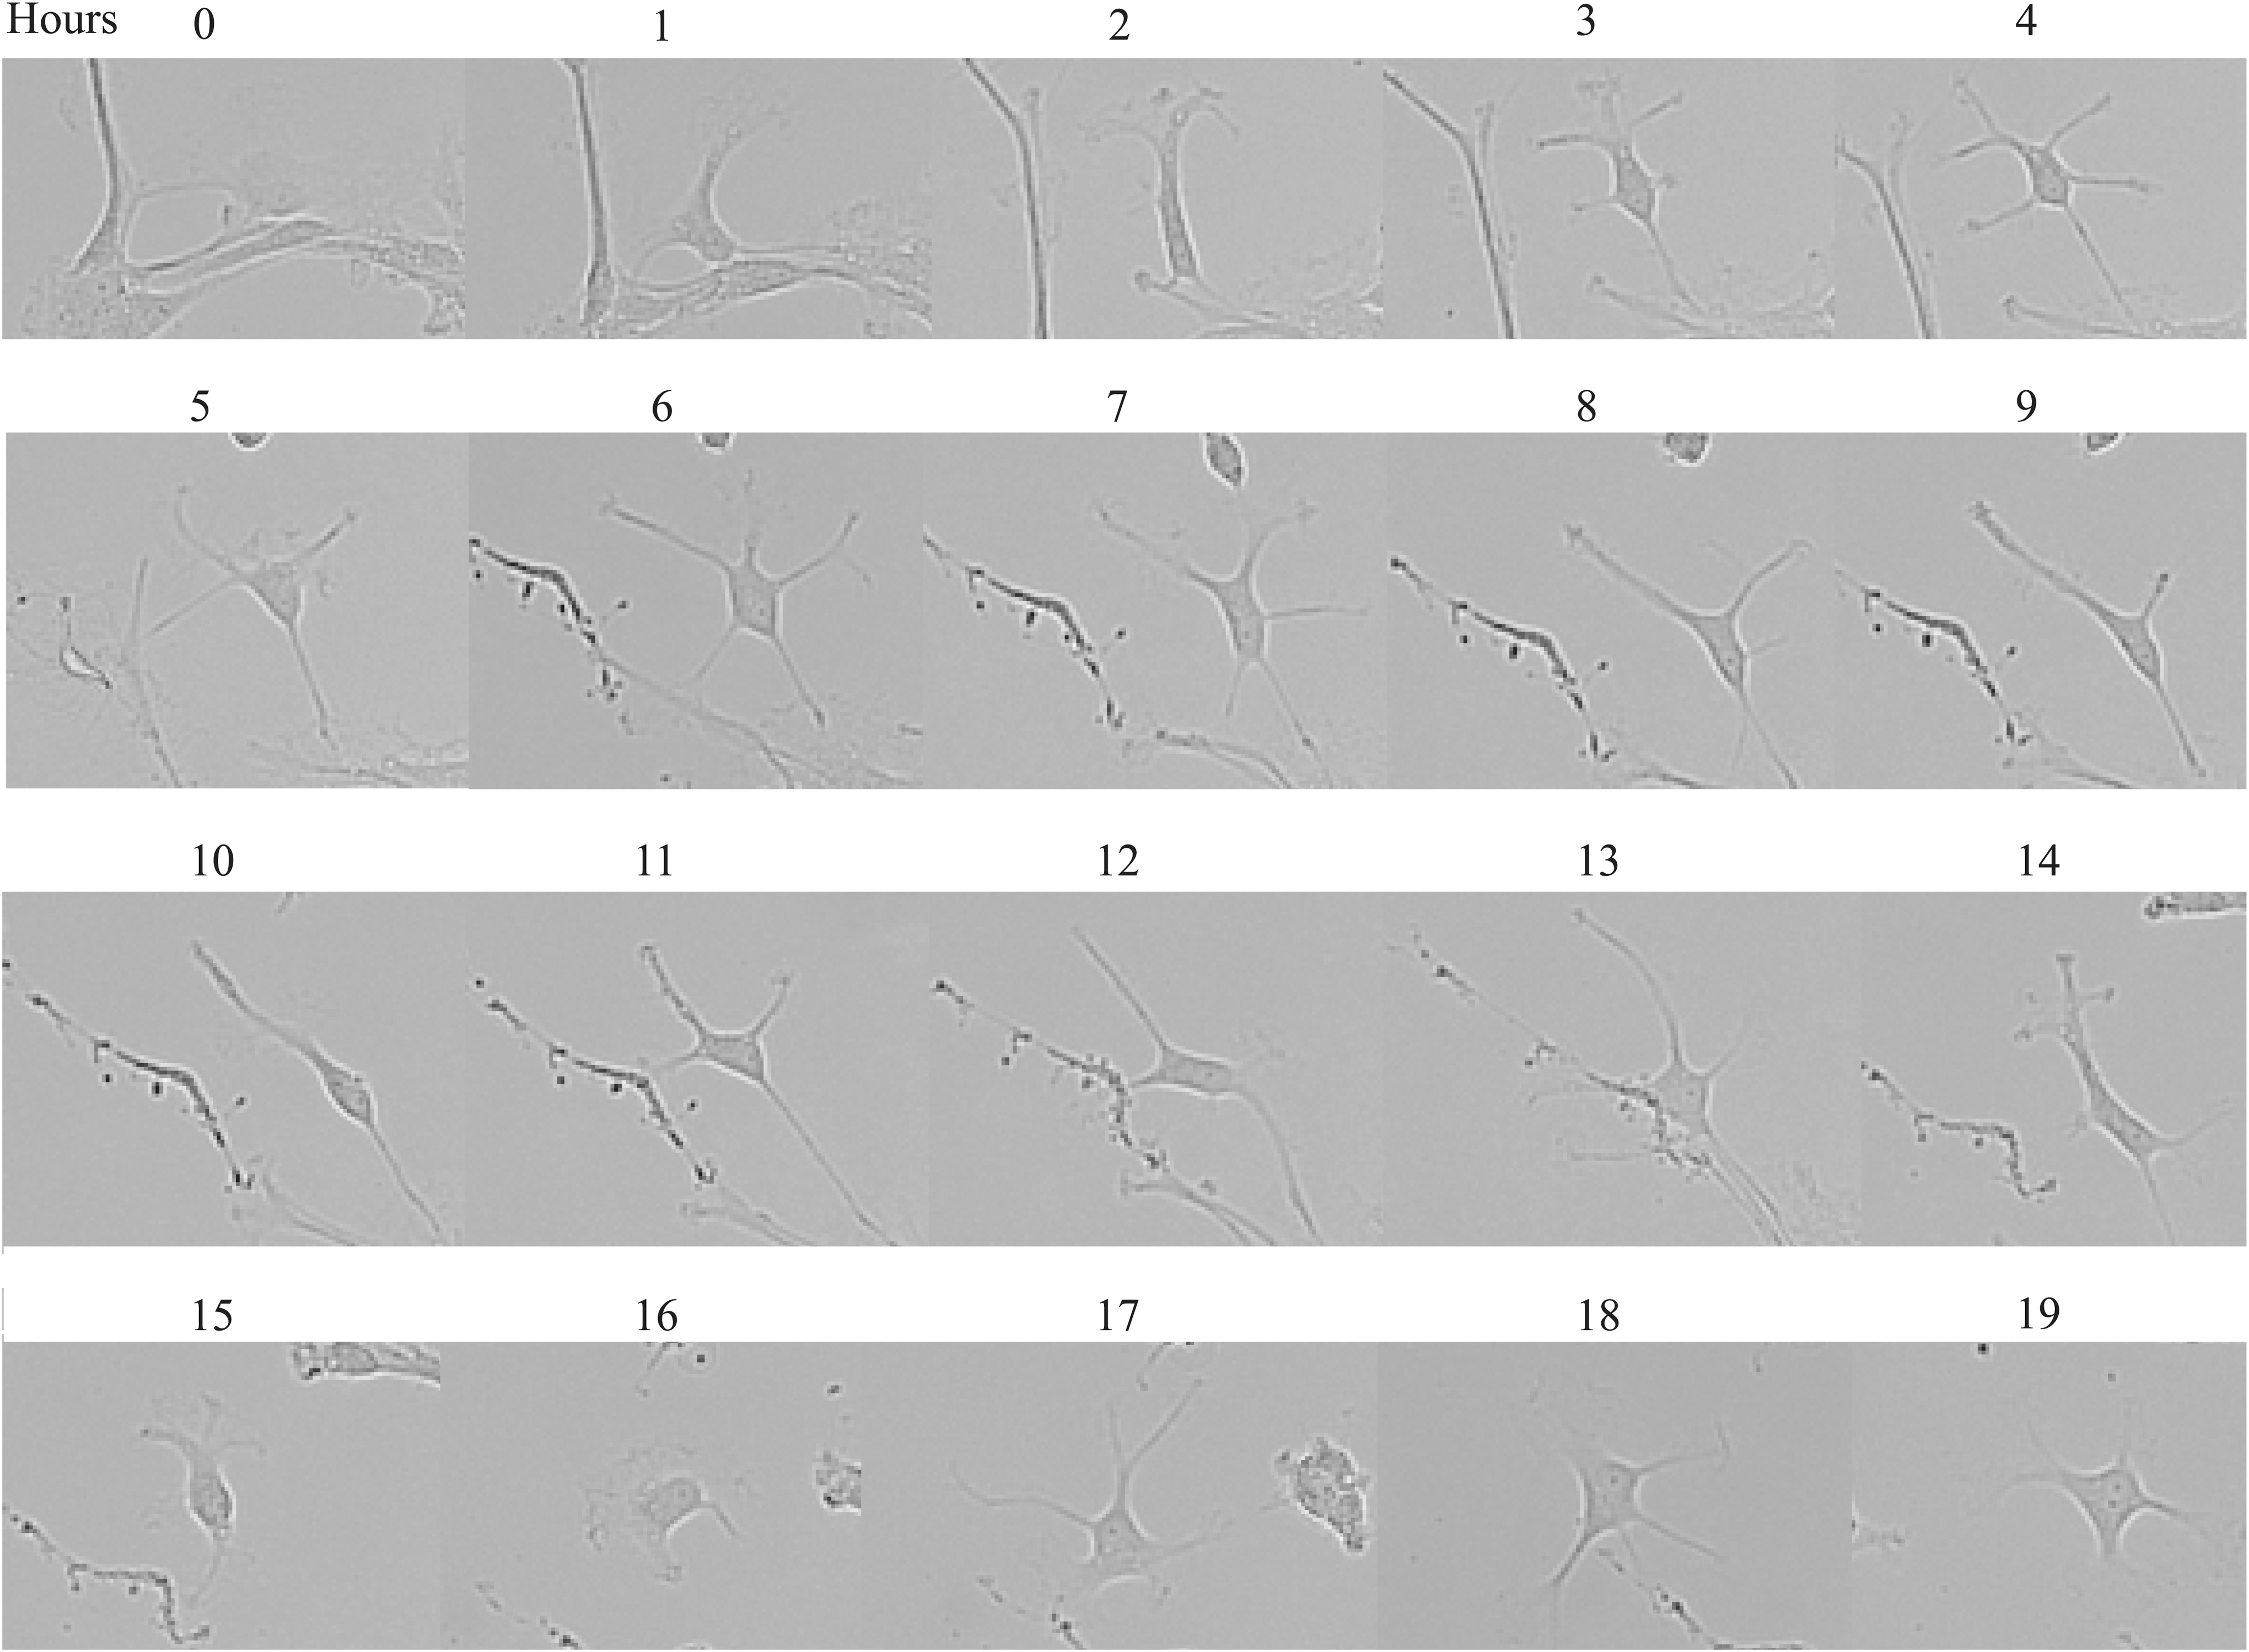
Time-lapse phase-contrast images of an adherent hscNPC changing its morphology from a flat large endothelium-like cell to a cell with multiple distinct neurites to a bipolar cell, back to a flat large cell and again to a cell with distinct neurites over ∼16 h. The time between each image was 1 h (Supplementary Video S1).
The reporter gene fluorescence was not reduced during mitosis, which otherwise could have explained the reappearance of Nanog and Rex-1 reporter expression in cultures depleted of Nanog- and Rex-1-expressing hscNPCs. The progeny of a reporter gene-expressing hscNPC was always positive for the reporter (Fig. 8 and Supplementary Video S2) for up to ∼20 h. Since cells expressing the pluripotency-associated genes could not be cultured in isolation, we analyzed adherent hscNPCs transduced with Nanog and Rex-1 reporter genes using live cell imaging to identify features unique to the hscNPCs expressing these pluripotency-associated genes. Over 24 h, we monitored 412 transduced cells from 3 different cases, of which 73 were Nanog reporter+, 107 were Rex-1 reporter+, and 232 were reporter-/-.

Time-lapse images of two Nanog reporter-positive adherent hscNPCs dividing. The time between images was 7.5–15 min (Supplementary Video S2).
The frequency of cell mitosis was 5%–20% per 24 h, corresponding to a cell doubling time of 4–14 days. There was no significant difference in mitotic frequency between the reporter+ and reporter- cells (P > 0.8), confirming that hscNPCs expressing pluripotency-associated genes did not have a higher (or lower) proliferation rate. Cell death rates varied from 2% to 8% per 24 h between cases, with no significant difference between fluorescent and nonfluorescent cells (P > 0.7).
Discussion
In our previous study on human NPCs [1], we observed that a number of genes related to pluripotency (OCT4, NANOG, GDF3, and DNMT3b) were expressed in hscNPCs [1]. While all these genes gradually disappeared in hESCs during neural induction, they remained high in NPCs relative to differentiating hESCs. In the present study, we used different approaches to analyze the features of hscNPCs that express pluripotency-associated genes.
The majority of hscNPC lines we studied showed expression of NANOG, OCT4, GDF3, and DNMT3b, confirming our previous data. In addition, REX1 and CRIPTO, two other genes associated with pluripotency, were also expressed in these cells. The qPCR analysis showed that the concentrations of NANOG, OCT4, and REX1 mRNA were 15–30 times lower than in hESCs (of which ≈20% express NANOG).
To address the important question whether low levels of these transcripts were present in all hscNPCs or if much higher concentrations were present in small subpopulations of cells with a specific phenotype, we transduced the cells with reporters for these three genes. The results showed that in the hscNPC cultures, a small proportion of the cells were positive for the reporters, and we confirmed that in these few cells, concentrations of transcripts were two orders of magnitude higher than in reporter-negative cells. Importantly, we found no cells with coexpression of REX1 and NANOG or OCT4. This shows that in contrast to hESCs, the core pluripotency gene networks are not active in hscNPCs, in line with the lack of pluripotency of these phenotype-specified cells.
It should be noted that since the half-life of GFP and RFP is much longer (>24 h [38]) than, for example, NANOG mRNA (≈5 h [39]) and the NANOG protein (120 min in hESCs [40]), cells that turn off gene expression will remain fluorescent for some time. This does not have important consequences for the interpretation of our data. However, it will result in an overestimation of the percentage of cells expressing the pluripotency-associated genes. All hscNPC cultures expressed the pluripotency reporter genes in a small proportion of the cells, less than 0.5%. When we compared the mRNA concentrations in hscNPCs and hESCs taking the proportion of expressing cells into account, the concentrations of these mRNA species in hscNPCs were in the same range as in pluripotent hESCs.
If we also considered the longer half-life of the fluorescent reporter, the endogenous levels of the pluripotency-associated genes would be even higher, surpassing those of hESCs. However, in contrast to hESCs, the hscNPCs never coexpressed REX1 and NANOG or OCT4 and NANOG, which is in line with the lack of pluripotency of hscNPCs [1]. Upon the differentiation of pluripotent cells, the expression of genes associated with pluripotency is turned off, with varying kinetics [36]. We found that a similar downregulation occurred during the differentiation of hscNPCs.
Taking these results into account, we hypothesized that although we have not previously been able to demonstrate protein expression of pluripotency-associated genes [1], the hscNPCs expressing mRNA for these genes represent the most immature cells in the heterogeneous hscNPC population, that is, the human multipotent NSCs. To address the hypothesis of pluripotency-associated genes as markers for human multipotent NSCs, we analyzed the expression of NANOG and REX1 in CD133+/CD24lo hscNPCs. This subpopulation is believed to constitute the NSC population [4], although some non-CNS stem cells coexpress CD133 and CD24 [41].
In neurosphere assays, CD133+/CD24lo hscNPCs indeed gave rise to neurospheres that grew significantly faster than flow through control cells, similar to previously published data. However, the concentrations of NANOG and REX1 mRNA were not higher in the assumed NSCs; on the contrary, the mean concentrations of NANOG and REX1 mRNA were actually higher in CD133−/CD24hi hscNPCs, although this difference did not reach statistical significance (P = 0.06).
Further evidence against an association between pluripotency gene expression and the stem cell state of hscNPCs was acquired using NANOG, OCT4, and REX1 reporter genes. The sphere-forming capacity of hscNPCs was not affected by the removal of all cells expressing these reporter genes. The transduction of the reporter genes under the regulation of the proximal promoter of NANOG recapitulates endogenous NANOG expression [17]. We confirmed that the endogenous mRNA levels in reporter gene-positive cells were two orders of magnitude higher compared to nonfluorescent cells, verifying that the expression of the reporter genes we used for the hscNPCs accurately represent the activation of the pluripotency-associated genes.
With the pronounced expression of genes that are critical components of pluripotency gene networks, we expected these hscNPCs to display some unique morphological features. However, when we monitored the morphology of single hscNPCs by live cell imaging over 24 h, we found that all cells, including those expressing the pluripotency-associated genes, continuously changed their morphology. The expression of pluripotency-associated genes was not associated with any apparent features related to morphology, cell proliferation, or cell death.
It is possible that some phenotypic trait, such as the propensity to generate a certain differentiated progeny, correlates with pluripotency gene expression, as has been shown in ES cells [23]. However, it was not possible to culture isolated reporter-positive cells after sorting to allow for analysis of specific features, such as differentiation. The reason for this was that the low frequency of these cells, combined with the low yield inherent to high precision (Single Cell) sort mode FACS, resulted in too low cell densities in the plated cultures. To verify that this indeed was the reason for poor survival, we performed a control titration experiment and found that densities ∼5 times higher than what we achieved are necessary for reliable survival of human NPCs.
Since we could not identify any particular cellular features associated with the expression of pluripotency-associated genes in NPCs, we considered if expression of pluripotency-associated genes in NPCs was a consequence of stochastic transient activation of genes. This hypothesis was confirmed in the long-term follow-up of cell depletion experiments. In all hscNPC cultures rigorously depleted of reporter gene-positive cells, we found that cells expressing the reporter genes gradually reappeared, and by three weeks the proportions of pluripotency gene-expressing hscNPCs were completely reestablished.
Taken together, our results suggest that the expression of pluripotency-associated genes in hscNPCs is not associated with a subpopulation of cells with particular features, but rather occurs in all cells, and that these genes are constantly but randomly turned on and off, although at low frequencies with short on periods. Despite a thorough reanalysis of the live cell imaging data, we did not observe any reporter gene-negative cells switching on expression. However, with only 0.2% of the cells being fluorescent at steady state, applied to a simple two-state Markov model simulation of the gradual repopulation of depleted cell cultures during two weeks, the probability of observing a single cell turning on fluorescence in a field of view with 100 cells is only ∼1:35 in 24 h.
The fact that NPCs that were terminally differentiated contained lower proportions of reporter-positive cells implies that the maturity state of a cell affects the likelihood of expressing pluripotency-associated mRNA. We suggest that the probability for this type of stochastic gene expression declines as heterochromatin increases at the expense of euchromatin upon differentiation [42].
Thus, our results are best explained by transient and uncoordinated periods of pluripotency gene expression in hscNPCs that otherwise are negative for these gene transcripts. There are examples of similar situations in other cell types. Chang et al. showed that the heterogeneous population of hematological progenitor cells was restored 14–16 days after depleting them of either Sca-1-negative or Sca-1-positive cells [43]. Likewise, Gupta et al. demonstrated that a heterogeneous population of breast cancer cells containing three types of cells were restored after isolating any of the cell types [44]. In both studies, a Markov model of interchanging cell states as a result of transcriptome-wide changes could explain the results.
The transient stochastic expression of genes, and its physiological consequences, has been a major focus of gene expression studies and may explain cell heterogeneity. This was suggested to be a naturally occurring strategy to optimize population fitness in a fluctuating environment [45]. Transient expression of REX1 similar to our results has been observed in ESCs, in which expression was associated with specification to a certain phenotype trait [46]. Also in NPCs, oscillating expression of transcription factors such as Hes1 and Ascl1 has been shown to control fate determination [47].
In our study, the pluripotency-associated genes analyzed did not show coordinated expression and were not associated with gross morphological changes. Further studies will show if the expression of other genes changes in concert with the pluripotency-associated genes and if this is associated with a particular phenotype.
Footnotes
Acknowledgments
This study was supported by Craig Hospital Foundation, Stiftelsen Stockholms Sjukhem, the Magnus Bergwall Foundation, and research funds of Karolinska Institutet.
Author Disclosure Statement
No competing financial interests exist.
References
Supplementary Material
Please find the following supplemental material available below.
For Open Access articles published under a Creative Commons License, all supplemental material carries the same license as the article it is associated with.
For non-Open Access articles published, all supplemental material carries a non-exclusive license, and permission requests for re-use of supplemental material or any part of supplemental material shall be sent directly to the copyright owner as specified in the copyright notice associated with the article.